Article

Seasonal Control of Water-Soluble Inorganic Ions in PM2.5 from Nanning, a Subtropical Monsoon Climate City in Southwestern China

1
Jiangxi Province Key Laboratory of the Causes and Control of Atmospheric Pollution, East China University of Technology, Nanchang 330013, China
2
College of Water Resources and Environmental Engineering, East China University of Technology, Nanchang 330013, China
3
School of Resources, Environment and Materials, Guangxi University, Nanning 530004, China
4
State Key Laboratory of Environmental Geochemistry, Institute of Geochemistry, Chinese Academy of Sciences, Guiyang 550002, China
*
Authors to whom correspondence should be addressed.
Atmosphere 2020, 11(1), 5; https://doi.org/10.3390/atmos11010005
Submission received: 16 November 2019 / Revised: 15 December 2019 / Accepted: 16 December 2019 / Published: 19 December 2019
(This article belongs to the Section Aerosols)

Abstract

:
In this study, we measured the daily water-soluble inorganic ions (WSIIs) concentration (including SO42−, NO3, NH4+, Ca2+, K+, Cl, Na+, Mg2+, and F) of PM2.5 (particulate matter with a diameter smaller than 2.5 μm) throughout the year in Nanning (a typical subtropical monsoon climate city in southwestern China) to explore the influence of seasonal climate change on the properties of PM2.5 pollution. This suggested that SO42−, NO3, and NH4+ were the main component of WSIIs in Nanning. Secondary inorganic ions from fossil fuel combustion, agricultural activities, and automobile emissions were the main contributors to PM2.5, contributing more than 60% to PM2.5. Compared with the wet season, the contributions of different sources increased in the dry season (including pollution days); of these sources, automobile emissions and coal combustion emissions increased the most (about nine times and seven times, respectively). Seasonal weather and climate change affected the concentration level of WSIIs. During the wet season, higher temperatures and abundant rainfalls contributed to the volatilization and removal of WSIIs in PM2.5, while in the dry season and on pollution days, lower temperatures and less precipitation, higher emissions, and poor diffusion conditions contributed to the accumulation of WSIIs in PM2.5. NH4HSO4, (NH4)2SO4 and NH4NO3 were the main chemical forms of secondary inorganic ions. Sufficient NH3, intense solar radiation, and moist particulate matter surface promoted the formation of secondary inorganic ions. The higher temperature contributed to the volatilization of secondary inorganic ions.

1. Introduction

PM2.5 is known as fine particulate matter (PM) with an aerodynamic diameter smaller than 2.5μm, which can be emitted directly into the atmosphere from a source (primary particles) or produced via gas-to-particle conversion in the atmosphere (secondary particles) and transported regionally (regional transport of particles) [1,2,3,4]. PM2.5 pollution causes much concern because it profoundly impacts human health [5,6], atmosphere visibility and air quality [7,8], weather and climate [9], and ecosystems [10]. Water-soluble inorganic ions (WSIIs) are vital chemical compositions of PM2.5, which make up 30% to 70% (in some cases even >70%) of PM2.5 mass in the atmosphere [11]. The characteristics of WSIIs affect the physical and chemical behaviors of PM2.5, such as hygroscopicity, acidity, and alkalinity of aerosol [12]. It also plays an important part in accelerating the formation of particulate matter and degrading atmospheric visibility [2]. The characteristics of WSIIs are regarded as valuable indicators for evaluating PM2.5 pollution [13,14].
In recent decades, with the increasing rate of industrialization and urbanization, the contributions of fossil fuel combustion, vehicle exhaust, and industry emissions to PM2.5 has been increasing rapidly, and PM2.5 pollution has been getting worse in China [2,3]. Many studies have been conducted in China trying to elucidate WSIIs pollution in PM2.5 [12,15,16,17,18,19,20]. It has been suggested that emissions levels of primary particles, the conversion efficiency of secondary particles, special meteorological conditions, regional transport pathways, and their synergetic effects are the main factors regulating the WSIIs and PM2.5 levels in heavily polluted Chinese cities [1,2,3,4]. However, few of these studies have focused on the impact of seasonal climate change on PM2.5, especially in the southern monsoon climate zone. It has been suggested that seasonal climate changes, such as the differences in rainfalls and temperature, may have significant impacts on the characteristics of WSIIs and the formation of PM2.5 [10,11,21].
Nanning with a low latitude (22°48′ N) is located in southwestern China in Guangxi province, which is in the subtropical monsoon climate zone. Nanning is affected by the southeast and southwest monsoons, and the climate has conspicuous seasonal characteristics. Generally, from May to October is the wet season of the whole year, in which there are intense solar radiation, high temperature and abundant rainfalls (about 80% of the annual rainfall). From November to March is the dry season of the whole year, in which there is weak solar radiation, low temperatures, and little rainfall. It is expected that the geographic location and seasonal climatic conditions can significantly affect the properties of aerosol in Nanning. In recent years, the impact of human activities on air quality has intensified in Nanning [22]. Both the observed trend of pollutant levels and the deteriorating air have attracted increasing concerns of the people. There are some studies that have been conducted in Nanning trying to characterize aerosol pollution, and most of them have focused on organic compounds in the atmosphere [22,23], the single-particle chemical composition in fireworks pollution and ambient aerosols [24,25], and chemical composition of biofuel combustion particulate matter [26]. However, studies about WSIIs of PM2.5 are relatively few in this region to date, especially studies about the variation of WSIIs in different seasons. To better understand the local PM2.5 pollution and to effectively investigate their distribution characteristics and possible sources, we conducted this study in Nanning from 1 September 2017 to 31 August 2018. In this work, we reported the daily WSIIs characteristics of PM2.5 from urban Nanning during different seasons. Combining with meteorological conditions, positive matrix factorization (PMF) models, and air parcel trajectories from regionally transported emissions, the influence factors and potential pollution sources of WSIIs in wet and dry seasons were identified. The unique datasets are expected to improve our knowledge of PM2.5 pollution properties in monsoon climate cities and provide helpful information for future policy making.

2. Experiments

2.1. Experimental Site and Sampling

Nanning (107°45′ E to 108°51′ E, 22°13′ N to 23°32′ N) is the capital city of Guangxi Province. It is not only the political, economic, and cultural center of Guangxi province but also the largest city in Guangxi province. The air quality of Nanning has worsened because of rapid urbanization and industrialization [26]. In this study, we selected Guangxi University as the experimental site (108°17′ E, 22°50′ N), which is in the north of Nanning (Figure 1). The sampling site was located on the roof of the Comprehensive Experimental Building (an 11 stories high building, about 35 m above ground) on Guangxi University campus, which is the tallest building in Guangxi University; and there are no other taller buildings sheltering it. The sampling site is surrounded by roads with traffic, residential buildings, and business offices. The main street is 0.5 km away from the building. There were no obvious emission sources of atmospheric WSIIs in the vicinity of the sampling site during the study. The obtained PM2.5 samples represented the air at the sampling location, which avoided single point emission sources.

2.2. Chemical Analyses

The PM2.5 samples were collected on a quartz fiber filter (QFF, 8″ × 10″, Pall Tissuquartz, USA) by a high-volume air sampler (KC-1000, Qingdao Laoshan Electronic Instrument company, China) with an impactor cutoff of 2.5 μm (aerodynamic diameter) at a flow rate of 1.05 ± 0.03 m3 min−1. We collected the samples (nominally one sample per 24 h) from 1 September 2017 to 31 August 2018 (359 samples). All samples were stored in a refrigerator at −20 °C until analysis in the laboratory. All the filters were weighed before and after sampling using a microelectronic balance with a reading precision of 10 μg after a 48-h equilibration inside a constant temperature (25 °C) and humidity (50%) chamber. Additionally, field blank filters were also collected by exposing filters in the sampler without drawing air through, to account for the introduction of any artifacts during the sampling procedure [27].
The collection of samples and analysis of water-soluble ions were described elsewhere [21,28]. Briefly, the quartz filters were cut into pieces and transferred to a Nalgene tube (50 mL), after which ultrapure water (50 mL) was added to the tube. After ultrasonic vibration, shaking, and centrifugation, the extract was filtered using pinhole filters. The extract was stored for WSIIs concentration analyses. All the procedures were strictly quality controlled to avoid any possible contamination of the samples. Ion chromatography (Dionex Aquion, USA) was used to detect WSIIs concentration. The anions (SO42−, NO3, and Cl) were determined by the ion chromatography system with an AS23 4 × 250 mm analytical column, while the cations (NH4+, Ca2+, Mg2+, Na+, K+) were determined using the same IC system with a CS12A 4 × 250 mm column. A sample volume of 100 μL was used for both anion and cation analyses. Before analysis of the samples to be tested, external standard solutions (Merck, Germany) were used for making the standard curve, and correlation coefficients greater than 0.999 were required. The limits of detection were 11.50 μg·L−1 for SO42−, 21.60μg·L−1 for NO3, 12.10 μg·L−1 for NH4+, 90.00 μg·L−1 for Ca2+, 24.70 μg·L−1 for Mg2+, 1.00 μg·L−1 for Na+, 17.70 μg·L−1 for K+, 5.10 μg·L−1 for Cl, and 3.80 μg·L−1 for F. The relative standard deviation was less than 5% for the reproducibility test [21,28].

2.3. Collecting Meteorological Parameters

Weather parameters including wind speed (WS), wind direction (WD), temperature (T), and relative humidity (RH) were collected from the Weather and Climate Information website [29]. Particulate matter and gaseous pollutant concentration data were collected from the Air Quality Study website [30]. These data were published by the ambient air quality monitoring stations (Beihu, Nanning) which are operated by the Guangxi Zhuang Autonomous Region Environmental Protection Agency. The station was about 2 km away from the sampling site, which was the nearest air quality monitoring station around the sampling site. The online monitoring device was located on the roof of the building, about 20 m up from the ground, and there were no other taller buildings sheltering it. The standard method used for gas pollutants monitoring data was based on Specification and Test Procedures for Ambient Air Quality Continuous Automated Monitoring System for SO2, NO2, O3, and CO, which was published by the Ministry of Environmental Protection of the People’s Republic of China in 2013 [31].

2.4. Calculation of Non-Sea Salt (NSS) Aerosols

Since Nanning is near the sea, the impact of sea salt on WSIIs needs to be evaluated. The mass concentrations of non-sea salt SO42− (NSS-SO42−), non-sea salt K+ (NSS-K+), non-sea salt Ca2+ (NSS-Ca2+), and non-sea salt Mg2+ (NSS-Mg2+) were estimated based on the hypothesis that the particles originating from sea salt have the same components as seawater, and the Na+ measured was assumed to be derived from sea salt [32,33]. The calculation formulae are as follows:
NSS-SO42− = SO42− − Na+ × 0.2516
NSS-K+ = K+ − Na+ × 0.0370
NSS-Ca2+ = Ca2+ − Na+ × 0.0385
NSS-Mg2+ = Mg2+ − Na+ × 0.12

2.5. Chemical Conversions of SO2 and NO2

The conversion efficiencies of SO2 to SO42− and NO2 to NO3 are commonly represented by the Sulfur oxidation ratio (SOR) and nitrogen oxidation ratio (NOR) [34,35], respectively, which are defined, respectively, as
SOR = n-SO42−/(n-SO42− + n-SO2 )
NOR = n-NO3/( n-NO3 + n-NO2

2.6. PMF Model and Back Trajectory Analyses

Positive matrix factorization (PMF) is a source apportionment receptor model. In this study, PMF 5.0 (EPA) was used to quantitatively estimate the source of WSIIs [36,37,38]. When running the PMF model, it is required to input sample concentration data and uncertainty files. The uncertainty file can be input based on observations and equations, as described by the PMF 5.0 user guide. The uncertainty based on observations reflects the errors caused in the process of sampling and measuring samples, which are usually provided by the laboratory or reporting agency. The uncertainty based on equations is usually calculated by concentration, error fraction, and method detection limit (MDL). At the same time, the uncertainty based on equations can let users adjust and control the deviation in PMF solution in a small range. In this study, the uncertainty based on equations was used for calculation, and the relative uncertainty of the sample was estimated by the laboratory. The uncertainty was input into the model as an error matrix, and the ion concentration and sampling time as an input matrix. The calculation method was as follows:
Uncertainty = 5/6 × MDL (xij ≤ MDL)
Uncertainty = ( Error   Fraction × concentration ) 2 + ( 0.5 × MDL ) 2   ( xij > MDL )
where xij is the ion concentration, and the error fraction is the relative uncertainty (%) of the ion concentration [37].
The number of factors can be determined by the change of Q (robust) and Q (true). When Q (robust) and Q (true) change slowly, this indicates that too many factors are selected. In the range determined by Q (robot) and Q (true), different factor numbers are selected to run the model and test the feasibility of the results, which can determine the appropriate factor number in the PMF model. In this study, when the number of factors increased to 6 in PMF, the changes of Q (robust) and Q(true) were quite slow. Therefore, we ran the PMF model in the range of 1–6 factors.
Back trajectory cluster (BTC) analysis is a useful tool to evaluate the main origins and transport pathways of air pollutants at the receptor sites [28,39,40] and was used to provide a comprehensive view of the potential source regions for WSIIs in PM2.5 in Nanning. For each day, 3-day (72 h) back trajectories of air masses arriving at Nanning were computed.

3. Results

3.1. Weather Condition and Air Pollutants Concentration in the Sampling Period

The wind speeds were 0.9 to 5.9 m s−1 (mean 2.6 m s−1), and dominant wind directions were east, northeast, and south (Figure 1 and Figure 2a) during the sampling period. The temperature range was 5.2 °C to 30.9 °C (mean 22.1 °C) and RH was 31.0% to 99.0% (mean 78.3%). The annual rainfall was 1491.4 mm, and precipitations mainly occurred in the month of May, June, July, August, September, and October, which were defined as the wet season; the other months were defined as the dry season (Figure 2b).
The average daily concentrations of SO2, NO2, CO, and O3 (8h) were 11 μg·m−3, 36 μg·m−3, 1.0 mg·m−3, and 83 μg·m−3, respectively (Figure 2c,d). The PM2.5 range was 6 to 130 μg·m−3 (mean 36 μg·m−3), and relatively high concentrations of PM2.5 were observed during the following days: 25–27 October; 1, 2, 5, 6, and 13 November; 7, 10–12, and 22–28 December; 1–4, 14, 15, 19–23, and 30 January; and 9, 12, 13, 16 and 17 February. For these days, all the PM2.5 concentrations exceeded the PM2.5 24-h limitation value of 75 μg·m−3 of the Ministry of Ecology and Environment of the People’s Republic of China. We defined these days as pollution days and days with concentrations lower than 75 μg·m−3 were defined as normal days (Figure 2d).
During the sampling period, high particulate matter concentrations coincided with high NO2 and SO2 concentrations, while the variation of CO and O3 concentrations were not synchronous with the change of PM concentrations.

3.2. Seasonal Variations of WSIIs

The average concentrations of WSIIs were 19.12 μg·m−3 (1.75 to 69.87 μg·m−3), which accounted for 51.65% (12.43 to 94.55%) of PM2.5 concentrations. SO42− (47.8%), NO3 (16.1%), NH4+ (16.9%), and Ca2+ (12.1%) were the most important four ions in WSIIs. The ratios of other ions include K+ (3.2%), Cl (2.3%), Na+ (1.0%), Mg2+ (0.4%), and F (0.1%) were low. The SNA were the main components of WSIIs in Nanning which was consistent with the results from other regions around the world [41,42]. Seasonally, variations of WSIIs were in accordance with PM2.5 and N2O (Figure 2d,e). In the dry season, the WSIIs concentrations were relatively high, while they were low in the wet season (Figure 2e and Figure 3). The concentration of PM2.5, polluted gas (SO2, N2O, and CO) and WSIIs in pollution days were also higher than those in the normal days. The K+, Mg2+, and Cl concentrations were relatively high on February 15 and 16, 2018 (Figure 3d,e).

3.3. Calculation Results by PMF Model

Five factors were identified and quantified based on the PMF model (Table 1). It could be seen that factor 1 contributed 79.1% to NO3 and 38.5% to NH4+, factor 2 contributed 59.3% to K+ and 55.2% to Mg2+, factor 3 contributed 68.5% to SO42− and 55.4% to NH4+, factor 4 contributed 86.0% to F, 77.7% to Ca2+ and 45.9% to Na+, and factor 5 contributed 62.3% to Cl. Their percent contributions to PM2.5 were 20.8%, 10.5%, 41.8%, 17.7%, and 9.2%, respectively. The variations of contributions from different factors in the different seasons were consistent with WSIIs concentrations (Figure 4), which suggested that normalized contributions were higher in the dry season and pollution days than that in the wet season and normal days.

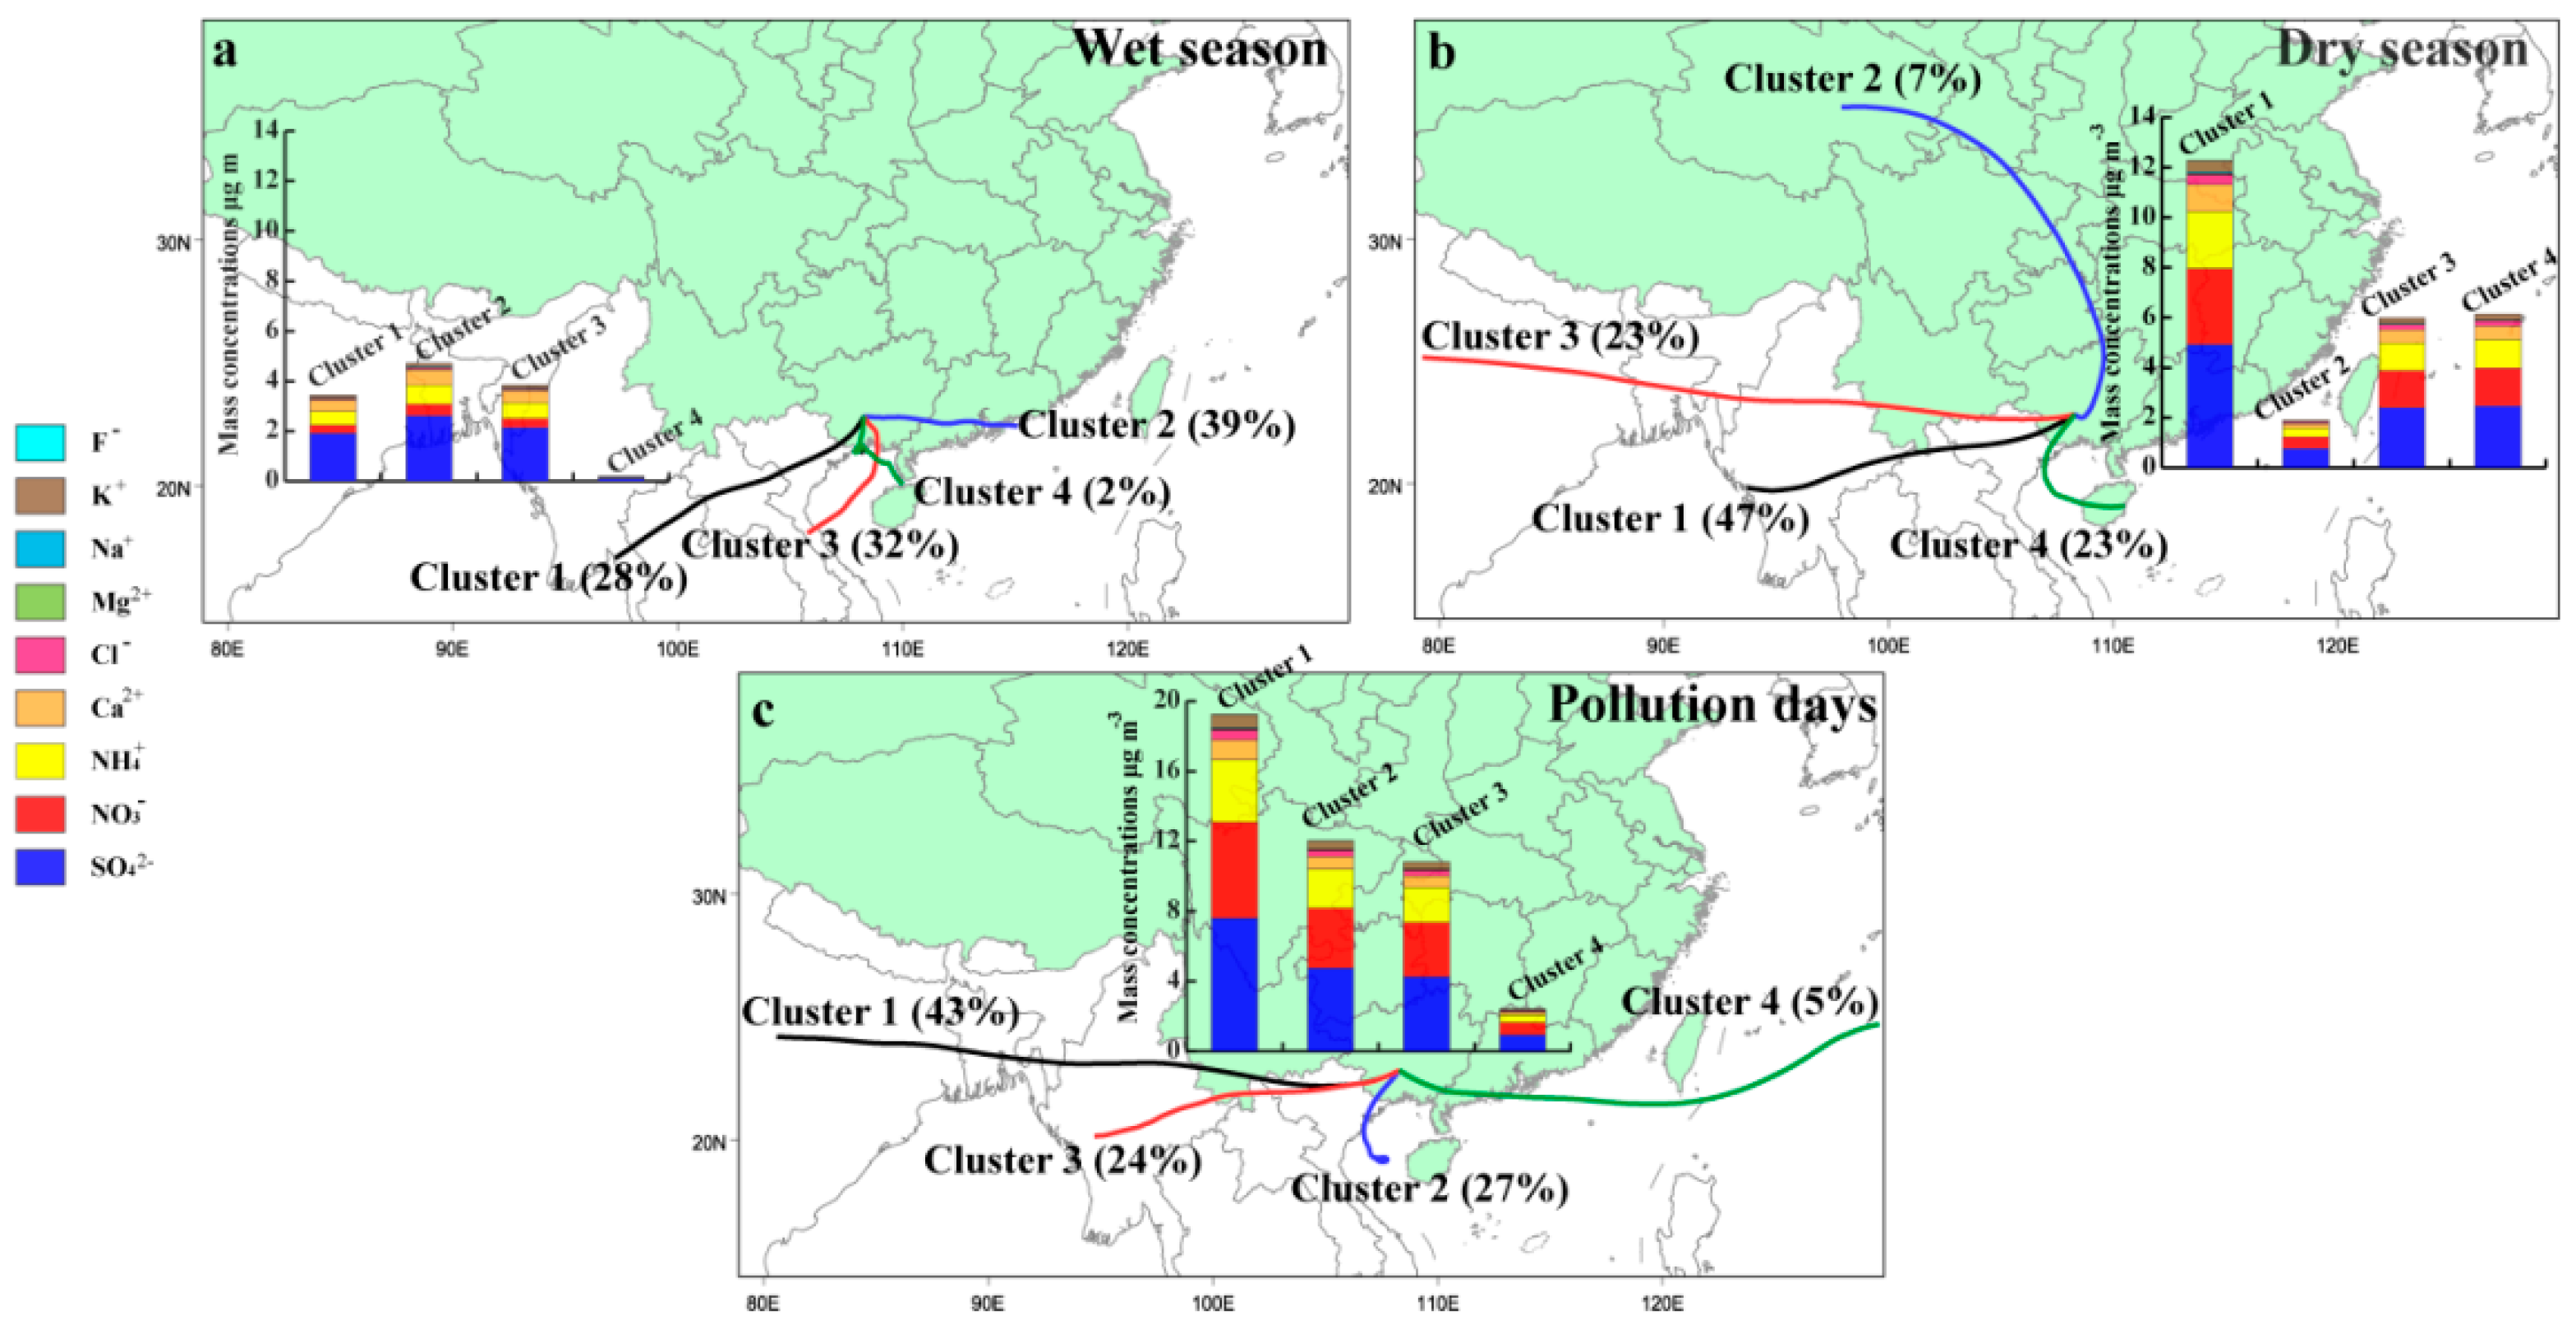
3.4. Results of Back Trajectory Analyses

All the trajectories in different seasons can be classified into four main categories (clusters) based on their origins, paths, and latitudes (Figure 5). In these four main clusters, the high frequencies of clusters were from east, west, and southwest, and the higher frequencies of clusters corresponded with the higher mass concentrations of WSIIs (Figure 5). To be specific, in the wet season, the main trajectories with high mass concentrations of WSIIs were the short east airflow from eastern Guangdong province and the long southwest air parcel from Vietnam and Myanmar. In the dry season, the main clusters with high mass concentrations of WSIIs were western long transport paths from the north of India and west of Myanmar, and southwest short transport paths from east of Hainan province. On pollution days, the main four clusters were similar to those in the cold months, showing that high frequencies and high mass concentrations of WSIIs in the cluster were the west and southwest transport patterns from India, Myanmar, and the Northern Gulf near Guangxi province.

3.5. Correlations of WSIIs

Results suggested that NH4+ had a strong linear correlation with SO42−, and the slopes were closed to 1 in the wet season and dry season. On pollution days, the linear correlation between NH4+ and SO42− were weak (R2 = 0.25), and the slope of the linear equation was <1 (Figure 6a). Excess NH4+ (excess [NH4+] = ([NH4+]/[SO42−] − 1.5) × [SO42−]) and NO3 concentrations were used to show characteristics of nitrate formed via the homogenous gas-phase reaction between ammonia and nitric in this study [43] (Figure 6b). The NO3 was positively and linearly correlated with excess NH4+ when excess NH4+ >0 (Figure 6b). There was also a strong positive linear correlation between [SO42− + NO3] and [NH4+] and the slope was <1.

3.6. Variations of SOR and NOR

The SOR (mostly >0.1) was more than NOR (mostly <0.1) on normal days and pollution days (Figure 7). Both on normal days and pollution days, SOR and NOR were related to NH4+ (Table 2). However, the trend of SOR and NOR varying with NH4+ was different on normal days (Figure 6a,b). It can be seen that when the NH4+ concentrations were low, the SOR increased more quickly, while the NOR increased slowly; when the NH4+ concentrations were high, the SOR increased slowly, while the NOR increased more quickly. In correlation analysis, the RH was positively correlated with SOR (R2 = 0.44) and O3 was negatively correlated with NOR (R2 = −0.58) on pollution days (Table 2). On normal days, the relationship between RH and O3 with SOR and NOR was not significant. In addition, the temperature was negatively correlated with NOR both on normal days and pollution days (Table 2).

4. Discussion

4.1. Correlation of Weather Conditions and Air Quality

It has been suggested that meteorological conditions, including wind speed and wind direction, RH, temperature, and so on, have an important impact on the air quality [44,45]. In our results, there was no obvious correlativity between weather parameters with particulate matter and gaseous pollutants (SO2, NO2, CO, and O3), which suggested that the influence of the wind speed, RH, and temperature on air quality may not be significant in this study. Specifically, wind speed and wind direction are important factors affecting the variability of the concentrations of air pollutants; in particular, the variations of wind speed impact the near-surface aerosol levels [10,21,45]. In our results, there was no significant correlation between wind speed and PM2.5, these results suggested that the transport of pollutants related to wind speed might be weak. On pollution days, when the PM2.5 concentration was relatively high (>75 μg·m−3), the wind speed (1.1 to 4.5 m·s−1) did not show low values, which suggested that wind speed did not have a major impact on the formation of pollutants (Figure 2a,d). Previous research has shown that a high concentration of aerosol liquid water would dissolve more pollutants and accelerate chemical reactions, which increases the formation of secondary aerosols [21,44,45]. There was no significant correlation between RH and PM2.5, suggesting that the effect of high RH dissolving more pollutants was not shown in this study. Previous research has also suggested that the relatively low air temperatures before haze episodes favor the partitioning of semi-volatile components and ammonium salts into the particle-phase, which further exacerbates air pollution [45]. In our results, the temperatures on pollution days and normal days did not show obvious changes (Figure 2b), which might indicate that temperature had little effect on air quality. SO2 and NO2 were the precursors of SO42− and NO3, respectively, contained in PM2.5, which could result in the variation of PM2.5 coinciding with NO2 and SO2 [34].

4.2. Source Analysis of Major WSIIs

SO42− (47.7%), NO3 (16.1%), and NH4+ (16.9%) contributed about 80% to the total WSIIs. These ions (SNA) are considered to be secondary particulate components that are converted from gas pollutants [46]. In general, SO42− is formed by the gas-phase photochemical conversion of SO2, mainly from fossil fuel combustion. NO3 is mainly formed via the conversion of NO and NO2, which are mainly from automobile and industrial emissions [47]. The high molar ratio of NO3 to SO42− (NO3/SO42− values>1) suggests that mobile sources over stationary sources [45,48]. In our results, NO3/NSS-SO42− values were 0.03 to 3.20 (average 0.62) in Nanning, which were lower than 1 (Figure 3b), revealing that fossil fuel combustion was still the important contributor to WSIIs. Meanwhile, the NO3/NSS-SO42− values were close to that of Beijing (0.58) [19], where the WSIIs were mainly influenced by vehicle emissions, which indicates that WSIIs were partly from vehicle exhaust. SO2 was lower than NO2 (Figure 2d), but the SOR and SO42− were much higher than NOR and NO3, respectively (Figure 3a,b), which indicates that the conversion efficiency of SO2 to SO42− was higher than NO2 to NO3 in Nanning. NH4+ was formed through reactions between acidic species and NH3, which was mainly from agricultural activities [49]. The SNA was correlated with the gaseous pollutants (SO2, NO2, and CO) which were mainly from coal combustion, biomass burning, and vehicle emissions as showed in Table 3, this indicated that the sources of SNA were impacted by these coal combustion, biomass burning, and vehicle emissions. Ca2+ (12.1%) is the fourth highest WSIIs in Nanning. In general, consistently high Ca2+ and Mg2+ concentrations may indicate that they are mainly from biomass burning and industry sources [15,17], and the soil dust has higher Ca2+ than Mg2+ concentrations [10]. A low NSS-Mg2+/NSS-Ca2+ value (average 0.08) in Nanning suggested a soil dust source of Ca2+. In the correlation analysis of WSIIs (Table 3), there was no significant correlation between Ca2+ and Mg2+, which indicated that Mg2+ has a different source than Ca2+. The F (0.1%) was lower than the other ions. Previous research suggested soil and glass manufacturing industries may contribute to F [17]. There are not significant emission sources of F in Nanning, so the concentration of F was low.
Cl (2.3%) and K+ (3.2%) were less than SNA and Ca2+. In PM2.5, Cl and K+ were mainly from coal, biomass, sea salts, and so on [16]. Some studies indicated that biomass burning produced a high proportion of K+ and Cl, and had a significant relationship between K+ and Cl [19]. The K+ was more than Cl (Figure 3d,e), and K+ was correlated with Cl (Table 3) in this study, suggesting that K+ was partially from biomass burning. Cl is also a major chemical composition of sea salt and coal combustion emission [49]. Generally, Cl was correlated with Na+, and Cl/Na+ values are about 1.80 in seawater [50]. In our study, most Cl/Na+ values were higher than 1.8 in the dry season, most Cl/Na+ values were lower than 1.8 in the wet season, and there was no correlation between Na+ and Cl (Table 3). This suggested that there was little contribution of sea salt to the Cl values, and the Cl was likely mainly from coal combustion emissions.

4.3. Quantitative Estimation by PMF and Seasonal Variation of Different Sources

Five main factors (sources) were categorized by PMF (Table 1). Source 1 (factor 1) was related to secondary inorganic ions from automobile emission, indicated by high loadings of NO3 and NH4+. Source 2 (factor 2) was identified to be sources of biomass burning with high loadings of K+ and Mg2+. Source 3 (factor 3) was associated with a mixture of secondary inorganic ions from fossil fuel combustion and agricultural activities, indicated by prominent loadings of SO42 and NH4+. Source 4 (factor 4) was identified to be sources of soil dust, indicated by high loadings of F, Ca2+, and Na+. Source 5 (factor 5) was identified to be sources of coal combustion emissions, characterized by high loadings of Cl. The contributions of sources (factors) 1–5 to PM2.5 were 20.8%, 10.5%, 41.8%, 17.7%, and 9.2%, respectively (Table 1), which suggested that secondary inorganic ions from fossil fuel combustion, agricultural activities, and automobile emission contributed more than 60% to PM2.5.
A previous study on air pollutant emissions inventory in Nanning have shown that the air pollutant emissions of Nanning were arranged in order of magnitude as PM10 (200 thousand tons) > NOx (120 thousand tons) > CO (84 thousand tons) > SO2 (41 thousand tons) [51]. The emissions inventory results showed that soil dust sources were the major contributors to PM10, which accounted for 87% of PM10. Industrial combustion and vehicle exhaust emissions were major contributors to NOx, which accounted for 55% and 27% of NOx. The industrial combustion emissions were the major contributors to CO, which accounted for 76% of CO. The stationary combustion sources (including thermal power plants, industrial combustion, and civil combustion) were the major contributors to SO2, which accounted for 82% of SO2. In these pollutants, SO2 and NO2 were the precursors of SO42− and NO3 which were the main components in PM2.5. This result further suggested that combustion sources and vehicle exhaust emissions were the major contributors to secondary inorganic ions of PM2.5 in Nanning from the perspective of emissions inventory. This was consistent with the PMF results in our study that secondary inorganic ions from fossil fuel combustion, agricultural activities, and automobile emission contributed more than 60% to PM2.5, as high SO42−, NH4+, and NO3 concentrations in PM2.5 in our results. Similarly to the results of the emissions inventory, the soil dust sources were identified in PMF results as high Ca2+ concentrations in PM2.5 (which contributed 17.7% to PM2.5). One difference from the results of the emissions inventory was that we identified agricultural activity sources in the PMF results as high NH4+ concentrations in PM2.5. Although, the NH4+ may also come from the burning of fossil fuels [10,15].
Results suggested that variation of contributions from different sources were in agreement with ions concentrations (Figure 3; Figure 4), and contributions were higher in the dry season and on pollution days, but lower in the wet season. Compared with the wet season, the contribution of automobile emissions (factor 1) and coal combustion emissions (factor 5) increased the most in the dry season (including pollution days) by about nine times and seven times, respectively (Figure 4). Compared with normal days, the contributions of automobile emissions (factor 1) and coal emissions (factor 5) also increased the most on pollution days, which increased about five times and two times, respectively (Figure 4). This phenomenon may be associated with seasonal weather variation. During the wet season, T and rainfall were higher (Figure 2b), which contributed to the volatilization and removal of WSIIs in PM2.5 [21,33]; thus, the concentrations and contributions were high in this season. Conversely, in the dry season, as the T and rainfall decreased (Figure 2b), the volatilization of the SNA and ion removal rate also decreased, which contributed to the increase of WSIIs in PM2.5; thus, the concentrations and contributions were low in this season [2,21]. On pollution days, besides the decrease of T and rainfall, the WS was low (Figure 2a,b) and the concentrations of gaseous pollutants (SO2, NO2, O3, and CO) (Figure 2c,d) and the transformation efficiency of NO2 (NOR) and SO2 (SOR) were high on these days (Figure 3b). These specific weather conditions promote the accumulation of pollutants.
The normalized contributions of biomass burning (factor 2) and coal combustion emissions (factor 5) were the highest on February 15 and 16, 2018, which was consistent with the highest K+, Mg2+ and Cl concentrations on the two days (Figure 3d,e). This result may be related to the display of fireworks and firecrackers. February 15 and 16, 2018 were the Chinese New Year’s Eve and the first day of Chinese New Year, respectively. A great number of fireworks and firecrackers were displayed to celebrate the festival on these two days, which could increase the concentration of Mg2+, K+ and Cl [11,19].

4.4. Main Origins and Transport Pathways of Air Pollutants

It has been suggested that WSIIs of PM2.5 in Nanning were easily enriched in the east and southwest trajectories in the wet season, and the WSIIs of PM2.5 were apt to be enriched in the west and southwest trajectories in the dry season and during pollution days (Figure 5). The air masses in the dry season and on pollution days brought more WSIIs pollution, while in the wet season they brought less WSIIs pollution.

4.5. Potential Formation Mechanisms of Major WSIIs

In our results, NH4+ was linearly related to SO42− on the normal days and pollution days (the linear correlation was relatively weak), and the slopes of the linear equations between NH4+ and SO42− were close to 1 and 0.5 on the normal days and pollution days, respectively (Figure 6a). The equivalent ratios of NH4+ to SO42− in (NH4)2SO4 and NH4HSO4 were 1.0 and 0.5 [16,45], respectively. Therefore, (NH4)2SO4 might be the main chemical form of SO42− and NH4+ on normal days, while NH4HSO4 might be the main chemical form of SO42− and NH4+ on pollution days. The NH4HSO4 and (NH4)2SO4 were mainly produced by the homogeneous reactions between H2SO4 and ammonia during normal days and pollution days [1]. Except for H2SO4, HNO3 can also react with ammonia to produce secondary inorganic ions; for example, HNO3 reacts with ammonia to form NH4NO3 [16]. Generally, ammonia is required to react with H2SO4 to generate NH4HSO4 or (NH4)2SO4. If ammonia is sufficient to produce H2SO4, the excess ammonia reacts with HNO3 to generate NH4NO3 [43]. In our results, the excess NH4+ was >0 in most of the samples, and the NO3 was positively and linearly correlated with excess NH4+ in this case (Figure 6b). This suggested that NH4NO3 was also the main chemical form of NO3 and NH4+. Compared to the dry season, more samples in the wet season were NH4+-deficient (excess NH4+ < 0), which may be related to the volatilization of NH4NO3 in the high-temperature condition in the wet season (Figure 6b) [16]. The formation of NO3 in NH4+-deficient circumstances could be related to crustal species or hydrolysis of N2O5 in PM2.5 [43]. Both the NH4+ vs. SO42− concentration and excess NH4+ vs. NO3 concentrations were high on pollution days; this indicates that more NH4HSO4 and NH4NO3 were formed in these days.
The sum of SO42− and NO3 was linearly correlated with NH4+ with the slope <1 (Figure 6c), which may suggest there were redundant SO42− or that NO3 existed in other forms. CaSO4 and Ca(NO3)2 from soil dust may be chemical forms of SO42−, NO3, and Ca2+, as the weak correlations in [Ca2+] vs. [SO42−] and [Ca2+] vs. [NO3] (Table 3) indicate.

4.6. Factors Affecting SOR and NOR

Generally, NOx and SO2 are the precursors of NO3 and SO42− formation, respectively, and they are the main factors regulating SOR and NOR [10,52]. Both on normal and pollution days, SOR and NOR were positively and linearly correlated with NH4+ (Table 2 and Figure 7), indicating that ammonia was also an important factor impacting the transformation of SO2 and NO2 [35,53]. This showed that when the NH4+ concentrations were low (NH4+ <4 μg·m−3), the SOR increased faster, while the NOR increased more slowly; when the NH4+ concentrations were high (NH4+ >4 μg·m−3), the SOR increased slowly, while the NOR increased more quickly. The different growth trends of SOR and NOR with the NH4+ concentrations confirmed the different formation mechanisms of SO42− and NO3. The SO42−, NO3, and NH4+ in PM2.5 were mainly formed by the reaction of H2SO4 and HNO3 with ammonia. When ammonia was low, ammonia preferentially reacted with H2SO4 to form NH4HSO4 or (NH4)2SO4; more SO42− was formed and the SOR increased rapidly. When ammonia was high, excess ammonia reacted with HNO3 to produce NH4NO3; during this time, more NO3 was formed and NOR increased rapidly [11]. This also confirmed the deduction of the discussion in Section 4.5.
It has been suggested that both OH radicals and O3 concentration and particulate matter liquid water content (represented by RH) also had a significant influence on the secondary transformation of NO2 and SO2. The moist particulate matter (high RH) and intensive photochemistry process (high OH radicals and O3 concentration) were favorable for the formation of SO42− and NO3 [44,53,54]. The RH was positively correlated with SOR and NOR, and O3 was negatively correlated with NOR on pollution days (Table 2, Figure 7c,d), which indicated that high RH could promote the secondary formation of SO42− and NO3, and secondary formation of NO3 could consume more O3. However, on normal days, the effects of RH and O3 on SOR and NOR were not significant. There were also some differences between the formative mechanisms of SO42− and NO3. The formation of NO3 was not only affected by O3 but also by temperature, as indicated by the negative correlation between NOR and temperature both on normal and pollution days (Table 2). It has been confirmed by previous studies that the reaction of the gas-solid equilibrium for NH4NO3 was largely influenced by temperature [55,56]; the lower temperature was conducive to NH4NO3 formation, while the higher temperature was favorable to volatilization of NH4NO3. This was also the reason why the contribution of automobile emissions decreased in the wet season (relatively high-temperature conditions), as discussed in Section 4.3.

5. Conclusions

WSIIs in PM2.5 were measured in Nanning, showing that SNA were the main components of WSIIs (contributing about 80% to the total WSIIs), and the total WSIIs were the main pollutants in PM2.5 (accounting for 51.65% of PM2.5 mass). These WSIIs were mainly from secondary inorganic ions, soil dust, biomass burning, and coal combustion emissions (primary emissions). Furthermore, secondary inorganic ions that form fossil fuel combustion, agricultural activities, and automobile emissions contributed more than 60% to PM2.5. This result was also consistent with the results of an air pollutant emission inventory in Nanning, which suggested that stationary combustion sources (including thermal power plants, industrial combustion, and civil combustion), vehicle exhaust, and urban road dust were the three major sources for air pollutants in Nanning.
Compared with the wet season, the contributions of different sources increased in the dry season (including pollution days); of these sources, automobile emissions and coal combustion emissions increased the most (about nine times and seven times, respectively). Seasonal weather and climate change affected the concentration levels of WSIIs. During the wet season, higher temperatures and abundant rainfalls contributed to the volatilization and removal of WSIIs in PM2.5, while in the dry season, lower temperatures and little precipitations, and higher emissions contributed to the increase of WSIIs in PM2.5. During the pollution days, besides low removal rate and high emissions, the poor dispersion weather and high transformation efficiency of NOx and SO2 were in favor of the accumulation of pollutants. Furthermore, the air masses brought more WSIIs pollution in the dry season and pollution days, while they brought less WSIIs pollution in the wet season.
NH4HSO4, (NH4)2SO4, and NH4NO3 were the main chemical forms of secondary inorganic ions. Except for the NOx and SO2, the NH3, O3, RH, and T also had important impacts on the formation of secondary inorganic ions. Sufficient NH3, intense solar radiation (high O3 concentration), and moist particulate matter surfaces (high RH) promoted the formation of secondary inorganic ions. The high temperature contributed to the volatilization of secondary inorganic ions.

Author Contributions

Conceptualization, W.G.; data curation, W.G.; formal analysis, W.G.; funding acquisition, W.G.; investigation, C.L.; project administration, H.X. (Huayun Xiao); resources, Z.Z., N.Z., H.X. (Huayun Xiao), and H.X. (Hongwei Xiao); writing – original draft, W.G.; writing – review & editing, W.G., H.X. (Huayun Xiao) and H.X. (Hongwei Xiao). All authors have read and agreed to the published version of the manuscript.

Funding

This research was funded by National Natural Science Foundation of China, grant number 41863002; Open Foundation of State Key Laboratory of Loess and Quaternary Geology, Institute of Earth Environment, Chinese Academy of Sciences, grant number SKLLQG1705 and Jiangxi Province Education Department Science and Technology Research Project, grant number GJJ170468.

Conflicts of Interest

The authors declare no conflict of interest.

References

  1. Zhang, R.; Wang, G.; Guo, S.; Zamora, M.L.; Wang, Y. Formation of Urban Fine Particulate Matter. Chem. Rev. 2015, 115, 3803–3855. [Google Scholar] [CrossRef]
  2. Fu, H.; Chen, J. Formation, features and controlling strategies of severe haze-fog pollutions in China. Sci. Total Environ. 2017, 578, 121–138. [Google Scholar] [CrossRef] [PubMed]
  3. An, Z.S.; Huang, R.J.; Zhang, R.Y.; Tie, X.X.; Li, G.H.; Cao, J.J.; Zhou, W.J.; Shi, Z.G.; Han, Y.M.; Gu, Z.L.; et al. Severe haze in northern China: A synergy of anthropogenic emissions and atmospheric processes. Proc. Natl. Acad. Sci. USA 2019, 116, 8657–8666. [Google Scholar] [CrossRef] [PubMed] [Green Version]
  4. Li, Y.; Sun, Y.L.; Zhang, Q.L.; Li, X.; Li, M.; Zhou, Z.; Chan, C.K. Real-time chemical characterization of atmospheric particulate matter in china: A review. Atmos. Environ. 2017, 158, 270–304. [Google Scholar] [CrossRef]
  5. Palomo, A.O.L. Health 21: The health for all policy framework for the WHO European Region. J. Adv. Nurs. 1999, 30, 280. [Google Scholar]
  6. United States Environmental Protection Agency (EPA). EPA Activities for Cleaner Air (Washington DC). Available online: https://www.epa.gov/sanjoaquinvalley/epa-activities-cleaner-air (accessed on 20 May 2019).
  7. Watson, J.G. Visibility: Science and regulation. J. Air Waste Manag. Assoc. 2002, 52, 628–713. [Google Scholar] [CrossRef] [Green Version]
  8. Yuan, C.S.; Lee, C.G.; Liu, S.H.; Chang, J.C.; Yuan, C.; Yang, H.Y. Correlation of atmospheric visibility with chemical composition of Kaohsiung aerosols. Atmos. Res. 2016, 82, 663–679. [Google Scholar] [CrossRef]
  9. Seinfeld, J.H.; Pandis, S.N. Atmospheric Chemistry and Physics: From Air Pollution to Climate Change; John Wiley and Sons Inc.: New York, NY, USA, 1998. [Google Scholar]
  10. Huang, X.J.; Liu, Z.R.; Zhang, J.K.; Wen, T.X.; Ji, D.S.; Wang, Y.S. Seasonal variation and secondary formation of size-segregated aerosol water-soluble inorganic ions during pollution episodes in Beijing. Atmos. Res. 2016, 168, 70–79. [Google Scholar] [CrossRef]
  11. He, Q.S.; Yan, Y.L.; Guo, L.L.; Zhang, Y.L.; Zhang, G.X.; Wang, X.M. Characterization and source analysis of water-soluble inorganic ionic species in PM2.5 in Taiyuan city, China. Atmos. Res. 2017, 184, 48–55. [Google Scholar] [CrossRef]
  12. Shen, Z.X.; Cao, J.J.; Arimoto, R.; Han, Z.W.; Zhang, R.J.; Han, Y.M.; Liu, S.X.; Okuda, T.; Nakao, S.; Tanaka, S. Ionic composition of TSP and PM2.5 during dust storms and air pollution episodes at Xi’an, China. Atmos. Environ. 2009, 43, 2911–2918. [Google Scholar] [CrossRef]
  13. Wang, H.L.; Zhu, B.; Shen, L.J.; Xu, H.H.; An, J.L.; Xue, G.Q.; Cao, J.H. Water-soluble ions in atmospheric aerosols measured in five sites in the Yangtze River Delta, China: Size-fractionated, Seasonal variations and Sources. Atmos. Environ. 2015, 123, 370–379. [Google Scholar] [CrossRef]
  14. Voutsa, D.; Samara, C.; Manoli, E.; Lazarou, D.; Tzoumaka, P. Ionic composition of PM2.5 at urban sites of northern Greece: Secondary inorganic aerosol formation. Environ. Sci. Pollut. Res. 2014, 21, 4995–5006. [Google Scholar] [CrossRef] [PubMed]
  15. Wang, Y.; Zhuang, G.; Tang, A.; Yuan, H.; Sun, Y.; Chen, S.; Zheng, A.H. The ion chemistry and the source of PM2.5 aerosol in Beijing. Atmos. Environ. 2005, 39, 3771–3784. [Google Scholar] [CrossRef]
  16. Wang, Y.; Zhuang, G.; Zhang, X.; Huang, K.; Xu, C.; Tao, A.H.; Chen, J.M.; An, Z.S. The ion chemistry, seasonal cycle, and sources of PM2.5 and TSP aerosol in Shanghai. Atmos. Environ. 2006, 40, 2935–2952. [Google Scholar] [CrossRef]
  17. Zhao, J.P.; Zhang, F.W.; Xu, Y.; Chen, J.S. Characterization of water-soluble inorganic ions in size-segregated aerosols in coastal city, Xiamen. Atmos. Res. 2011, 99, 546–562. [Google Scholar] [CrossRef]
  18. Meng, C.C.; Wang, L.T.; Zhang, F.F.; Wei, Z.; Ma, S.M.; Ma, X.; Yang, J. Characteristics of concentrations and water-soluble inorganic ions in PM2.5 in Handan City, Hebei province, China. Atmos. Res. 2016, 171, 133–146. [Google Scholar] [CrossRef]
  19. Yang, Y.J.; Zhou, R.; Yu, Y.; Yan, Y.; Liu, Y.; Di, Y.A.; Wu, D.; Zhang, W.Q. Size-resolved aerosol water-soluble ions at a regional background station of Beijing, Tianjin, and Hebei, North China. J. Environ. Sci. 2017, 55, 146–156. [Google Scholar] [CrossRef]
  20. Zhou, H.; Lu, C.W.; He, J.; Gao, M.S.; Zhao, B.Y.; Ren, L.M.; Zhang, L.J.; Fang, Q.Y.; Liu, T.; He, Z.Q.; et al. Stoichiometry of water-soluble ions in PM2.5: Application in source apportionment for a typical industrial city in semi-arid region, Northwest China. Atmos. Res. 2018, 204, 149–160. [Google Scholar] [CrossRef]
  21. Guo, W.; Zhang, Z.Y.; Zheng, N.J.; Xiao, H.Y.; Xiao, H.W. Chemical characterization and source analysis of water-soluble inorganic ions in PM2.5 from a plateau city of Kunming at different seasons. Atmos. Res. 2020, 234, 104687. [Google Scholar] [CrossRef]
  22. Guo, S.J.; Chen, M.; Tan, J.H. Seasonal and diurnal characteristics of atmospheric carbonyls in Nanning, China. Atmos. Res. 2016, 169, 46–53. [Google Scholar] [CrossRef]
  23. Guo, S.J.; Chen, M. Pollution Characteristic of Atmospheric Carbonyls during One Haze Event in Nanning, South China. Aerosol Air Qual. Res. 2016, 16, 1143–1151. [Google Scholar] [CrossRef] [Green Version]
  24. Li, J.Y.; Xu, T.T.; Lu, X.H.; Chen, H. Online single particle measurement of fireworks pollution during Chinese New Year in Nanning. J. Environ. Sci. 2017, 53, 184–195. [Google Scholar] [CrossRef] [PubMed]
  25. Xu, T.; Chen, H.; Lu, X.; Gross, D.S.; Yang, X.; Mo, Z.Y.; Chen, Z.M.; Liu, H.L.; Mao, J.Y.; Liang, G.Y. Single-Particle Characterizations of Ambient Aerosols during a Wintertime Pollution Episode in Nanning: Local Emissions vs. Regional Transport. Aerosol Air Qual. Res. 2017, 17, 49–58. [Google Scholar] [CrossRef] [Green Version]
  26. Tian, Y.Z.; Chen, J.B.; Zhang, L.L.; Du, X.; Wei, J.J.; Fan, H.; Xu, J.; Wang, H.T.; Guan, L.; Shi, G.L.; et al. Source profiles and contributions of biofuel combustion for PM2.5, PM10, and their compositions, in a city influenced by biofuel stoves. Chemosphere 2017, 189, 255–264. [Google Scholar] [CrossRef]
  27. Pathak, R.K.; Yao, X.H.; Chan, C.K. Sampling artifacts of acidity and ionic species in PM2.5. Environ. Sci. Technol. 2004, 38, 254–259. [Google Scholar] [CrossRef]
  28. Xiao, H.W.; Xiao, H.Y.; Luo, L.; Shen, C.Y.; Long, A.M.; Chen, L.; Long, Z.H.; Li, D.L. Atmospheric aerosol compositions over the South China Sea: Temporal/variability and source apportionment. Atmos. Chem. Phys. 2017, 17, 3199–3214. [Google Scholar] [CrossRef] [Green Version]
  29. Weather and Climate Information Website. Available online: http://www.weatherandclimate.info/ (accessed on 20 March 2019).
  30. Air Quality Study Website. Available online: http://www.aqistudy.cn/ (accessed on 25 March 2019).
  31. Specification and Test Procedures for Ambient Air Quality Continuous Automated Monitoring System for SO2, NO2, O3, and CO (HJ 654–2013). Available online: http://kjs.mee.gov.cn/hjbhbz/bzwb/jcffbz/201308/t20130802_256853.shtml (accessed on 20 March 2019).
  32. Nair, P.R.; Parameswaran, K.; Abraham, A. Wind-dependence of sea-salt and non-sea-salt aerosols over the oceanic environment. J. Atmos. Sol.-Terr. Phys 2005, 67, 884–898. [Google Scholar] [CrossRef]
  33. Zhang, J.J.; Lei, T.; Huang, Z.W.; Zhang, H.L.; He, M.M.; Dai, X.R.; Zheng, J.; Xiao, H. Seasonal variation and size distributions of water-soluble inorganic ions and carbonaceous aerosols at a coastal site in Ningbo, China. Sci. Total Environ. 2018, 639, 793–803. [Google Scholar] [CrossRef]
  34. Khoder, M.I. Atmospheric conversion of sulfur dioxide to particulate sulfate and nitrogen nitric acid in an urban area. Chemosphere 2002, 49, 675–684. [Google Scholar] [CrossRef]
  35. Zhang, T.; Cao, J.J.; Tie, X.X.; Shen, Z.X.; Liu, S.X.; Ding, H.; Han, Y.M.; Wang, G.H.; Ho, K.F.; Qiang, J.; et al. Water-soluble ions in atmospheric aerosols measured in Xi’an, China Seasonal variations and sources. Atmos. Res. 2011, 102, 110–119. [Google Scholar] [CrossRef]
  36. Hien, P.D.; Bac, V.T.; Thinh, N. PMF receptor modelling of fine and coarse PM10 in air masses governing monsoon conditions in Hanoi, northern Vietnam. Atmos. Environ. 2004, 38, 189–201. [Google Scholar]
  37. Norris, G.; Duvall, R.; Brown, S.; Bai, S. EPA Positive Matrix Factorization (PMF) 5.0 Fundamentals and User Guide; EPA/600/R-14/108 (NTIS PB2015–105147); U.S. Environmental Protection Agency: Washington, DC, USA, 2014.
  38. Cuccia, E.; Piazzalunga, A.; Bernardoni, V.; Brambilla, L.; Fermo, P.; Massabò, D.; Molteni, U.; Prati, P.; Valli, G.; Vecchi, R. Carbonate measurements in PM10 near the marble quarries of Carrara (Italy) by infrared spectroscopy (FT-IR) and source apportionment by positive matrix factorization (PMF). Atmos. Environ. 2011, 45, 6481–6487. [Google Scholar] [CrossRef]
  39. Stohl, A. Trajectory statistics-a new method to establish source-receptor relationships of air pollutants and its application to the transport of particulate sulfate in Europe. Atmos. Environ. 1996, 30, 579–587. [Google Scholar] [CrossRef]
  40. Salvador, P.; Artíñano, B.; Pio, C.; Afonso, J.; Legrand, M.; Puxbaum, H.; Hammer, S. Evaluation of aerosol sources at European high altitude background sites with trajectory statistical methods. Atmos. Environ. 2010, 44, 2316–2329. [Google Scholar] [CrossRef]
  41. Cuccia, E.; Bernardoni, V.; Massabò, D.; Prati, P.; Valli, G.; Vecchi, R. An alternative way to determine the size distribution of airborne particulate matter. Atmos. Environ. 2010, 44, 3304–3313. [Google Scholar] [CrossRef]
  42. Cuccia, E.; Massabò, D.; Ariola, V.; Bov, M.C.; Fermo, P.; Piazzalunga, A.; Prati, P. Size-resolved comprehensive characterization of airborne particulate matter. Atmos. Environ. 2013, 67, 14–26. [Google Scholar] [CrossRef]
  43. Pathak, R.K.; Wu, W.S.; Wang, T. Summertime PM2.5 ionic species in four major cities of China: Nitrate formation in an ammonia-deficient atmosphere. Atmos. Chem. Phys. 2008, 9, 1711–1722. [Google Scholar] [CrossRef] [Green Version]
  44. Boreddy, S.K.R.; Kawamura, K.; Bikkina, S. Hygroscopic growth of particles nebulized from water-soluble extracts of PM2.5 aerosols over the Bay of Bengal: Influence of heterogeneity in air masses and formation pathways. Sci. Total Environ. 2016, 544, 661–669. [Google Scholar] [CrossRef]
  45. Xu, L.L.; Duan, F.K.; He, K.B.; Ma, Y.L.; Zhu, L.D.; Zheng, Y.X.; Huang, T.; Kimoto, T.; Ma, T.; Li, H.; et al. Characteristics of the secondary water-soluble ions in a typical autumn haze in Beijing. Environ. Pollut. 2017, 227, 296–305. [Google Scholar] [CrossRef]
  46. Dai, W.; Gao, J.; Cao, G.; Ouyang, F. Chemical composition and source identification of PM2.5 in the suburb of Shenzhen, China. Atmos. Res. 2013, 122, 391–400. [Google Scholar] [CrossRef]
  47. Deng, X.L.; Shi, C.E.; Wu, B.W.; Yang, Y.J.; Jin, Q.; Wang, H.L.; Zhu, S.; Yu, C.X. Characteristics of the water-soluble components of aerosol particles in Hefei, China. J. Environ. Sci. 2016, 42, 32–40. [Google Scholar] [CrossRef] [PubMed]
  48. Li, X.R.; Wang, L.L.; Ji, D.S.; Wen, T.X.; Pang, Y.P.; Sun, Y.; Wang, Y.S. Characterization of the size-segregated water-soluble inorganic ions in the Jing-Jin-Ji urban agglomeration: Spatial/temporal variability, size distribution and sources. Atmos. Environ. 2013, 77, 250–259. [Google Scholar] [CrossRef]
  49. Wang, J.; Zhang, J.S.; Liu, Z.J.; Wu, J.H.; Zhang, Y.F.; Han, S.Q.; Zheng, X.J.; Zhou, L.D.; Feng, Y.S.; Zhu, T. Characterization of chemical compositions in size-segregated atmospheric particles during severe haze episodes in three mega-cities of China. Atmos. Res. 2017, 187, 138–146. [Google Scholar] [CrossRef]
  50. Moller, D. The Na/Cl ration in rainwater and the sea salt chloride cycle. Tellus Ser. B-Chem. Phys. Meteorol 1990, 423, 254–262. [Google Scholar] [CrossRef]
  51. Xia, L. Emission Inventory of Anthropogenic Air Pollutant and Environmental Capacity of Nanning. Master’s Thesis, Guangxi University, Nanning, China, 2017. [Google Scholar]
  52. Gao, X.; Yang, L.; Cheng, S.; Gao, R.; Zhou, Y.; Xue, L.; Shou, Y.; Wang, J.; Wang, X.; Lie, W.; et al. Semi-continuous measurement of water-soluble ions in PM2.5 in Jinan, China: Temporal variations and source apportionments. Atmos. Environ. 2011, 45, 6048–6056. [Google Scholar] [CrossRef]
  53. Cheng, Y.; Lee, S.C.; Ho, K.F.; Chow, J.C.; Watson, J.G.; Louie, P.K.K. Chemically-speciated on road PM2.5 motor vehicle emission factors in Hong Kong. Sci. Total Environ. 2010, 408, 1621–1627. [Google Scholar] [CrossRef]
  54. Zhou, J.; Xing, Z.; Deng, J.; Du, K. Characterizing and sourcing ambient PM2.5, over key emission regions in China I: Water-soluble ions and carbonaceous fractions. Atmos. Environ. 2016, 135, 20–30. [Google Scholar] [CrossRef]
  55. Willison, M.J.; Clarke, A.G.; Zeki, E.M. Seasonal variations in atmospheric aerosol concentration at urban and rural sites in Northern England. Atmos. Environ. 1985, 19, 1081–1089. [Google Scholar] [CrossRef]
  56. Vieira-Filho, M.; Pedrotti, J.J.; Fornaro, A. Water-soluble ions species of size-resolved aerosols: Implications for the atmospheric acidity in São Paulo megacity, Brazil. Atmos. Res. 2016, 181, 281–287. [Google Scholar] [CrossRef]
Figure 1. The location map of the sampling site in Nanning.
Atmosphere 11 00005 g001
Figure 2. Time series of weather records, gaseous pollutants concentration, particulate matter 2.5 (PM2.5), and ions concentrations. (a) Wind speed (WS) and wind direction (WD); (b) Temperature (T), relative humidity (RH), and rainfalls; (c) CO and O3 concentrations; (d) PM2.5, SO2, and NO2 concentrations; (e) water-soluble inorganic ion (WSII) concentrations.
Atmosphere 11 00005 g002
Figure 3. Time series of signal ions concentrations in sampling periods. (a) SO42−, NO3, and NH4+ concentrations; (b) SOR, NOR, and NO3/NSS-SO42−; (c) Ca2+, Na+, and F concentrations; (d) K+ and Mg2+ concentrations; (e) Cl concentrations. The unit of ions is μg·m−3.
Atmosphere 11 00005 g003
Figure 4. (a) Average concentrations of WSIIs in Nanning at different seasons; (b) Normalized contributions (average = 1) for different factors (sources) in PM2.5 samples in Nanning, using the PMF model.
Atmosphere 11 00005 g004
Figure 5. Mean clusters and the corresponding mean ions concentrations in different seasons. (a) Wet season; (b) Dry season; (c) Pollution days.
Atmosphere 11 00005 g005
Figure 6. Linear correlations between anions and cations. (a) SO42− and NH4+; (b) Excess NH4+ and SO42−; (c) SO42− + NO3 and NH4+.
Atmosphere 11 00005 g006
Figure 7. Scatter plots of SOR and NOR versus NH4+ on normal days and pollution days. (a) SOR versus NH4+ on normal days, the color scale represents O3; (b) NOR versus NH4+ on normal days, the color scale represents Temperature; (c) SOR versus NH4+ on pollution days, the color scale represents RH; (d) NOR versus NH4+ on pollution days +, the color scale represents O3.
Atmosphere 11 00005 g007
Table 1. Relative contribution (%) for different ions from potential five sources (factors) in Nanning, using the PMF model.
Sources (%)FactorSO42−NO3NH4+Ca2+Mg2+Na+K+FClPM2.5
Automobile 113.179.138.50.00.00.029.71.716.420.8
Biomass 24.80.00.40.055.20.059.35.58.410.5
Fossil fuel/agriculture 369.00.055.422.321.644.23.80.01.341.8
Soil dust49.020.90.077.720.945.96.286.011.617.7
Coal 54.10.05.70.02.39.91.06.862.39.2
Table 2. Correlation analyses among SOR, NOR, and weather factors and gaseous pollutants.
Sampling PeriodNormal DaysPollution Days
ParameterSORNORSORNOR
SO20.010.41−0.81−0.26
NO20.20.4−0.48−0.35
NH4+0.630.720.460.42
RH0.04−0.30.440.46
T0.09−0.60.41−0.62
O30.320.050.21−0.58
Table 3. Correlation analyses of different WSIIs and gaseous pollutants.
SpeciesSO42−NO3NH4+Ca2+Mg2+Na+K+FClSO2NO2CO
SO42−10.63**0.86**0.34**0.27**0.060.54**0.25**0.48**0.53**0.59**0.51**
NO3 10.83**0.32**0.15*0.12*0.51**0.32**0.61**0.68**0.75**0.59**
NH4+ 10.29**0.16*0.100.50**0.23**0.52**0.61**0.70**0.60**
Ca2+ 10.080.26**0.21**0.79**0.33**0.68**0.54**0.09
Mg2+ 10.18*0.84**0.27**0.56**0.12*0.040.03
Na+ 10.110.21**0.17*0.13*0.14*−0.02
K+ 10.350.770.410.370.32**
F 10.46**0.60**0.41**0.08
Cl 10.46**0.5**0.35**
** Correlation significant at 0.01 level (two-tailed), * significant at 0.05 level (two-tailed).

