Article

Association of Diurnal Rainfall in Northeastern Tibetan Plateau with the Retreat of the South Asian High

1
Key Laboratory of Land Surface Process and Climate Change in Cold and Arid Regions, Northwest Institute of Eco-Environment and Resources, CAS, Lanzhou 730000, China
2
Department of Plants, Soils, and Climate, Utah State University, Logan, UT 84322, USA
3
Utah Climate Center, Utah State University, Logan, UT 84322, USA
4
Research Center for Environmental Changes, Academia Sinica, Taipei 11529, Taiwan
5
Department of Earth and Planetary Sciences, University of New Mexico, Albuquerque, NM 87131, USA
6
Plateau Atmosphere and Environment Key Laboratory of Sichuan Province, School of Atmospheric Science, Chengdu University of Information Technology, Chengdu 610225, China
7
Collaborative Innovation Center on Forest and Evaluation of Meteorological Disasters, Nanjing University of Information Science & Technology, Nanjing 210044, China
*
Authors to whom correspondence should be addressed.
Atmosphere 2020, 11(1), 105; https://doi.org/10.3390/atmos11010105
Submission received: 2 November 2019 / Revised: 27 December 2019 / Accepted: 6 January 2020 / Published: 15 January 2020
(This article belongs to the Section Meteorology)

Abstract

:
The characteristics of intense diurnal precipitation occurring beneath the South Asian High (SAH) are diagnosed in the summer monsoon season from 2010 to 2015 using observational data. The diagnostics indicate that summer nighttime rainfall events in the northeastern Tibetan Plateau can intensify towards the end of the monsoon period. By defining a transition index to identify the transition day during which the episodes of diurnal convection start to decline, daily thermodynamic properties and precipitation from each year were composited before and after the transition date. The analysis reveals that warmer air, increased moisture, and stronger upward velocity are present in the atmosphere before the transition day, potentially elevating nighttime convective precipitation. Enhanced upward velocity that is present through the two months prior to transition date coincides with the timing of the peak SAH, while weakened upward velocity afterwards coincides with its subsequent retreat. The large-scale lift due to terrain-ambient air interaction underneath the SAH and the increased moisture content can enhance the potential for diurnal convection, which lends support to the nighttime peak of rainfall. This feature persists until the transition date, after which the SAH starts to retreat.

1. Introduction

On 20–21 August 2013, two severe diurnal rainfall events occurred consecutively in the cities of Chaka and Datong near Lake Qinghai on the Tibetan Plateau (locations shown in Figure 1a). The two events had a clear diurnal signal with both showing peak rainfall rates around 22:00 local time before steadily weakening in the morning hours (Figure 1b). These two events were marked by 25 fatalities and considerable economic loss inflicted by flash flooding. According to measurements from the official China Meteorological Administration (CMA) meteorology station at Datong, the total precipitation on August 21 reached 144.9 mm. a record for this station. There were no significant synoptic precursors evident from infrared satellite cloud imagery during the daytime (Figure 1c,e) preceding the series of convective clouds that developed over the two cities into the night (Figure 1d,f). Nighttime convective clouds are also seen in areas away from Chaka and Datong Cities signaling the widespread nature of this diurnal precipitation in northeastern Tibetan Plateau.
Continental diurnal rainfall can be associated with sea–land contrast, orographic effects, and heterogeneity in surface heating [1,2,3,4,5,6,7], known as the mechanical lift of the Tibetan Plateau. With an average altitude of 4000 m (Figure 1a), the Tibetan Plateau’s vast and varied topography and absorbed heat serve as important forcings for diurnal rainfall during the warm season [8,9]. Diurnal convection is most active over the eastern edge of the Tibetan Plateau. Most convection forms in the afternoon and reaches its peak in late evening and through the night [3,9,10]. During the summer monsoon season, the South Asian High (SAH) develops and occupies the upper troposphere over the Tibetan Plateau and neighboring areas. Its variations considerably modulate weather and climate over the broader Asian-Pacific region [11,12]. Many studies have focused on the impacts of SAH spatial variability on seasonal precipitation in China, while others have concerned the SAH’s intra-seasonal to inter-decadal variations [13,14,15,16,17,18]. However, the connection between the SAH and diurnal precipitation over the northeastern Tibetan Plateau, particularly for cases of severe nighttime rainfall, has not been explored.
The extreme nature and high cost of the August 2013 events call for an examination of the occurrence, duration, and intensity of diurnal rainfall events over the Tibetan Plateau and how the related convection interacts with the SAH lifecycle. The Intergovernmental Panel on Climate Change Special Report (IPCC-SREX) projects increased precipitation rates in the mid- and high-latitudes by the mid-21st century, although this change in intensity is not projected to be uniform, either spatially or temporally [19]. Duan and Xiao (2015) [20] reported that an accelerated warming trend has appeared over the Tibetan Plateau during 1998–2013 (0.25 °C decade−1), in contrast to the post-1990 (ending in 2014) global warming hiatus [21]. Due to its relevance to society and ecosystems, severe diurnal rainfall events over the Tibetan Plateau have been increasingly studied [22,23,24,25]. This study is intended to analyze the characteristics of the warm season diurnal precipitation variation, its daily amplitude change over the northeastern Tibetan Plateau, and the thermodynamic properties related to the SAH evolution that play a role in enhancing precipitation.

2. Data Sources

A high-resolution merged precipitation product (0.1° × 0.1°) was developed based on the National Oceanic and Atmospheric Administration (NOAA) Climate Prediction Center (CPC) morphing technique (CMORPH) by using the hourly precipitation from more than 30,000 CMA automatic weather stations (AWS) in China (available at http://data.cma.cn) [26,27,28]. CMORPH data were interpolated to a 0.1° × 0.1° grid with a temporal interval of 30 min and a horizontal resolution of 8 km covering the area between 60° S and 60° N. Then the merging algorithm of improved probability density function-optimal interpolation (PDF-OI) was conducted to combine the quality-controlled rain gauge precipitation records with the CMORPH data. Due to data source constrains, we only analyzed the 2010–2015 period for the June–October season. Additional data sets include 6-hourly 1° × 1° isobaric variables of vertical velocity, humidity, geopotential height, and temperature data were obtained for this time period from the European Centre for Medium-Range Weather Forecasts interim reanalysis (ERA-Interim) [29]. Nighttime rainfall was defined as the precipitation from 20:00 local time to 08:00 the following day, while daytime rainfall was from 08:00 to 20:00.

3. Results

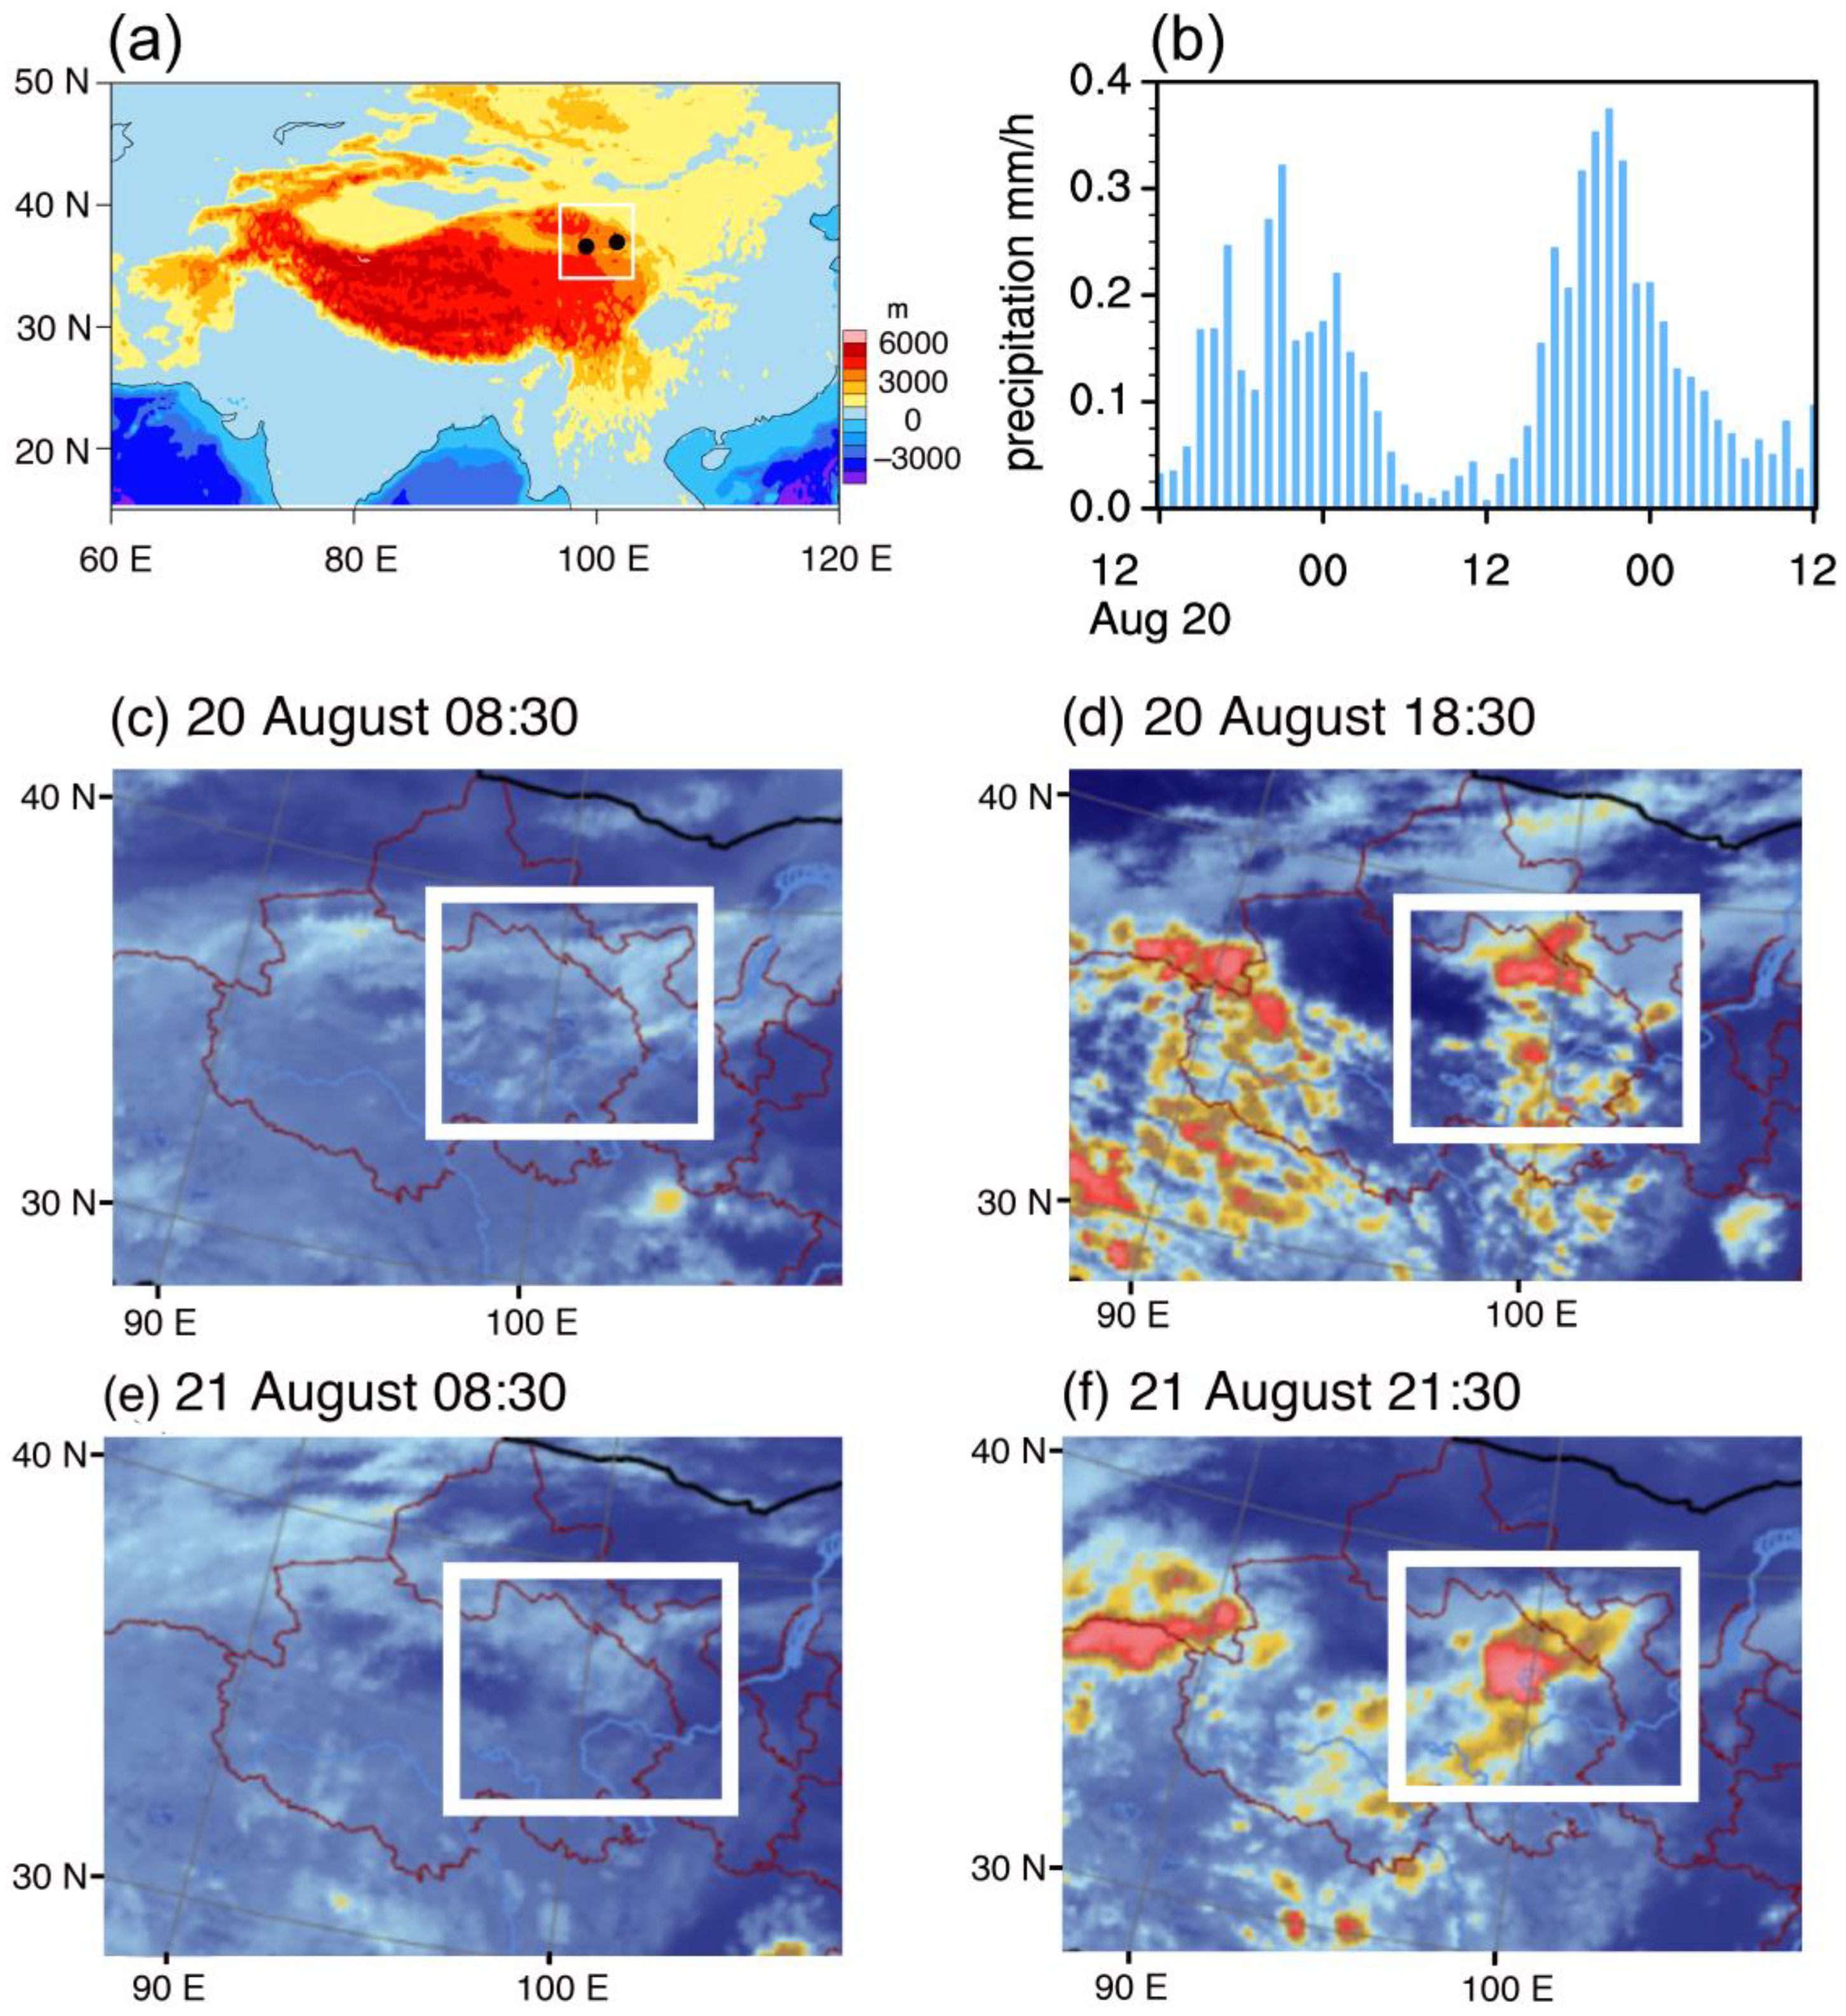
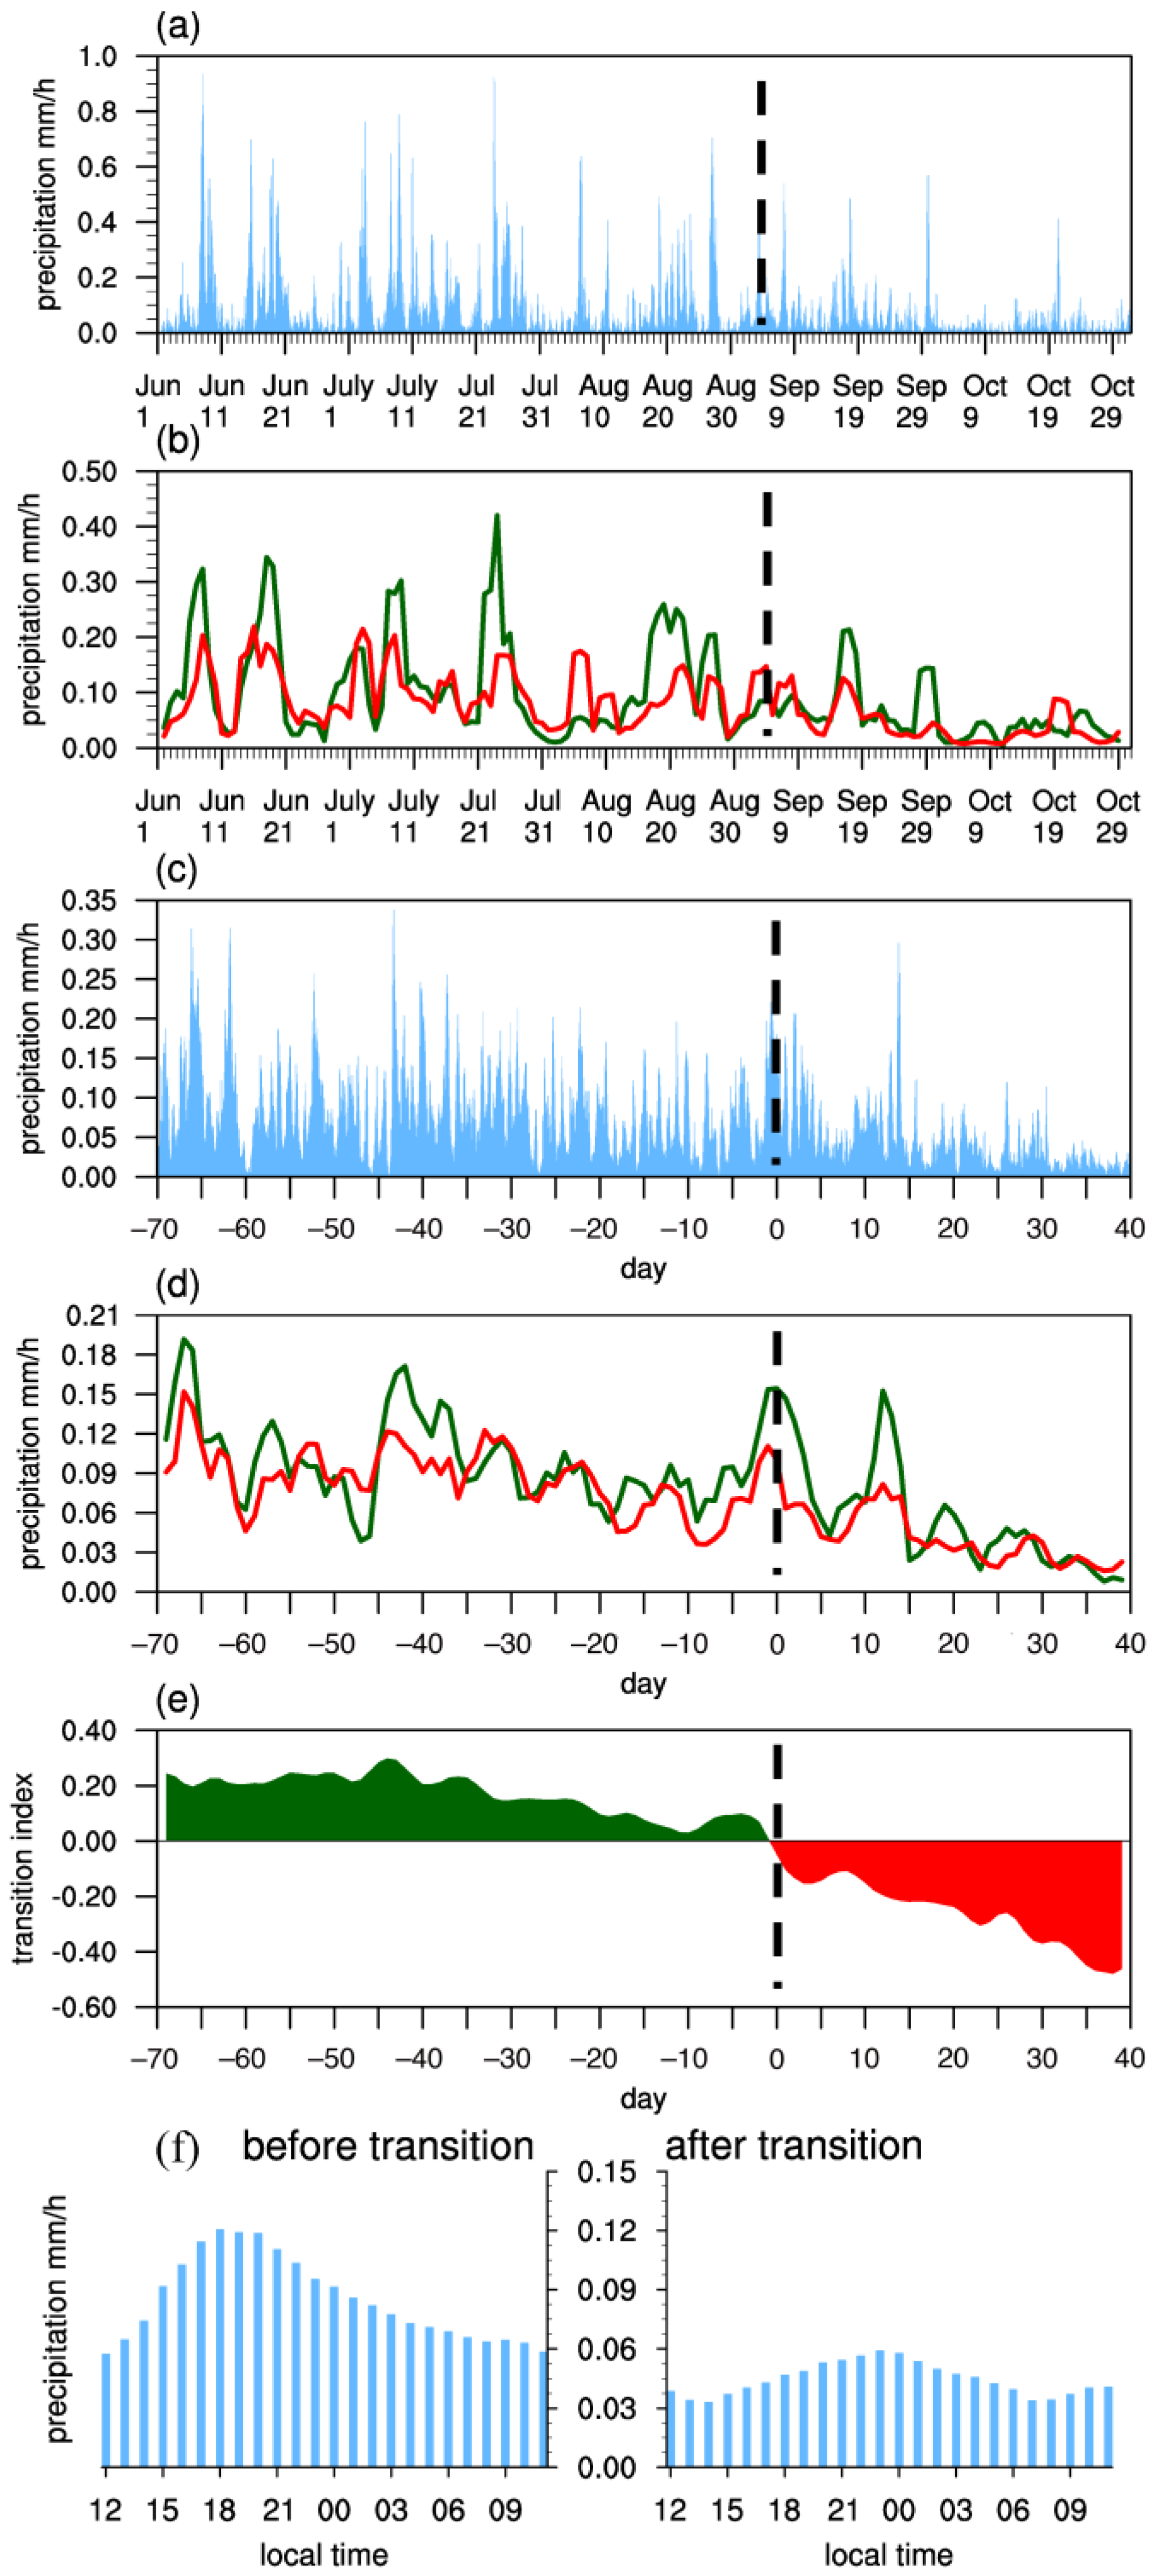
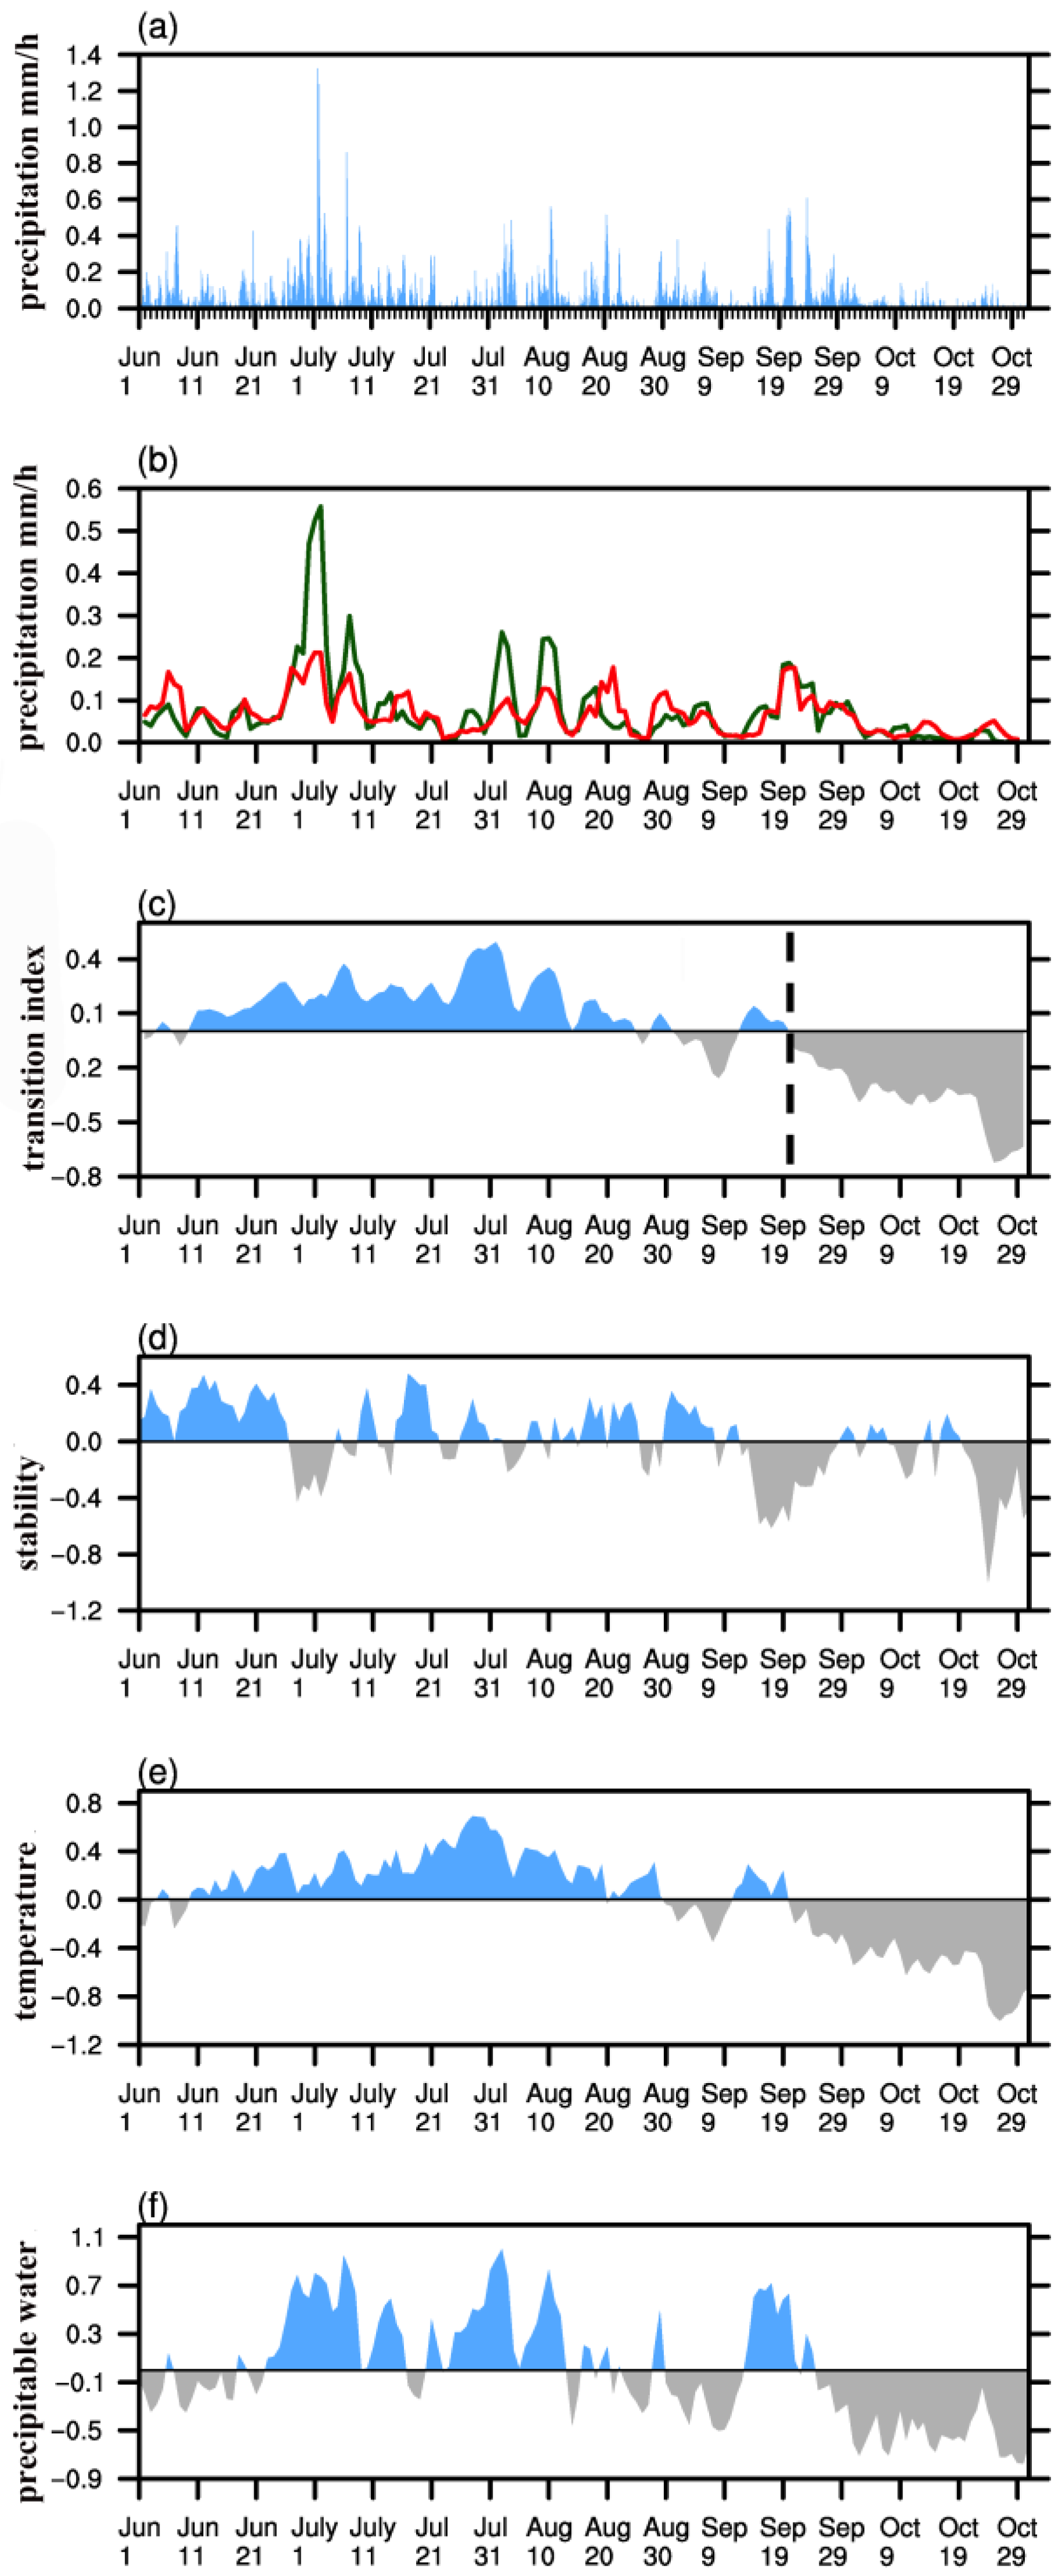
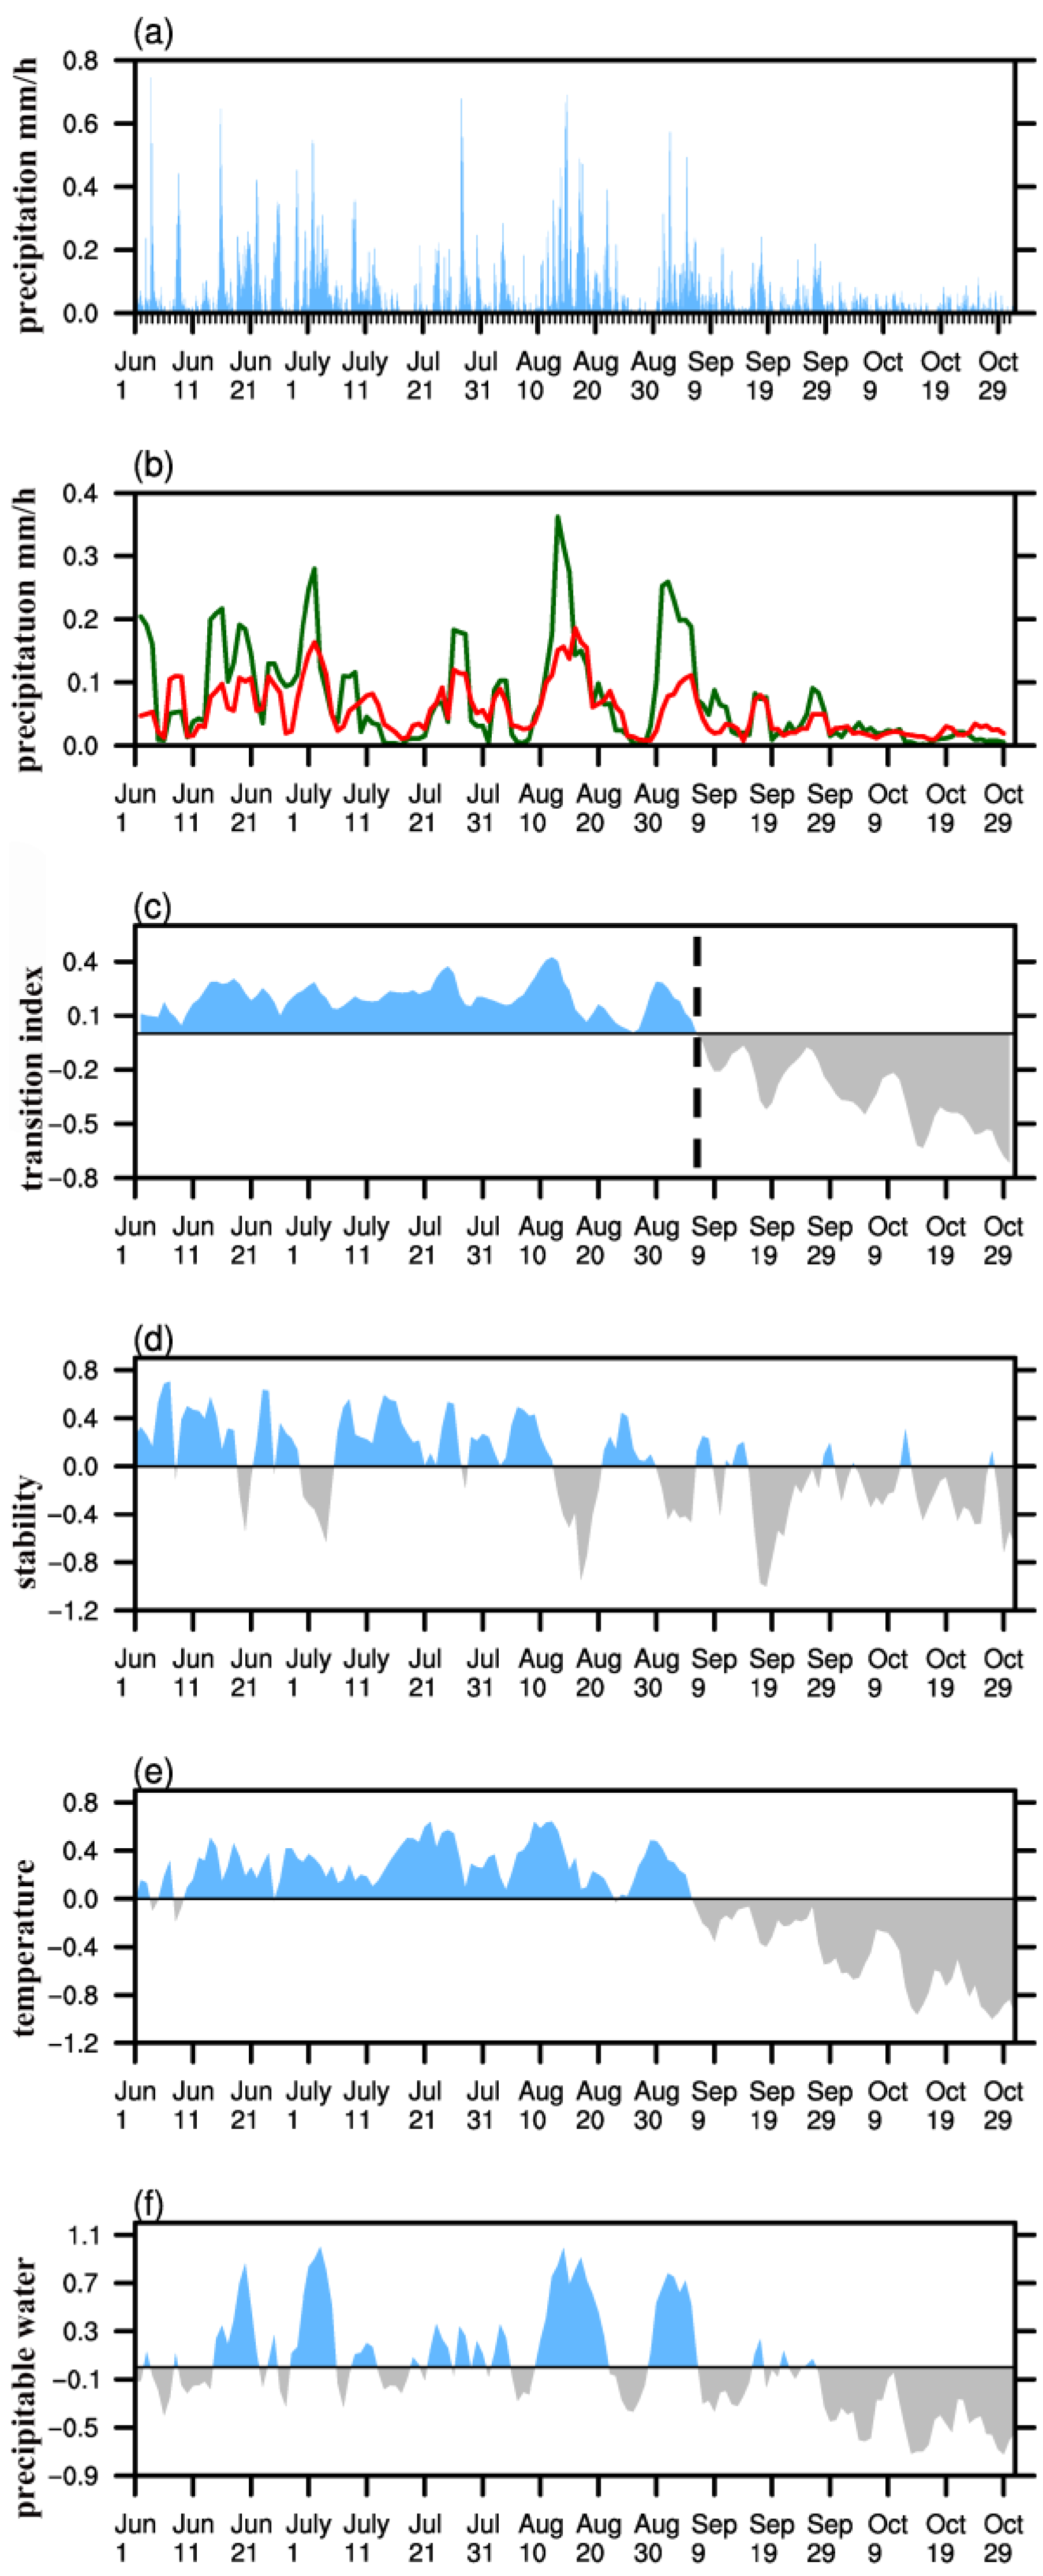
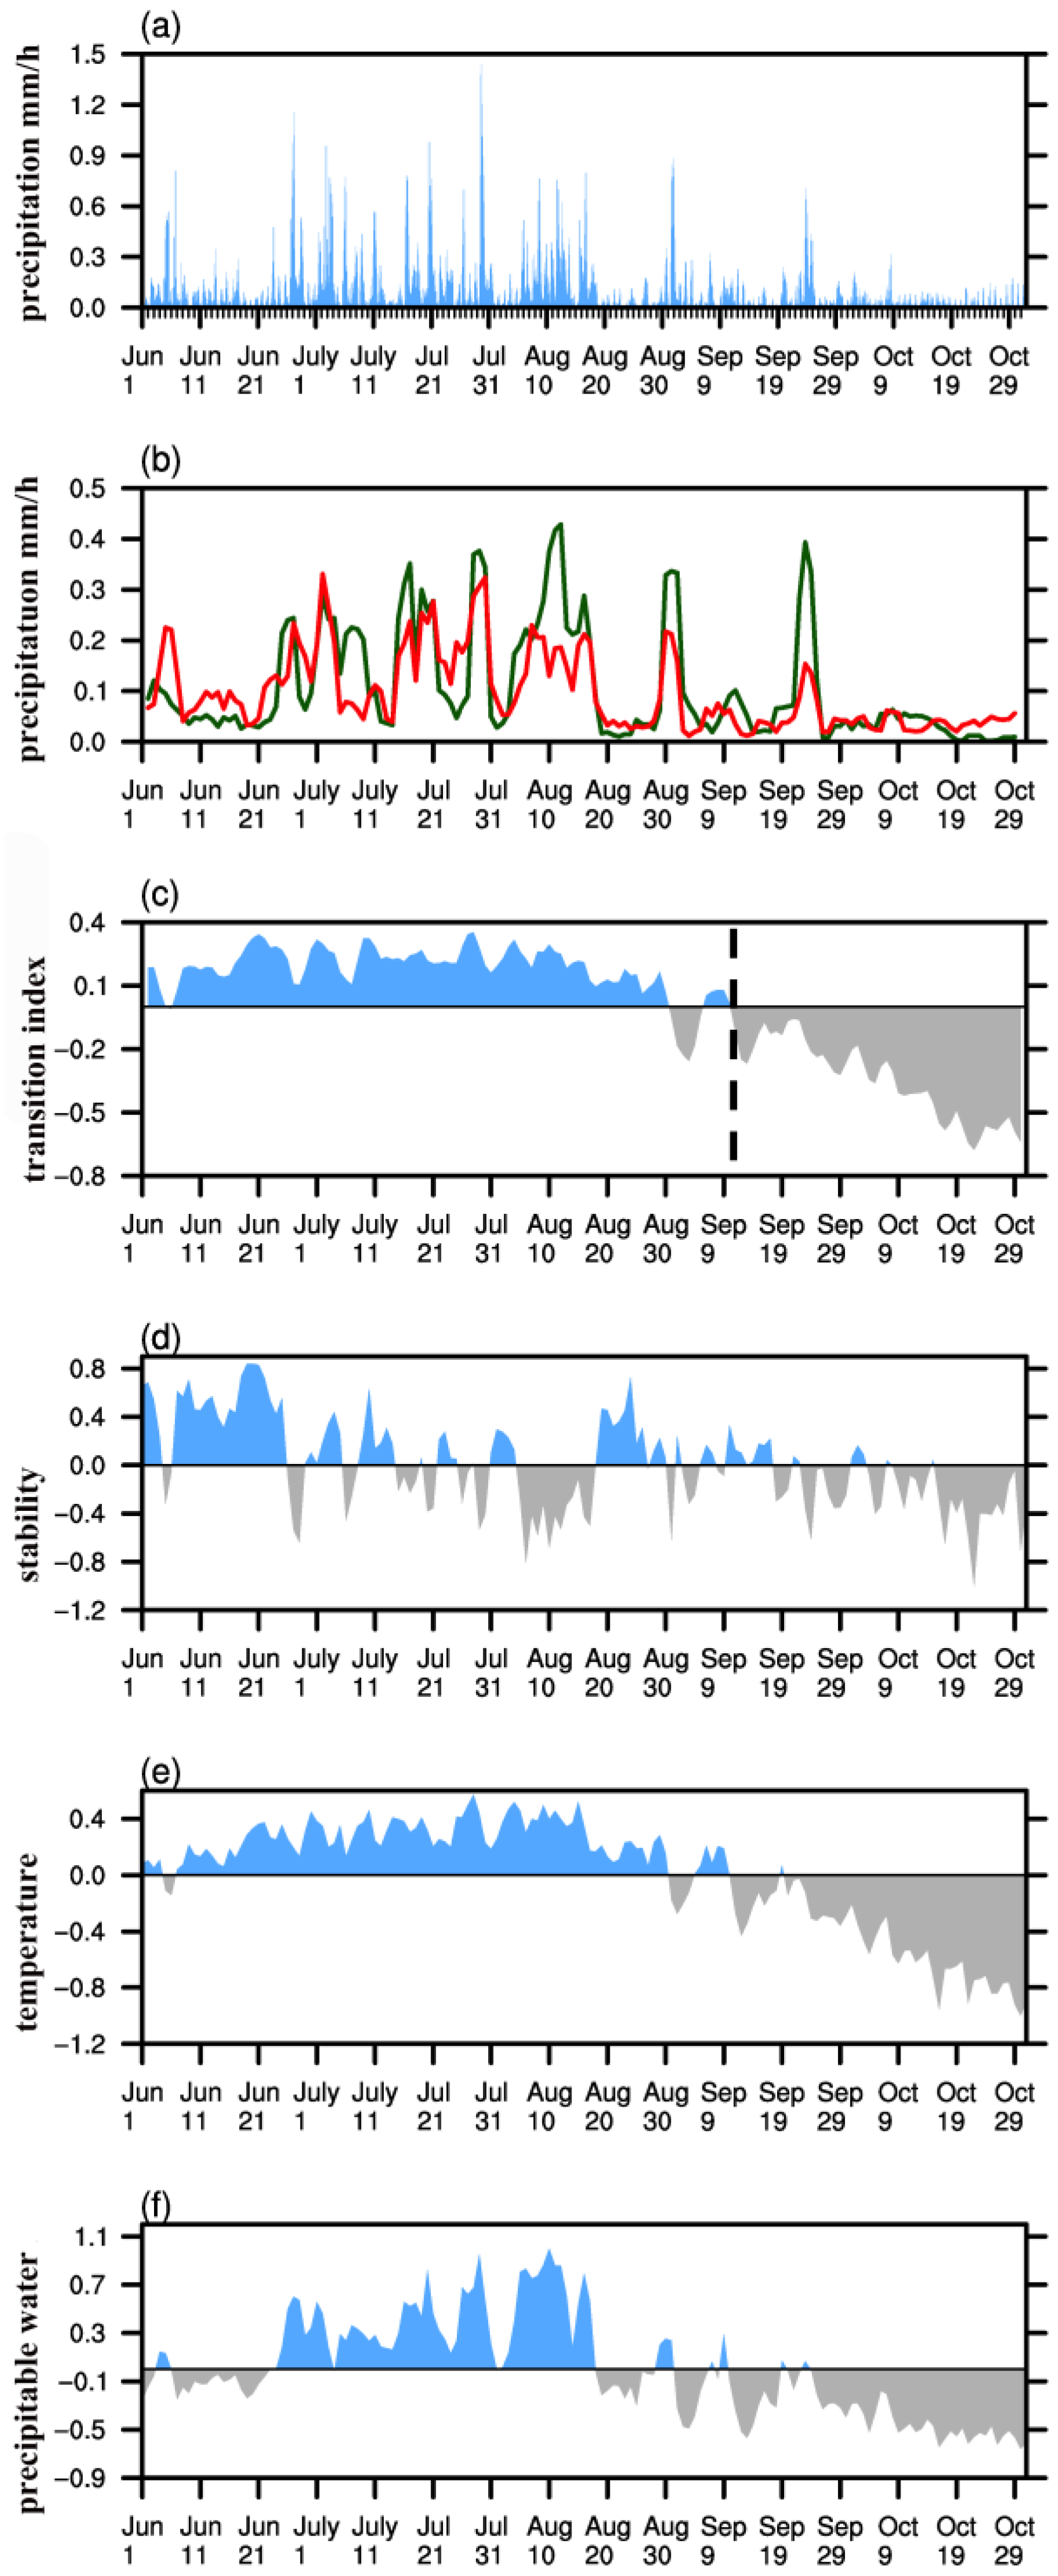
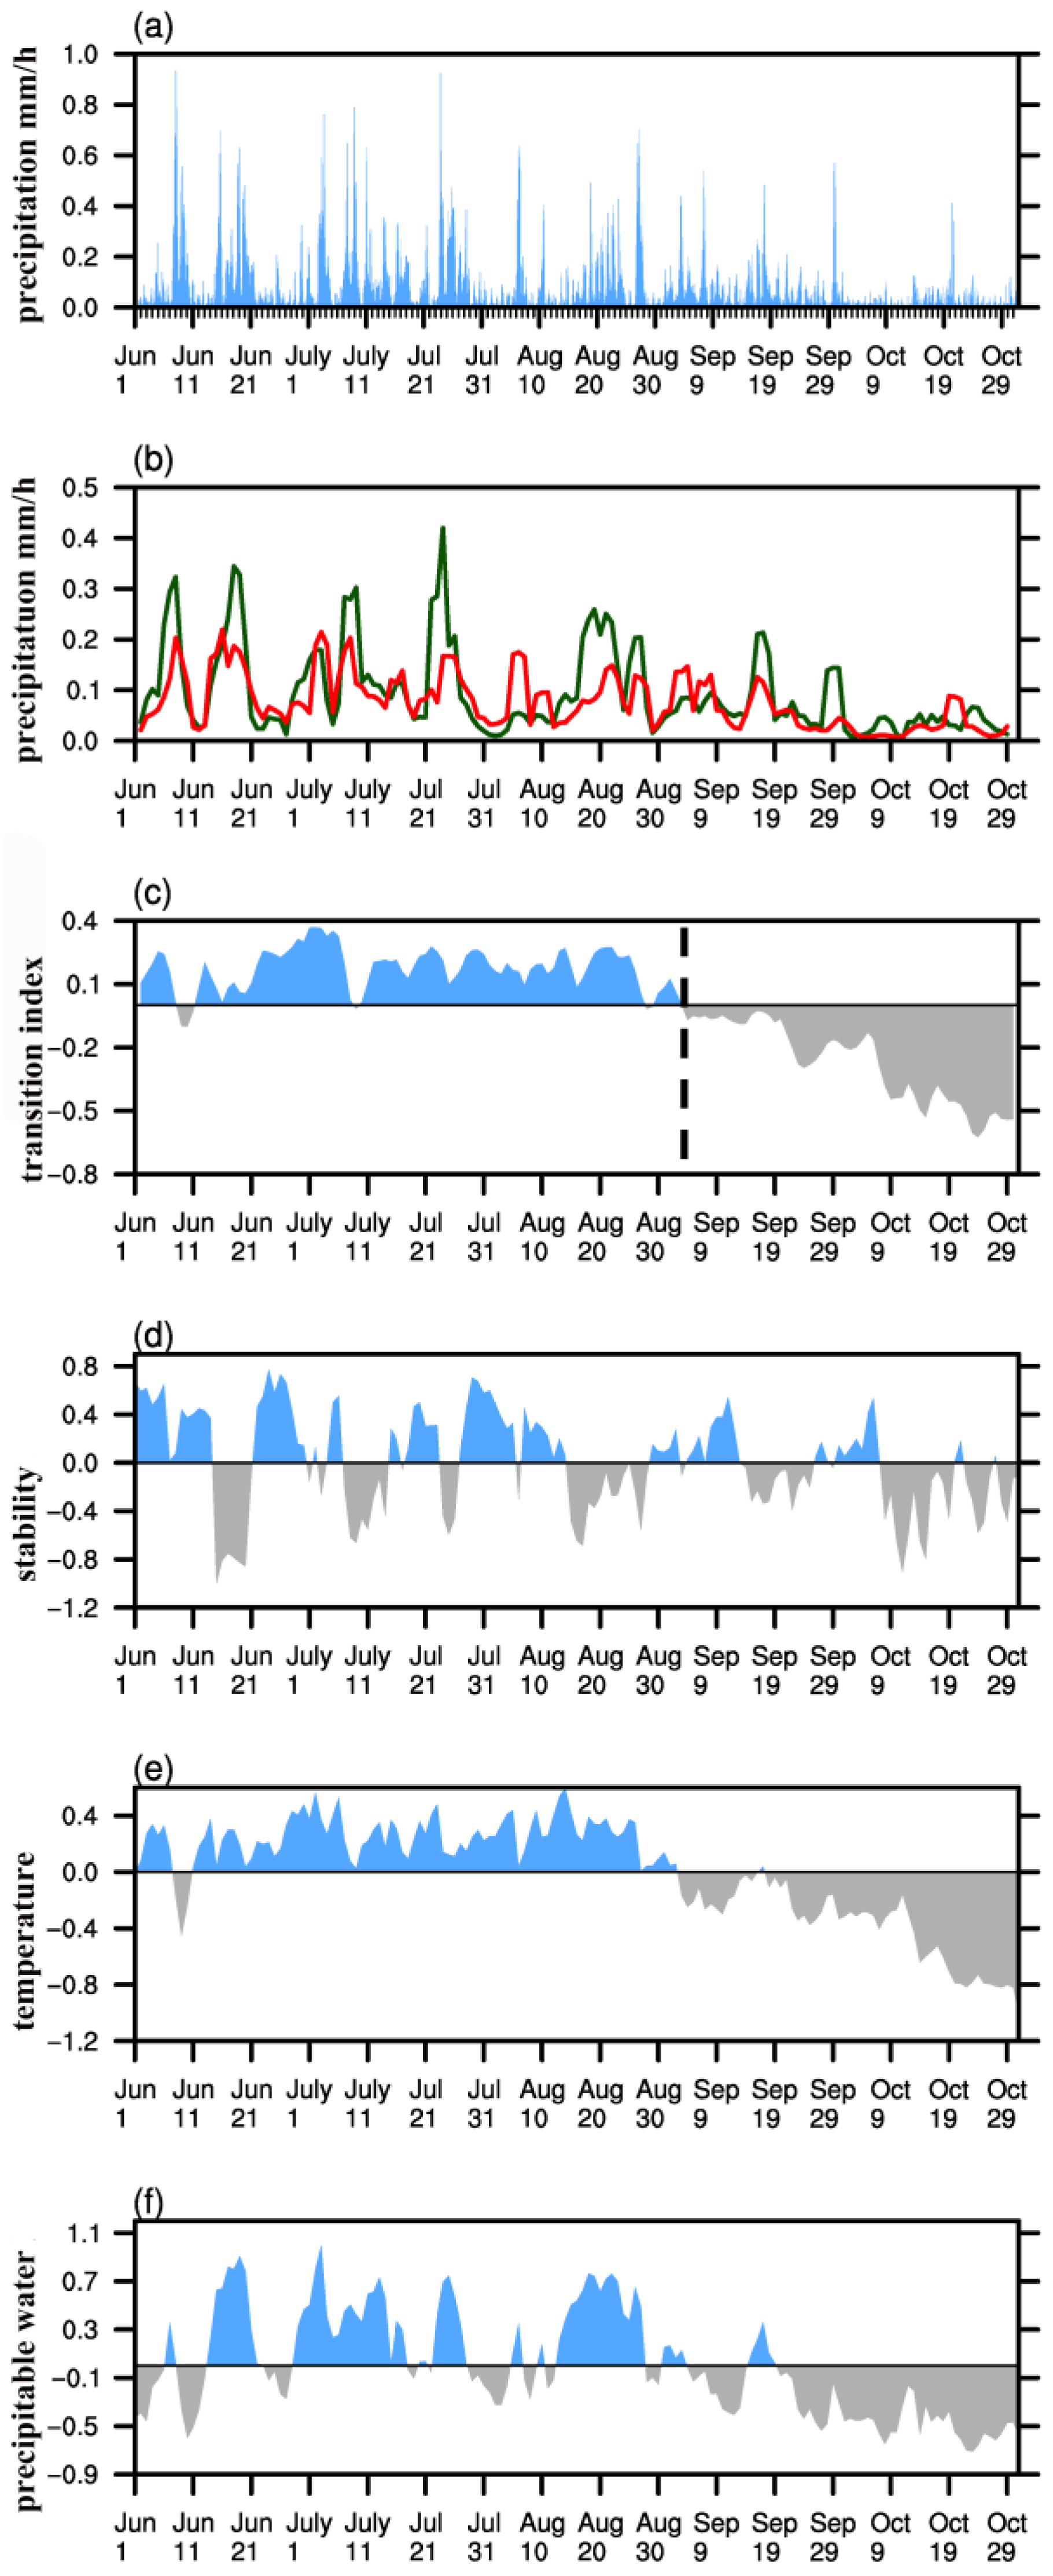
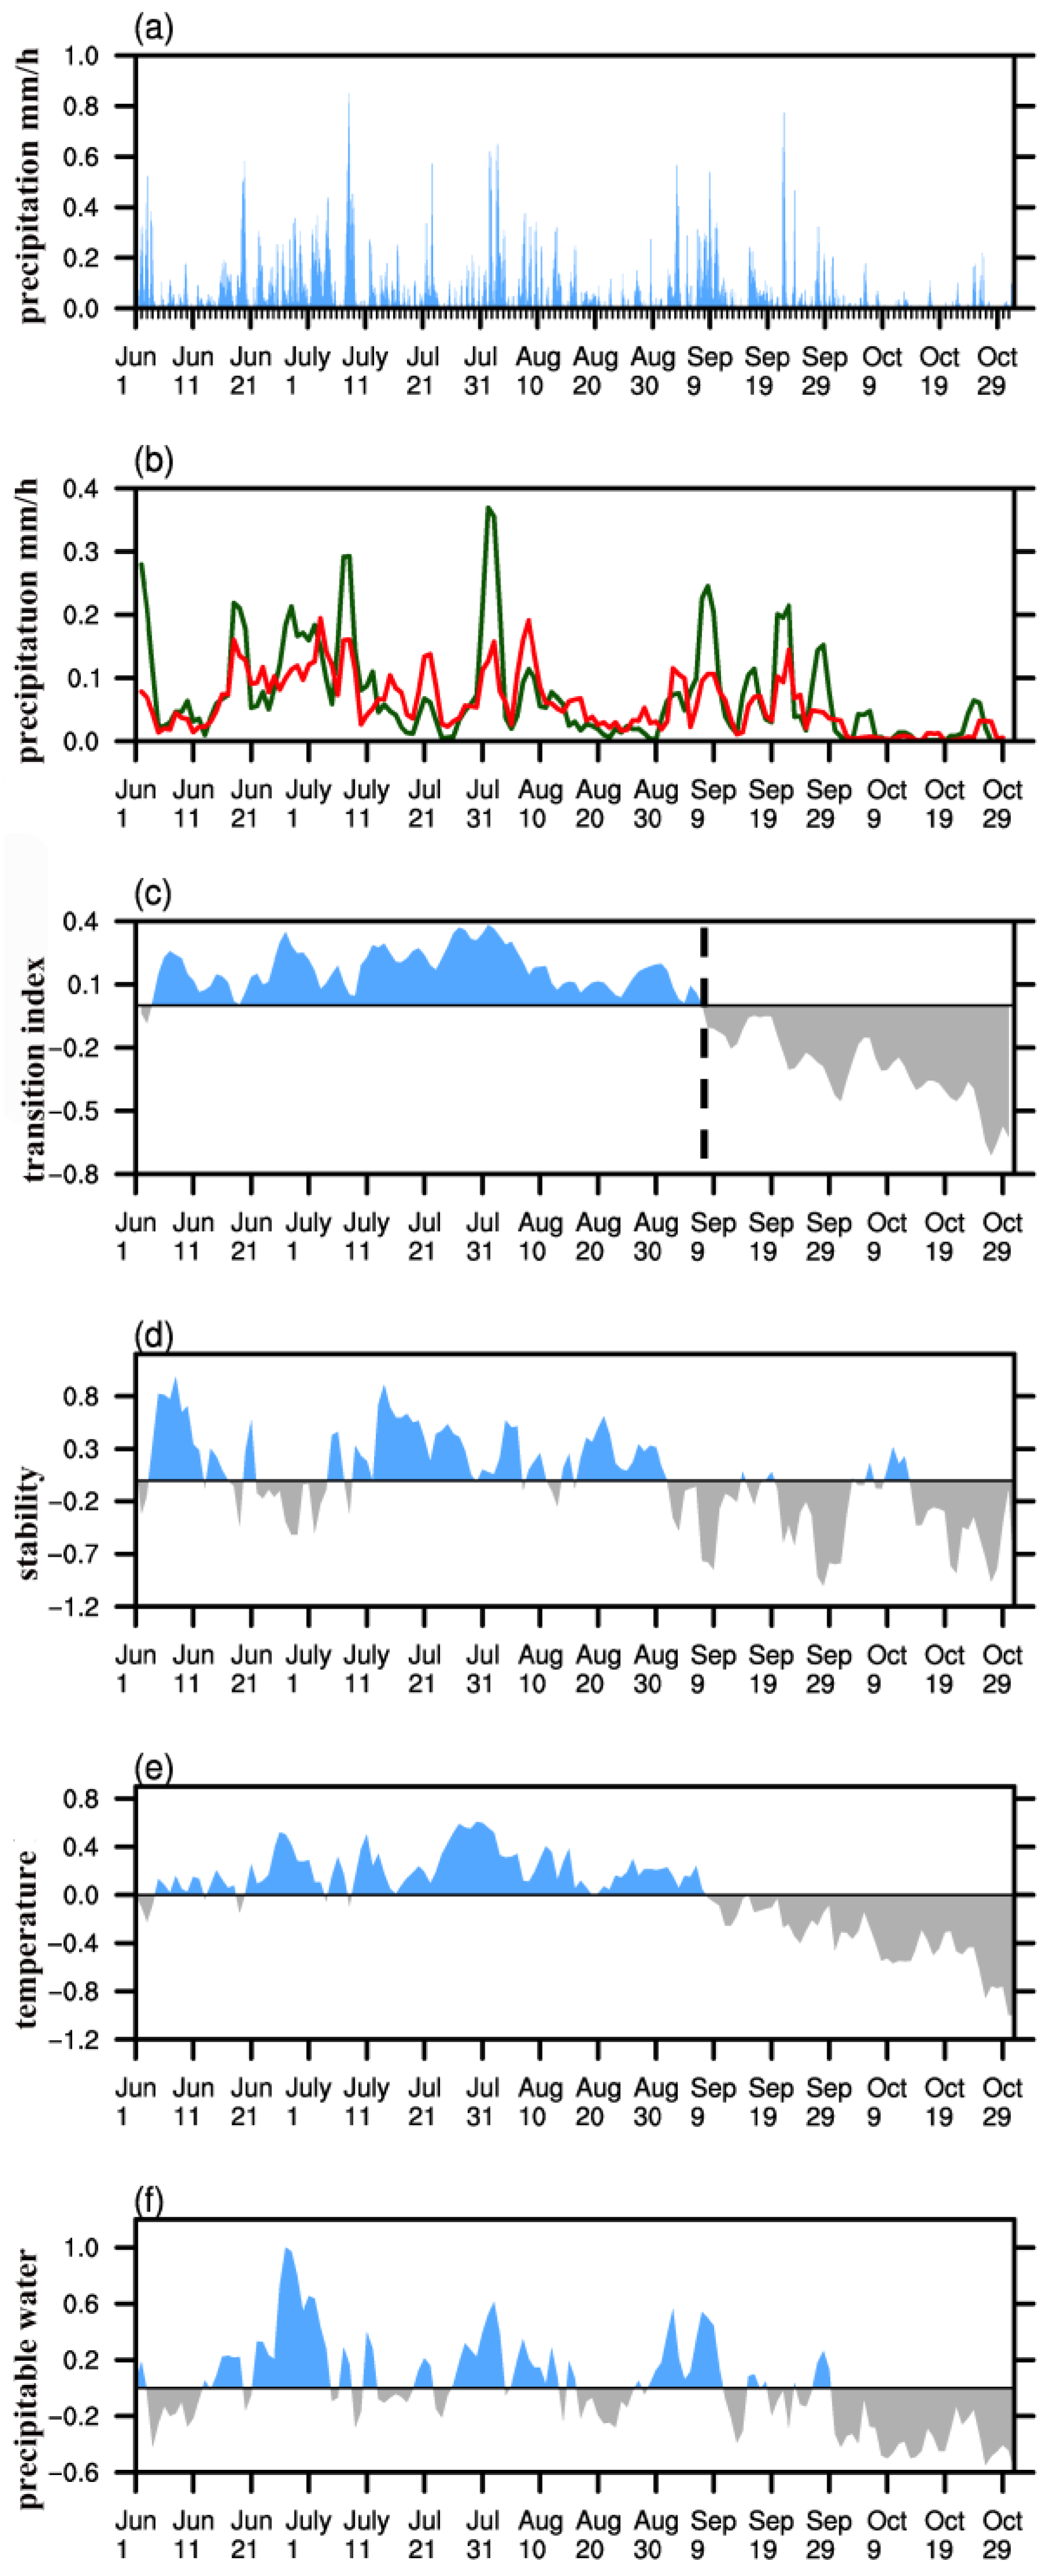
3.1. Warm Season Rainfall Patterns over the Northeastern Tibetan Plateau

The hourly rainfall of the 2013 June–October season averaged over the northeastern Tibetan Plateau (97–103° E, 34–40° N) is shown in Figure 2a. It suggests that diurnal rainfall was common during the warm season, and a number of rainfall events were severe. For example, five domain averaged nighttime rainfall peaks occurred before August 20, as shown by the dark green line in Figure 2b. Note that all 360 grid points within the study domain were used for calculating the precipitation averages whether precipitation occurred in the grids or not. Figure A1 in the Appendix material provides a snapshot example from a precipitation event. The timing of these nighttime rainfall occurrences over the northeastern Tibetan Plateau was consistent with previous studies [3,6,8]. During the summer monsoon season, low-level convergence over the Tibetan Plateau associated with surface heating produces what is known as the “sensible heat driven air-pump” (SHAP) [30,31]. The SHAP mechanism suggests that summer precipitation should predominantly be daytime convective rainfall, though most of the severe events occurred during the night. As reported by Liu et al. (2009), the gradient between solar diurnal heating over the Tibetan Plateau edges and the atmosphere surrounding the plateau can induce strong nighttime upward vertical velocities [3]. The surface sensible heat fluxes over Tibetan Plateau have a large diurnal cycle, with a positive peak near local noon and negative value during the night [32,33]. In other words, daytime convection over the edge of the Tibetan Plateau could be forced by both SHAP and the daytime secondary circulation mountain-valley wind system that is caused by the thermal contrast between Tibetan Plateau edges and the surrounding atmosphere, while nighttime convection may only be influenced by the nocturnal mountain-valley wind system [34,35,36]. Bao et al. (2011) [8] also found nighttime maximum of upward vertical velocity over eastern Tibetan Plateau during the summer monsoon season. Thus, a possible cause for severe nighttime precipitation is that of convection initiated during the daytime, which is then intensified by nighttime vertical motion induced by the thermally driven circulation between the Tibetan Plateau and the surrounding region.
There appears to be a transition of diurnal rainfall activity that takes place somewhere towards the end of the monsoon season around August. Since surface temperature, atmospheric stability (between the surface and 500 hPa), and moisture are important factors in the initiation of summer convective rainfall, we derived a domain-averaged transition index (TI), which includes 2-m air temperature ( T 2 m ), atmospheric stability (2 m air temperature minus 500 hPa temperature, γ 500 ), and atmospheric column precipitable water ( P W ) from the ERA-Interim; these were computed using the study area defined as the white box in Figure 1a (97–103° E, 34–40° N). The utility of this TI is to detect the change in the atmospheric thermal condition during the monsoon season. Here, TI is defined as the combination of the normalized T 2 m , γ 500 , and P W to detect the potential for diurnal convection,
TI = T 2 m + γ 500 + P W .
Based on the domain-averaged TI, warm season rainfall events during 2010–2015 were further analyzed to understand their variation before and after a defined transition date, similar to that shown for summer 2013 (Figure 2a,b). As shown in Figure 2e and Appendix Figure A2, Figure A3, Figure A4, Figure A5, Figure A6 and Figure A7, TI appeared to depict the transition day quite objectively, highlighting the day in which the first persistent negative TI values start. For 2013, the transition date (day 0) occurred on September 4 (black dashed lines in Figure 2a,b). Similarly, the transition dates for the other years were found, as shown in Appendix Figure A2, Figure A3, Figure A4, Figure A5, Figure A6 and Figure A7: 21 September 2010, 6 September 2011, 11 September 2012, 12 September 2014, and 7 September 2015 (also shown in these sets of figures are the precipitation and TI evolutions for each year). Next, the composite analysis was conducted using 110 days of precipitation from each year: the first step was to identify the transition day, or “day 0”, separating the earlier part of the warm season, marked by episodes of active nighttime convection shifts, to the latter, prolonged inactive period of the season. The composites were created using a timeline based on the transition date (day 0) from the individual years and then plotted 70 days before and 40 days after the transition. The six-year composites for precipitation, diurnal rainfall and TI for the study domain are shown in Figure 2c–e, respectively.
Figure 2c shows the composite hourly precipitation, where large precipitation events are more frequent before the composite transition than after (the transition is depicted by a black dashed line in Figure 2). The composite nighttime rainfall (dark green line in Figure 2d) shows that one of the highest amounts of diurnal rainfall occurred around day −43, coinciding with the peak in the composite TI (Figure 2e). In other words, increased TI before the transition date was generally associated with increased nighttime rainfall. This was concurrent with enhanced convective instability due to higher atmospheric instability and higher precipitable water values (shown below). Although nighttime convective events can still occur after the transition date, the maximum magnitude of precipitation became gradually reduced (Figure 2c,d). Figure 2f further shows composite hourly domain averaged precipitation before and after transition. It not only indicates that the diurnal precipitation peak before transition was almost twice that of after the transition date, but also suggests a change in peak precipitation time from late-afternoon before the transition date to midnight afterwards.

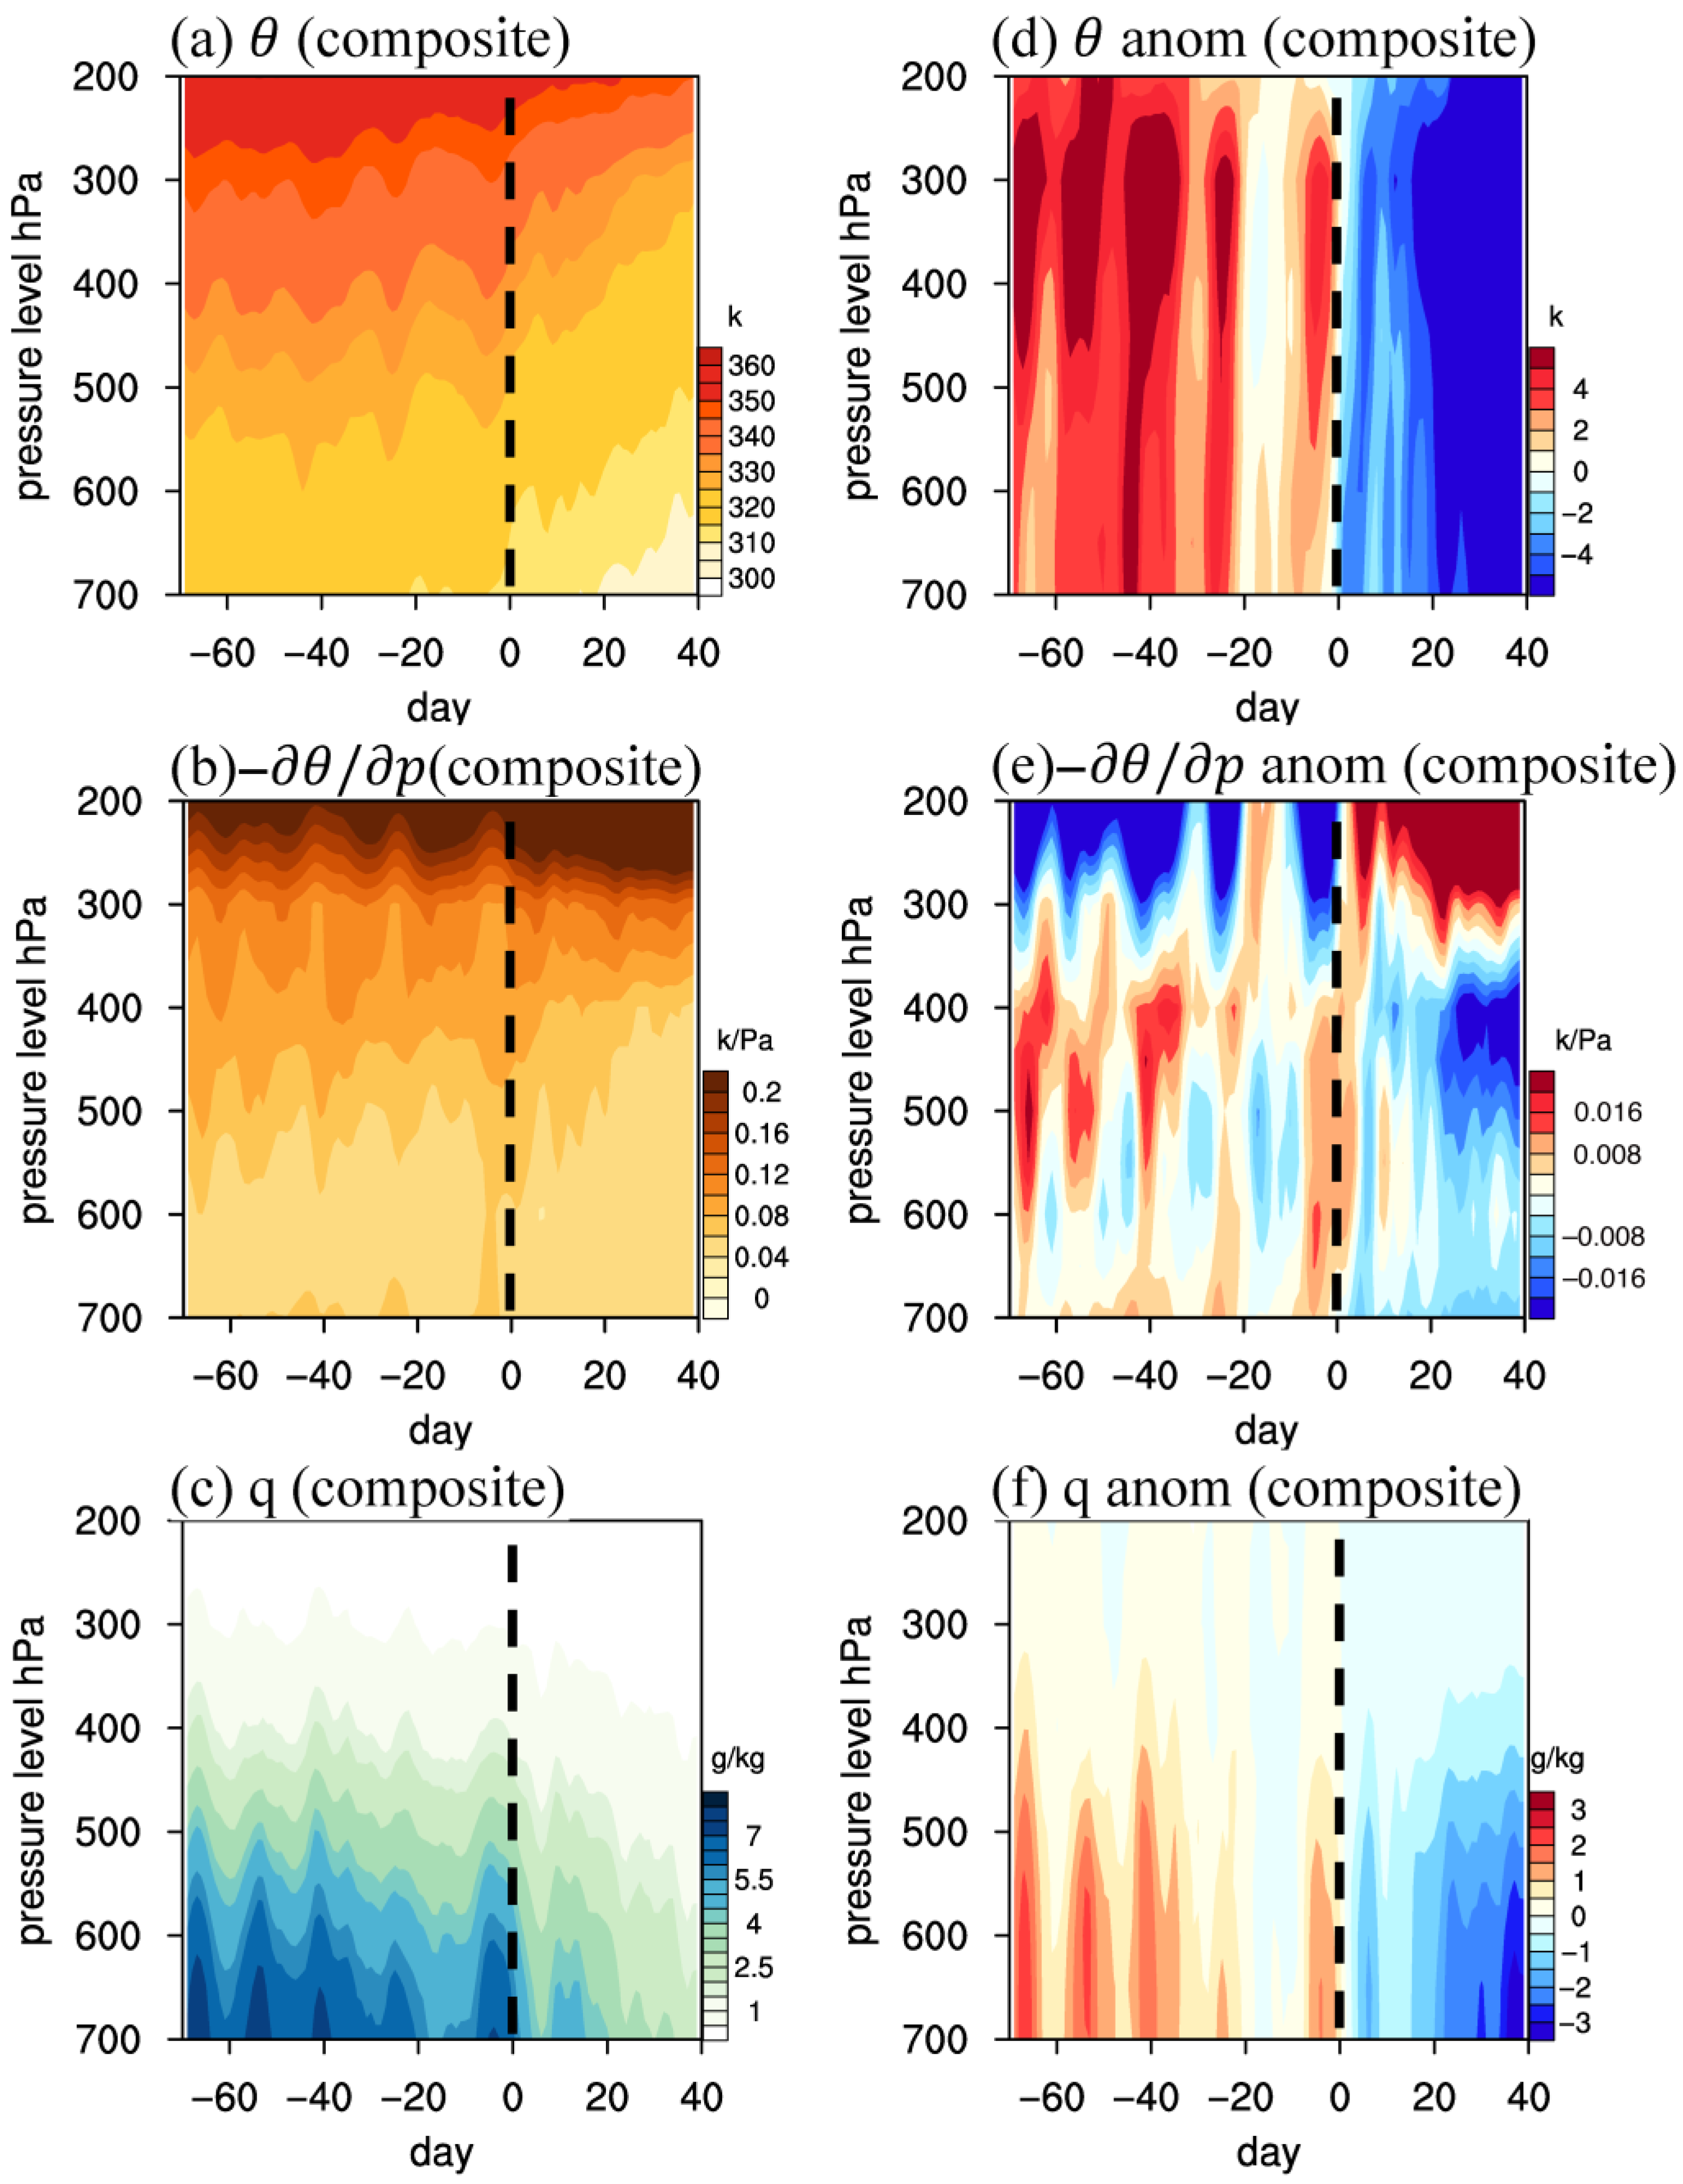
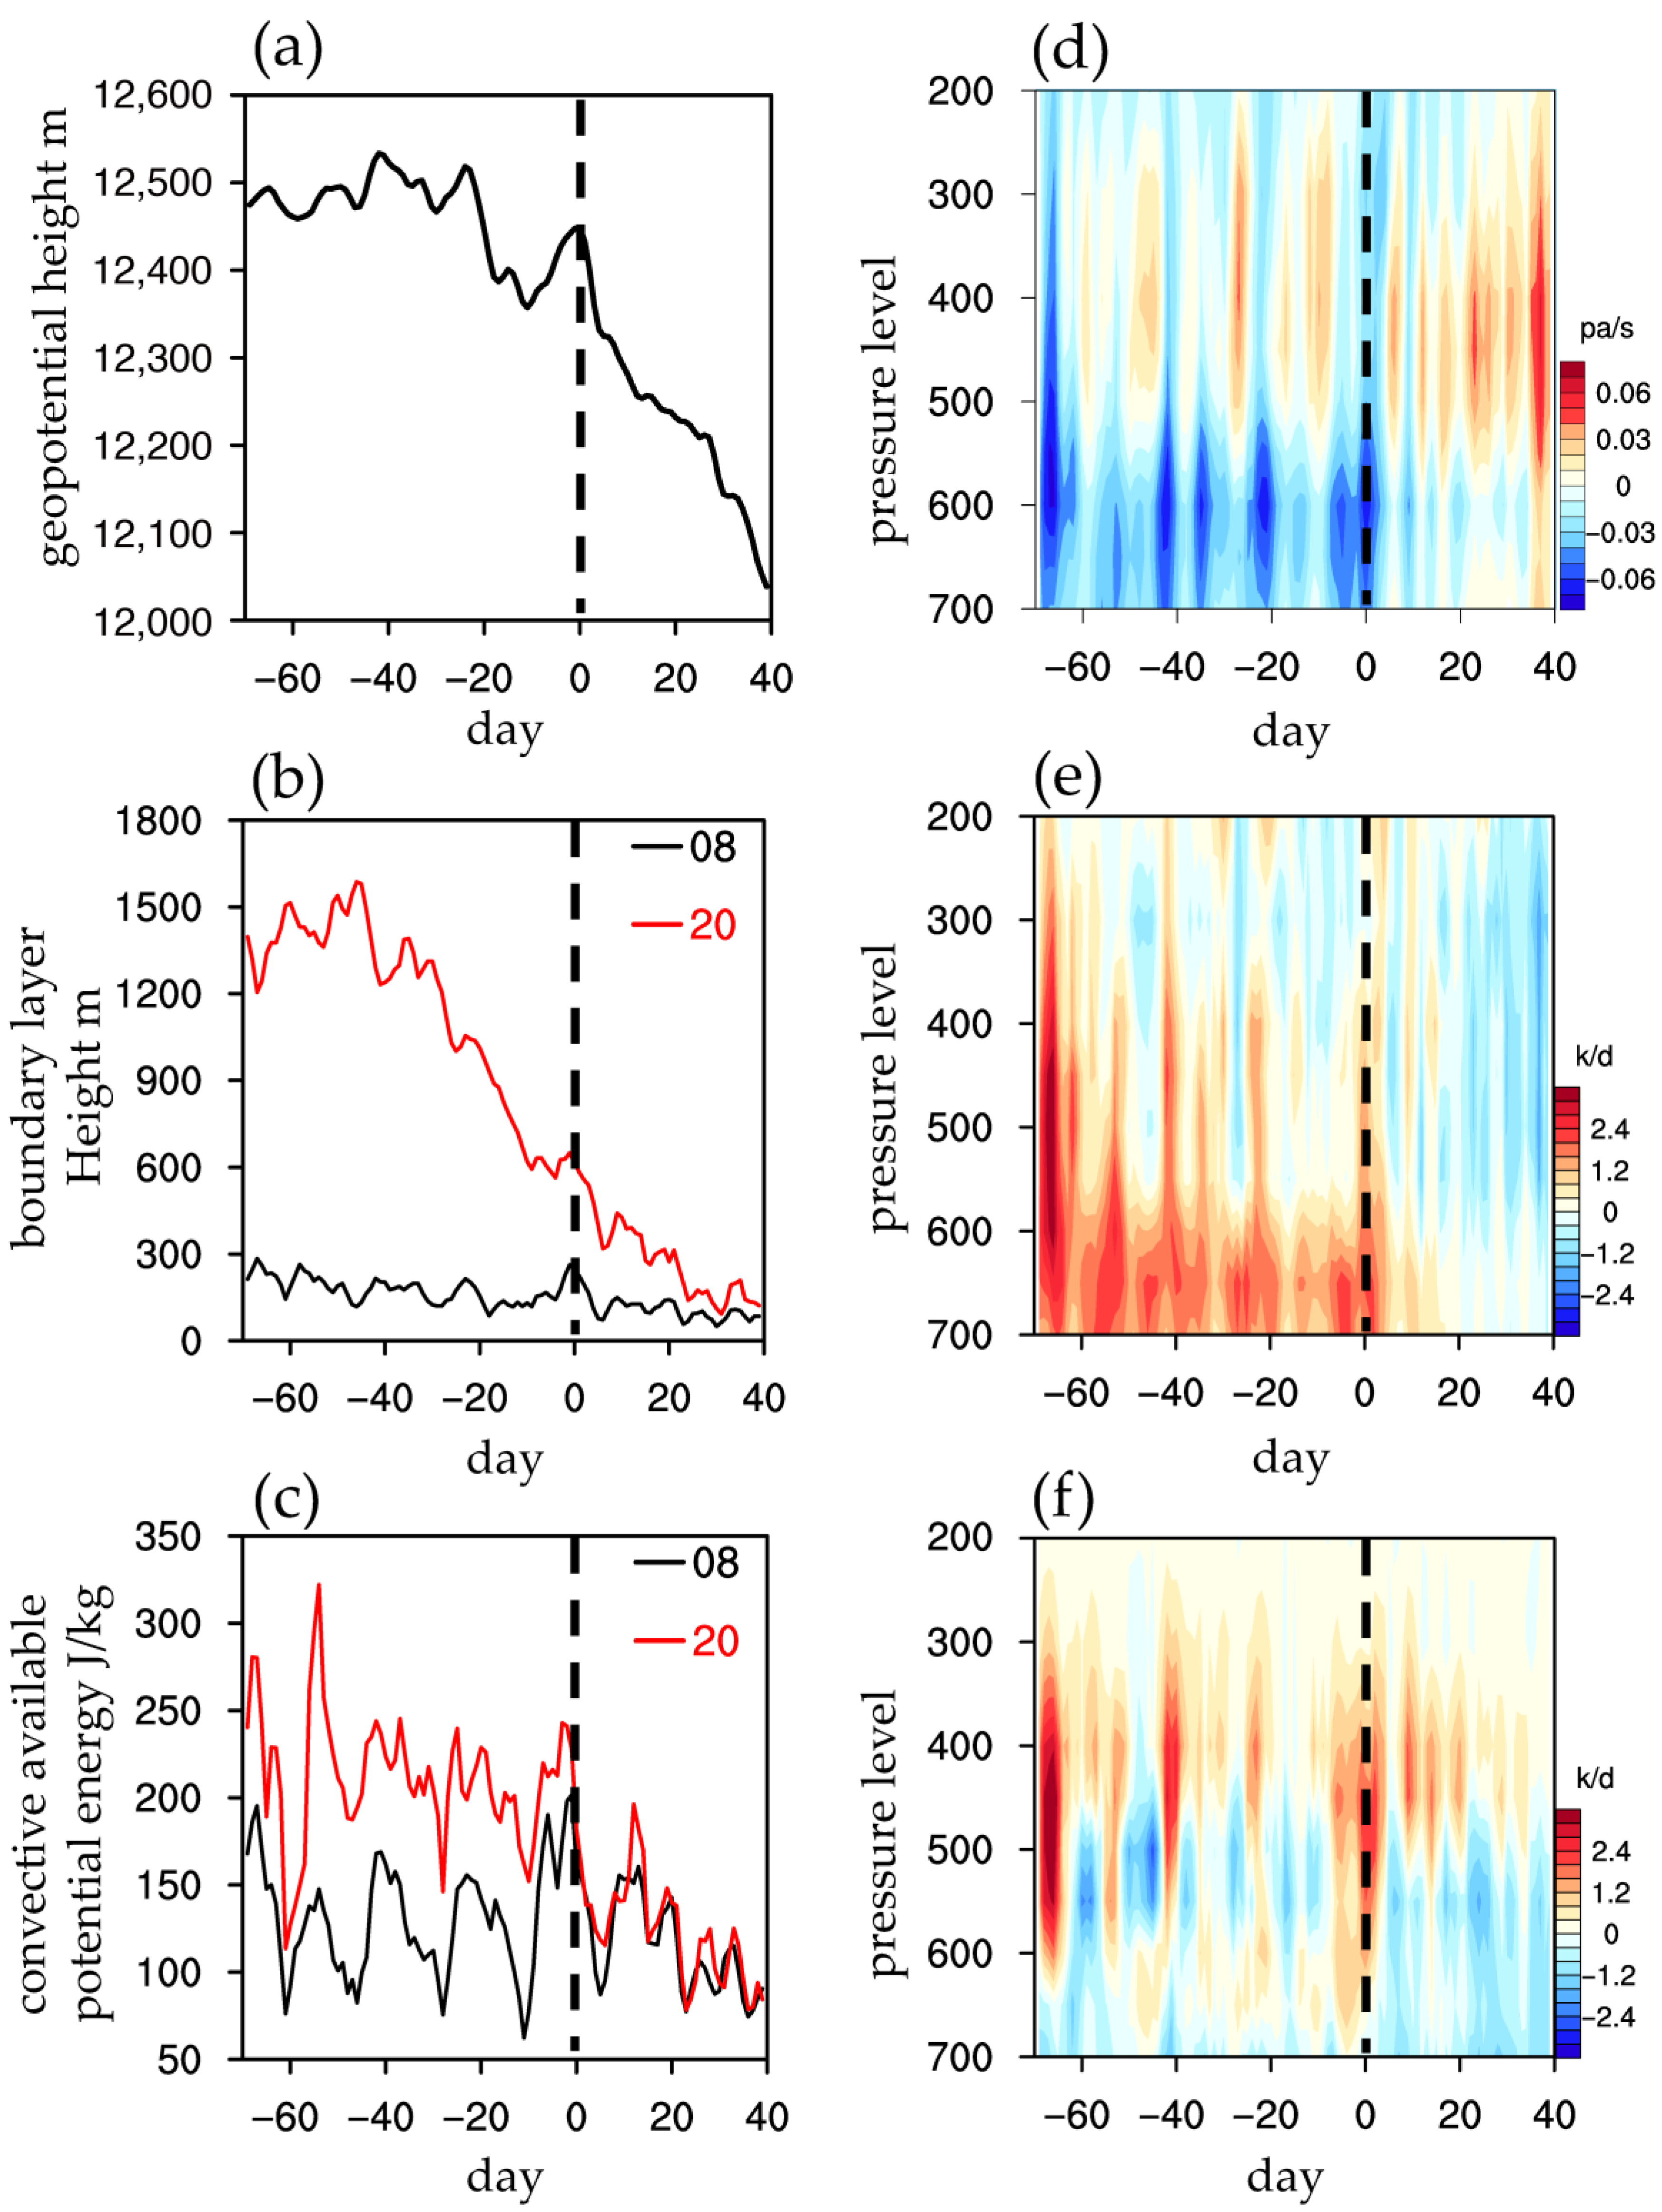
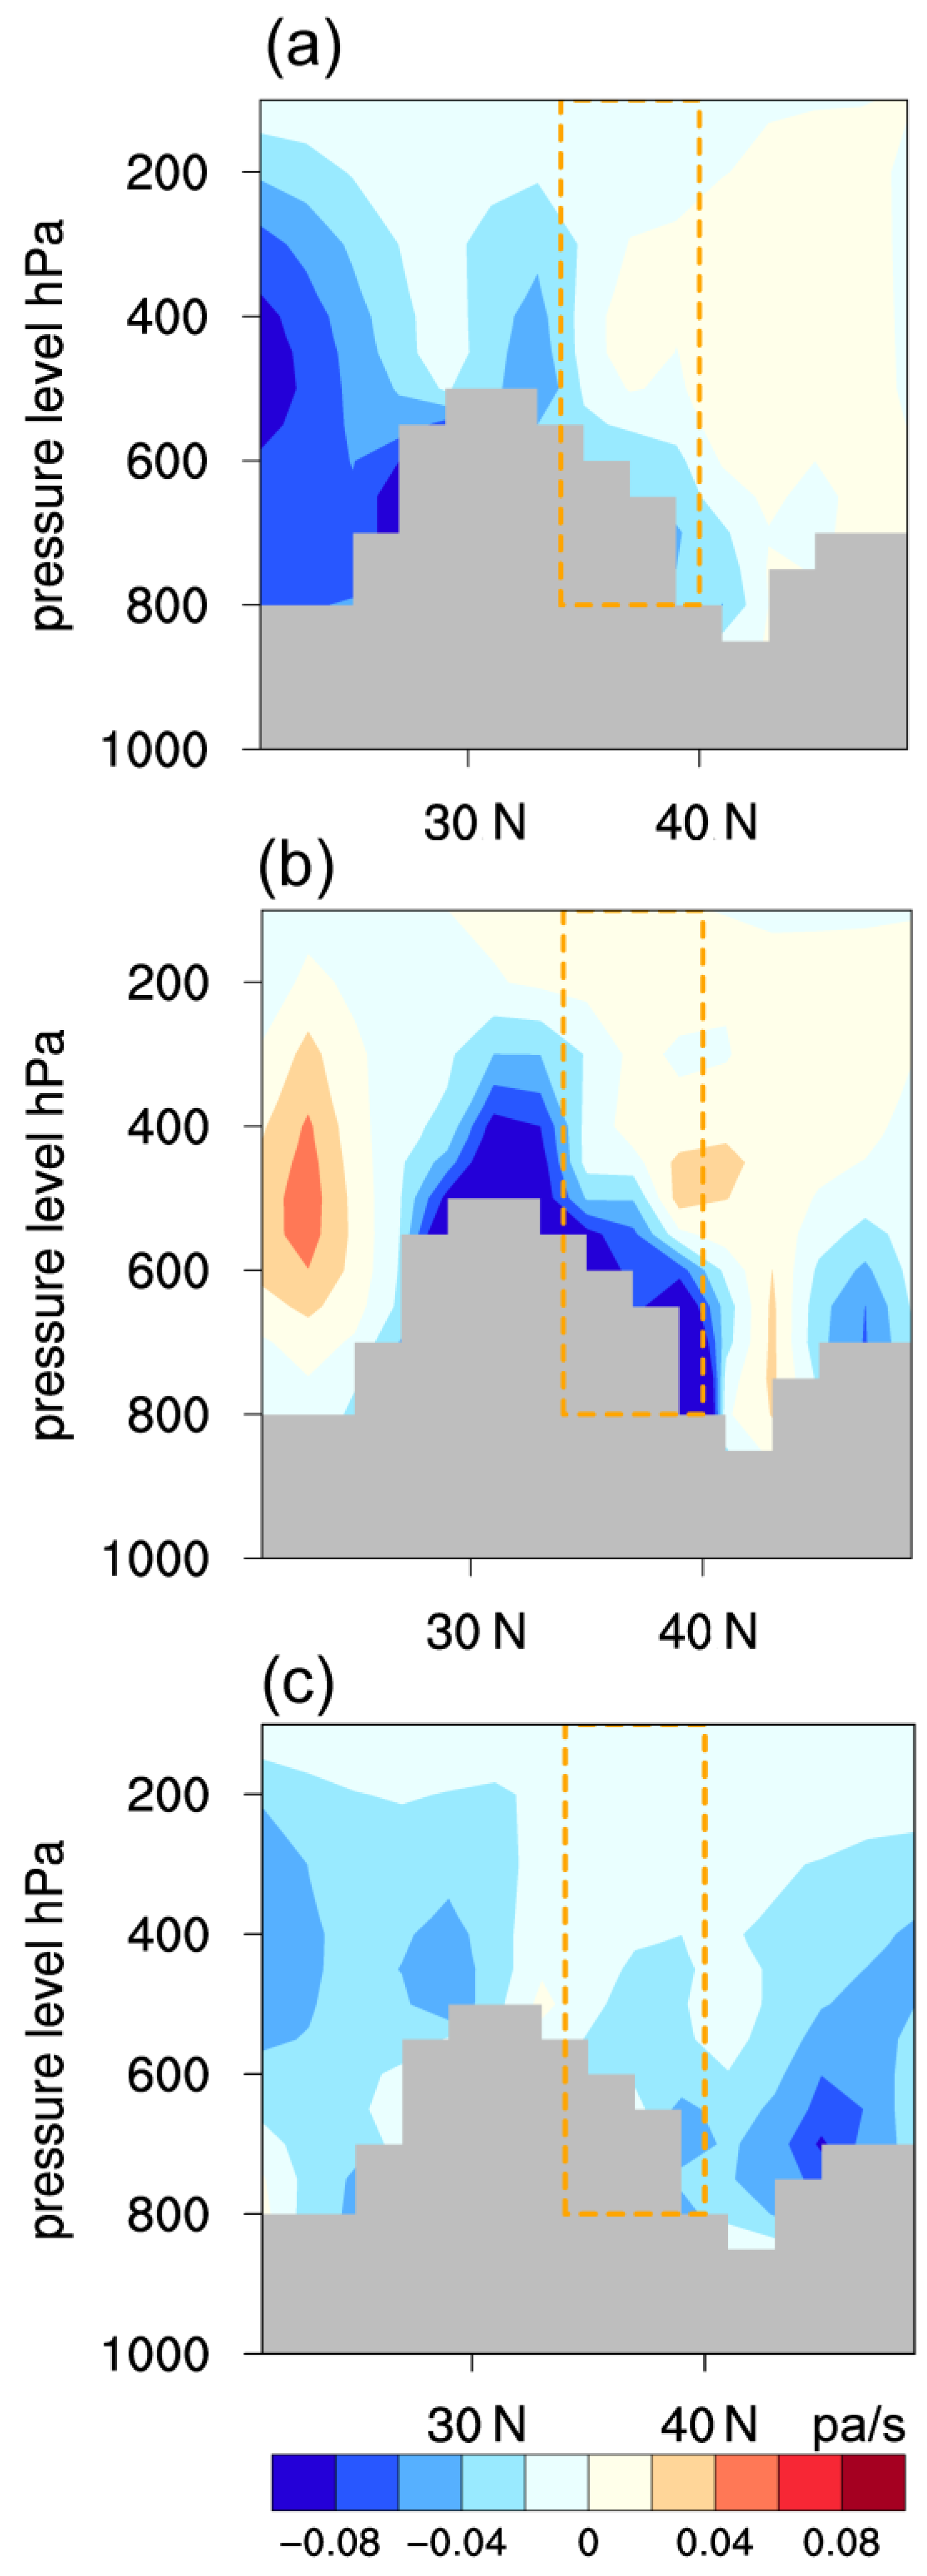
3.2. Atmospheric Circulation Associated with Increased Precipitation

To understand the thermodynamic differences in the atmosphere over the northeastern Tibetan Plateau before and after the transition date, we also conducted composite analyses for potential temperature ( θ ), static stability ( θ / p ), and specific humidity (q), shown in Figure 3a–c. This was done at each pressure level over the domain of the northeastern Tibetan Plateau. The results show a striking difference in the atmospheric thermal structure with respect to the transition. First, a warmer and thicker atmosphere was observed before day 0 (Figure 3a). From day −70 to 0, a uniformly positive anomaly in θ appeared between the levels of 700 and 200 hPa, with the highest values around 300 hPa. Note that anomaly was calculated by removing the mean of 2010–2015, which would then make the composite anomaly to be 0. These anomalies then became negative immediately after the transition date (Figure 3d). A warmer atmosphere potentially supports more water vapor, so the warmer air prior to day 0 contributes to the potential for convective rainfall. The composite static stability (Figure 3b,e) shows that a negative–positive–negative pattern existed from lower levels (600 hPa) to upper levels (200 hPa). This feature seems counterintuitive to the elevated diurnal convection before day 0, however, it does support the notion and previous finding that the nighttime peak in rainfall is associated with regional-scale lift due to terrain-ambient air interaction.
With the assumption that mechanical lift promotes nighttime convection events (see Introduction), sufficient water vapor is an additional necessary condition for precipitation. From day −70 to 0, an almost uniform increase in the composite specific humidity could be found from 700 to 400 hPa except for weak decline between day −20 and −5, and then a continual decrease after day 0 (Figure 3c,f). These features were consistent with the variation in potential temperature in the boundary layer over the northeastern Tibetan Plateau, suggesting a similar tendency for conditional instability.

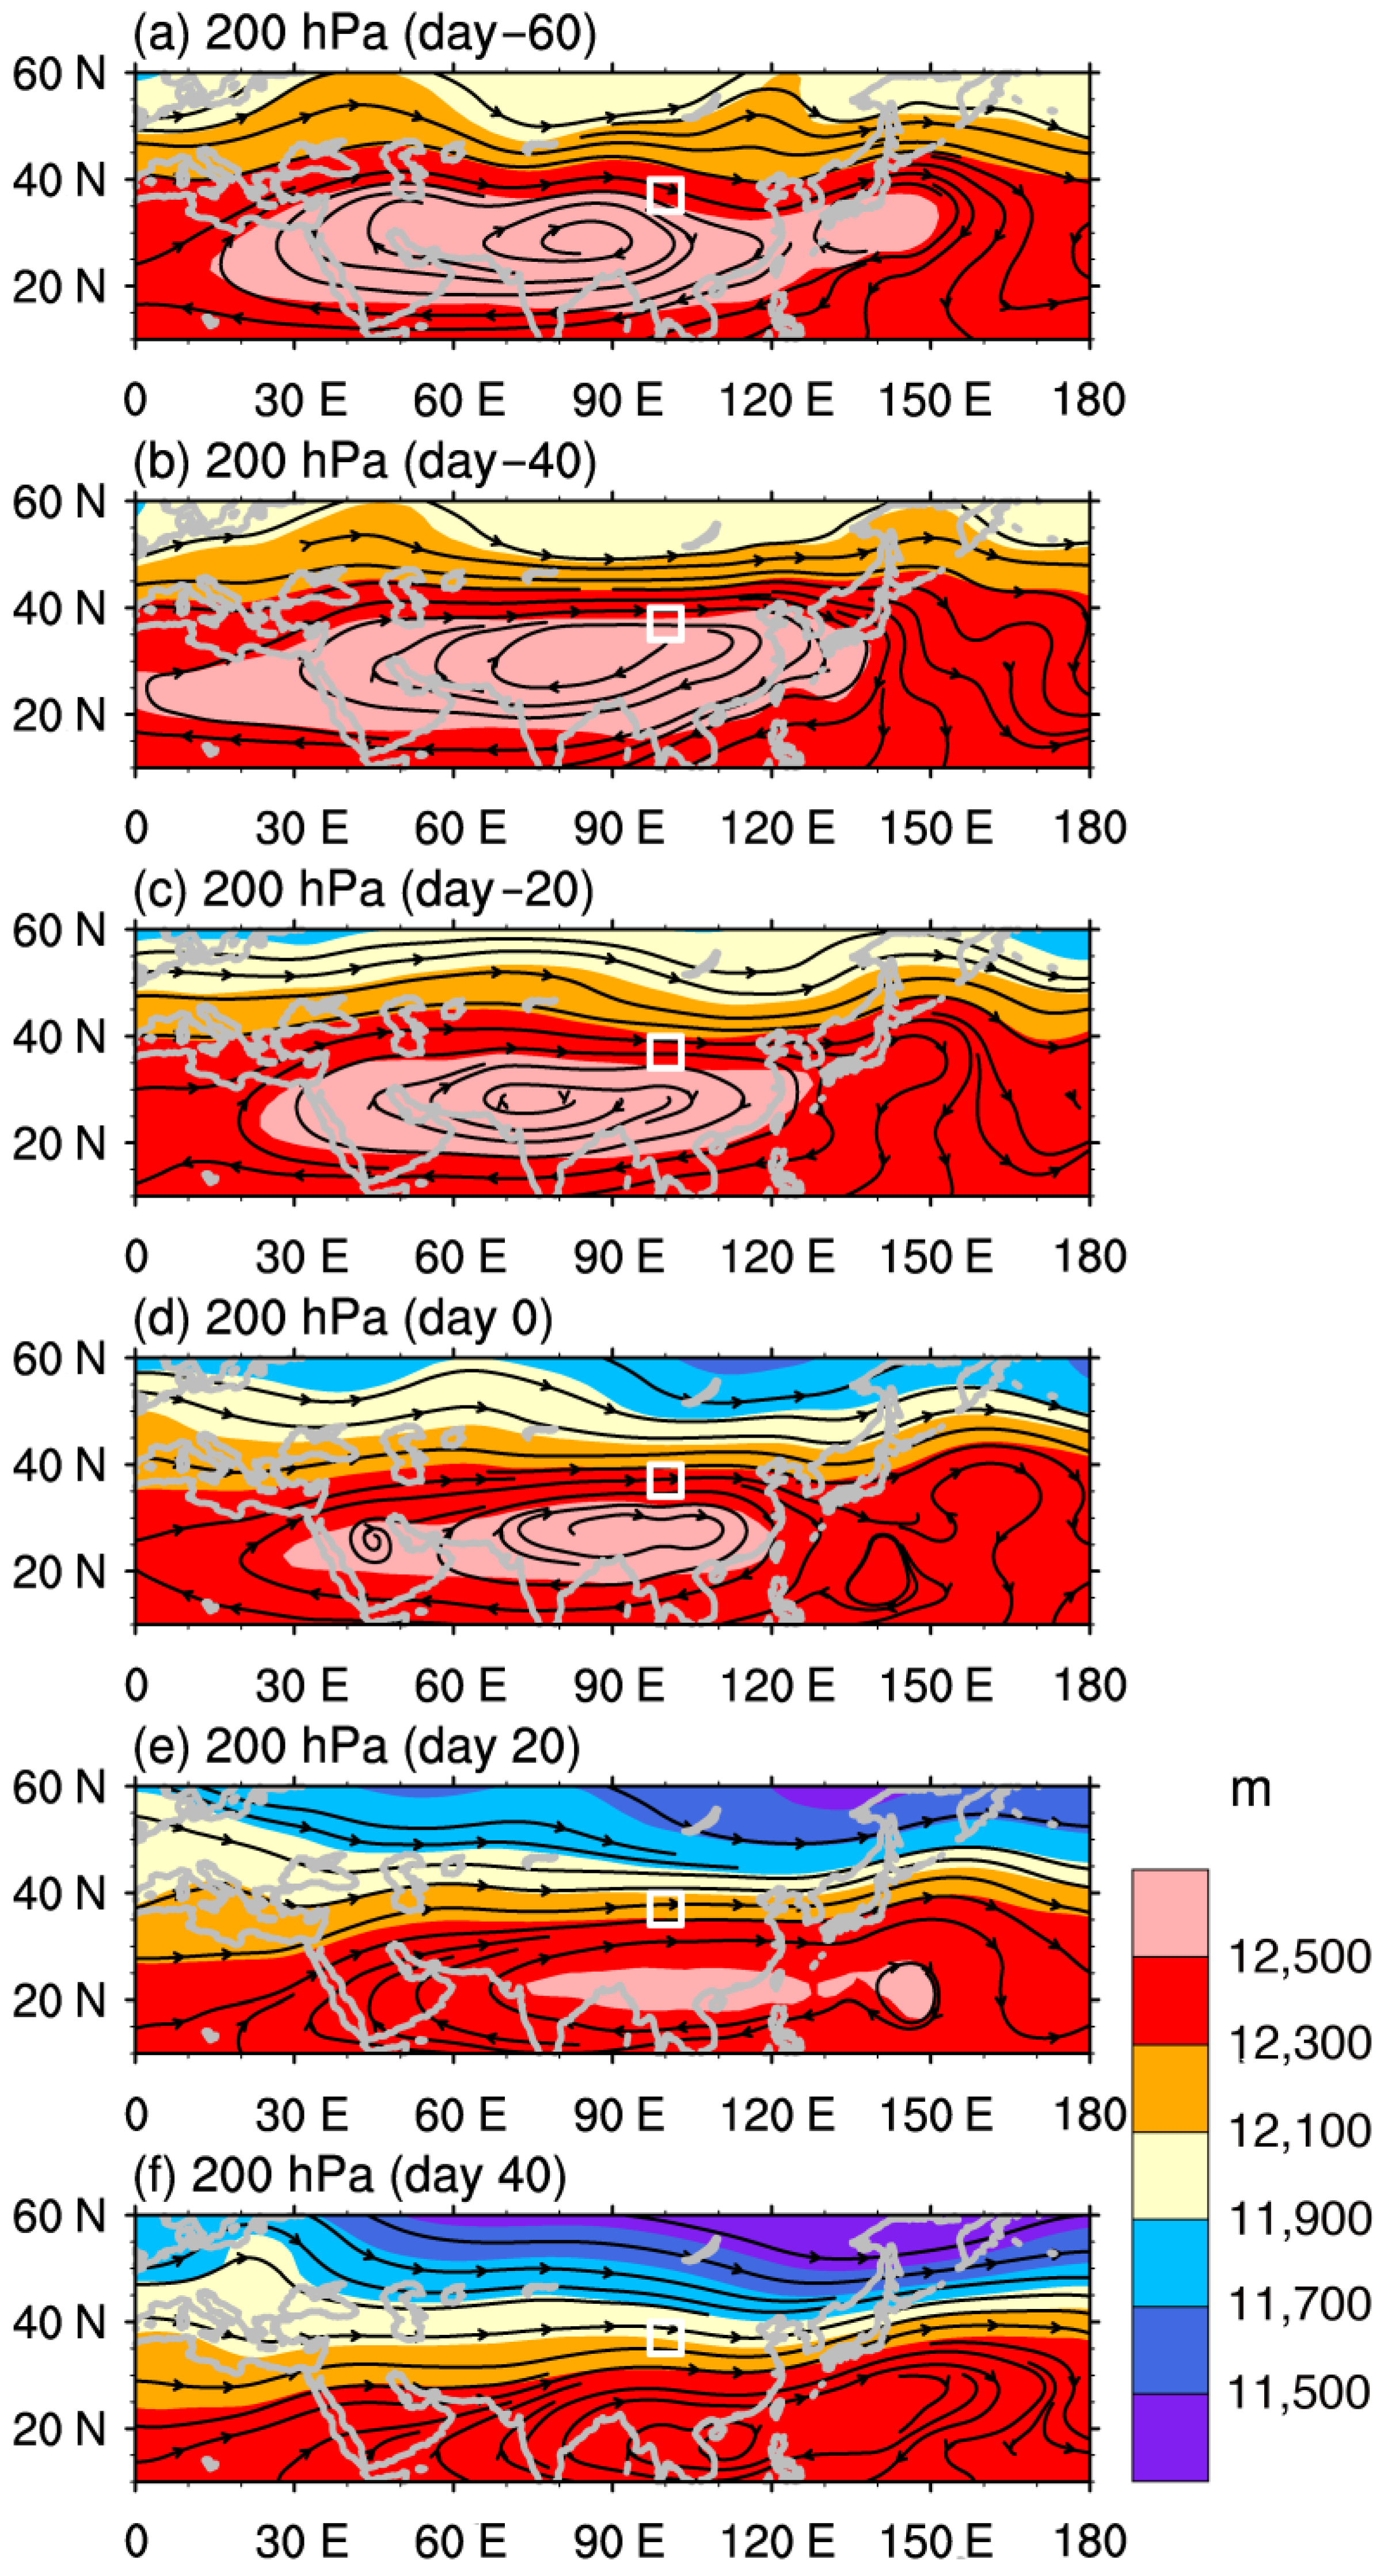
3.3. Relationship with the South Asian High

To examine the relationship between the enhanced diurnal rainfall events and the dynamical structure of the atmosphere, we applied the same composite method to 200 hPa geopotential height. Based on the composite evolution of upper-level geopotential height over the northeastern Tibetan Plateau (Figure 4a), the largest height magnitude occurred on day −40 and then weakened after the transition. The increased 200 hPa geopotential height around day −70, −40, −20, and 0 was consistent with the enhanced upward velocity (Figure 4d). This deepened upward motion and increased upper-level height suggests intensified thermal heating. Consistent with the variance of upper-level geopotential height, the differences of boundary layer height and convective available potential energy (CAPE) between nighttime (20:00, local time, red line in Figure 4b,c) and daytime (8:00, black line in Figure 4b,c) sharply decreased at the same time. These decreases had a negative effect on the formation of nighttime rainfall. With the decreasing boundary layer height and CAPE, it becomes more difficult to initiate convective rainfall. In the warm season, although only lower levels over northeastern Tibetan Plateau were dominated by an upward motion (orange box in Figure 5a), ascending motion, or large-scale lift, it was much stronger during the nighttime. Furthermore, the composite difference over northeastern Tibetan Plateau in vertical velocity before (70 days) and after (40 days) the transition date indicates widespread ascending motion would be crucial lifting condition to initiate nighttime rainfall events (Figure 5c). These results were consistent with Liu et al. (2009). They reported that the relatively shallow upward motions along the northern and southern slope of Tibetan Plateau are the likely result of thermally driven mountain–plain solenoids and/or mechanical forcing [3]. The large-scale lift in the warm season over the north slope of Tibetan Plateau has also been well represented by regional weather models [37]. Based on precipitation, Wu and Qian (1996) found ascending motion prevailed throughout the all pressure layers in wet years, while descending motion was dominant in the middle and upper pressure level in dry years. In other words, nighttime rainfall would be more severe in wet years [38].
Next, we conducted a heat and moisture budget analysis over northeastern Tibetan Plateau for the apparent heat source (Q1) and apparent moisture sink (Q2), based upon the derivation of Yanai et al. (1973) [39]. As shown in Figure 4e, the total diabatic heating (Q1) was always present between 600–700 hPa before day 0 (it even reached 2.4 K/d between 400 and 600 hPa during day −70 to −65). The most distinct difference in Q1 before and after day 0 lay in the lower levels (below 600 hPa) and near the surface. This suggests an increase in the ground surface heating before day 0 and echoes the variation in boundary layer height (Figure 4b). By comparison, the maximum Q2 (Figure 4f) occurred in conjunction with the episodes of upward velocity, around the same altitude as Q1. These were consistent with the latent heat release due to precipitation, which was linked to the diurnal convection events (Figure 2d).
Since the transition date occurs around the end of the local monsoon season, we examined its association with the large-scale circulation. Composite-based horizontal distributions of the wind field and geopotential height were generated based on the day 0 transition date. These are shown in Figure 6 from day −60 to +40, with a 20-day interval. Figure 6 shows the characteristic retreat of the SAH towards the tropics, suggesting the beginning of the withdrawal phase of the Asian summer monsoon. It appeared that the SAH started to weaken gradually around 40 days before day 0. In contrast, the average geopotential height in the study area remained high until day 0, after which it started to decrease. The timing of these peaks in the SAH coincide with the elevated diurnal convective activity in the northeastern Tibetan Plateau, whereby this activity would help support the upper-level heating that enhances the local SAH (Figure 4e,f), delaying its regional-scale retreat for several days.

4. Discussion and Concluding Remarks

The analyses presented here suggest that increased local heating through enhanced diurnal convection in the northeastern Tibetan Plateau created a feedback as it interacts with the SAH. The retreat of the SAH started with the appearance of a low-level convergence zone along 30° N, which results in an increase in rainfall extending from the Tibetan Plateau across the Yangtze-Yellow river valley of China to the Korean Peninsula. This is known as the warm preference due to diabatic heating and is referred to as the Tibetan Mode [40]. The upper-level warming prior to day 0 (Figure 3d) coincides with the SAH feature known as the upper-troposphere-temperature-maximum (UTTM). The location of UTTM lies between the radiative cooling west of the SAH and the western Pacific monsoonal/convective heating source in the east [41]. A recent study [42] indicated that increased diabatic heating over the southern slope of the Tibetan Plateau is associated with a northward movement of the SAH towards the Tibetan Plateau, and vice versa. However, the 6-year data period of the study here may be too short to identify this interannual relationship.
Diagnostic investigation of monsoon-season diurnal precipitation characteristics over the northeastern Tibetan Plateau and its association with the SAH indicate that nighttime rainfall events do covary with the SAH seasonal evolution. By deriving an index (TI) to identify the transition day during which the episodes of diurnal convection start to decline, daily composite analyses show that warmer air, increased moisture, and stronger upward velocity were indeed present in the atmosphere before day 0. The analysis further suggests that the intensified diurnal rainfall before the transition day might occur mainly through large-scale lift caused by terrain-ambient air interaction, which in turn interacts with the maturing of the SAH. Although the atmosphere appeared to be more stable (above 600 hPa) before day 0 than after, the intensified diurnal rainfall before the transition day coincided with the increased low-level apparent heating (Q1) throughout the day. This feature lends support to the nighttime peak of rainfall, since the larger-scale lift due to terrain-ambient air interaction and the increased moisture content can enhance the potential for nighttime convection.
Future research should also focus on the role of soil moisture in the enhancement of diurnal convection. Meng et al. (2017) [43] reported that a positive soil moisture feedback over the central Tibetan Plateau is likely, though Ferguson and Wood (2011) [44] showed that the soil moisture-rainfall feedback over Tibetan Plateau is uncertain until satisfactory amounts of in-situ observations can be built to adequately explore such a feedback. Based on initial data collected during the third Tibetan Plateau atmospheric scientific experiment (TIPEX-III) that started in 2014, Zhao et al. (2018) [45] report that the development of summer diurnal clouds and precipitation over the central Tibetan Plateau correspond well with the peak of land-surface sensible heat flux. Further understanding of the formation and variation of the SAH, and the associated UTTM and diabatic heating over the southern slope of Tibetan Plateau, is needed.

Author Contributions

Conceptualization, L.Z. and S.-Y.S.W.; formal analysis, L.Z. and S.-Y.S.W.; writing—original draft preparation, L.Z. and S.-Y.S.W.; writing—review and editing, L.Z., S.-Y.S.W., C.-H.W., S.L. (Sebastian Los), S.L. (Shihua Lyu), X.M., L.W., S.L. (Siqiong Luo), Y.A., Z.L. All authors have read and agreed to the published version of the manuscript.

Funding

This research was supported by the auspices of the Strategic Priority Research Program of the Chinese Academy of Sciences (XDA2006010202), the National Natural Science Foundation of China (41930759, 41822501, 41975012, 91837209, 41605011, 41975130, 41875016). S.-Y. Simon Wang was supported by grants DE-SC0016605 and 399 R13AC80039, as well as the Utah Agricultural Experiment Station.

Conflicts of Interest

The authors declare no conflict of interest.

Appendix A

Figure A1. Hourly spatial precipitation at 21:00 on 21 August 2013 over the study domain in Northeastern Tibetan Plateau. The domain averaged precipitation is 0.27 mm/h, while the maximum precipitation is 22.08 mm/h. It is noted that gridpoints (here 360 total gridpoints) with and without precipitation were all considered for the domain average.
Atmosphere 11 00105 g0a1
Figure A2. For June–October 2010, (a) hourly domain (white box in Figure 1a) averaged precipitation; (b) 3-day running mean of nighttime (20:00–08:00, dark green line) and daytime (08:00–20:00, red line) rainfall; (c) 3-day running mean of transition index anomaly (TI); normalized domain averaged (d) atmospheric stability anomaly, (e) 2 m temperature anomaly, and (f) precipitable water anomaly. The black dashed line in (c) indicates transition date 21 September 2010.
Atmosphere 11 00105 g0a2
Figure A3. For June–October 2011, (a) hourly domain (white box in Figure 1a) averaged precipitation; (b) 3-day running mean of nighttime (20:00–08:00, dark green line) and daytime (08:00–20:00, red line) rainfall; (c) 3-day running mean of transition index anomaly (TI); normalized domain averaged (d) atmospheric stability anomaly, (e) 2 m temperature anomaly, and (f) precipitable water anomaly. The black dashed line in (c) indicates transition date 6 September 2011.
Atmosphere 11 00105 g0a3
Figure A4. For June–October 2012, (a) hourly domain (white box in Figure 1a) averaged precipitation; (b) 3-day running mean of nighttime (20:00–08:00, dark green line) and daytime (08:00–20:00, red line) rainfall; (c) 3-day running mean of transition index anomaly (TI); normalized domain averaged (d) atmospheric stability anomaly, (e) 2 m temperature anomaly, and (f) precipitable water anomaly. The black dashed line in (c) indicates transition date 11 September 2012.
Atmosphere 11 00105 g0a4
Figure A5. For June–October 2013, (a) hourly domain (white box in Figure 1a) averaged precipitation; (b) 3-day running mean of nighttime (20:00–08:00, dark green line) and daytime (08:00–20:00, red line) rainfall; (c) 3-day running mean of transition index anomaly (TI); normalized domain averaged (d) atmospheric stability anomaly, (e) 2 m temperature anomaly, and (f) precipitable water anomaly. The black dashed line in (c) indicates transition date 4 September 2013.
Atmosphere 11 00105 g0a5
Figure A6. For June–October 2014, (a) hourly domain (white box in Figure 1a) averaged precipitation; (b) 3-day running mean of nighttime (20:00–08:00, dark green line) and daytime (08:00–20:00, red line) rainfall; (c) 3-day running mean of transition index anomaly (TI); normalized domain averaged (d) atmospheric stability anomaly, (e) 2 m temperature anomaly, and (f) precipitable water anomaly. The black dashed line in (c) indicates transition date 12 September 2014.
Atmosphere 11 00105 g0a6
Figure A7. For June–October 2015, (a) hourly domain (white box in Figure 1a) averaged precipitation; (b) 3-day running mean of nighttime (20:00–08:00, dark green line) and daytime (08:00–20:00, red line) rainfall; (c) 3-day running mean of transition index anomaly (TI); normalized domain averaged (d) atmospheric stability anomaly, (e) 2 m temperature anomaly, and (f) precipitable water anomaly. The black dashed line in (c) indicates transition date 7 September 2015.
Atmosphere 11 00105 g0a7

References

  1. Carbone, R.; Tuttle, J. Rainfall occurrence in the US warm season: The diurnal cycle. J. Clim. 2008, 21, 4132–4146. [Google Scholar] [CrossRef]
  2. Huang, W.-R.; Wang, S.-Y. Impact of land-sea breezes at different scales on the diurnal rainfall in Taiwan. Clim. Dyn. 2014, 43, 1951–1963. [Google Scholar] [CrossRef]
  3. Liu, X.; Bai, A.; Liu, C. Diurnal variations of summertime precipitation over the Tibetan Plateau in relation to orographically-induced regional circulations. Environ. Res. Lett. 2009, 4, 045203. [Google Scholar] [CrossRef]
  4. Nesbitt, S.W.; Zipser, E.J. The diurnal cycle of rainfall and convective intensity according to three years of TRMM measurements. J. Clim. 2003, 16, 1456–1475. [Google Scholar] [CrossRef] [Green Version]
  5. Wang, S.-Y.; Chia, H.-H.; Gillies, R.R.; Jiang, X. Quasi-biweekly mode and its modulation on the diurnal rainfall in Taiwan forecasted by the CFS. Weather Forecast. 2013, 28, 981–993. [Google Scholar] [CrossRef]
  6. Xu, W.; Zipser, E.J. Diurnal variations of precipitation, deep convection, and lightning over and east of the eastern Tibetan Plateau. J. Clim. 2011, 24, 448–465. [Google Scholar] [CrossRef]
  7. Yang, S.; Smith, E.A. Mechanisms for diurnal variability of global tropical rainfall observed from TRMM. J. Clim. 2006, 19, 5190–5226. [Google Scholar] [CrossRef] [Green Version]
  8. Bao, X.; Zhang, F.; Sun, J. Diurnal variations of warm-season precipitation east of the Tibetan Plateau over China. Mon. Weather Rev. 2011, 139, 2790–2810. [Google Scholar] [CrossRef]
  9. Wang, C.-C.; Chen, G.T.-J.; Carbone, R.E. A climatology of warm-season cloud patterns over East Asia based on GMS infrared brightness temperature observations. Mon. Weather Rev. 2004, 132, 1606–1629. [Google Scholar] [CrossRef]
  10. Sugimoto, S.; Ueno, K. Formation of mesoscale convective systems over the eastern Tibetan Plateau affected by plateau-scale heating contrasts. J. Geophys. Res. Atmos. 2010, 115, D16105. [Google Scholar] [CrossRef]
  11. Liu, B.; Wu, G.; Mao, J.; He, J. Genesis of the South Asian high and its impact on the Asian summer monsoon onset. J. Clim. 2013, 26, 2976–2991. [Google Scholar] [CrossRef]
  12. Zhao, P.; Zhang, X.; Li, Y.; Chen, J. Remotely modulated tropical-North Pacific ocean–atmosphere interactions by the South Asian high. Atmos. Res. 2009, 94, 45–60. [Google Scholar] [CrossRef]
  13. Jiang, X.; Li, Y.; Yang, S.; Wu, R. Interannual and interdecadal variations of the South Asian and western Pacific subtropical highs and their relationships with Asian-Pacific summer climate. Meteorol. Atmos. Phys. 2011, 113, 171–180. [Google Scholar] [CrossRef]
  14. Qiong, Z.; Wu, G. The large area flood and drought over Yangtze River valley and its relation to the south Asia high. Acta Meteorol. Sin. 2001, 59, 569–577. [Google Scholar]
  15. Ren, X.; Yang, D.; Yang, X.-Q. Characteristics and mechanisms of the subseasonal eastward extension of the South Asian High. J. Clim. 2015, 28, 6799–6822. [Google Scholar] [CrossRef]
  16. Luo, S.; Qian, Z.; Wang, Q. The climatic and synoptical study about the relation between the Qinghai–Xizang high pressure on the 100 mb surface and the flood and drought in East China in summer. Plateau Meteorol. 1982, 1, 1–10. [Google Scholar]
  17. Wei, W.; Zhang, R.; Wen, M.; Rong, X.; Li, T. Impact of Indian summer monsoon on the South Asian High and its influence on summer rainfall over China. Clim. Dyn. 2014, 43, 1257–1269. [Google Scholar] [CrossRef]
  18. Wei, W.; Zhang, R.; Wen, M.; Kim, B.-J.; Nam, J.-C. Interannual variation of the South Asian High and its relation with Indian and East Asian summer monsoon rainfall. J. Clim. 2015, 28, 2623–2634. [Google Scholar] [CrossRef]
  19. Field, C.B.; Barros, V.; Stocker, T.F.; Qin, D.; Dokken, D.J.; Ebi, K.L.; Mastrandrea, M.D.; Mach, K.J.; Plattner, G.K.; Allen, S.K.; et al. Managing the Risks of Extreme Events and Disasters to Advance Climate Change Adaptation: Special Report of the Intergovernmental Panel on Climate Change; Cambridge University Press: Cambridge, UK, 2012; pp. 141–149. [Google Scholar]
  20. Duan, A.; Xiao, Z. Does the climate warming hiatus exist over the Tibetan Plateau? Sci. Rep. 2015, 5, 13711. [Google Scholar] [CrossRef]
  21. Fyfe, J.C.; Meehl, G.A.; England, M.H.; Mann, M.E.; Santer, B.D.; Flato, G.M.; Hawkins, E.; Gillett, N.P.; Xie, S.P.; Kosaka, Y.; et al. Making sense of the early-2000s warming slowdown. Nat. Clim. Chang. 2016, 6, 224–228. [Google Scholar] [CrossRef] [Green Version]
  22. Gao, X.; Pal, J.S.; Giorgi, F. Projected changes in mean and extreme precipitation over the Mediterranean region from a high resolution double nested RCM simulation. Geophys. Res. Lett. 2006, 33, L03706. [Google Scholar] [CrossRef]
  23. Gao, Y.; Xue, Y.; Peng, W.; Kang, H.-S.; Waliser, D. Assessment of dynamic downscaling of the extreme rainfall over East Asia using a regional climate model. Adv. Atmos. Sci. 2011, 28, 1077–1098. [Google Scholar] [CrossRef]
  24. Wang, Y.; Zhou, L. Observed trends in extreme precipitation events in China during 1961–2001 and the associated changes in large-scale circulation. Geophys. Res. Lett. 2005, 32, L09707. [Google Scholar] [CrossRef]
  25. Yang, T.; Hao, X.; Shao, Q.; Xu, C.-Y.; Zhao, C.; Chen, X.; Wang, W. Multi-model ensemble projections in temperature and precipitation extremes of the Tibetan Plateau in the 21st century. Glob. Planet. Chang. 2012, 80, 1–13. [Google Scholar] [CrossRef]
  26. Joyce, R.J.; Janowiak, J.E.; Arkin, P.A.; Xie, P. CMORPH: A method that produces global precipitation estimates from passive microwave and infrared data at high spatial and temporal resolution. J. Hydrometeorol. 2004, 5, 487–503. [Google Scholar] [CrossRef]
  27. Shen, Y.; Pan, Y.; Yu, J.; Zhao, P.; Zhou, Z. Quality assessment of hourly merged precipitation product over China. Trans. Atmos. Sci. 2013, 36, 37–46. [Google Scholar]
  28. Shen, Y.; Zhao, P.; Pan, Y.; Yu, J. A high spatiotemporal gauge-satellite merged precipitation analysis over China. J. Geophys. Res.-Atmos. 2014, 119, 3063–3075. [Google Scholar] [CrossRef]
  29. Dee, D.P.; Uppala, S.M.; Simmons, A.J.; Berrisford, P.; Poli, P.; Kobayashi, S.; Andrae, U.; Balmaseda, M.A.; Balsamo, G.; Bauer, D.P.; et al. The ERA-Interim reanalysis: Configuration and performance of the data assimilation system. Q. J. R. Meteorol. Soc. 2011, 137, 553–597. [Google Scholar] [CrossRef]
  30. Wu, G.; Li, W.; Guo, H.; Liu, H.; Xue, J.; Wang, Z. Sensible Heat Driven Air-Pump over the Tibetan Plateau and its Impacts on the Asian Summer Monsoon; Chinese Science Press: Beijing, China, 1997; pp. 116–126. [Google Scholar]
  31. Wu, G.; Liu, Y.; Zhang, Q.; Duan, A.; Wang, T.; Wan, R.; Liu, X.; Li, W.; Wang, Z.; Liang, X. The influence of mechanical and thermal forcing by the Tibetan Plateau on Asian climate. J. Hydrometeorol. 2007, 8, 770–789. [Google Scholar] [CrossRef] [Green Version]
  32. Guo, D.; Yang, M.; Wang, H. Sensible and latent heat flux response to diurnal variation in soil surface temperature and moisture under different freeze/thaw soil conditions in the seasonal frozen soil region of the central Tibetan Plateau. Environ. Earth Sci. 2011, 63, 97–107. [Google Scholar] [CrossRef]
  33. Ma, Y.; Fan, S.; Ishikawa, H.; Tsukamoto, O.; Yao, T.; Koike, T.; Zuo, H.; Hu, Z.; Su, Z. Diurnal and inter-monthly variation of land surface heat fluxes over the central Tibetan Plateau area. Theor. Appl. Climatol. 2005, 80, 259–273. [Google Scholar] [CrossRef]
  34. Lüthi, Z.L.; Škerlak, B.; Kim, S.W.; Lauer, A.; Mues, A.; Rupakheti, M.; Kang, S. Atmospheric brown clouds reach the Tibetan Plateau by crossing the Himalayas. Atmos. Chem. Phys. 2015, 15, 6007–6021. [Google Scholar] [CrossRef] [Green Version]
  35. Zhao, P.; Li, Y.; Guo, X.; Xu, X.; Liu, Y.; Tang, S.; Xiao, W.; Shi, C.; Ma, Y.; Yu, X.; et al. The Tibetan Plateau Surface-Atmosphere Coupling System and Its Weather and Climate Effects: The Third Tibetan Plateau Atmospheric Science Experiment. J. Meteorol. Res.-Prc. 2019, 33, 375–399. [Google Scholar] [CrossRef]
  36. Zou, H.; Zhou, L.; Ma, S.; Li, P.; Wang, W.; Li, A.; Jia, J.; Gao, D. Local wind system in the Rongbuk Valley on the northern slope of Mt. Everest. Geophys. Res. Lett. 2008, 35, L13813. [Google Scholar] [CrossRef]
  37. Chow, K.C.; Chan, J.C. Diurnal variations of circulation and precipitation in the vicinity of the Tibetan Plateau in early summer. Clim. Dyn. 2009, 32, 55–73. [Google Scholar] [CrossRef]
  38. Wu, T.; Qian, Z. The comparative analyses of differences between vertical circulation on north side of Tibetan Plateau in wet and dry summer and thermal effects of the plateau. Acta Meteoro. Sin. 1996, 54, 558–568. [Google Scholar]
  39. Yanai, M.; Esbensen, S.; Chu, J.H. Determination of bulk properties of tropical cloud clusters from large-scale heat and moisture budgets. J. Atmos. Sci. 1973, 30, 611–627. [Google Scholar] [CrossRef]
  40. Zhang, Q.; Wu, G.; Qian, Y. The bimodality of the 100 hPa South Asia High and its relationship to the climate anomaly over East Asia in summer. J. Meteor. Soc. Jpn Ser. II 2002, 80, 733–744. [Google Scholar] [CrossRef] [Green Version]
  41. Wu, G.; He, B.; Liu, Y.; Bao, Q.; Ren, R. Location and variation of the summertime upper-troposphere temperature maximum over South Asia. Clim. Dyn. 2015, 45, 2757–2774. [Google Scholar] [CrossRef] [Green Version]
  42. Ge, J.; You, Q.; Zhang, Y. The influence of the Asian summer monsoon onset on the northward movement of the South Asian high towards the Tibetan Plateau and its thermodynamic mechanism. Int. J. Climatol. 2018, 38, 543–553. [Google Scholar] [CrossRef]
  43. Meng, X.; Li, R.; Luan, L.; Lyu, S.; Zhang, T.; Ao, Y.; Han, B.; Zhao, L.; Ma, Y. Detecting hydrological consistency between soil moisture and precipitation and changes of soil moisture in summer over the Tibetan Plateau. Clim. Dyn. 2018, 51, 4157–4168. [Google Scholar] [CrossRef] [Green Version]
  44. Ferguson, C.R.; Wood, E.F. Observed land-atmosphere coupling from satellite remote sensing and reanalysis. J. Hydrometeorol. 2011, 12, 1221–1254. [Google Scholar] [CrossRef]
  45. Zhao, P.; Xu, X.; Chen, F.; Guo, X.; Zheng, X.; Liu, L.; Hong, Y.; Li, Y.; La, Z.; Peng, H.; et al. The Third Atmospheric Scientific Experiment for Understanding the Earth-Atmosphere Coupled System over the Tibetan Plateau and Its Effects. Bull. Am. 2018, 99, 757–776. [Google Scholar] [CrossRef]
Figure 1. (a) Elevation (m) of the Tibetan Plateau above sea level, and (b) time series of domain (white box in Figure 1a) averaged precipitation (mm/h) for August 20 and 21 2013. Infrared cloud imagery at (c) 08:30 (local time) on 20 August 2013, (d) 18:30 on August 20th 2013, (e) 08:30 on 21 August 2013, and (f) 21:30 on 21 August 2013. The warm colors in (cf) indicate convective clouds.
Atmosphere 11 00105 g001
Figure 2. (a) Hourly domain (white box in Figure 1a) averaged precipitation (mm/h) for 2013 June–October, (b) nighttime (20:00–08:00, dark green line) and daytime (08:00–20:00, red line) precipitation for 2013 June–October, (c) composite analysis (2010–2015) of hourly domain averaged precipitation (mm/h) from day −70 to 40 relative to transition date, (d) same as (b) but for the composite (2010–2015) daily domain averaged nighttime and daytime precipitation (mm/h); (e) composite (2010–2015) transition index (TI) anomalies using a 3-day running mean, and (f) composite (2010–2015) hourly domain averaged precipitation (mm/h) before and after transition. The black dashed lines in (a,b) indicate transition date 4 September 2013, while black dashed lines in (ce) indicate composite transition day.
Atmosphere 11 00105 g002
Figure 3. Daily composite analyses for June–October (2010–2015) from day −70 to 40 relative to transition date averaged over the domain (white box in Figure 1a) for (a) average potential temperature (K) and (b) potential temperature anomalies (K), (c) average static stability ( θ / p , K/pa) and (d) static stability anomalies (K/pa), (e) average specific humidity (g/kg), and (f) specific humidity anomalies (g/kg) at pressure levels. A 3-day running mean was conducted for all panels, and black dashed lines indicate composite transition day.
Atmosphere 11 00105 g003
Figure 4. Daily composite analyses for June–October (2010–2015) from day −70 to 40 relative to transition date averaged over the domain (white box in Figure 1a) for (a) 200 hPa geopotential height (m), composite 20:00 and 08:00 domain averaged (b) boundary layer height (m) and (c) convective available potential energy (J/kg), (d) vertical velocity, (e) apparent heat source (Q1, J/kg), and (f) apparent moisture sink (Q2, J/kg) at pressure levels. A 3-day running mean was conducted for all panels. The black dashed lines indicate composite transition day.
Atmosphere 11 00105 g004
Figure 5. Latitude–pressure cross sections averaged over meridional belt of 97–103° E for: (a) composite vertical velocity mean during June–October (2010–2015), (b) composite vertical velocity difference (nighttime (20:00) minus daytime (08:00)) during June–October (2010–2015), and (c) composite vertical velocity difference before (70 days) and after (40 days) transition date during June–October (2010–2015). Orange boxes indicate the study region.
Atmosphere 11 00105 g005
Figure 6. Composite analysis (2010–2015) of daily mean 200 hPa streamline field and geopotential height (shaded, m), from day −60 to 40 relative to transition date with a 20-day interval, (a) day −60, (b) day −40 (c) day −20, (d) day 0, (e) day 20, and day 40. The white boxes indicate the study region.
Atmosphere 11 00105 g006

