Article

Why is the North Atlantic Oscillation More Predictable in December?

1
Nansen-Zhu International Research Centre, Institute of Atmospheric Physics, Chinese Academy of Sciences, Beijing 100029, China
2
Collaborative Innovation Center on Forecast and Evaluation of Meteorological Disasters, Nanjing University of Information Science and Technology, Nanjing 210044, China
3
University of Chinese Academy of Sciences, Beijing 100049, China
*
Author to whom correspondence should be addressed.
Atmosphere 2019, 10(8), 477; https://doi.org/10.3390/atmos10080477
Submission received: 12 July 2019 / Revised: 16 August 2019 / Accepted: 17 August 2019 / Published: 20 August 2019
(This article belongs to the Section Meteorology)

Abstract

:
The prediction skill of the Climate Forecast System, version 2 (CFSv2), for the North Atlantic Oscillation (NAO) is evaluated in three winter months (December, January, and February). The results show that the CFSv2 model can skillfully predict the December NAO one month in advance. There are two main contributors to NAO predictability in December. One is the predictability of the relationship between the North Atlantic sea surface temperature anomaly (SSTA) tripole and the NAO and the other is the second empirical orthogonal function (EOF) mode of the geopotential height at 50 hPa (Z50-EOF2). The relationship between the NAO and SSTA tripole index in December is the most significant in the three winter months. The significant monthly differences of surface heat fluxes in December over the whole North Atlantic are favorable for promoting the interaction between the NAO and North Atlantic SSTAs, in addition to improving the predictability of the December NAO. When the NAO is in a positive phase, easterly anomalies are located at the low and high latitudes and westerly anomalies prevail in the mid-latitudes of the troposphere. The correlation between the December Z50-EOF2 and zonal-mean zonal wind anomalies shows a similar spatial structure to that for the NAO. The possible reason why the CFSv2 model can predict the December NAO one month ahead is that it can reasonably reproduce the relationship between the December NAO and both the North Atlantic SST and stratospheric circulation.

1. Introduction

The North Atlantic Oscillation (NAO) is the leading pattern of atmospheric variability in the North Atlantic affecting the winter climate over the Northern Hemisphere [1,2,3,4]. The winter NAO can affect not only the winter climate but also the spring and summer climate in Eurasia, such as the spring vegetation over Eurasia [5], tropical cyclone frequency [6], East Asian summer monsoon precipitation [7], summertime atmospheric circulation [8], and so on. The predictability of the winter NAO is therefore of widespread interest; improving it would be favorable for more accurate climate prediction over the Northern Hemisphere.
Although the wintertime NAO is generated by internal atmospheric dynamic process, the impact of oceanic forcing on the NAO is hard to ignore [9,10,11,12]. The interaction between the wintertime NAO and North Atlantic sea surface temperature anomaly (SSTA) plays an important role in the seasonal prediction of the NAO [12,13]. The oceanic thermal feedback in the extratropics is considered to be one of the most important factors in both the NAO and the associated North Atlantic SSTA tripole [14]. The wind anomaly associated with the NAO can result in a significant change in surface heat fluxes and the North Atlantic SSTA tripole is primarily the ocean’s response to the NAO forcing [15]. In addition, the zonal mean flows in the stratosphere have proven to be a predictability source of the winter NAO [16]. There is a clear decrease in NAO prediction skill to non-significant values when ensemble members that include stratospheric sudden warmings are excluded from NAO predictions [17,18]. The interaction between the NAO and the zonal mean flows in the stratosphere takes place through both synoptic- and planetary-scale waves in boreal winter [19,20].
Numerous studies have focused on NAO seasonal prediction [21,22,23,24,25]. Saito et al. [26] found that the predictive skill of the NAO increases from late winter to early spring in relation to the high predictability of the zonal mean geopotential height in the stratosphere. The year-to-year increment method has shown advantages in predictions of the winter NAO [21,27]. However, the winter climate often features subseasonal reversal from early to late winter. For example, the East Asian surface temperature reverses from warmer than normal in early winter to colder than normal in early winter of 2014/15 and the decadal trends of Hadley circulation in the extratropics and polar region displays nearly opposite tendencies between early and late winter [28,29,30]. Thus, monthly forecasting of the winter climate is a challenging task, but one that has been receiving increasing attention. For instance, a coupled model skillfully predicted the monthly mean of the December and January NAO up to 10 days in advance [31].
Therefore, the objective of this paper is to assess the predictability of the NAO in three winter months (December, January, and February). The North Atlantic SSTA tripole and atmospheric circulation in the stratosphere as possible sources of the predictability of the monthly NAO are also explored. Following this introduction, the data and methods used in the study are introduced in Section 2. Section 3 presents the predictability sources of the December NAO. A summary and discussion of the study are given in Section 4.

2. Data and Methods

Monthly atmospheric circulation reanalysis data on a 2.5° × 2.5° grid from the National Centers for Environmental Prediction/National Center for Atmosphere Research (NCEP/NCAR) for the period 1982–2018 are used in this study. Also employed are monthly SST data from the Extended Reconstructed SST dataset, version 4, with a resolution of 2.0° × 2.0° [32]. Version 2 of the NCEP Climate Forecast System (CFSv2) is utilized in this study [33], which is a new atmosphere–ocean–sea-ice–land model comprising a retrospective forecast experiment (1982–2010) and an operational forecast (2011–2018). Beginning on 1 January, nine-month hindcast runs are initialized from every fifth day and run from all four cycles (0000, 0600, 1200, and 1800 UTC) of that day. The initial days vary from one month to another. An equal weight ensemble mean of the monthly-mean values of 24 or 28 members is used in this study. The CFSv2 data in December (January and February) are initiated from 1 June to December (July to January, August to February) at lead times ranging from 6 to 0 months. The global multi-model ensemble reforecast dataset created within the European Commission FP7 project called ENSEMBLES [34]. For each year, seven months seasonal forecasts of the ENSEMBLES, which comprises the European Centre for Medium-Range Weather Forecasts (ECWMF), the Leibniz Institute of Marine Sciences at Kiel University (IFM-GEOMAR), the Meteo-France (MF), the UK Met Office (UKMO), and the Euro-Mediterranean Center for Climate Change (CMCC-INGV), are started from 1st February, May, August, and November initial conditions.
In this paper, the observed monthly NAO index is defined as the principal component (PC) time series of the first leading empirical orthogonal function (EOF) mode of area-weighted monthly sea level pressure (SLP) anomalies over the North Atlantic (90° W–40° E, 20°–80° N) during the period of 1982–2018 [35]. As shown in Figure 1, the main SLP anomaly pattern reflects a north–south dipole mode in the three winter months, with the explained variance being 45% for December, 39% for January, and 38% for February. The month with the largest explained variance of the NAO mode is December. The CFSv2-predicted NAO index values are obtained by projection onto the observed NAO mode. The SSTA tripole index is defined as the PC time series of the second leading EOF mode of area-weighted monthly SSTAs over the North Atlantic region (80° W–0°, 10°–70° N). The stratospheric indices defined as the PC time series of the first and second leading EOF mode of monthly geopotential height at 50 hPa (Z50) poleward of 20° N. The time correlation coefficient (TCC) and root-mean-square error (RMSE) are used as two indicators for evaluating the prediction skill of the CFSv2-predicted NAO.
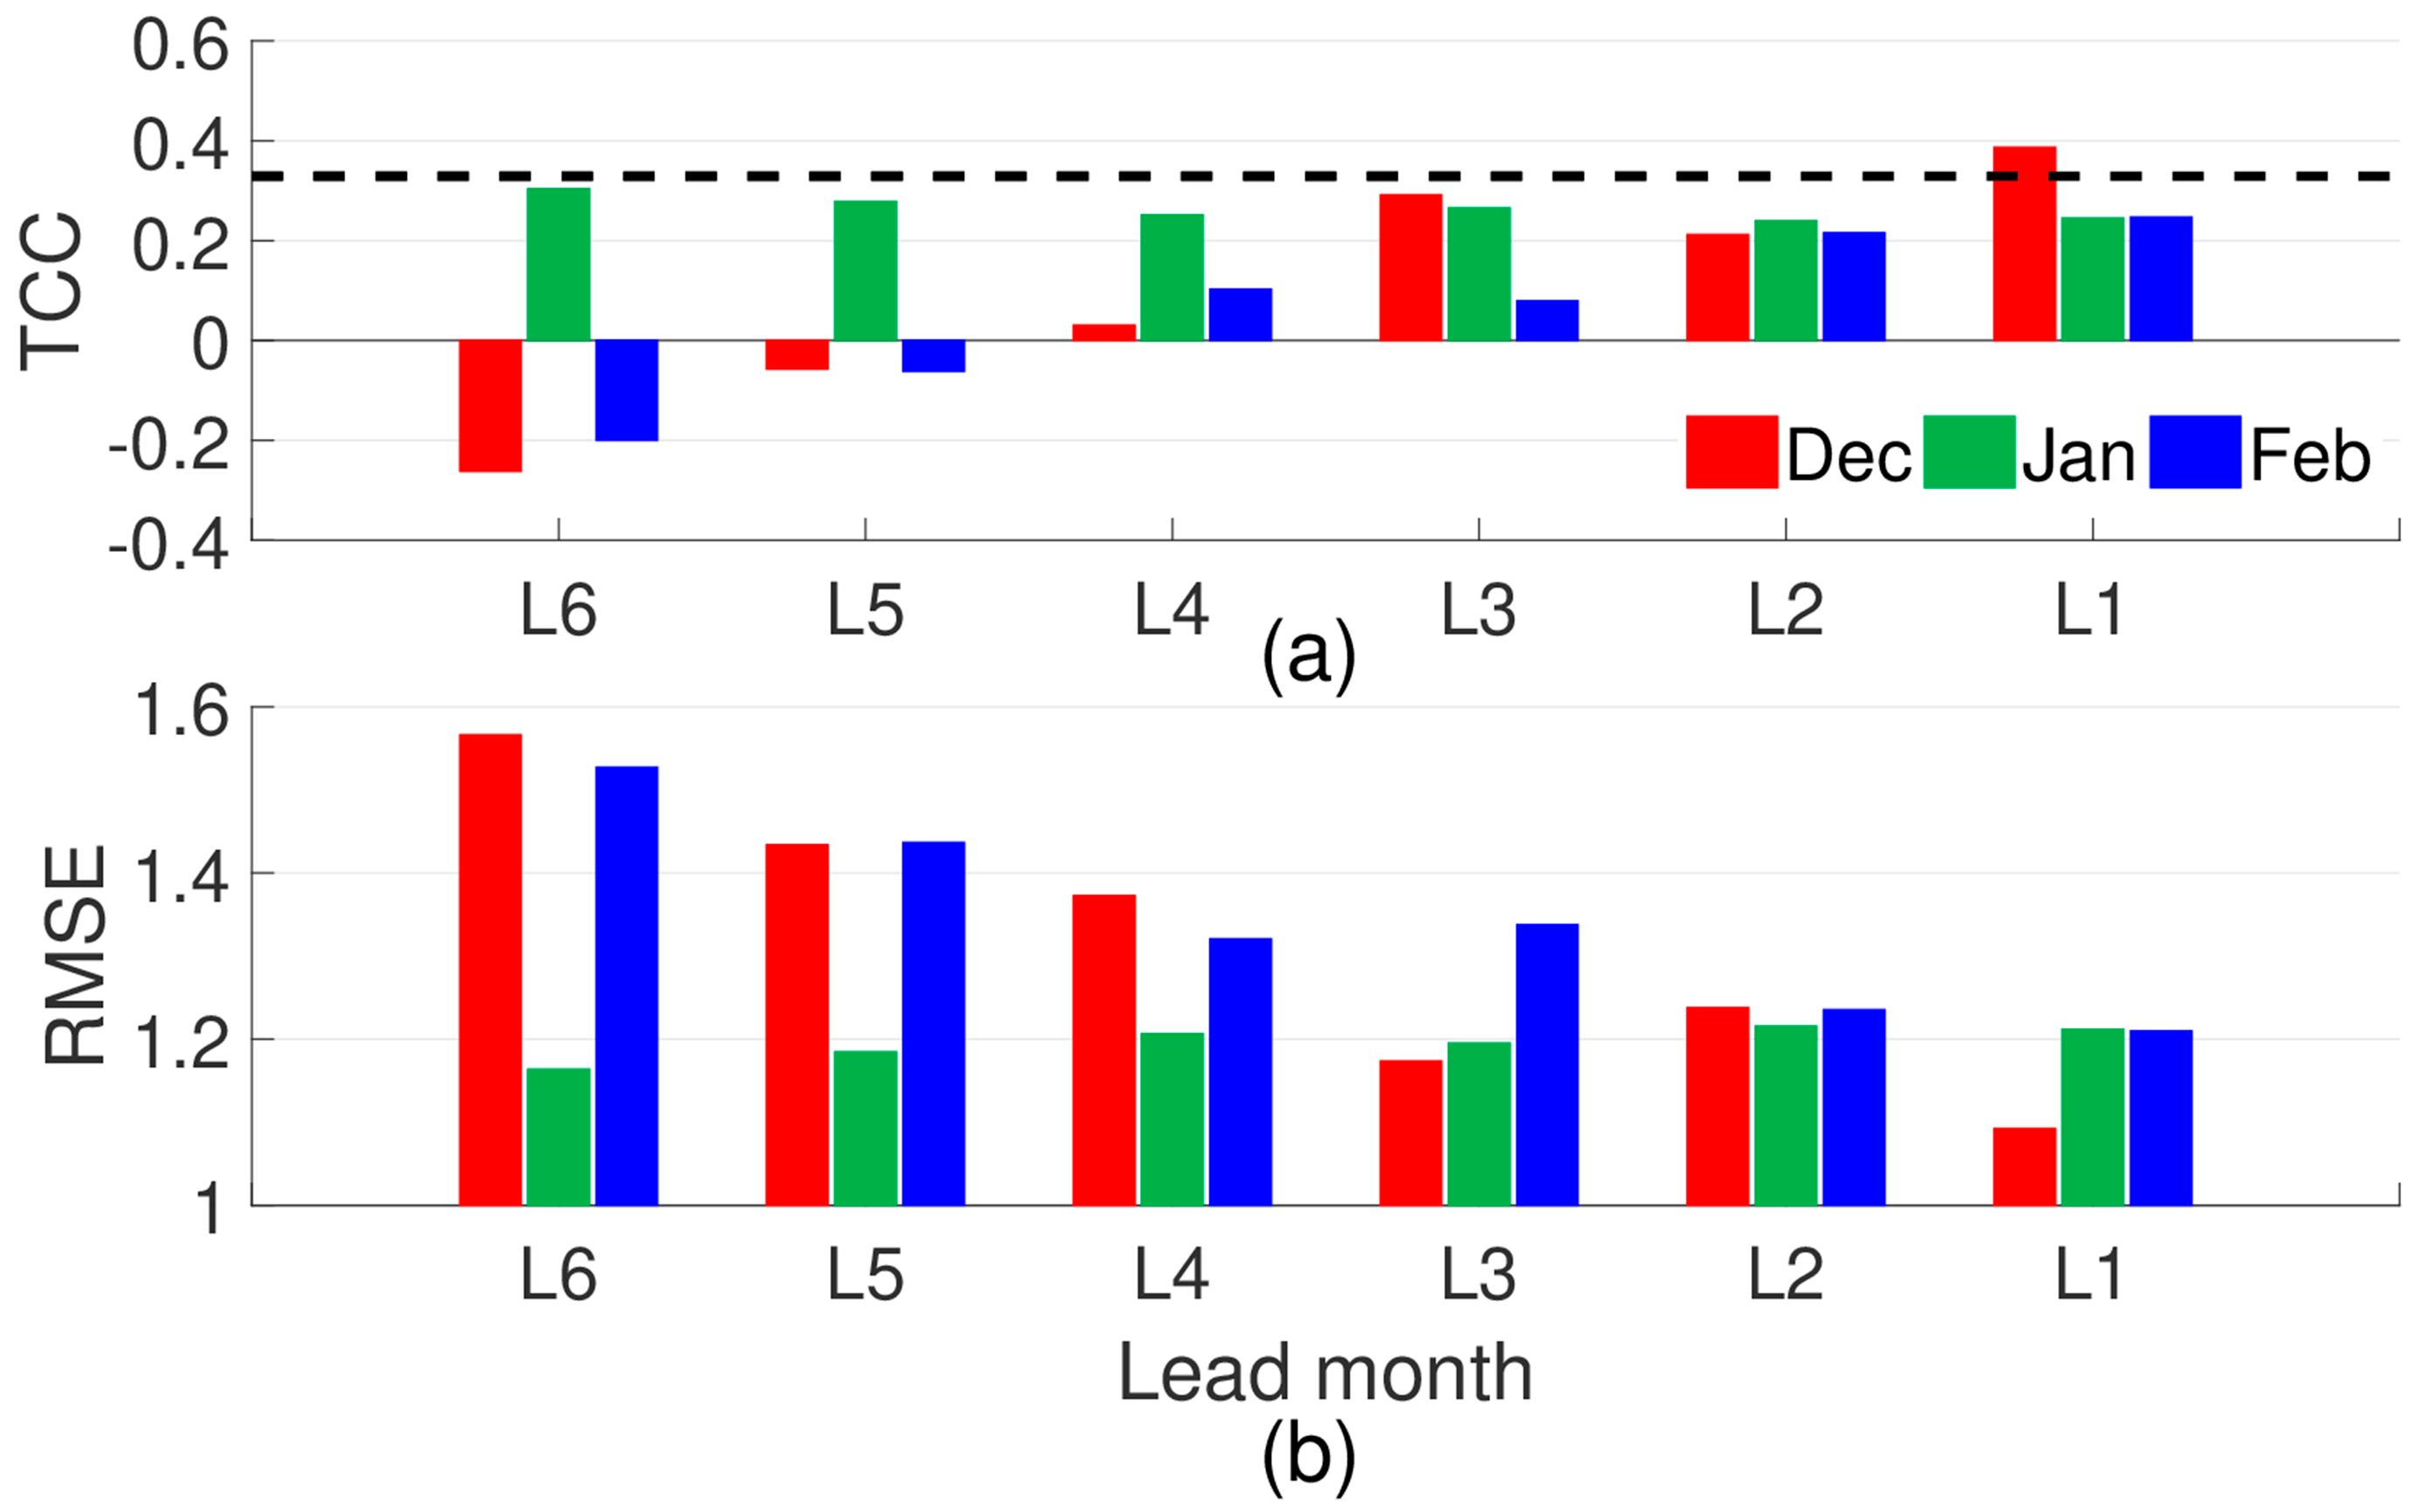
Figure 2a shows the TCCs between the observed NAO and CFSv2-predicted NAO at 6- to 1-month leads in the three winter months. It is apparent that CFSv2 has no forecasting skill for the January and February NAO at these lead times. However, the model does show skillful prediction of the December NAO one month ahead, with a TCC of 0.39 during the period 1982–2017, exceeding the 95% confidence level. As shown in Figure 2b, the ranges of RMSE at 6- to 1-month leads are 1.09–1.57 for December, 1.16–1.22 for January, and 1.21–1.53 for February. The RMSE in December is 1.09 at a 1-month lead, which is the smallest among the three winter months at the different lead times. Thus, the CFSv2 model can predict the December NAO with significant skill one month in advance.
CFSv2 shows skillful prediction of the winter NAO at 5-, 2-, and 1-month leads. The TCCs between the observed NAO and CFSv2-predicted winter NAO during the period 1983–2018 are 0.39 at 5-month leads, 0.37 at 2-month leads, and 0.48 at 1-month leads, all exceeding the 95% confidence level. The prediction ability of the CFSv2 to the wintertime NAO is obviously higher than that of monthly scale.

3. Predictability Sources of the December NAO

An important question—and the focus of this paper—is why the predictability of the NAO in December is higher than that in January and February. To answer this, the relationships between the December NAO and both the North Atlantic SSTAs and stratospheric circulation are explored in this section.

3.1. Relationship between the North Atlantic SSTA Tripole and the NAO

The North Atlantic SSTAs play an important role in the prediction of the winter NAO [22,27]. Many observational and modeling studies have demonstrated that the mid-latitude SSTAs comprising the North Atlantic SSTA tripole are formed by the oceanic response to NAO-like atmospheric circulation anomalies [9,14]. The signals of the NAO-like response to the North Atlantic SSTA tripole can be considered as representing an oceanic feedback mechanism in the extratropical atmosphere–ocean system. The oceanic thermal feedback in the extratropics is one of the most important influences on both the NAO and the associated North Atlantic SSTA tripole [14].
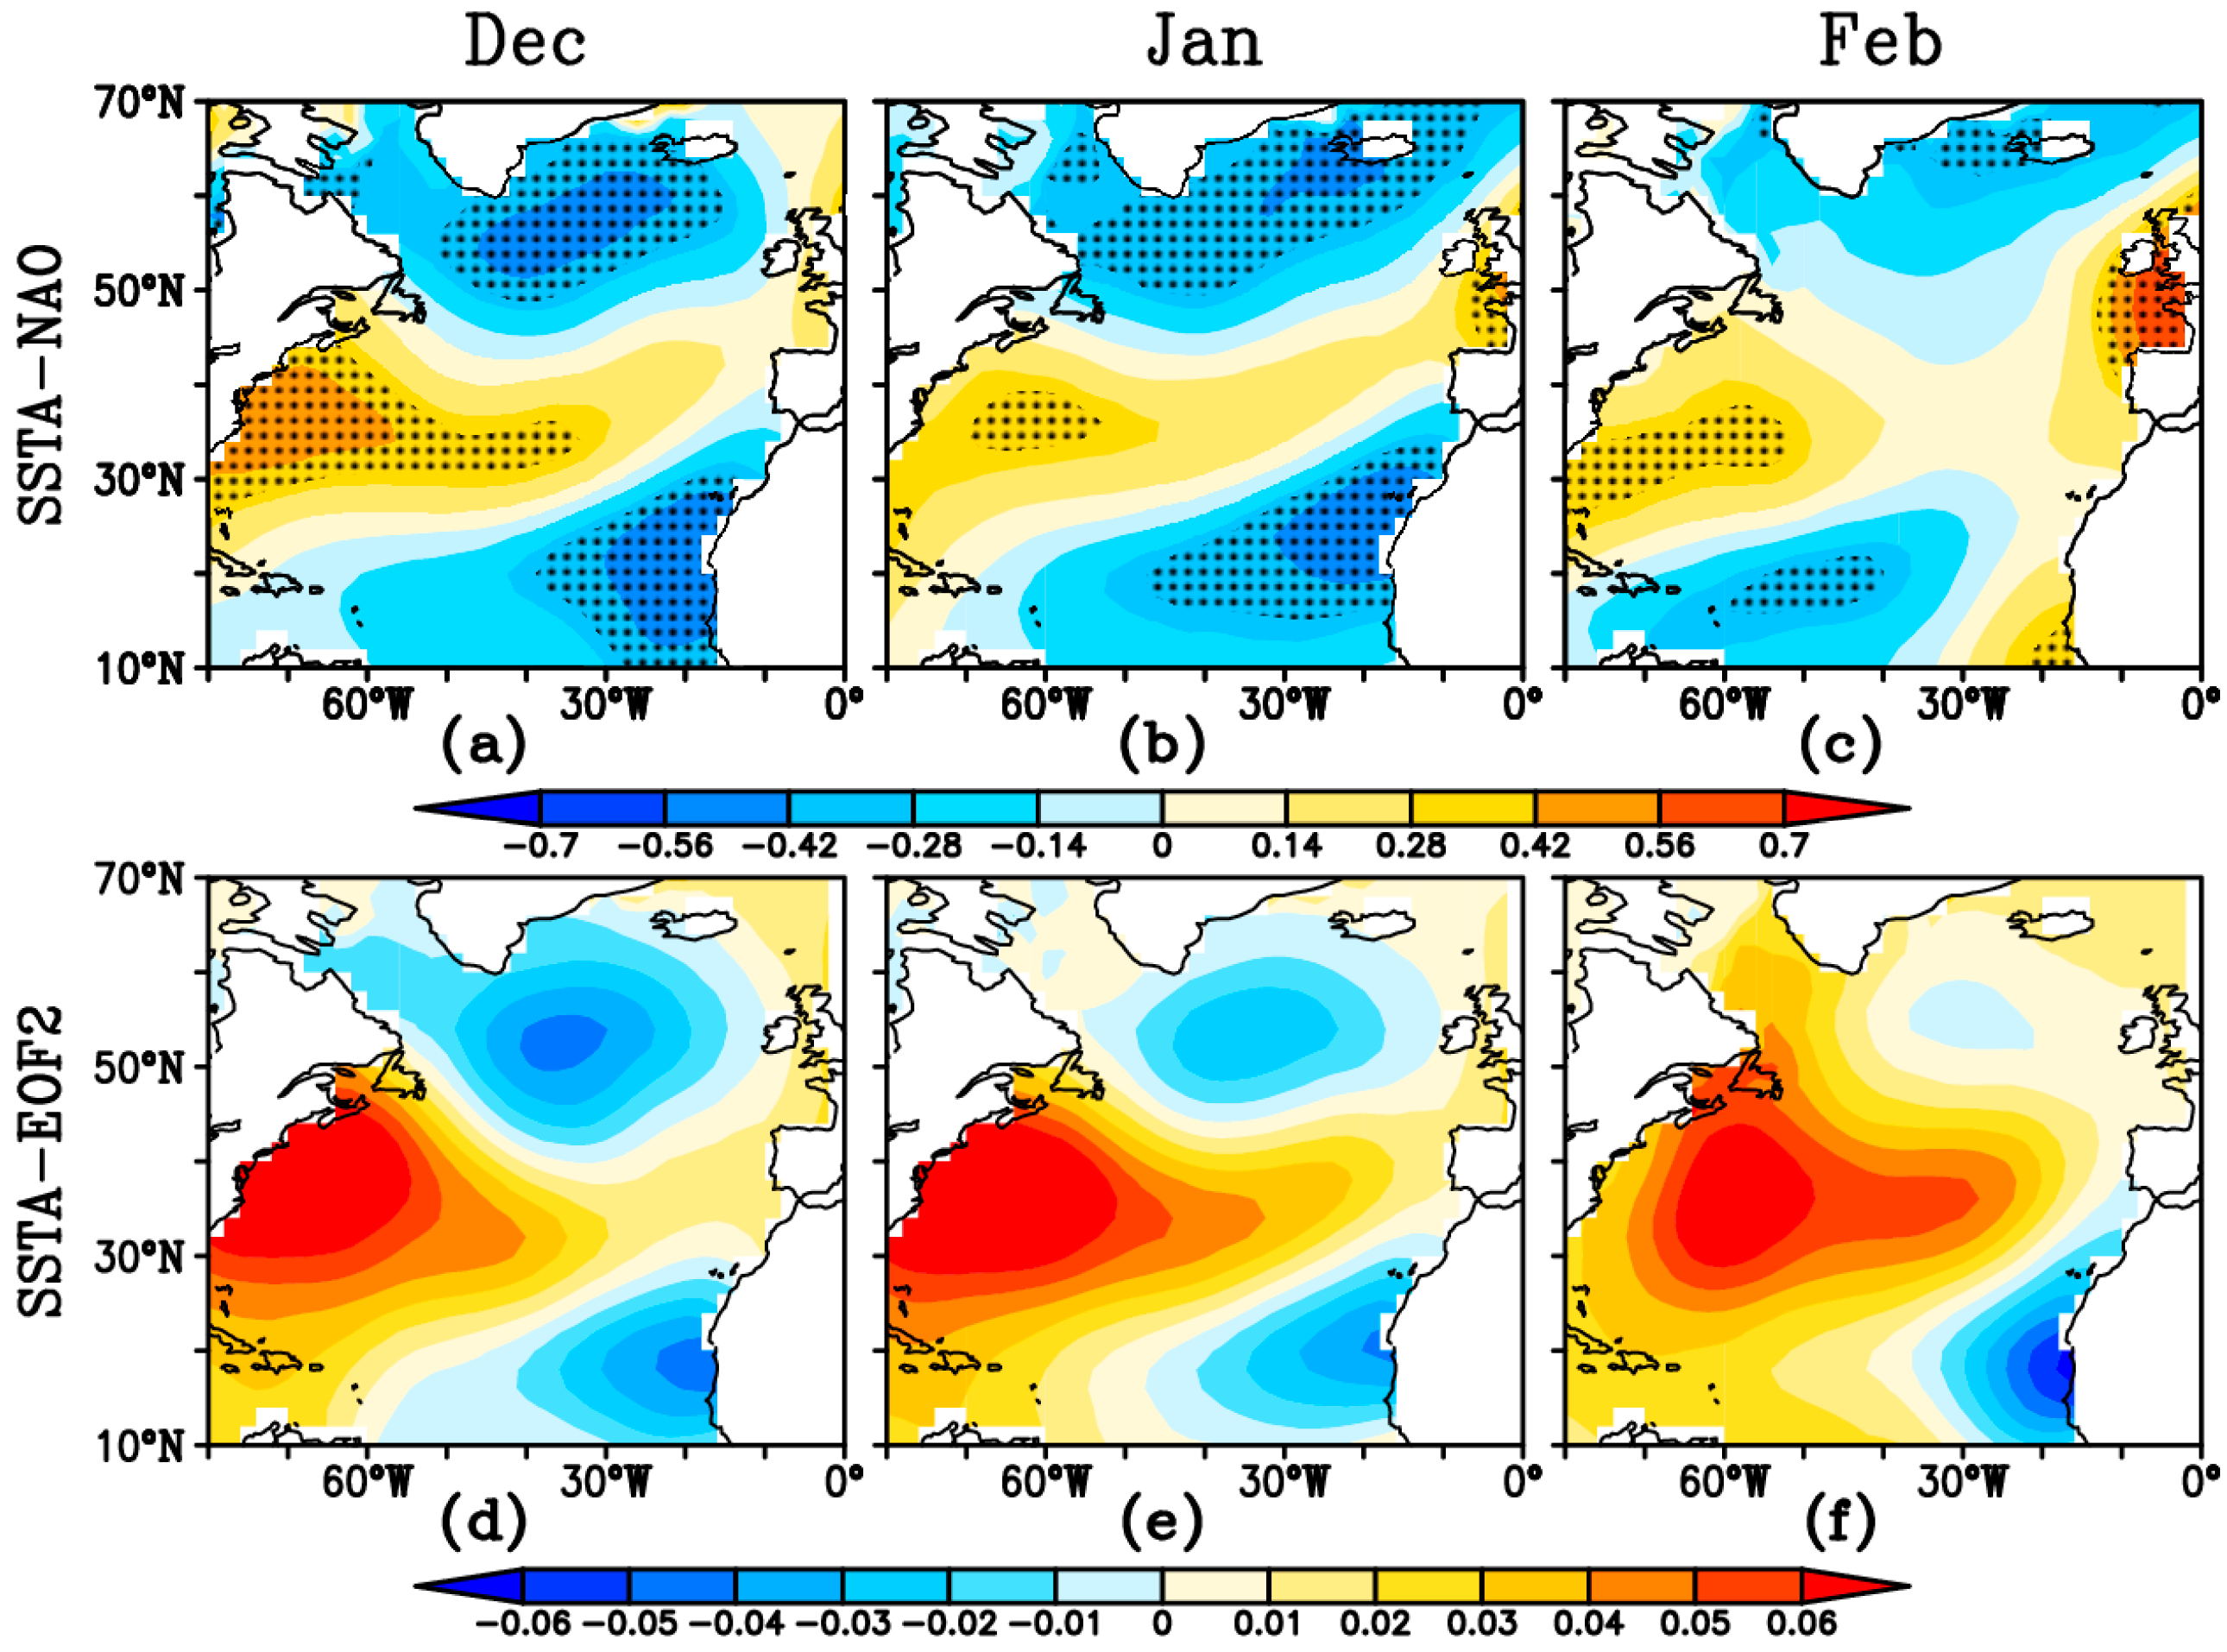
Figure 3a–c show the TCCs between the observed SSTAs and the NAO in December, January, and February. It can be seen that the relationship between the SSTAs and the NAO in December presents a significant tripole pattern, with a positive correlation off the east coast of the United States and negative correlation north of 50° N and south of 25° N (Figure 3a). The relationship between the January NAO and the SSTA tripole weakens in the mid-latitudes of the North Atlantic (Figure 3b). In the following February, the linkage between the NAO and the North Atlantic SSTA tripole also weakens in the high and low latitudes. Previous studies have indicated that this tripole pattern is closely related to the NAO in winter [9,12,15,36].
Unlike the seasonal variation of SSTAs over the North Atlantic, the second EOF mode of the monthly variation of SSTAs presents a tripole pattern in the three winter months (Figure 3d–f). The TCCs between the SSTA tripole index and the NAO are 0.58 for December, exceeding the 99% confidence level, 0.38 for January, and 0.08 for February, during 1983–2018. Thus, the relationship between the NAO and North Atlantic SSTA tripole index in December is the most significant among the three winter months. This may be a reason why the predictability of the NAO in December is higher than that in January and February.
However, can CFSv2 reproduce the linkage between the December NAO and North Atlantic SSTA tripole? The CFSv2-predicted SSTA tripole index values are obtained by projection onto the observed SSTA tripole pattern in the three winter months. Figure 4 shows the prediction skill of CFSv2 for the relationship between the December NAO and SSTA tripole at different lead times. The CFSv2 model has no prediction skill for this relationship with initial months from June to October. However, the model can successfully reproduce the interaction between the North Atlantic SSTAs tripole and the NAO in December one month ahead, with a TCC of 0.61, exceeding the 99% confidence level (Figure 4). Therefore, CFSv2 can be used to predict the December NAO up to one month in advance.
We also assess the prediction skill December NAO by the coupled model of ENSEMBLES one month in advance. Three models (IFM-GEOMAR, UKMO, and CMCC-INGV) have certain ability to predict the December NAO and the relationship between the December NAO and North Atlantic SSTAs at a 1-month lead. However, the ECMWF shows the poor forecasting skill for the December NAO and the relationship between the December NAO and North Atlantic SSTAs. Thus, the interaction between the December NAO and simultaneous North Atlantic SSTAs plays an important role in the predictability of the December NAO.

3.2. Monthly Differences of Atmospheric Circulation Anomalies Related to the NAO

According to Fan et al. [37], who proposed the ‘year-to-year increment prediction approach’, the monthly difference of a variable, i.e., its difference between the current and previous month, can better capture the month-to-month variability than the monthly anomaly. For instance, the monthly difference of December would be denoted by the difference of a variable between December and November.
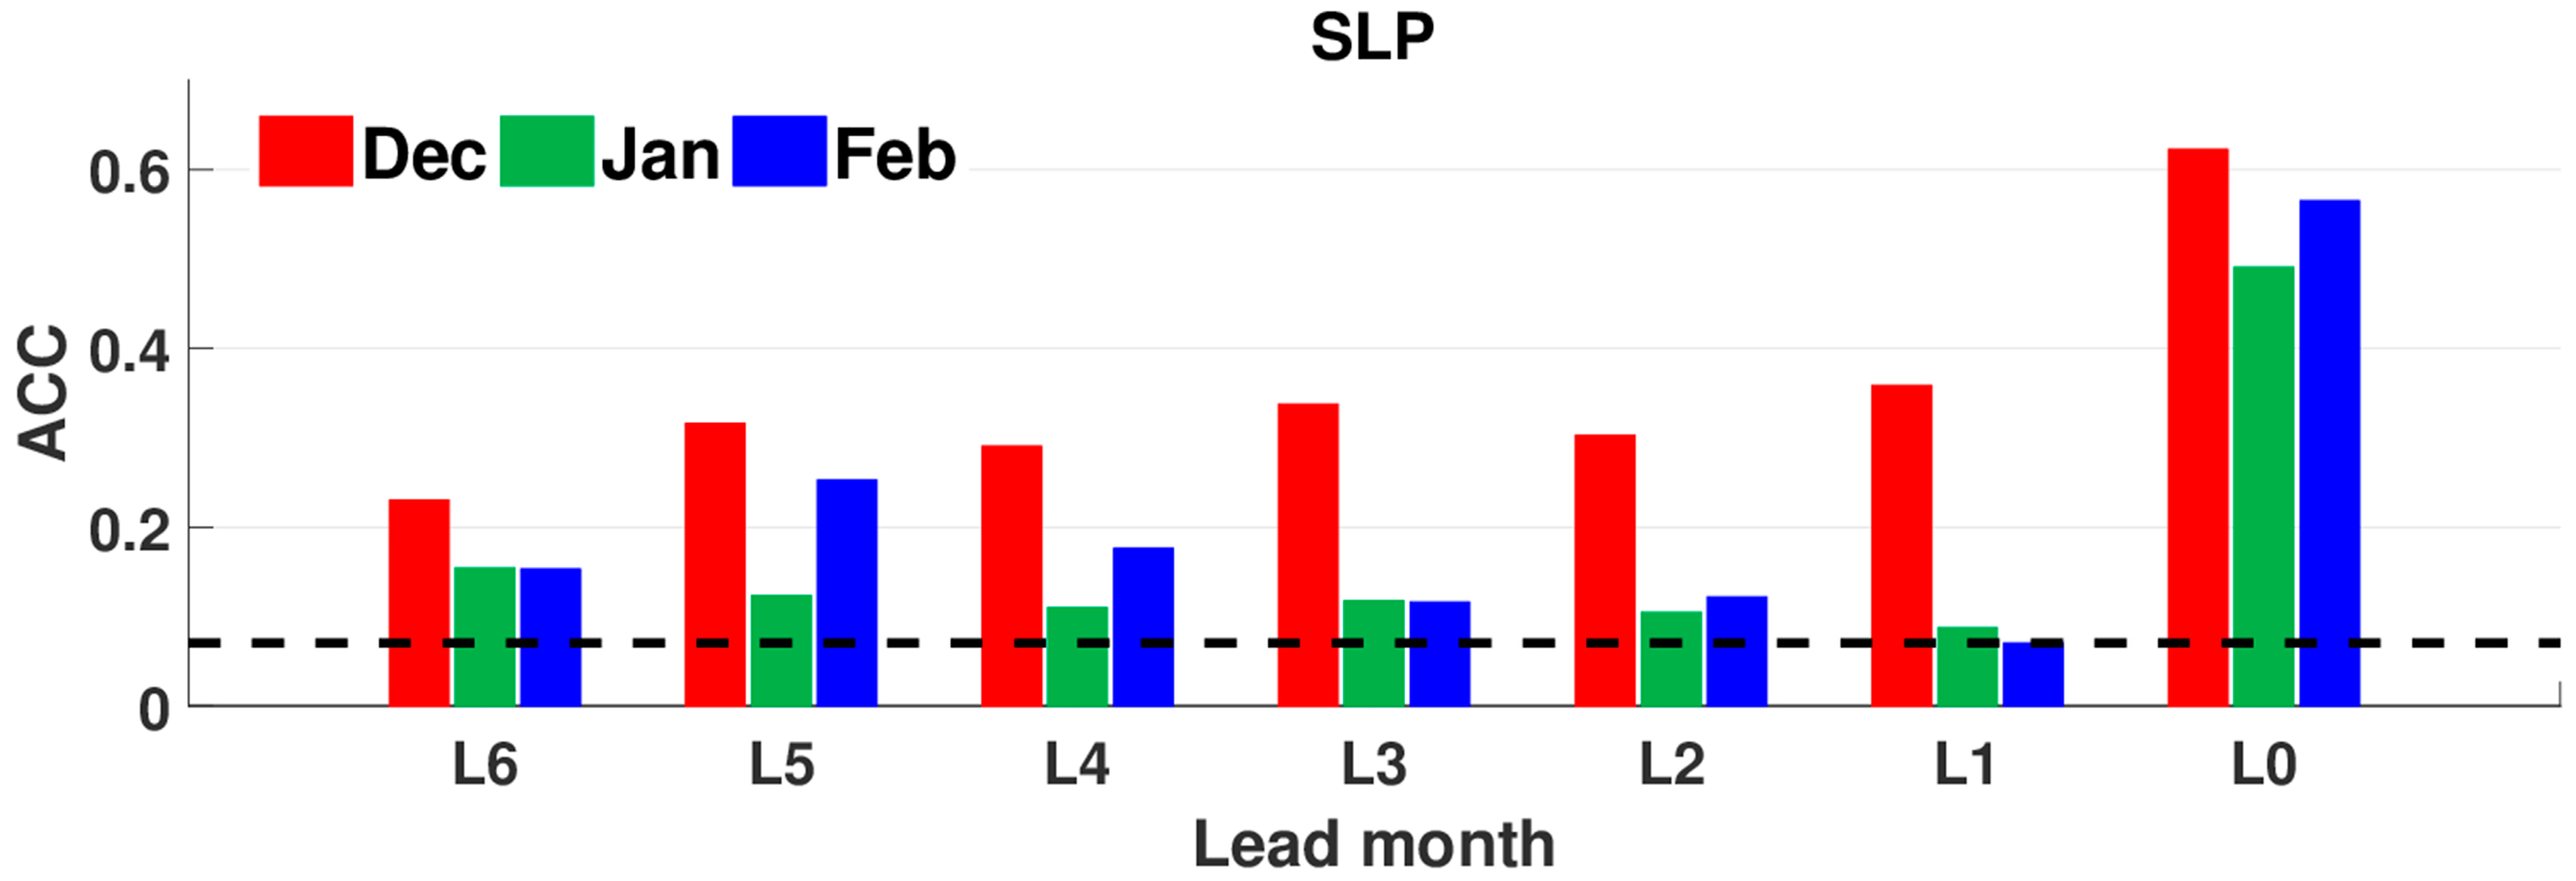
Figure 5 presents the mean spatial anomaly correlation coefficient between the monthly differences of observed and CFSv2-predicted SLP at 6- to 1-month leads in the North Atlantic (90° W–40° E, 20°–80° N) during the period 1983–2018. CFSv2 shows significant prediction skill for the spatial pattern of monthly difference of SLP anomalies in three winter months at 6- to 1-month leads. The CFSv2 model shows higher skill for the monthly difference of SLP anomalies in December (i.e., December minus November) than those in the following January and February at 6- to 1-month leads.
Previous studies have pointed out that North Atlantic SSTAs can result in local changes in surface evaporation and surface heat flux, which tend to affect the NAO phase [36,38,39]. There is a dynamic coupling between the wintertime NAO and the North Atlantic SSTA tripole [40]. The North Atlantic SSTA tripole can be considered as an important predictor of the winter NAO [21,22,27]. Therefore, we investigate the performance of CFSv2 in reproducing the NAO–North Atlantic SSTA linkage in terms of month-to-month variability.
The monthly differences of area-averaged SST over the North Atlantic region (80° W–0°, 10°–70° N) are −0.96 °C for December, −0.76 °C for January, and −0.39 °C for February, on average, for the period 1983–2018. Compared with the SST in the previous month, the largest drop in the North Atlantic SST occurs in December of the three winter months, which is conducive to strengthening the interaction between the NAO and the North Atlantic SST in December through the surface heat fluxes exchange.
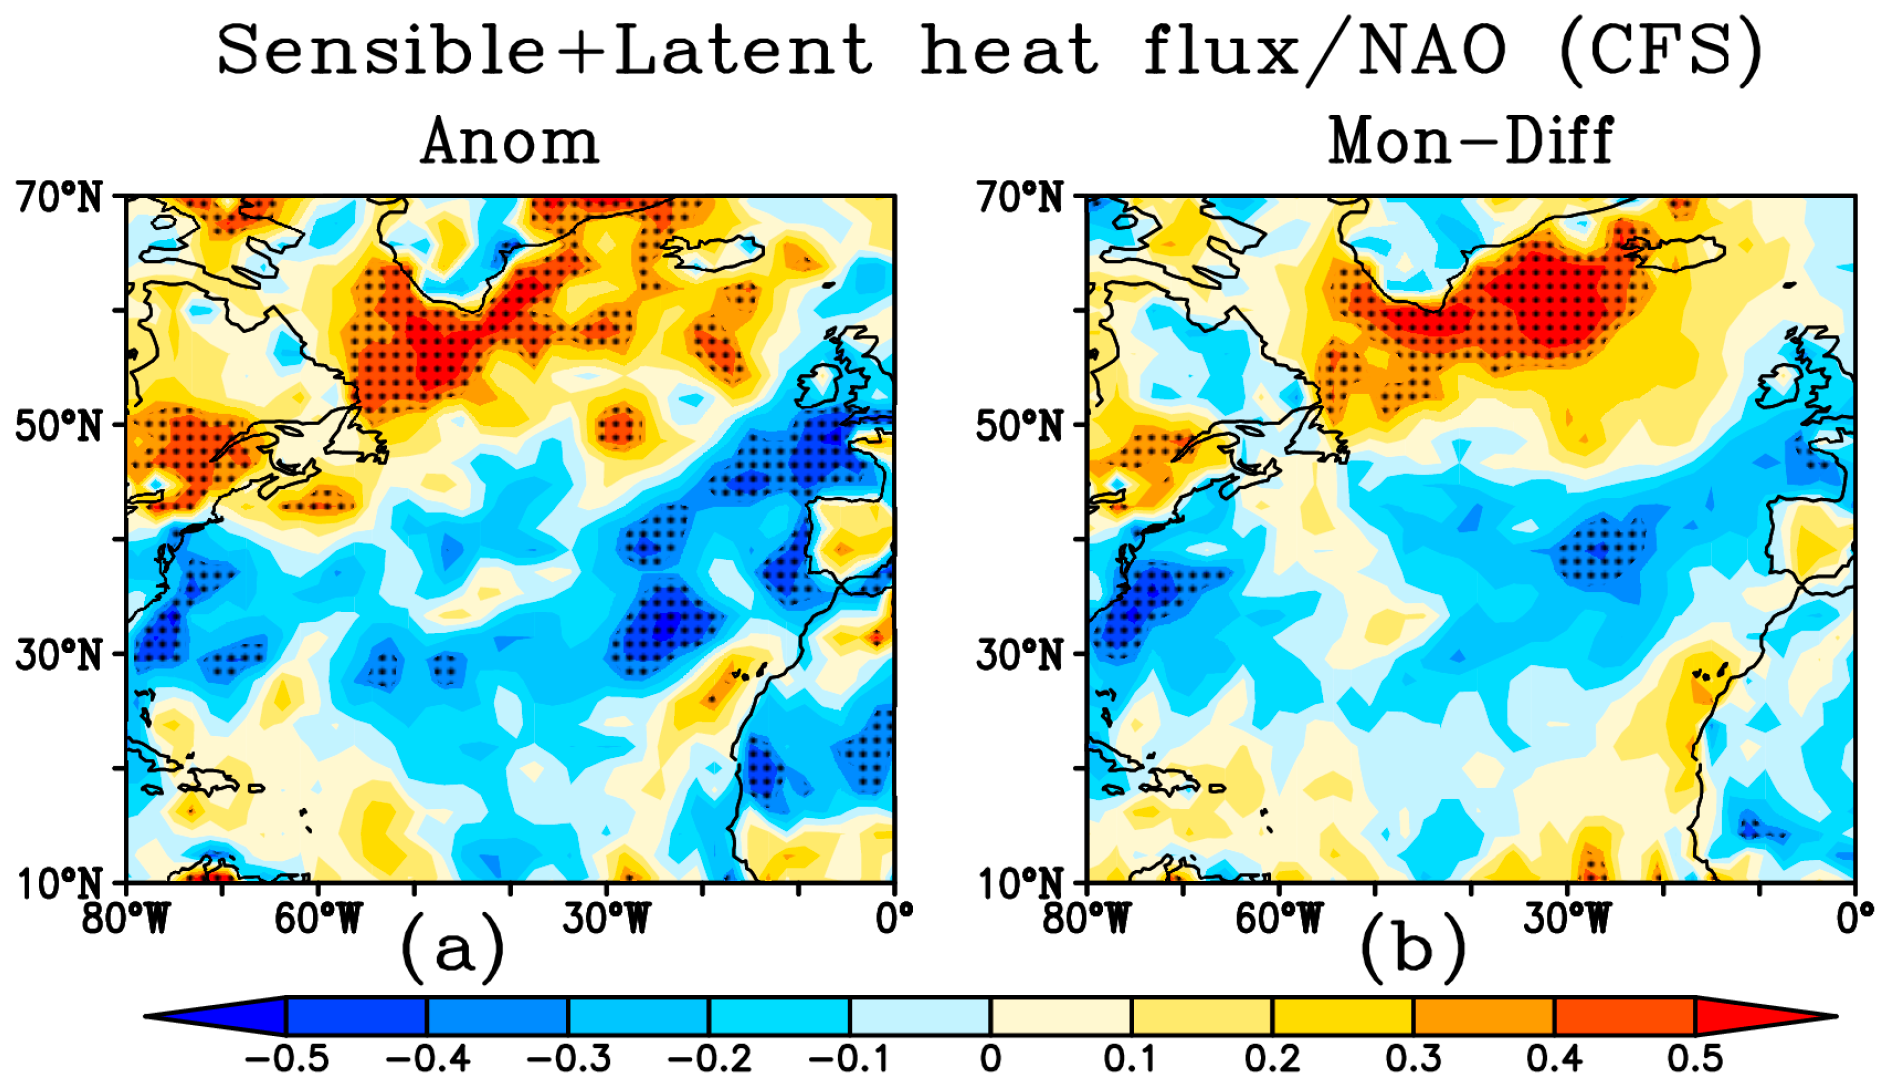
Sensible and latent heat fluxes are a primary mechanism by which the ocean vents the heat absorbed from solar radiation. To explore the predictability of the December NAO, we investigated the relationship between the monthly differences of surface heat flux over the North Atlantic region and the NAO. Sensible and latent heat fluxes at the sea surface are an important component of atmospheric forcing. The atmospheric forcing of interannual variations in North Atlantic surface temperatures takes place through the upward (downward) of sensible and latent heat fluxes, where the SST is cooler (warmer) than normal. The connection between the heat fluxes and the SSTAs is strongest in the extratropics during the winter. The latent and sensible flux anomalies are strongly correlated over most of the ocean, so they can be considered together as a sum [36]. The relationship between the monthly NAO and the sum of sensible and latent fluxes presents a similar tripole pattern in the three winter months (Figure 6a–c). As shown in Figure 6d, the tripole pattern between the monthly differences of surface heat fluxes in December is significant over the whole North Atlantic. However, the connection between the monthly differences of heat fluxes and the January NAO is strongest only in the high latitudes (Figure 6e). In February, the interaction between the monthly differences of heat fluxes and the NAO is mainly concentrated in the mid-high latitudes of the North Atlantic (Figure 6f). The significant monthly differences of surface heat fluxes in December over the whole North Atlantic are favorable for a promotion of the interaction between the NAO and the North Atlantic SSTAs, and then an improvement in the predictability of the December NAO. As shown in Figure 7, the CFSv2 model represents the relationship well between the NAO and the monthly and monthly difference of surface heat fluxes in December at one month in advance, especially in the mid-high latitudes of the North Atlantic.

3.3. Relationship between the Stratospheric Circulation and the NAO

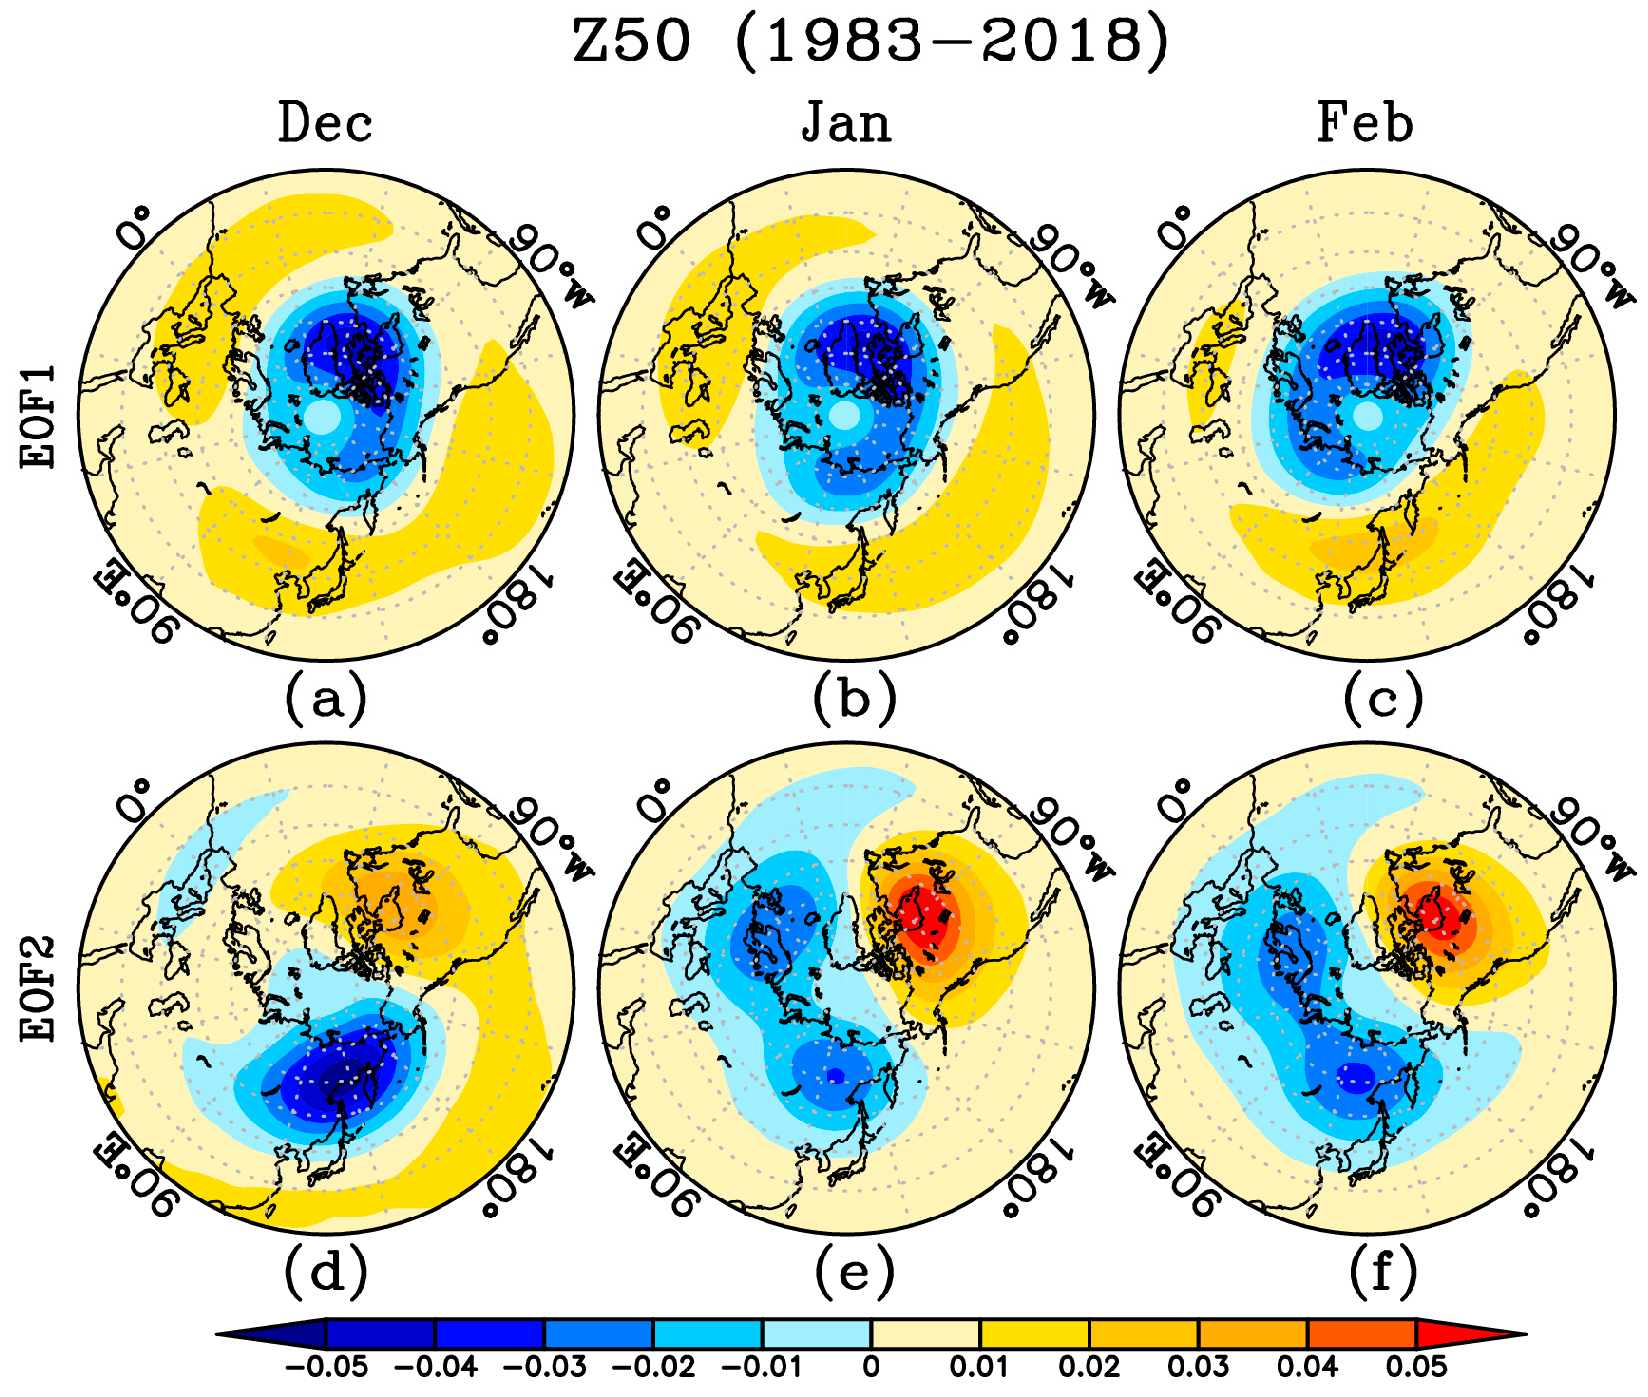
Previous studies have shown that the predictive skill and the potential predictability of the NAO are related to a high predictability of the zonal mean geopotential height in the stratosphere and near the surface [41]. The initial upper-stratospheric zonal wind anomaly contribution to the winter NAO predictability through downward propagation of the initial condition and a good representation of the stratospheric initial condition and stratospheric coupling in models is important for winter climate prediction [42]. Figure 8 shows the first and second leading EOF modes of Z50 north of 20° N in three winter months during the period 1983–2018. The Z50-EOF1 reflects the lower-stratospheric polar vortex in the three winter months [43]. There is a close relationship between the NAO and the stratospheric polar vortex, with TCCs of 0.56 for December, 0.57 for January, and 0.42 for February during the period 1983–2018, all exceeding the 95% confidence level (Figure 8a–c). However, the CFSv2 model has no prediction skill for this relationship (figure not shown). The relationships between the Arctic Osicillation and the stratospheric polar vortex are also significant, with TCCs of 0.50 for December, 0.54 for January, and 0.42 for February during the period 1983–2018. There is a significant relationship between the NAO and the PC of Z50-EOF2 in December, with a TCC of 0.46 during 1982–2017, exceeding the 99% confidence level. The percentage of the same mathematical sign of them is 72%. The second EOF mode of Z50 in December, accounting for 21% of the interannual variance, has a dipole pattern over Hudson Bay and the Sea of Okhotsk (Figure 8d). However, the second EOF mode of Z50 has two negative anomaly centers over Siberia and the Norwegian Sea and one positive anomaly center over Hudson Bay in the following January and February (Figure 8e,f). The relationships between the NAO and Z50-EOF2 weaken in January and February, with TCCs of 0.18 and 0.24, with statistical significance below the 90% confidence level.
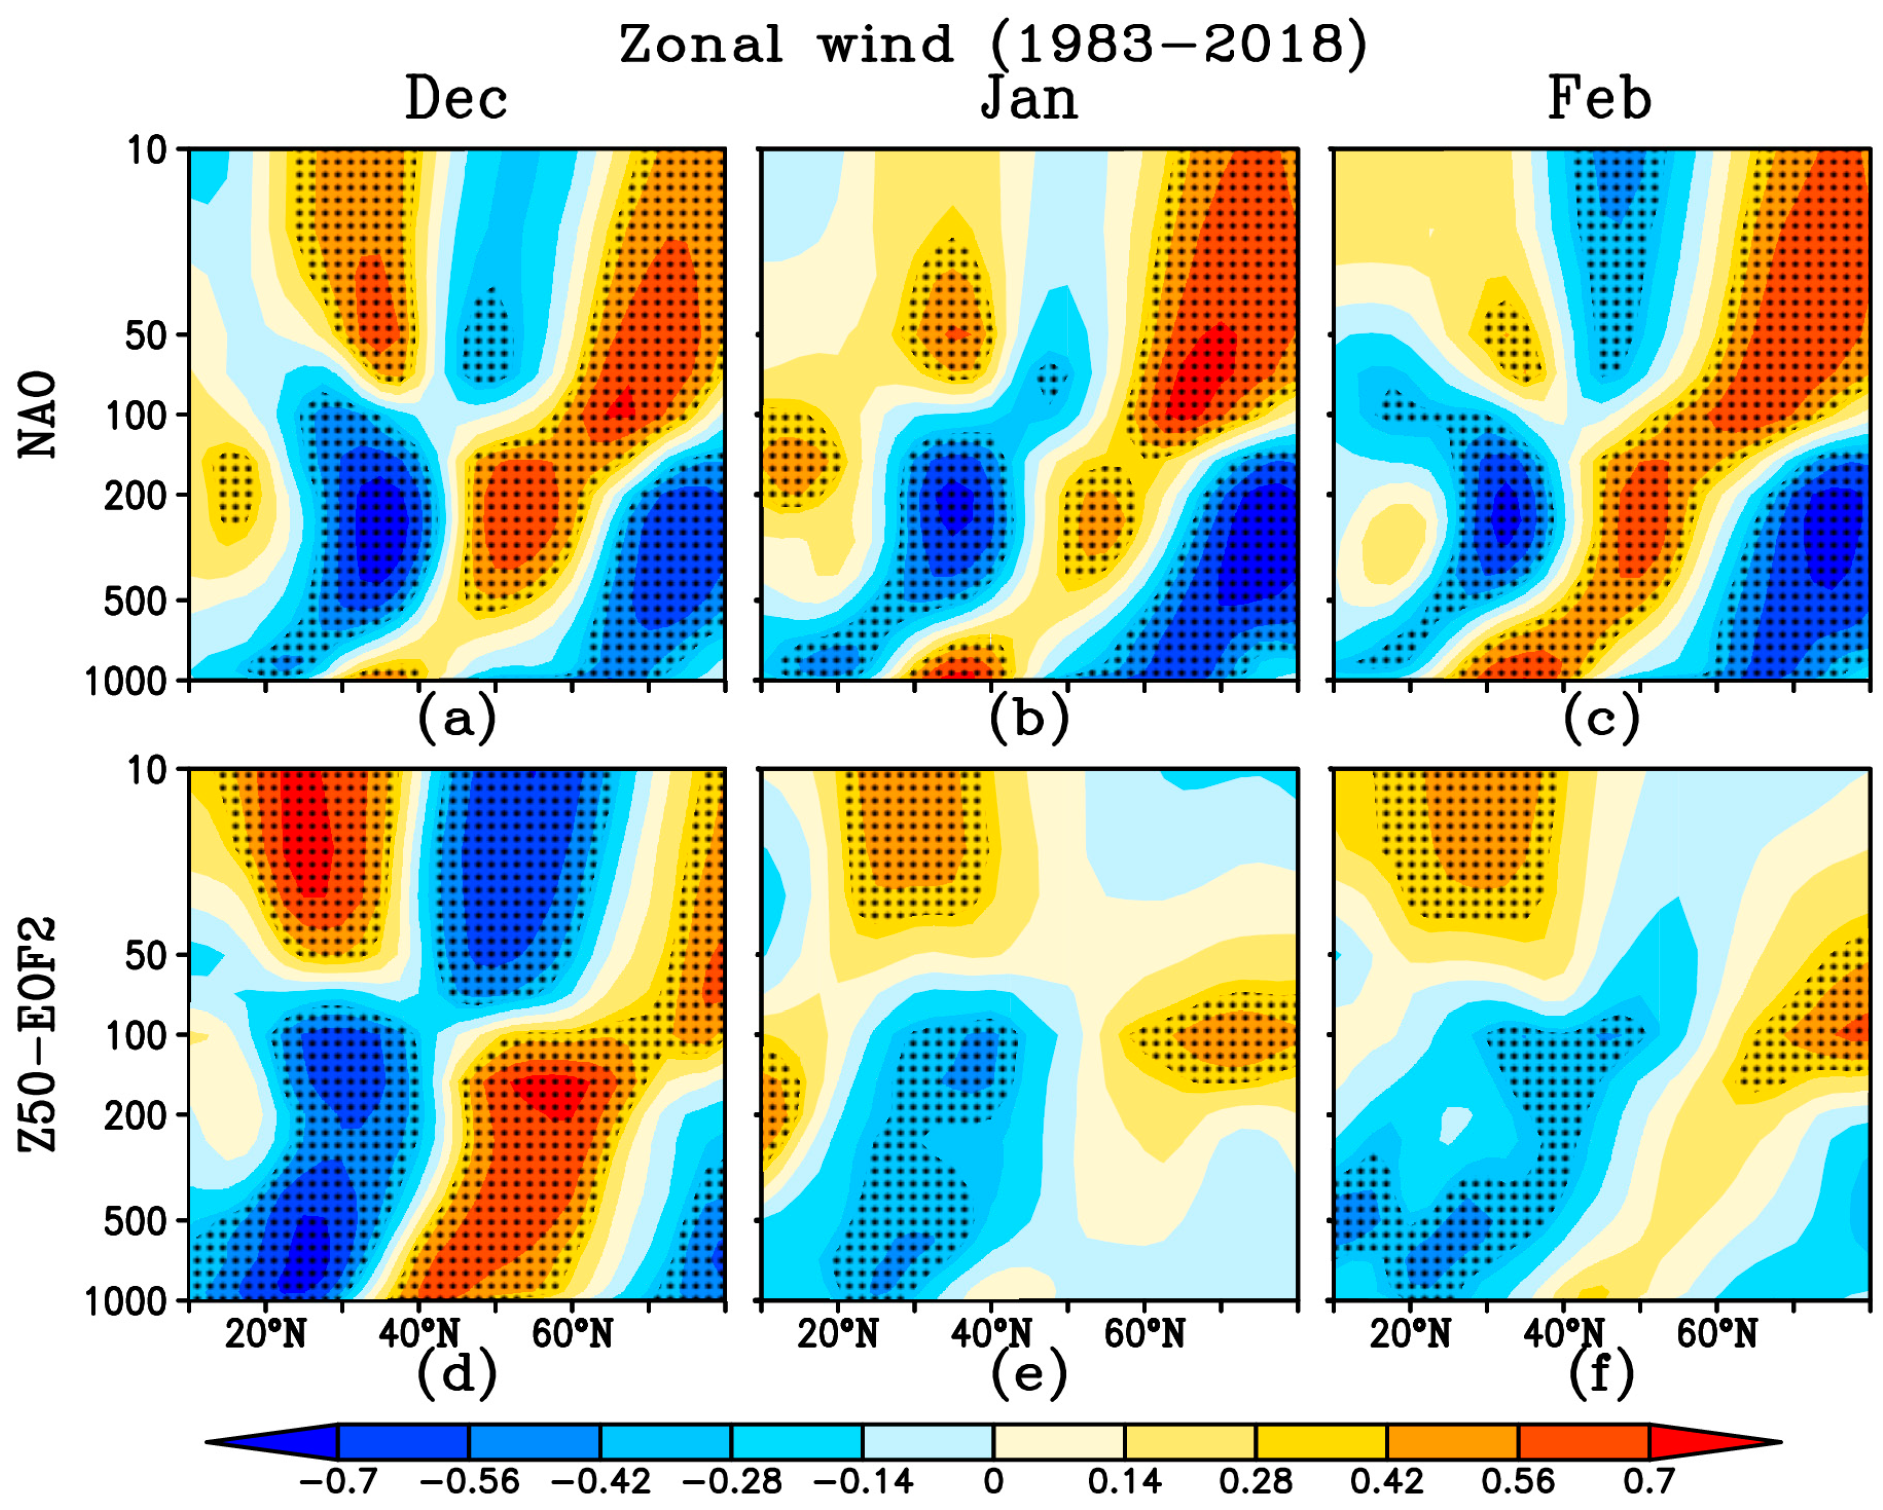
The wintertime NAO is closely related to the stratospheric circulation through downward propagation of planetary waves and zonal-mean wind anomalies [16,41,44]. To examine the linkage between the NAO and the second EOF mode of Z50 in the three winter months, the relationships between the zonal-mean zonal wind and the NAO/Z50-EOF2 are explored next. Figure 9a–c show the TCCs between the NAO and the zonal-mean (90° W–40° E) zonal wind anomalies in the three winter months. A significant positive correlation is apparent in the polar stratosphere, with further positive correlation at 20°–40° N, and a negative correlation in the stratosphere at 40°–60° N, implying that the stratospheric circulation may play a vital role in NAO predictions in the three winter months. When the NAO is in a positive phase, easterly anomalies locate at 20°–40° N and 60°–80° N, and westerly anomalies prevail in the troposphere at 40°–60° N (Figure 9a–c). As shown in Figure 9d, the correlation between the December NAO and Z50-EOF2 shows a similar spatial structure to that for the NAO. However, the relationship between the zonal wind anomalies and the Z50-EOF2 in the stratosphere at 40°–80° N and troposphere weakens in January and February (Figure 9e,f). Thus, the interaction between the stratospheric circulation and the NAO play an important role in the December NAO prediction.
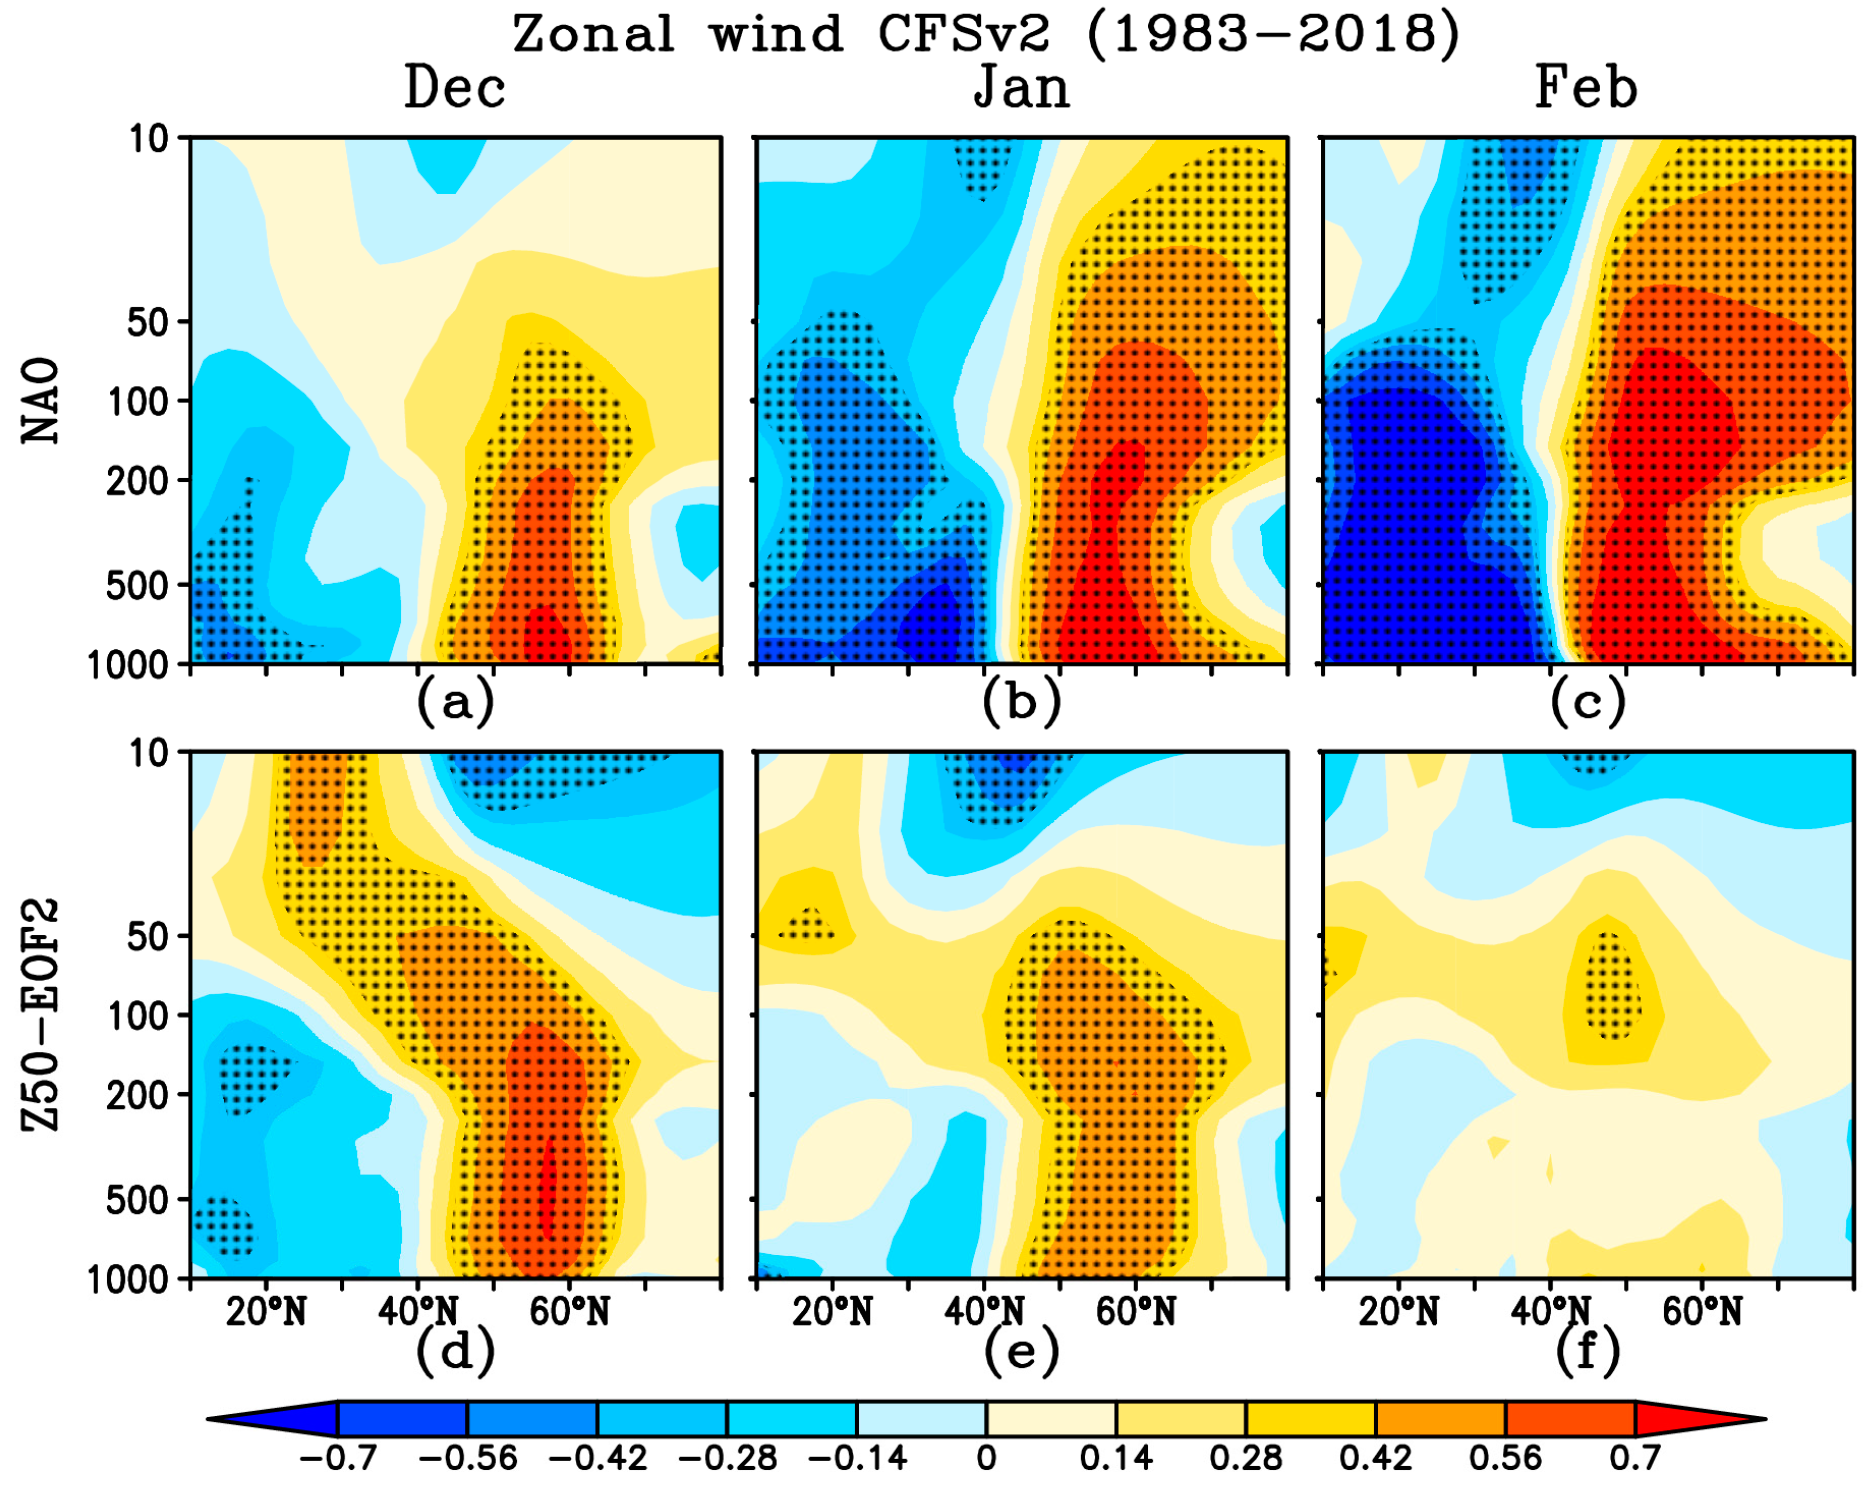
Can the CFSv2 model reproduce the interaction between the December NAO and the stratospheric circulation? Figure 10 shows the TCCs between the December NAO, Z50-EOF2 and zonal-mean zonal wind predicted by CFSv2 at a 1-month lead time during the period 1983–2018. As we can see, CFSv2 can reproduce the interaction between the December NAO and Z50-EOF2 via the zonal wind anomalies in the troposphere and stratosphere to a certain extent one month in advance, especially in the troposphere and stratosphere at 40°–60° N (Figure 10a,d). The CFSv2 model can reproduce the insignificant relationship between the NAO and Z50-EOF2 in January and February (Figure 10).
In conclusion, the stratospheric circulation may be a potential predictability source of the December NAO. The reason why CFSv2 can predict the December NAO is that the interaction between the NAO and the Z50-EOF2 can be reproduced well in CFSv2 one month in advance.

4. Discussion and Conclusions

In this study, we assessed the prediction skill of the monthly NAO by CFSv2 at different lead times. The results show that the CFSv2 model has no prediction skill for the January and February NAO at 6- to 1-month leads. However, the model does show skillful prediction of the December NAO at a 1-month ahead. There are two main contributors to the NAO predictability in December. One is the predictability of the linkage between the North Atlantic SSTA tripole and the NAO. The relationship between the NAO and SSTA tripole index in December is the most significant among the three winter months. The interaction between the December NAO and the simultaneous North Atlantic SST can be reproduced well in the CFSv2 model 1-month in advance.
According to Fan et al. [37], who proposed the ‘year-to-year increment prediction approach’, the monthly difference of a variable can better capture the month-to-month variability than the monthly anomaly. Compared with the SST in the previous month, the largest drop in the North Atlantic SST occurs in December of the three winter months. The significant monthly differences of surface heat fluxes (the sum of sensible and latent heat flux) in December over the whole North Atlantic is favorable for a promotion of the interaction between the NAO and the North Atlantic SSTAs, and then an improvement of the predictability of the December NAO. The CFSv2 model is shown to reproduce the relationship well between the NAO and the monthly and monthly difference of surface heat fluxes in December at one month in advance, especially in the mid-high latitudes of the North Atlantic.
The second EOF mode of Z50 is also an important source of NAO predictability in December. A significant positive correlation is found in the polar stratosphere, with further positive correlation at lower latitudes, and a negative correlation in the stratosphere at 40°–60° N, implying that the stratospheric circulation may play a role in December NAO prediction. The correlation between the December Z50-EOF2 and zonal-mean zonal wind anomalies shows a similar spatial structure to that for the NAO. The interaction between the NAO and the Z50-EOF2 can be reproduced well by CFSv2 one month in advance.
The North Atlantic SSTA tripole and the stratospheric flow are regarded as two main predictability sources of the December NAO. The reasons why the CFSv2 model can predict the December NAO one month ahead is that the interaction between the NAO and the North Atlantic SSTAs/Z50-EOF2 can be reproduced well by the CFSv2 model with initial conditions from the previous November.
We also assess the prediction skill December NAO by the coupled model of ENSEMBLES one month in advance. Three models (IFM-GEOMAR, UKMO and CMCC-INGV) present skillful prediction skill for the December NAO, and the relationship between the December NAO and North Atlantic SSTAs at 1-month lead. Thus, the interaction between the December NAO and simultaneous North Atlantic SSTAs plays an important role in the predictability of December NAO.
Compared to seasonal prediction of the NAO, its subseasonal prediction still needs to be improved, especially for the January and February NAO; how to further improve the predictability of the January and February NAO needs to be further explored. Snow cover should also be considered as a potential source of NAO prediction, and this too needs further exploration. Finally, whether the month-to-month variability can be applied to the prediction of the January and February NAO is another important topic for the future in this line of research.

Author Contributions

Writing–original draft, B.T.; Writing–review & editing, K.F.

Funding

This research was funded by the National Natural Science Foundation of China (Grants 41730964, 41575079, 41421004).

Acknowledgments

We would like to thank the editor and two anonymous reviewers for their diligence and thoughtful suggestions.

Conflicts of Interest

The authors declare no conflict of interest.

References

  1. Kakade, S.B.; Dugam, S.S. North Atlantic Oscillation and northern hemispheric warming. Indian J. Mar. Sci. 2006, 35, 205–209. [Google Scholar] [CrossRef]
  2. Hurrell, J.W.; Deser, C. North Atlantic climate variability: The role of the North Atlantic Oscillation. J. Mar. Syst. 2009, 78, 28–41. [Google Scholar] [CrossRef]
  3. Fu, C.B.; Zeng, S.M. The relations between the North Atlantic Oscillation on winter and summer drought/flood index in the east of China during the past 530 years. Chinese Sci. Bull. 2005, 50, 1512–1522. [Google Scholar] [CrossRef]
  4. Gong, D.Y.; Gao, Y.Q.; Guo, D.; Mao, R.; Yang, J.; Hu, M.; Gao, M.N. Interannual linkage between Arctic/North Atlantic Oscillation and tropical Indian Ocean precipitation during boreal winter. Clim. Dyn. 2014, 42, 1007–1027. [Google Scholar] [CrossRef]
  5. Li, J.; Fan, K.; Xu, Z. Links between the late wintertime North Atlantic Oscillation and springtime vegetation growth over Eurasia. Clim. Dyn. 2015, 1–14. [Google Scholar] [CrossRef]
  6. Zhou, B.; Cui, X. Interdecadal change of the linkage between the North Atlantic Oscillation and the tropical cyclone frequency over the western North Pacific. Sci. China Earth Sci. 2014, 57, 2148–2155. [Google Scholar] [CrossRef]
  7. Sung, M.K.; Kwon, W.T.; Baek, H.J.; Boo, K.O.; Lim, G.H.; Kug, J.S. A possible impact of the North Atlantic Oscillation on the east Asian summer monsoon precipitation. Geophys. Res. Lett. 2006, 33, L21713. [Google Scholar] [CrossRef]
  8. Ogi, M.; Tachibana, Y.; Yamazaki, K. Impact of the wintertime North Atlantic Oscillation (NAO) on the summertime atmospheric circulation. Geophys. Res. Lett. 2003, 30, 1704. [Google Scholar] [CrossRef]
  9. Czaja, A.; Frankignoul, C. Observed impact of Atlantic SST anomalies on the North Atlantic Oscillation. J. Clim. 2002, 15, 606–623. [Google Scholar] [CrossRef]
  10. Peng, S.L.; Robinson, W.A.; Li, S.L. North Atlantic SST forcing of the NAO and relationships with intrinsic hemispheric variability. Geophys. Res. Lett. 2002, 29, 4. [Google Scholar] [CrossRef]
  11. Han, Z.; Luo, F.F.; Wan, J.H. The observational influence of the North Atlantic SST tripole on the early spring atmospheric circulation. Geophys. Res. Lett. 2016, 43, 2998–3003. [Google Scholar] [CrossRef] [Green Version]
  12. Sutton, R.T.; Norton, W.A.; Jewson, S.P. The North Atlantic Oscillation-what role for the ocean? Atmos. Sci. Lett. 2000, 1, 89–100. [Google Scholar] [CrossRef]
  13. Robertson, A.W.; Mechoso, C.R.; Kim, Y.-J. The Influence of Atlantic Sea Surface Temperature Anomalies on the North Atlantic Oscillation*. J. Clim. 2000, 13, 122–138. [Google Scholar] [CrossRef] [Green Version]
  14. Mochizuki, T.; Awaji, T.; Sugiura, N. Possible oceanic feedback in the extratropics in relation to the North Atlantic SST tripole. Geophys. Res. Lett. 2009, 36, 5. [Google Scholar] [CrossRef]
  15. Deser, C.; Timlin, M.S. Atmosphere-ocean interaction on weekly timescales in the North Atlantic and Pacific. J. Clim. 1997, 10, 393–408. [Google Scholar] [CrossRef]
  16. Baldwin, M.P.; Cheng, X.H.; Dunkerton, T.J. Observed correlations between winter-mean tropospheric and stratospheric circulation anomalies. Geophys. Res. Lett. 1994, 21, 1141–1144. [Google Scholar] [CrossRef]
  17. Hansen, F.; Greatbatch, R.J.; Gollan, G.; Jung, T.; Weisheimer, A. Remote control of North Atlantic Oscillation predictability via the stratosphere. Q. J. R. Meteorol. Soc. 2017, 143, 706–719. [Google Scholar] [CrossRef]
  18. Scaife, A.A.; Karpechko, A.Y.; Baldwin, M.P.; Brookshaw, A.; Butler, A.H.; Eade, R.; Gordon, M.; MacLachlan, C.; Martin, N.; Dunstone, N.; et al. Seasonal winter forecasts and the stratosphere. Atmos. Sci. Lett. 2016, 17, 51–56. [Google Scholar] [CrossRef]
  19. Kunz, T.; Fraedrich, K.; Lunkeit, F. Impact of Synoptic-Scale Wave Breaking on the NAO and Its Connection with the Stratosphere in ERA-40. J. Clim. 2009, 22, 5464–5480. [Google Scholar] [CrossRef]
  20. Wang, L.; Ting, M.; Kushner, P.J. A robust empirical seasonal prediction of winter NAO and surface climate. Sci. Rep. 2017, 7, 9. [Google Scholar] [CrossRef]
  21. Tian, B.Q.; Fan, K. A skillful prediction model for winter NAO based on Atlantic sea surface temperature and Eurasian snow cover. Weather Forecast. 2015, 30, 197–205. [Google Scholar] [CrossRef]
  22. Saunders, M.A.; Qian, B.D. Seasonal predictability of the winter NAO from north Atlantic sea surface temperatures. Geophys. Res. Lett. 2002, 29, 2043. [Google Scholar] [CrossRef]
  23. Dunstone, N.; Smith, D.; Scaife, A.; Hermanson, L.; Eade, R.; Robinson, N.; Andrews, M.; Knight, J. Skilful predictions of the winter North Atlantic Oscillation one year ahead. Nat. Geosci. 2016, 9, 809–814. [Google Scholar] [CrossRef]
  24. Müller, W.A.; Appenzeller, C.; Schär, C. Probabilistic seasonal prediction of the winter North Atlantic Oscillation and its impact on near surface temperature. Clim. Dyn. 2005, 24, 213–226. [Google Scholar] [CrossRef]
  25. Yuan, S.; Luo, X.; Mu, B.; Li, J.; Dai, G. Prediction of North Atlantic Oscillation index with convolutional LSTM based on ensemble empirical mode decomposition. Atmosphere 2019, 10, 252. [Google Scholar] [CrossRef]
  26. Saito, N.; Maeda, S.; Nakaegawa, T.; Takaya, Y.; Imada, Y.; Matsukawa, C. Seasonal predictability of the North Atlantic Oscillation and zonal mean fields associated with stratospheric influence in JMA/MRI-CPS2. Sola 2017, 13, 209–213. [Google Scholar] [CrossRef]
  27. Ke, F.; Baoqiang, T.; Huijun, W. New approaches for the skillful prediction of the winter North Atlantic Oscillation based on coupled dynamic climate models. Int. J. Clim. 2016, 36, 82–94. [Google Scholar] [CrossRef]
  28. Xu, X.P.; Li, F.; He, S.P.; Wang, H.J. Subseasonal reversal of East Asian surface temperature variability in winter 2014/15. Adv. Atmos. Sci. 2018, 35, 737–752. [Google Scholar] [CrossRef]
  29. Zuo, J.Q.; Ren, H.L.; Li, W.J. Contrasting impacts of the Arctic Oscillation on surface air temperature anomalies in Southern China between early and middle-to-late winter. J. Clim. 2015, 28, 4015–4026. [Google Scholar] [CrossRef]
  30. Hu, Y.Y.; Tung, K.K.; Liu, J.P. A closer comparison of early and late-winter atmospheric trends in the northern hemisphere. J. Clim. 2005, 18, 3204–3216. [Google Scholar] [CrossRef]
  31. Zuo, J.Q.; Ren, H.L.; Wu, J.; Nie, Y.; Li, Q.P. Subseasonal variability and predictability of the Arctic Oscillation/North Atlantic Oscillation in BCCAGCM2.2. Dyn. Atmos. Oceans 2016, 75, 33–45. [Google Scholar] [CrossRef]
  32. Huang, B.; Freeman, E.; Lawrimore, J.H.; Liu, W.; Peterson, T.C.; Smith, T.M.; Thorne, P.; Woodruff, S.; Zhang, H.M.; Banzon, P.V.F. Extended Reconstructed Sea Surface Temperature Version 4 (ERSST.v4), Part I. Upgrades and Intercomparisons. J. Clim. 2015, 28, 911–930. [Google Scholar] [CrossRef]
  33. Saha, S.; Moorthi, S.; Wu, X.; Wang, J.; Nadiga, S.; Tripp, P.; Behringer, D.; Hou, Y.-T.; Chuang, H.-y.; Iredell, M.; et al. The NCEP climate forecast system version 2. J. Clim. 2014, 27, 2185–2208. [Google Scholar] [CrossRef]
  34. Weisheimer, A.; Doblas-Reyes, F.J.; Palmer, T.N.; Alessandri, A.; Arribas, A.; Deque, M.; Keenlyside, N.; MacVean, M.; Navarra, A.; Rogel, P. ENSEMBLES: A new multi-model ensemble for seasonal-to-annual predictions-Skill and progress beyond DEMETER in forecasting tropical Pacific SSTs. Geophys. Res. Lett. 2009, 36, L21711. [Google Scholar] [CrossRef]
  35. Hurrell, J.W. Decadal trends in the North Atlantic Oscillation: regional temperatures and precipitation. Science 1995, 269, 676–679. [Google Scholar] [CrossRef]
  36. Cayan, D.R. Latent and sensible heat flux anomalies over the northern oceans: driving the sea surface temperature. J. Phys. Oceanogr. 1992, 22, 859–881. [Google Scholar] [CrossRef]
  37. Fan, K.; Wang, H.J.; Choi, Y.J. A physically-based statistical forecast model for the middle-lower reaches of the Yangtze River Valley summer rainfall. Chinese Sci. Bull. 2008, 53, 602–609. [Google Scholar] [CrossRef]
  38. Ting, M.F.; Lau, N.C. A diagnostic and modelling study of the monthly mean wintertime anomalies appearing in a 100-year GCM experiment. J. Atmos. Sci. 1993, 50, 2845–2867. [Google Scholar] [CrossRef]
  39. Rodwell, M.; Rowell, D.; Folland, C. Oceanic forcing of the wintertime North Atlantic Oscillation and European climate. Nature 1999, 398, 320–323. [Google Scholar] [CrossRef]
  40. Pan, L.L. Observed positive feedback between the NAO and the North Atlantic SSTA tripole. Geophys. Res. Lett. 2005, 32, 4. [Google Scholar] [CrossRef]
  41. Andrews, M.B.; Knight, J.R.; Scaife, A.A.; Lu, Y.; Wu, T.; Gray, L.J.; Schenzinger, V. Observed and simulated teleconnections between the stratospheric Quasi-Biennial Oscillation and Northern Hemisphere winter atmospheric circulation. J. Geophys. Res. Atmos. 2019, 124, 1219–1232. [Google Scholar] [CrossRef]
  42. Nie, Y.; Scaife, A.A.; Ren, H.-L.; Comer, R.E.; Andrews, M.B.; Davis, P.; Martin, N. Stratospheric initial conditions provide seasonal predictability of the North Atlantic and Arctic Oscillations. Environ. Res. Lett. 2019, 14, 7. [Google Scholar] [CrossRef]
  43. Baldwin, M.P.; Dunkerton, T.J. Stratospheric harbingers of anomalous weather regimes. Science 2001, 294, 581–584. [Google Scholar] [CrossRef] [PubMed]
  44. Black, J.; Johnson, N.C.; Baxter, S.; Feldstein, S.B.; Harnos, D.S.; L’Heureux, M.L. The predictors and forecast skill of Northern Hemisphere teleconnection patterns for lead times of 3-4 weeks. Mon. Weather Rev. 2017, 145, 2855–2877. [Google Scholar] [CrossRef]
Figure 1. The first leading empirical orthogonal function (EOF) mode of the sea level pressure anomaly in December (a), January (b), and February (c) in the North Atlantic (20°–80° N, 90° W–40° E).
Atmosphere 10 00477 g001
Figure 2. The prediction skill (time correlation coefficient (TCC, a) and root-mean-square error (RMSE, b) of the North Atlantic Oscillation (NAO) in December (red bars), January (green bars), and February (blue bars) predicted by the Climate Forecast System, version 2 (CFSv2) at different lead times (months).
Atmosphere 10 00477 g002
Figure 3. TCCs between the observed sea surface temperature anomaly (SSTA) and the NAO in December (a), January (b), and February (c). The second EOF mode of the SSTA in December (d), January (e), and February (f). Dotted areas indicate statistical significance at the 95% confidence level, as estimated by a local Student’s t-test.
Atmosphere 10 00477 g003
Figure 4. TCCs between the NAO and SSTA tripole index in December. L6–L1 refer to the CFSv2-predicted TCCs for initial months from June to November. OBS means the observed TCCs in December, January, and February. The black lines indicate statistical significance at the 99% confidence level, as estimated by a local Student’s t-test.
Atmosphere 10 00477 g004
Figure 5. The spatial anomaly correlation coefficient (ACC) between the observed and CFSv2-predicted sea level pressure (SLP) monthly differences at 6- to 1-month leads in the North Atlantic (20°–80° N, 90° W–40° E). The black lines indicate statistical significance at the 99% confidence level, as estimated by a local Student’s t-test.
Atmosphere 10 00477 g005
Figure 6. TCCs between the observed NAO and the monthly (ac) and monthly difference of (df) heat fluxes (sum of sensible and latent heat flux) in December (a,d), January (b,e), and February (c,f). Dotted areas indicate statistical significance at the 95% confidence level, as estimated by a local Student’s t-test.
Atmosphere 10 00477 g006
Figure 7. TCCs between the CFSv2-predicted NAO and the monthly (a) and monthly difference of (b) heat fluxes (sum of sensible and latent heat flux) in December at a 1- month lead. Dotted areas indicate statistical significance at the 95% confidence level, as estimated by a local Student’s t-test.
Atmosphere 10 00477 g007
Figure 8. The first (ac) and second (df) leading mode of geopotential height at 50 hPa in December (a,d), January (b,e), and February (c,f).
Atmosphere 10 00477 g008
Figure 9. TCCs of zonal-mean wind with the observed NAO (ac), and the PC2 of Z50 (df) in December (a,d), January (b,e), and February (c,f) during the period 1983–2018. Dotted areas indicate statistical significance at the 95% confidence level, as estimated by a local Student’s t-test.
Atmosphere 10 00477 g009
Figure 10. TCCs between the NAO and zonal mean zonal wind (ac), and TCCs between the principal component (PC) of Z50-EOF2 and zonal-mean zonal wind predicted by CFSv2 (df) in December (a,d), January (b,e), and February (c,f) at one month lead time during the period 1983–2018. Dotted areas indicate statistical significance at the 95% confidence level, as estimated by a local Student’s t-test.
Atmosphere 10 00477 g010