Article

The Foshan Total Lightning Location System in China and Its Initial Operation Results

School of Electrical Engineering and Automation, Wuhan University, Wuhan 430072, China
*
Authors to whom correspondence should be addressed.
Atmosphere 2019, 10(3), 149; https://doi.org/10.3390/atmos10030149
Submission received: 29 January 2019 / Revised: 2 March 2019 / Accepted: 13 March 2019 / Published: 19 March 2019
(This article belongs to the Section Meteorology)

Abstract

:
In the summer of 2013, a three-dimensional (3D)-based Foshan Total Lightning Location System (FTLLS), embedded with differential time of arrival (DTOA) techniques, was installed and started its operation in Foshan, Guangdong Province, China. In this paper, the geographical distribution and set-up information of FTLLS, the estimated locating errors and locating results, as well as its initial operation results are presented. FTLLS consists of nine sub-stations that receive electromagnetic waves associated with lightning discharges and locates VLF/LF (200 Hz–500 kHz) radiation sources in 3D. The remote sub-stations acquired triggered waveforms with a duration of 0.5 ms, a resolution of 12-bits, and a GPS-based sferic time tags of 24 h per day. Cloud-to-ground (CG) lightning events, intra-cloud (IC) lightning events and narrow bipolar events (NBEs) were located by FTLLS. Based on the Monte Carlo simulation, the two-dimensional horizontal location error is basically less than 100 m, and the vertical error (altitude) is less than 200 m when the lightning event occurs within the network. On the other hand, over 14 million lightning strikes were recorded successfully by FTLLS during the period of May to October in 2014, among which IC events, CG events and NBEs accounted for 65%, 34% and 1%, respectively. It is shown that FTLLS is capable of a fine three-dimensional (3D) location, in which the altitude parameters obtained are reasonable and well consistent with observed data in the previous studies. The location results of thunderstorms were additionally verified through simultaneously-observed radar data.

1. Introduction

Lightning location systems (LLSs) can be classified as being either satellite-based or ground-based depending on where the sensors are installed [1]. Different from LLSs installed on satellites in polar orbits [2], the ground-based LLSs are continuous on lightning location, which provides extensive applications in studying lightning flash processes and monitoring thunderstorms. Electromagnetic field location technology adopting the time of arrival (TOA) method based on the low and very low frequency (LF/VLF) bands has been developed rapidly in recent decades [3]. The two-dimensional (2D) locations and estimated current peaks were accessible through a traditional LF/VLF lightning detection network. On the other hand, identification technology of lightning (i.e., intra-cloud lightning (IC), cloud-to-ground lightning (CG), and narrow bipolar events (NBEs)) in the LF/VLF frequency band has been developed rapidly, which supports the current work of updating of previously-focused CG detection of LLSs.
Nowadays, various institutions in the United States, Japan, and Germany have conducted three-dimensional (3D) detection technology research on lightning for a clearer understanding of its occurrence and its development mechanism inside [4,5]. The Los Alamos Sferic Array system (LASA), established in 1998 in New Mexico State to provide lightning demarcation in cooperation with satellite observation working at LF/VLF frequency and developed by the Los Alamos National Laboratory (LANL), is capable of high-precision 3D location of total lightning discharge [6,7]. Similarly, working on the LF/VLF bandwidth, Karunarathne [8] developed a fast antenna network called the Position by Fast Antenna (PBFA) system operating in the frequency band of 1.6–630 kHz to locate the lightning process, using the time of arrival (TOA) technique, which consists of ten observation sub-stations. The location results show that PBFA has the advantage of capturing pulse information in the initial phase of lightning. On the other hand, a 3D lightning radiation source location system working at very high frequency (VHF), the LMA system, developed by New Mexico Mining Technical College of the USA, adopted DTOA techniques based on GPS clock synchronization for lightning positioning [9,10]. Bitzer [11] successfully mapped the development of single lightning flashes and cloud lightning flashes based on the Huntsville Alabama Marx Meter Array (HAMMA) in the United States with a detection frequency from 1 Hz to 400 kHz. Comparing the HAMMA data with those from two other well-documented arrays, namely the North Alabama Lightning Mapping (NALMA) in the VHF band and the NLDN in the VLF/LF band, HAMMA can match the location results of NALMA in time and space for the development of lightning channels. In addition, HAMMA can locate more impulse information than NALMA in the initial phase of lightning.
In Japan, Yoshida [12] made a network (with a working frequency of 800 Hz to 500 kHz) known as the Broadband Observation network for Lightning and Thunderstorm (BOLT), which results have shown is able to describe the developing characteristics of IC and CG flashes. Betz set up a lightning location system (LINET) similar to LASA in Germany, which can distinguish between IC lightning and CG lightning according to the heights of lightning radiation sources. The determination of source altitude is done with the quasi-3D technology of the sensor that’s closest to the lightning source [13,14,15,16].
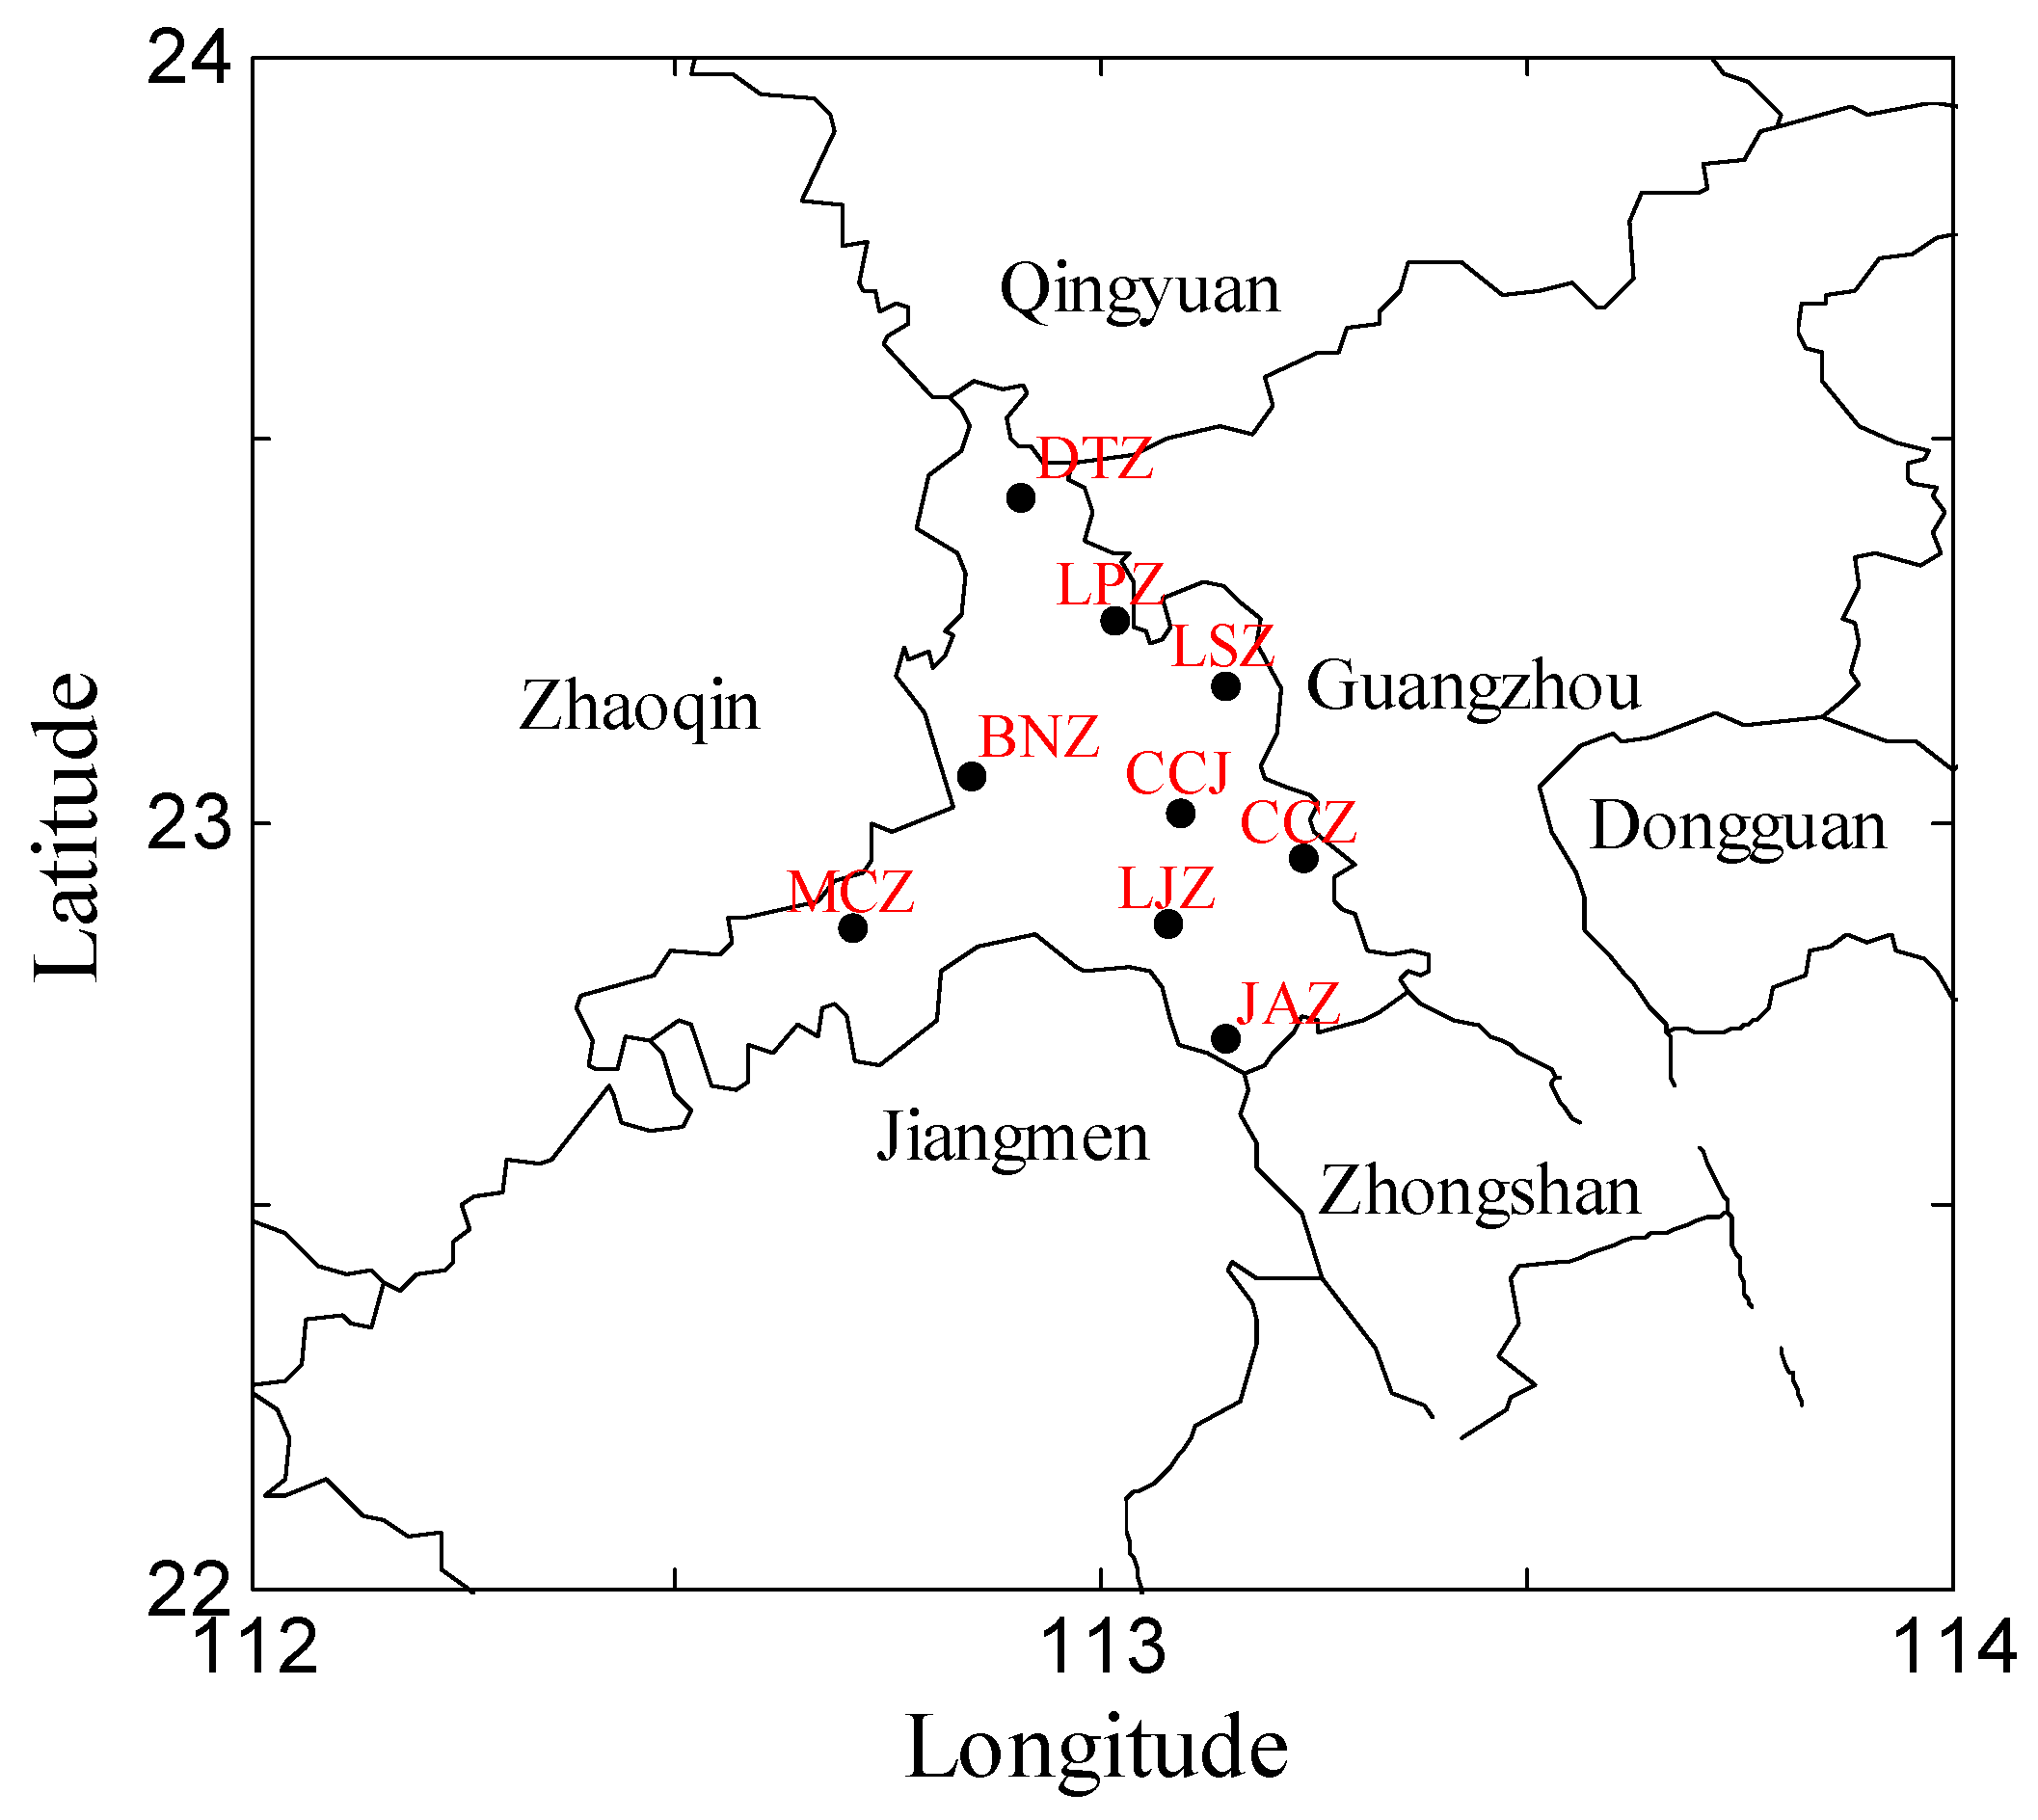
Considering the above motivations for elevating the applications of lightning data to research on atmospheric electricity, in 2013, we established the FTLLS based on DTOA techniques [17] in the Foshan area, Guangdong Province, China. In this paper, we document the configuration and setup information of the FTLLS in detail, evaluate its performance and describe its initial operation in 2014. The observation results mentioned in the study serve as a vital reference information of FTLLS.

2. Instruments and Experimental Setup

2.1. FTLLS (Foshan Total Lightning Location System) Arrangement

In the summer of 2013, FTLLS started its operation, which is composed of nine sub-stations, namely: Chencun station (CCZ), Mingcheng station (MCZ), Datang station (DTZ), Baini station (BNZ), Junan station (JAZ), Lishui station (LSZ), Chancheng station (CCJ), Leping station (LPZ) and Longjiang station (LJZ). The distribution of the nine sub-stations is shown in Figure 1. The distance between each sub-station is generally 10 to 40 km. The DTZ, MCZ and JAZ sub-stations are far apart, forming a longer baseline, which can effectively improve the locating accuracy, while the remaining sub-stations are densely distributed.
Figure 2 illustrates the installation diagram of the sub-station of the FTLLS. All nine sub-stations are installed on the roof of the buildings of subsidiaries of the Foshan Power Company, China Southern Power Grid. Power supply is achieved via 220 V AC power network. Wide-band electric field measuring systems with a 3 dB bandwidth from 200 Hz to 500 kHz are employed to measure the lightning electromagnetic impulses. Each sub-station contains a GPS antenna, GPS card, data acquisition card, electrical field antenna, as well as an industrial personal computer. Specifically, GPS antenna and GPS card provide precise clock and precise geographic coordinates of the sub-station, data acquisition card (PCI 9812) is responsible for electrical field waveform acquisition with a 10 MHz sampling rate and 12-bit resolution. The electrical field antenna serves as the sensor to obtain radiation signals generated by lightning. Due to different network environments, each sub-station uses a 4 G wireless network or intranet to connect to the location network. The industrial personal computer stores the collected lightning radiation signals and processes the signals preliminarily. Each sub-station is operating independently.

2.2. Fast Antenna

The VLF/LF sensors adopted in FTLLS are similar with that in [18]. The VLF/LF electric field change can be detected by this kind of sensor effectively, of which the decay time constant is 1 ms. The equivalent circuit of flat plate antenna is shown in Figure 3.
The equivalent circuit current of antenna I s is determined by the antenna equivalent area A and incident flux rate of change d D ( t ) / d t :
I S ( t ) = A d D ( t ) d t = A ε d E ( t ) d t
where ε is the dielectric constant, C 2 is the antenna circuit board equivalent capacitance to ground, R 0 is the coaxial cable termination resistor, typically 50 Ω . From the formula (1), we can deduce the following:
d E ( t ) d t = C 2 A ε d u 1 ( t ) d t + u 1 ( t ) R 0 A ε
E ( t ) = C 2 A ε u 1 ( t ) + 1 R 0 A ε u 1 ( t ) d t
For 1 / ω C 2 > > R 0 :
E ( t ) = 1 R 0 A ε u 1 ( t ) d t
If the time constant RC is greater than the time to be measured, the effect on the measurement of R can be ignored. As a result, the output voltage U 2 can be obtained as follows:
U 2 ( t ) = 1 R 0 C U 1 ( t ) d t
U 2 ( t ) = A ε C E ( t )
From formula (6), it is shown that the VLF/LF antenna output voltage is positive proportional to the antenna equivalent area A. In particular, an effective way to improve the sensitivity of the sensor was increasing the antenna equivalent area A, which could account for the VLF/LF antennas installing on the top of building and the sensor head fixing about 1 m above the ground, as shown in Figure 2b.
The frequency response of the sensor was tested by the rising edge of the square wave generator from 100 Hz to 1 MHz, with the sensor output 1 V corresponding to about 120 V/m. The amplitude-frequency response characteristics was shown in Figure 4, which indicates fine working frequency bandwidth from 200 Hz to 500 kHz.

2.3. Data Triggered and Acquisition

A reasonable triggered mode contributes to a better detection sensitivity for lightning electromagnetic impulses and prevention of unnecessary false trigger. Taking into account the differences in the electromagnetic background environment of various sub-stations of the FTLLS, based on the so-called bipolar floating level algorithms which adjust the related triggered level in the different electromagnetic environments automatically. The FTLLS adopts bipolar floating level triggering algorithms based on software automatic adjustment [17]. The specific methods are as follows: the trigger threshold is set to the bipolar floating trigger level of the floating background, and the trigger algorithm continuously monitors the low frequency non-lightning interference in a kHz data stream averaging mode. The trigger mode design allows the system itself to adjust the trigger threshold in real time, which maximizes the antenna sensitivity and detection efficiency, and can reasonably control the false trigger.
Currently, the recording length is set to 500 μs with 150 μs as the pre-trigger. Based on the function of collecting lightning radiation signals and field waveform recording, FTLLS could observe the relationship between lightning electric field waveform characteristics and propagation distance via multiple-stations measurements. A typical triggered waveform of nine sensors for a CG stroke are represented in Figure 5, in which the distances between each sub-stations and stroke points range from 68 km to 125 km.
Meanwhile, FTLLS is capable of triggering stably and recording data continuously when the Foshan area suffers from thunderstorm weather. For instance, there was a severe thunderstorm over the FTLLS network on 17 May 2014, during which each sub-station showed an intense frequency of triggers. The triggered frequency per minute within an hour of the CCJ station is shown in Figure 6. An intensive period which triggered over 2000 times per minute was shown in the CCJ station. In addition, up to 76,594 triggers occurred within one hour, to some extent indicating the multi-task and continuous triggering requirements of the adopted acquisition software.

3. Location Algorithms and Discharge Type Recognition

3.1. Location Algorithms

The FTLLS conducts lightning location based on DTOA techniques by detecting VLF/LF frequency of lightning electromagnetic impulses, with a high-precision GPS system (50 ns) providing the absolute tune benchmark. Suppose the i-th substation is placed at ( x i , y i , z i ), then the t i is the time of the radiation source reaching the i-th substation. Assuming that the lightning radiation source occurs in position ( x , y , z ) at time t , it can be obtained through the following straight path transmission equation:
t i = t + 1 c [ ( x i x ) 2 + ( y i y ) 2 + ( z i z ) 2 ] 1 / 2
Within the equation, the c is velocity of light in vacuum. Equation (7) is a non-linear equation about ( x , y , z , t ), which is quite difficult to solve. By subtracting two transmission equations of different stations and a simple transposition of terms, the following linear equation is obtained:
x i j x + y i j y + z i j z c 2 D T O A i j t = b i j
Among it:
{ x i j = x j x i , y i j = y j y i , z i j = z j z i r i 2 = x i 2 + y i 2 + z i 2 , r j 2 = x j 2 + y j 2 + z j 2 b i j = [ ( r j 2 r i 2 ) c 2 ( T O A j 2 T O A i 2 ) ] / 2 D T O A i j = | T O A j T O A i |
where D T O A i j is the DTOA of two sub-stations, and T O A i and T O A j are the time needed for the radiation source to reach the above two sub-stations respectively. For the observed values of any five sub-stations or more, via subtracting the value of one sub-station with the values of four other sub-stations, a matrix composed of four independent linear equations similar to (8) is thus formed, after that the analytical solution vectors ( x , y , z , t ) are obtained.
[ x i j y i j z i j c 2 D T O A i j x i k y i k z i k c 2 D T O A i k x i l y i l z i l c 2 D T O A i l x i m y i m z i m c 2 D T O A i m ] [ x y z t ] = [ b i j b i k b i l b i m ]
Formula (10) is a linear equation set about a hyper-plane solution. The solutions from hyper-plane methods could only be viewed as preliminarily estimated values. By applying the preliminarily estimated values to the non-linear least-square approximation iterative algorithm, more accurate arithmetic solution vectors ( x , y , z , t ) could be obtained. For the obtained solution, the χ 2 value were adopted to evaluate its goodness of fit.
χ 2 = i = 1 N [ T O A i o b s T O A i f i t σ t 2 ] 2
where N is the total available number of sub-stations, σ is the time error of each sub-station, T O A i o b s was observed arrival time for the i-th sub-station, T O A i f i t was the fitting arrival time that source occurred in position ( x f i t , y f i t , z f i t ) through a simple path to the i-th sub-station.
T O A i f i t = t f i t + 1 c ( x f i t x i ) 2 + ( y f i t y i ) 2 + ( z f i t z i ) 2

3.2. Discharge Type Recognition

In order to achieve the goal of a total lightning detection, once the lightning events are located by FTLLS, the waveform characteristics are adopted to classify the discharge types. The waveform parameters include: the rise time, fall time, pulse width, signal to noise ratio (SNR) and so on. In addition, location information, including height information, is used for CG lightning recognition. Consequently, an effective identification of the three types of lightning events containing CG events, IC events and NBEs was accomplished [17]. The IC lightning radiation field waveforms mostly show a short duration, with a slow rising edge and a fast falling edge, and the pre signal-to-noise ratio of IC lightning radiation field waveform is much smaller than that of CG lightning field waveform. It is worth noting that typical IC waveforms exhibit multi-polar pulse-trains, however, there is also a large portion of IC events exhibit mono-polar that can be classified as positive or negative polarity. The CG lightning radiation field waveforms generally present a longer duration with a steeper rising edge and a slower falling edge. However, the characteristics of NBE radiation field waveforms are significantly different from that of the IC and CG discharge, which often show extremely short pulse width and has a high radiation intensity that exceeds that of CG lightning. Typical waveforms of different discharge types are shown in Figure 7.

4. Location Error

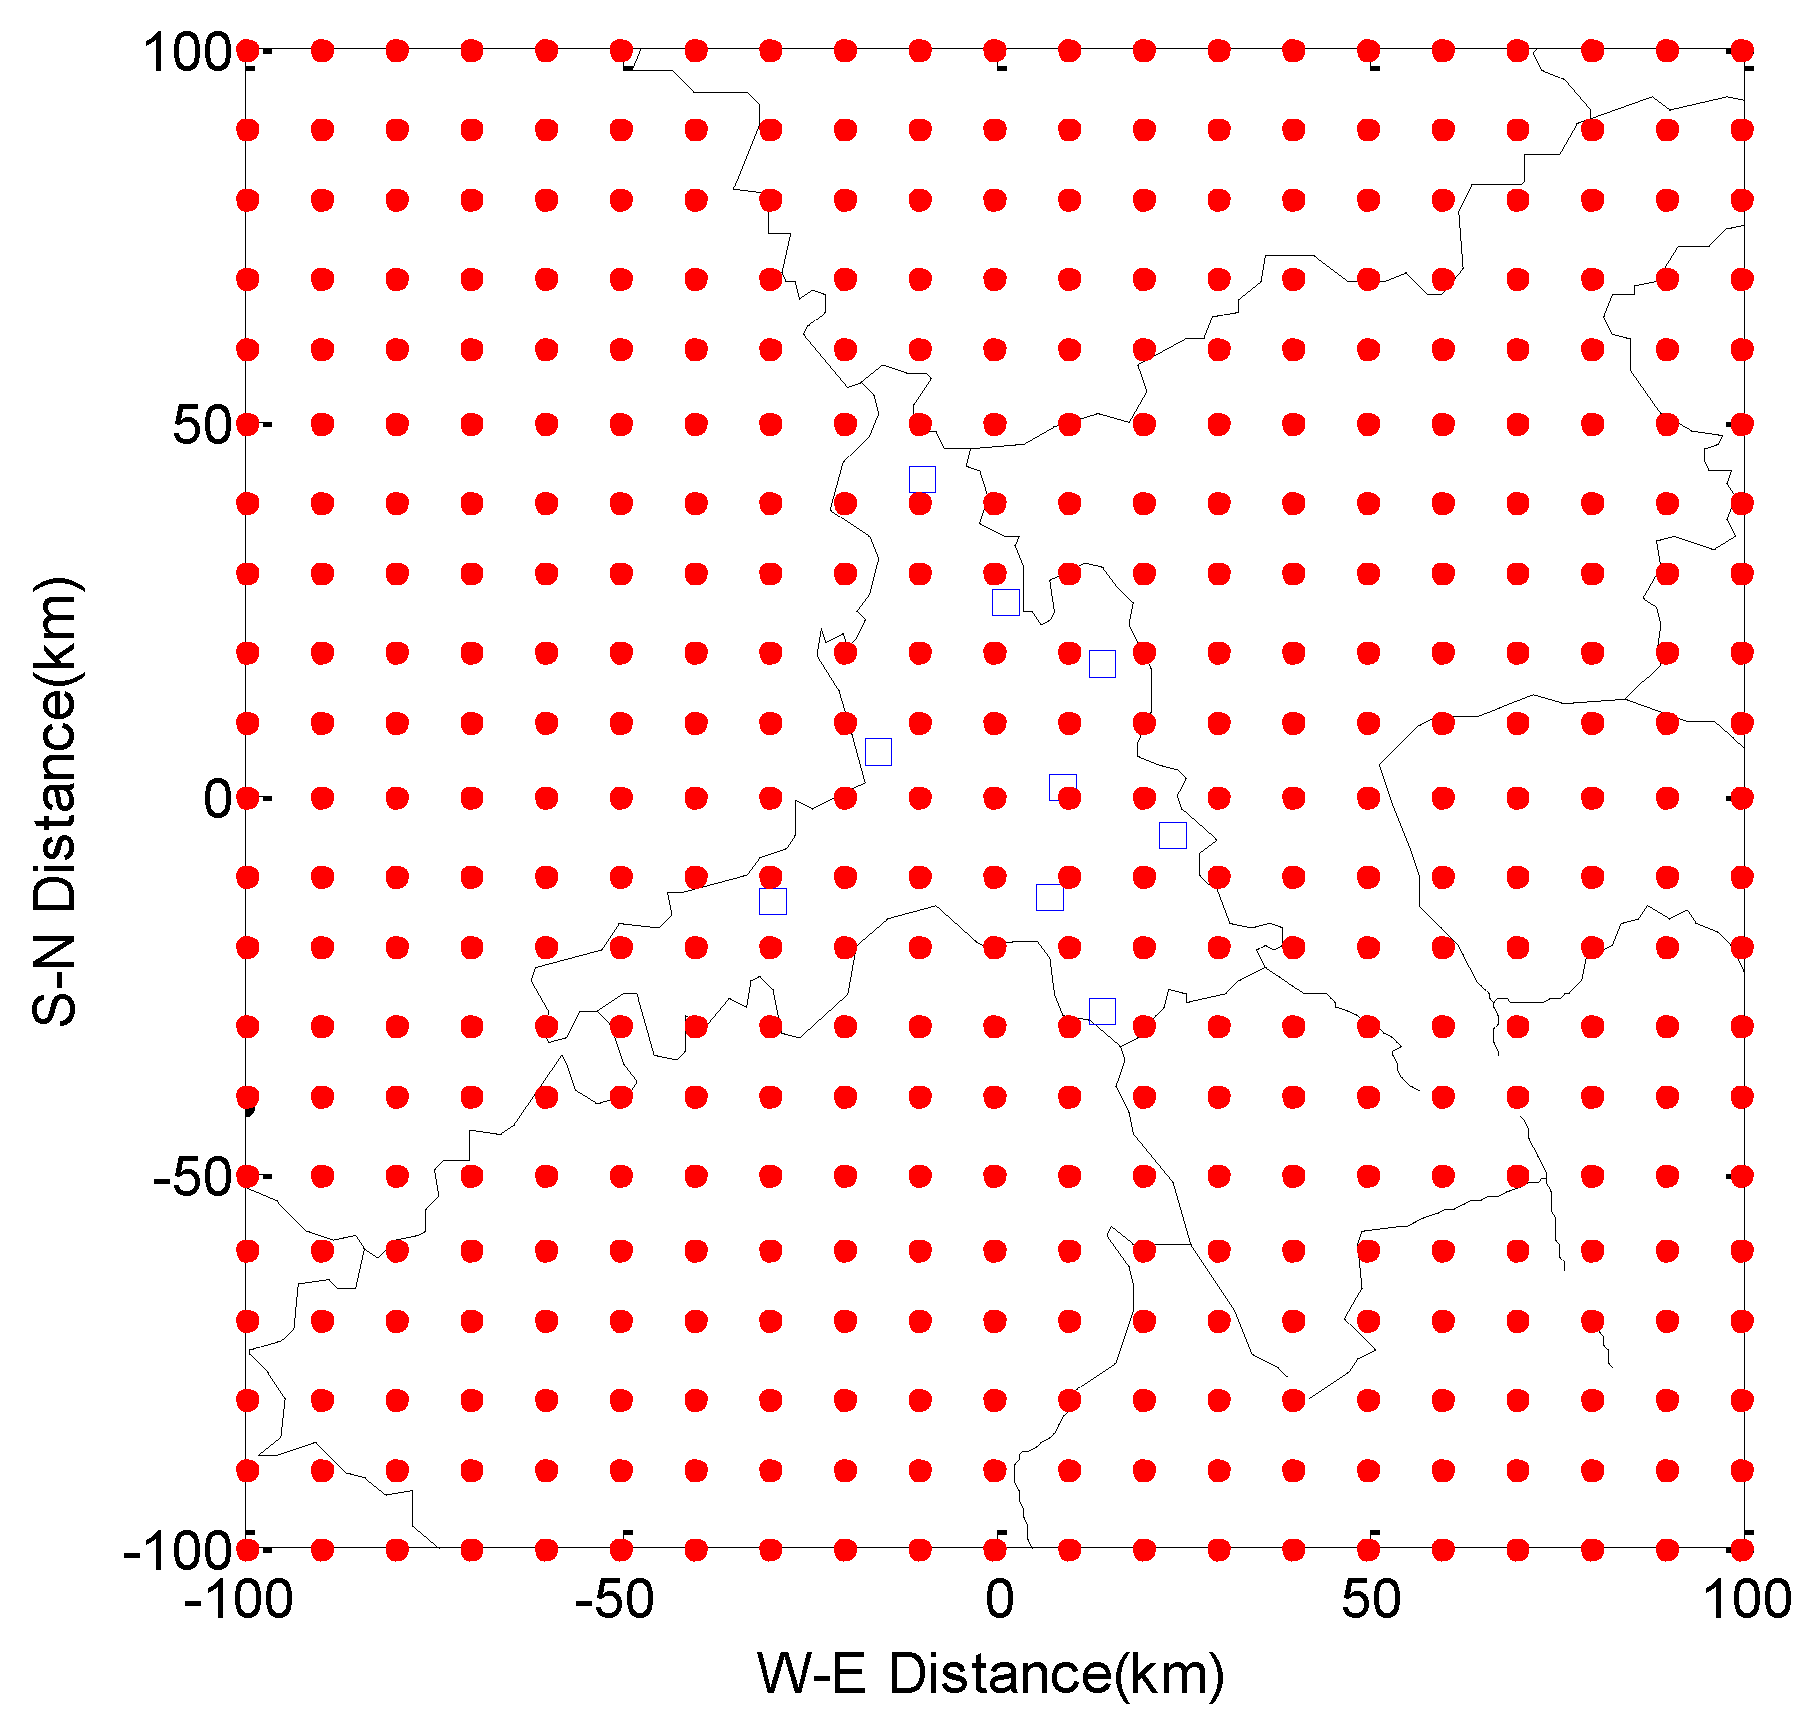
The location error of the station network is closely related to the geographical distribution of the station network. In order to estimate the location error, the Monte Carlo method based on the “random number” for a simulation of the location errors of the network covered area is adopted in this paper. Specifically, as shown in Figure 8, the CCJ station was adopted as the center and an area consisting of 200 km × 200 km were gridded in detail. The step length was set to 10 km. A total of 441 grids within this area were simulated individually through the Monte Carlo method.
Firstly, based on radiation transmission equation, we calculate the exact arrival time at each station of the simulated discharge event that occurred at each grid. Then, a random error from a normal distribution with a mean of 0 us and a variance of 200 ns is added to the arrival time at each station. Through linear and non-linear least square approximation, we simulate the inversion position and time of occurrence of the discharge events. Finally, the difference between the inversion position and the real position is calculated, which is recorded as the location error of this grid.
Repeating above mentioned steps for 1000 times, we can obtain 1000 times of the location errors for this grid, and the mean value of the 1000 times of the location errors is recognized as the final location error.
In the simulation, assuming that the radiation source is at an altitude of 10 km, and all nine sub-stations have detected simulated discharge events and have taken part in the location, then conduct 3D location inversion. The inversion errors include the two-dimensional horizontal error and vertical error, which are expressed as follows:
E 2 D = | D 2 D | = ( x 1 x 2 ) 2 + ( y 1 y 2 ) 2
E z = | D z | = | z 1 z 2 |
where ( x 1 , y 1 , z 1 ) is the actual 3D coordinates of the simulated radiation source, and ( x 2 , y 2 , z 2 ) is the corresponding 3D coordinates calculated by DTOA algorithm. Figure 9 indicates the estimated horizontal and vertical errors for the radiation source at an altitude of 10 km.
When the lightning event occurs within the network, the two-dimensional horizontal location error is basically less than 100 m, and the vertical error is mostly less than 200 m, which indicates FTLLS has a high precision for the lightning location within the station network. However, due to the fact that the Foshan area is located within the station network, the FTLLS can assist in searching for lightning strike points when lightning directly strikes on power transmission lines in the power distribution network of the Foshan area. When the lightning event occurs outside the network, the location errors gradually increase as the distance increases. The average horizontal error within a distance of 100 km is less than 1.5 km, and the corresponding vertical error is less than 1000 m. Obviously, FTLLS can locate the lightning radiation source within a distance of 100 km in the Foshan area accurately, from which the data provides valid reference information for analyzing lightning strike faults on power transmission lines.

5. Initial Operation Results

Nevertheless, the FTLLS is not able to map the lightning channel structures in detail like the VHF DTOA techniques [9,10] and interferometer system [19], because of the LF/VLF signals observed. The VHF systems detect the radiation signals produced by smaller-scale breakdown processes, whereas the FTLLS detects the field changes that are produced by larger-scale breakdown processes. In spite of no detailed channel structure, the FTLLS can monitor overall storm development with the height and rate of the radiation sources. In addition, the FTLLS can pinpoint the ground strike points of CG strokes and can readily distinguish between IC events, CG events and NBEs. Electric field changes produced by either CG events or IC events are indiscriminately captured and processed by the FTLLS. Figure 10 shows the number distributions of the located strokes of the two types as a function of distance, based on six months’ observations from May to October in 2014. As shown in the figure, only those lightning flashes that occurred within a 225 km range were considered for the analysis. Each bin represents a normalized number of strokes that occurred within a 25-km-wide concentric ring around the center station (CCJ). It is shown that 4–10 times more ICs were detected than CGs within the distance range of 100 km, as the distance range increases to 200 km and beyond, there were more CGs detected than ICs, which is in general agreement with the previous report that indicated the LASA system detected 2–5 times more ICs than CGs within the range of 100 km and saw more CGs than ICs when the range increases to 200 km and beyond in north-central Florida [7]. The general disparity between return stroke currents and weaker IC discharge currents could be one of the apparent reasons.
Over 14 million lightning strikes were recorded by FTLLS from May to October in 2014, among which over 9 million strokes were IC events, 4.8 million strokes were CG events, and 140 thousand strokes were NBEs. The proportion of different types of lightning from May to October in 2014 is represented in 
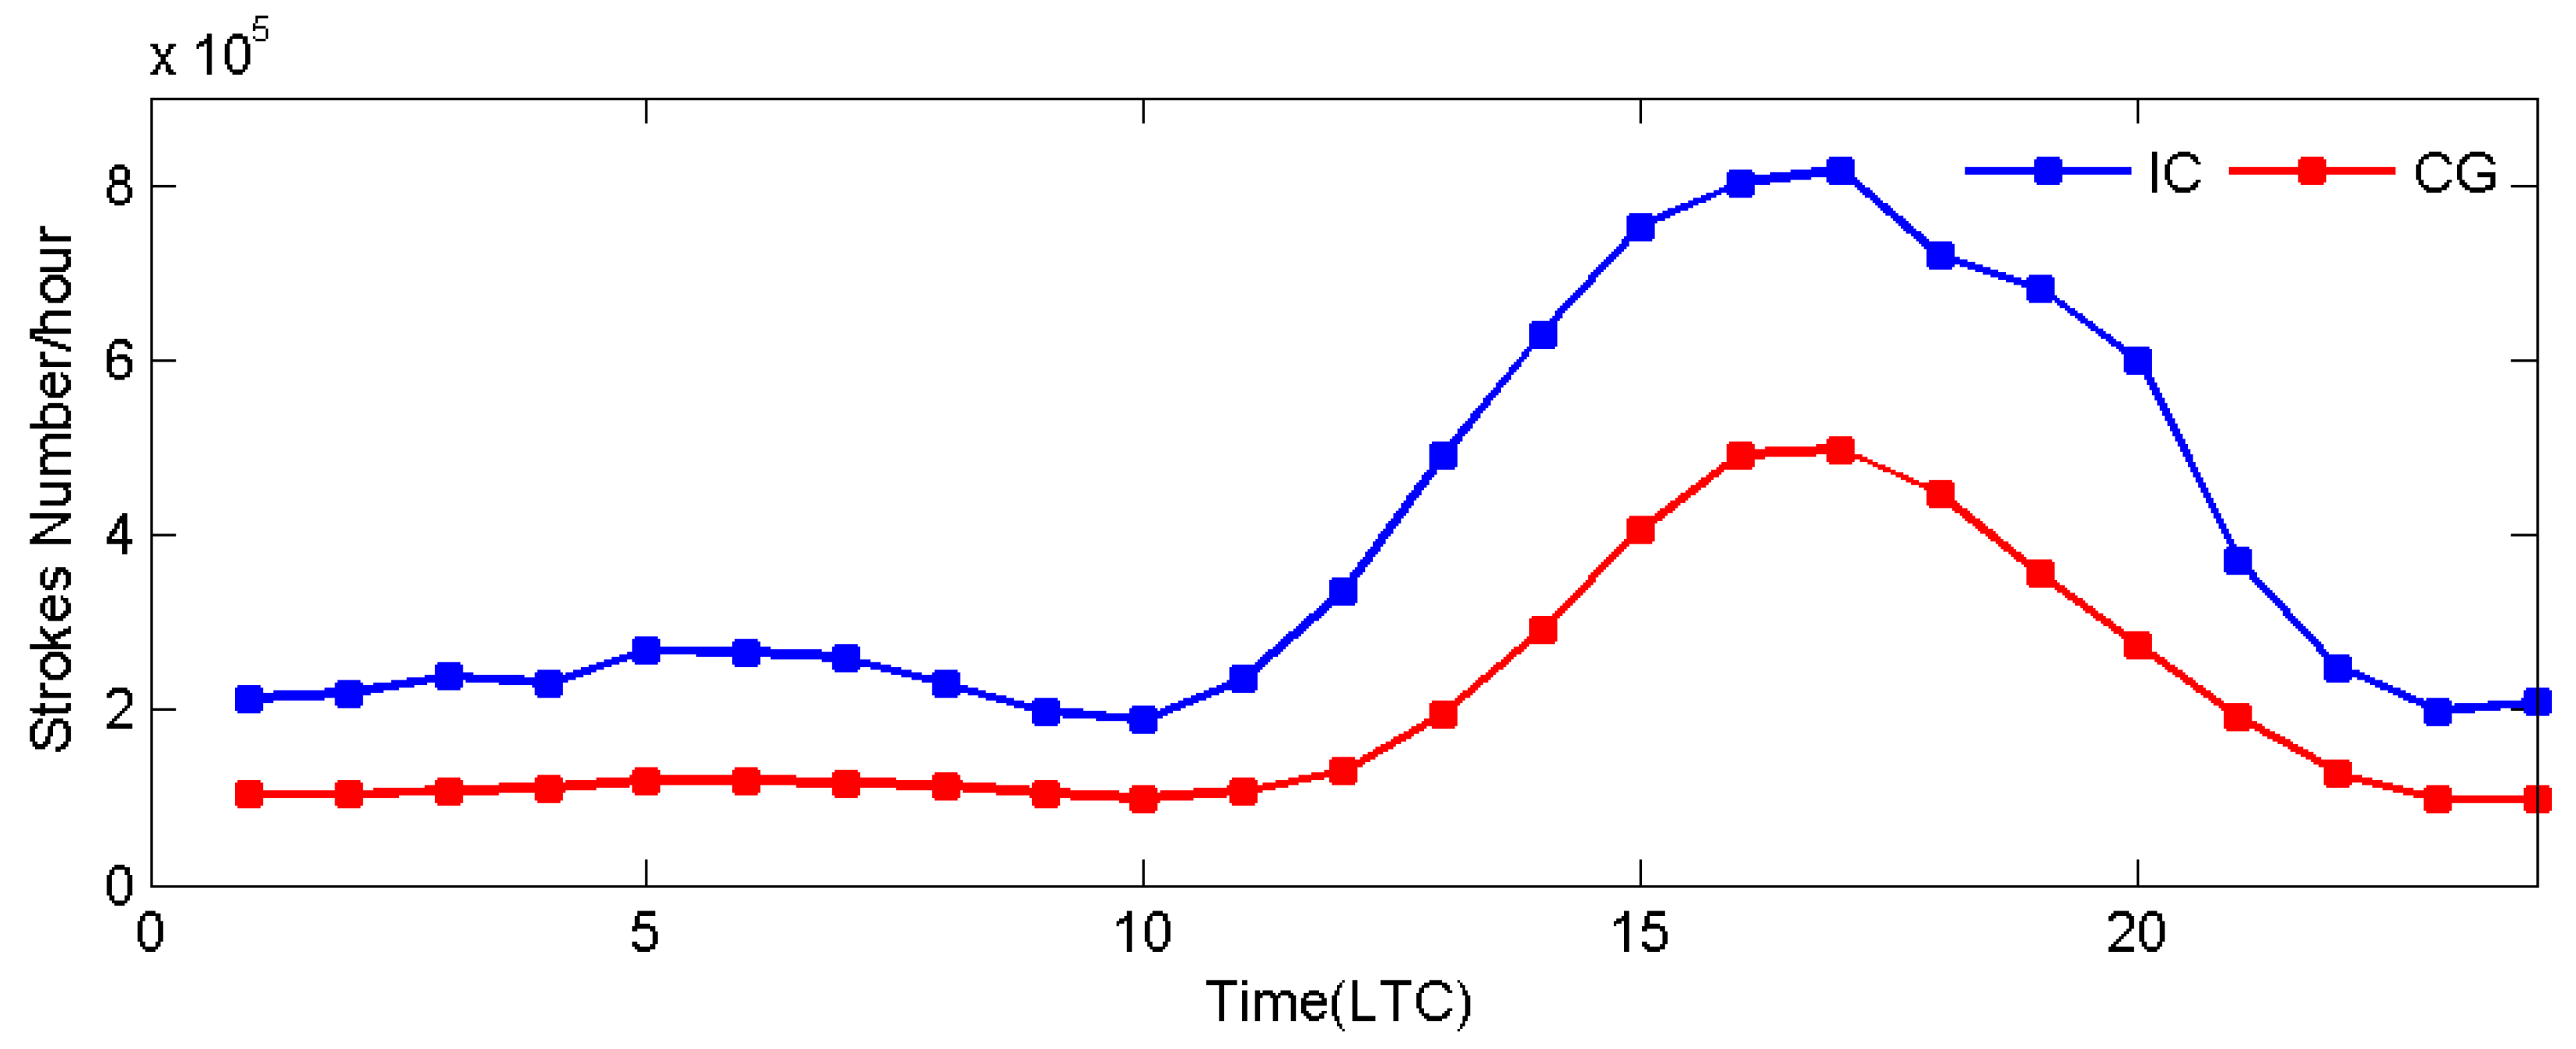
Figure 11. The percent of IC events, CG events and NBEs are 65%, 34% and 1%, respectively. The ratio between positive CG and negative CG is 0.17, while the ratio between positive NBE and negative NBE is 2.9. Moreover, there is an excess of positive polarity (+IC) events compared to negative polarity (−IC) events. In addition, the characteristics of thunderstorm activities presented by FTLLS are vital for monitoring thunderstorm weather. Specifically, the average number distribution of lightning hourly frequency is shown in Figure 12, in which the times of highest lightning frequency are mainly from 12:00 to 19:00, indicating the strong convection activities generally in Foshan area. It is worth noting that there is no significant difference between CG events and IC events in hourly frequency distribution.
Meanwhile, the FTLLS is capable of a fine 3D location, 
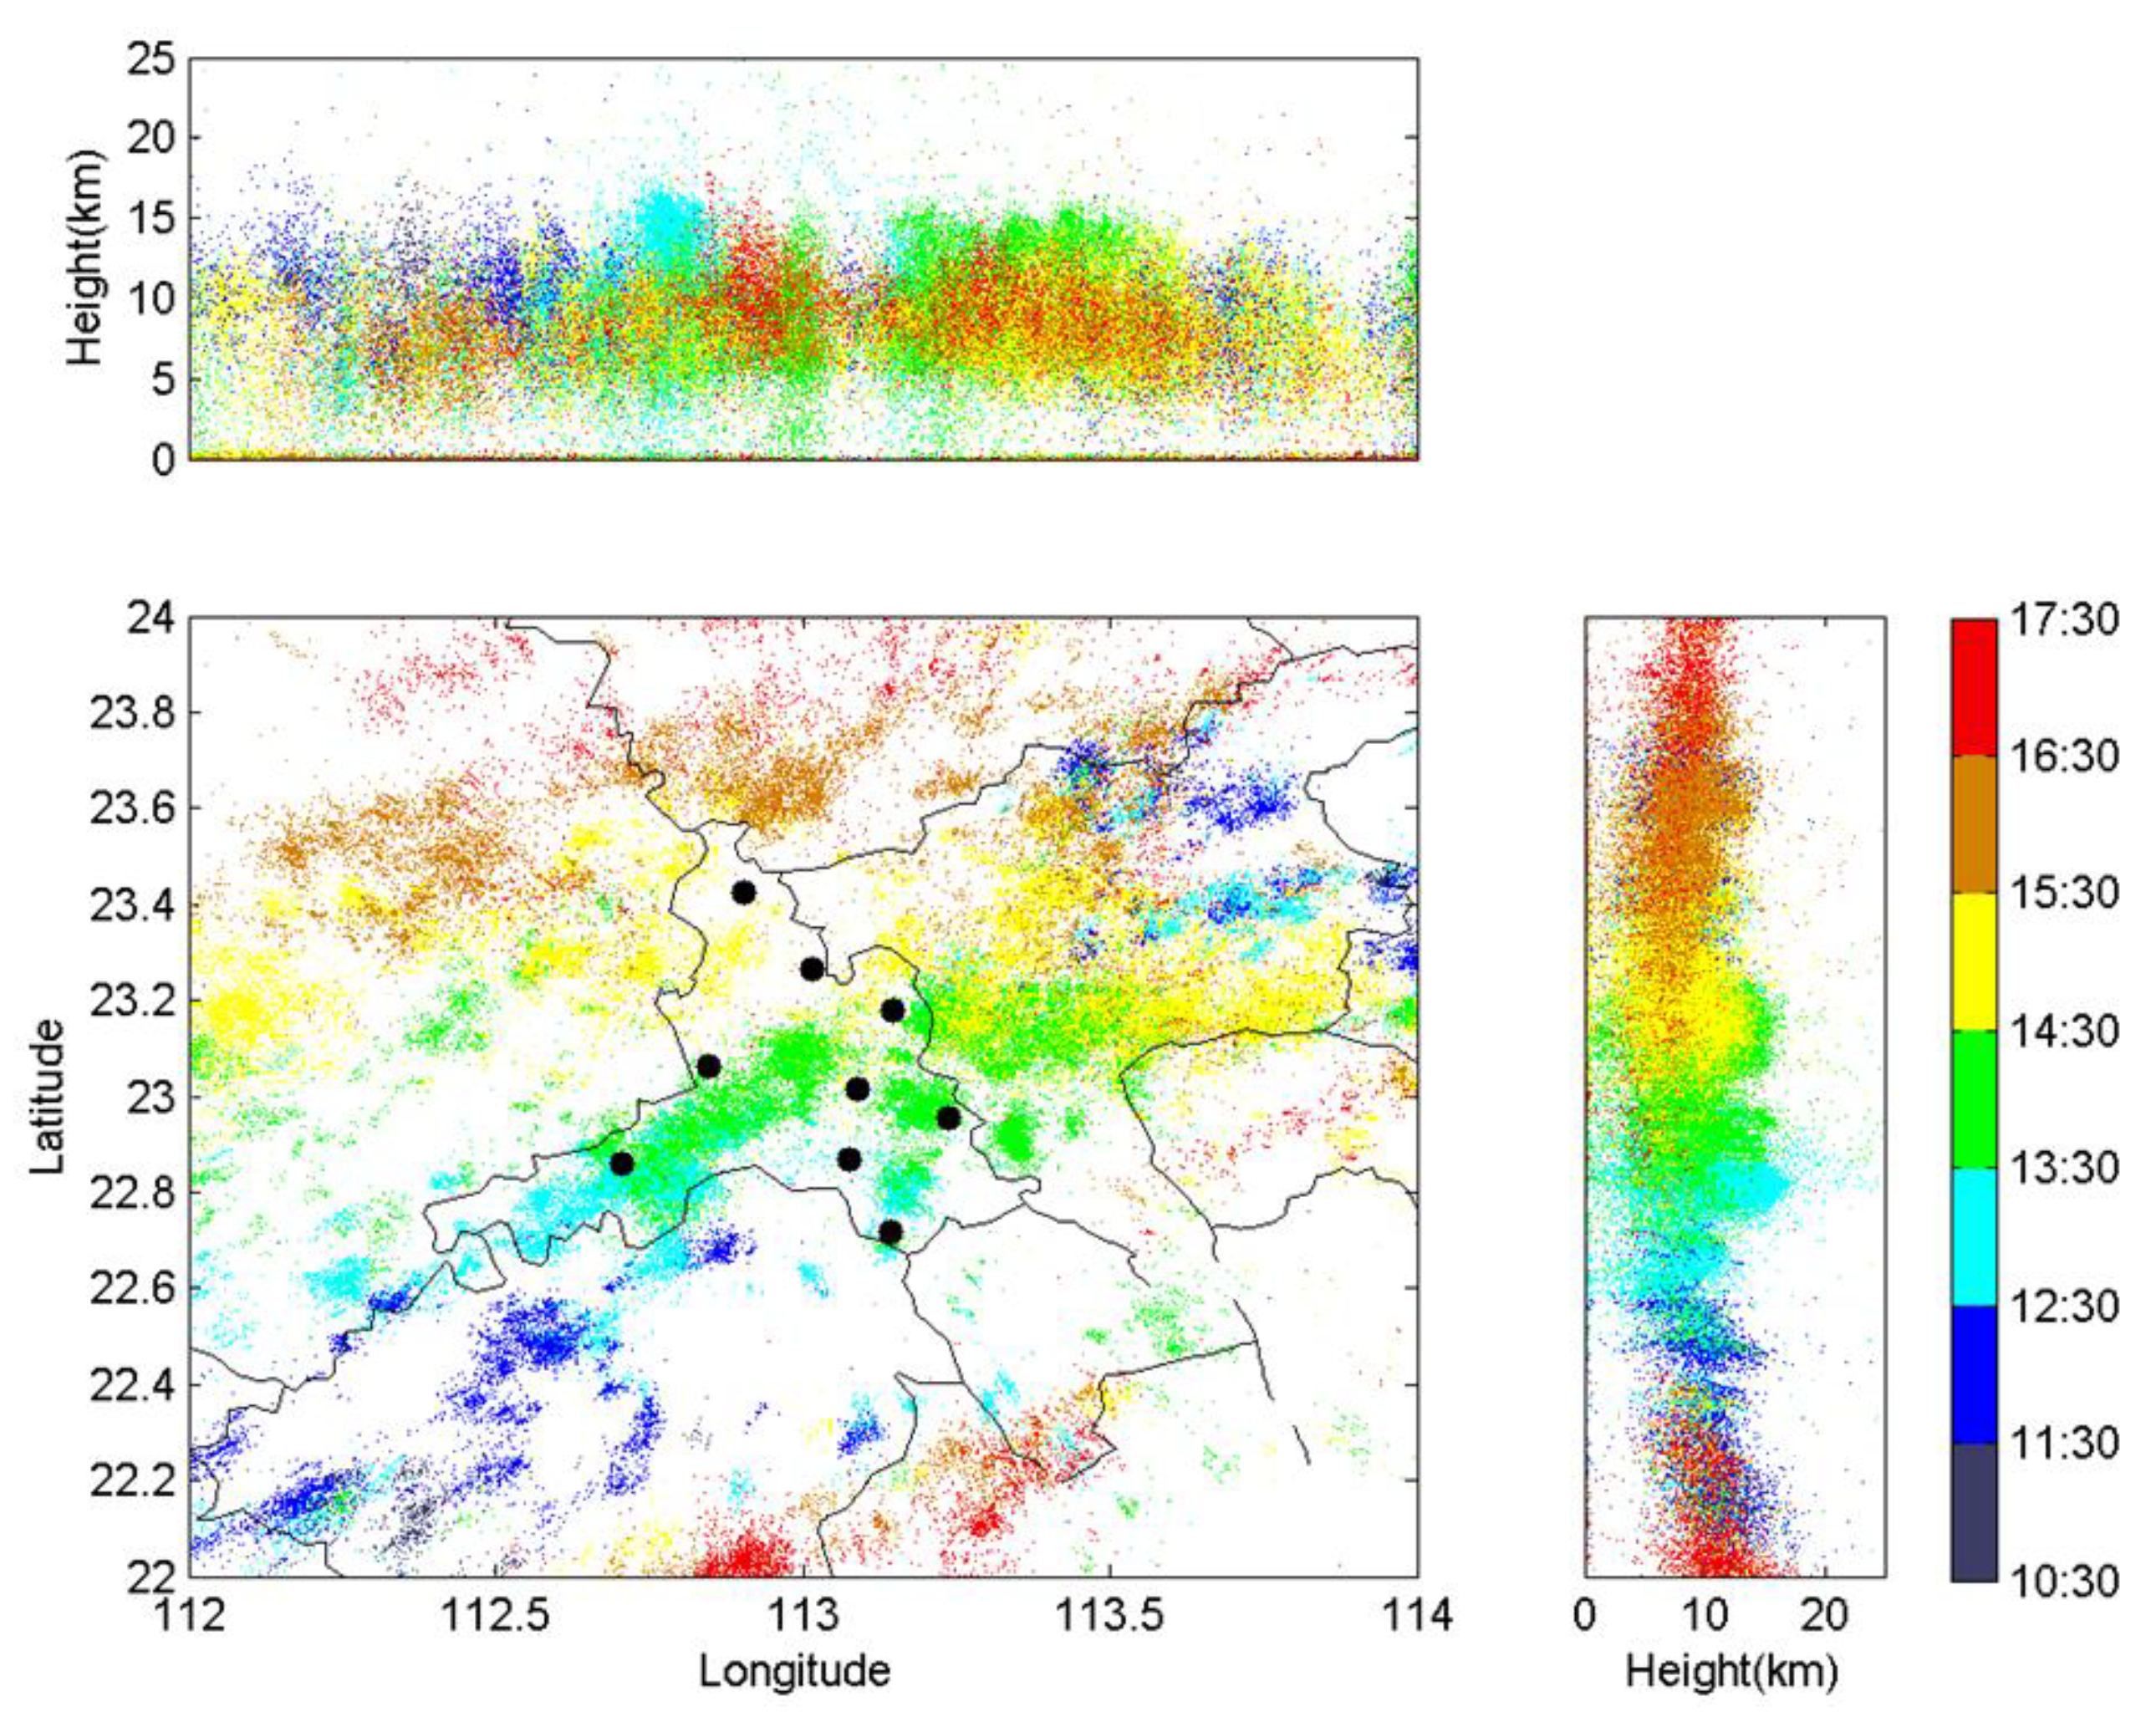
Figure 13 shows the evolution process of an overhead thunderstorm mapped by the FTLLS on 19 August 2014 during a 60-min interval, which moved from West to East and lasted for around 7 h during 10:30 to 17:30 LTC. The entire occurrences and development processes of the thunderstorm were well mapped by the FTLLS. One hundred and six thousand, seven hundred and eighty-nine lightning events were located by the FLLLS in total, among which 95,060 events were IC events (66,754 +IC and 28,306 −IC), 10,726 events were CG events (2,650 +CG and 8,076 −CG), and 1003 events were NBE events ((706 +NBE and 297 +CG), respectively. The time series of lightning frequencies (containing total lightning, CG and IC-ratio) during the entire thunderstorm process with a time interval of 5 min for the period 10:30–17:30 LTC (local time = UTC + 8 h) is represented in Figure 14a. The most intense peak intensifies at about 13:30 LTC when IC events numbers increase rapidly, while a smoother manner was shown in the distribution of CG events changes. The IC-ratio defined as the ratio of IC events numbers and the total stroke numbers, which were continuously large throughout the thunderstorm process. In particular, the IC-ratios were larger than 0.8 most of time, indicating the dominant role of the IC events accounting for at least 80% of all strokes.
Unlike the two-dimensional location, an additional altitude parameter is recognized as a unique feature of 3D-based lightning location systems. The heights of IC events are also clearly exhibited in the vertical cross section in Figure 14b. As shown in Figure 14b, all IC events occurred at an altitude below 25 km, high IC densities extended through the altitude interval between 7 km and 12 km, and almost 90% of IC events occurred at an altitude below 15 km. For example, Shi [1] showed 3D lightning pulse discharge events of an IC flash that occurred at 16:26:24 (BT) on 15 August 2015, in which the location heights were separated into two layers with average heights of 5 and 10 km. Practically, the space at an altitude above 25 km is recognized as the stratosphere and shows little lightning activity, which is in general agreed upon with the observation results of the FTLLS.
In order to verify the rationality of thunderstorm location, the radar–lightning comparison in a horizontal section for the period 12:00–16:00 (LTC) on 19 August 2014 is shown in Figure 15, corresponding to four stages of thunderstorm, namely: lightning appearing period, lightning development period, lightning fully developed period and lightning leaving period, respectively. When the lightning data is compiled for appropriate time intervals excellent agreement is obtained with radar reflectivity. The radar information in the paper is provided by the Guangzhou Radar, which is the Doppler weather radar with S-band and works in volume scan mode. During the thunderstorm period, in the area where the radar echo is strong, the convection activity is frequent, and the corresponding detected lightning frequency is quite large, prominent areas of higher reflectivity exhibited dominant IC events and CG events. The location results of CG events exhibited more consistently with the radar reflectivity compared to IC events. Moreover, NBEs concentrated in the lightning development period and lightning fully developed period, which were always accompanied with CG strokes.

6. Conclusions

A detailed working principle and observations of the Foshan Total Lightning Location System (FTLLS) were presented. In this paper, the geographical distribution and set-up information of the FTLLS, the estimated locating errors and locating results, as well as its initial operation results were presented. The working bandwidth is from 200 Hz to 500 kHz. Specifically, location algorithms and discharge type recognition were shown. Based on Monte Carlo simulations, the two-dimensional horizontal location error is basically less than 100 m, and the vertical error (altitude) is less than 200 m when the lightning event occurs within the network, while the average horizontal error within a distance of 100 km is less than 1 km and the corresponding vertical error (altitude) is less than 700 m. On the other hand, over 14 million strikes were recorded successfully by the FTLLS during the period of May to October in 2014, among which IC events, CG events and NBEs accounted for 65%, 34% and 1%, respectively. It is shown that the FTLLS is capable of fine three-dimensional (3D) location, in which the altitude parameters obtained are reasonable and consistent with observed data in the previous studies. The location results of thunderstorms were additionally verified through simultaneously-observed radar data.
Due to its fine three-dimensional (3D) location and lightning electric field waveform record function, the FTLLS was mainly used in the analysis of three-dimensional activity characteristics of typical thunderstorms in the Foshan area, inquiry of lightning strike faults on transmission lines and waveform analysis of radiated electric field in different distances and so on.

Author Contributions

Hardware, L.C. and Q.L.; Supervision, J.W.; Writing—original draft, L.C. and X.Z.; Writing—review & editing, Q.L. and J.W. All authors were involved in designing and discussing the study. All authors have read and approved the final manuscript.

Funding

This research was funded by the Natural Science Foundation of China, grant number 51807144.

Acknowledgments

The authors would like to thank Wansheng Dong in Laboratory of Lightning Physics and Protection Engineering, Chinese Academy of Meteorological Sciences, Beijing, and all the staffs of Foshan Power Company for establishing Foshan Total Lightning Location System.

Conflicts of Interest

The authors declare no conflict of interest.

References

  1. Shi, D.; Zheng, D.; Zhang, Y.; Zhang, Y.; Huang, Z.; Lu, W.; Chen, S.; Yan, X. Low-frequency E-field Detection Array (LFEDA)—Construction and preliminary results. Sci. China Earth Sci. 2017, 60, 1896–1908. [Google Scholar] [CrossRef]
  2. Cecil, D.J.; Buechler, D.E.; Blakeslee, R.J. Gridded lightning climatology from TRMM-LIS and OTD: Dataset description. Atmos Res. 2014, 135, 404–414. [Google Scholar] [CrossRef] [Green Version]
  3. Fan, X.P.; Zhang, Y.J.; Zheng, D.; Zhang, Y.; Lyu, W.T.; Liu, H.Y.; Xu, L.T. A New Method of Three-Dimensional Location for Low-Frequency Electric Field Detection Array. J. Geophys. Res. 2018, 123, 8792–8812. [Google Scholar] [CrossRef]
  4. Cummins, K.L.; Murphy, M.J.; Bardo, E.A.; Hiscox, W.L.; Pyle, R.B.; Pifer, A.E. A combined TOA/MDF technology upgrade of the U.S. National Lightning Detection Network. J. Geophys. Res. 1998, 103, 9035–9044. [Google Scholar] [CrossRef]
  5. Cummins, K.L.; Krider, E.P.; Malone, M.D. The US National Lightning Detection Network and Applications of Cloud-to-Ground Lightning by Electric Power Utilities. IEEE Trans. Electromagn. Compat. 1998, 40, 465–480. [Google Scholar] [CrossRef]
  6. Smith, D.A.; Eack, K.B.; Harlin, J.; Heavner, M.J.; Jacobson, A.R.; Massey, R.S.; Shao, X.M.; Wiens, K.C. The Los Alamos Sferic Array: A research tool for lightning investigations. J. Geophys. Res. 2002, 107, 4183. [Google Scholar] [CrossRef]
  7. Shao, X.M.; Stanley, M.; Regan, A.; Harlin, J.; Pongratz, M.; Stock, M. Total lightning observations with the new and improved Los Alamos Sferic Array (LASA). J. Atmos. Ocean Technol. 2006, 23, 1273–1288. [Google Scholar] [CrossRef]
  8. Karunarathne, S.; Marshall, T.C.; Stolzenburg, M.; Karunarathna, N.; Vickers, L.E.; Warner, T.A.; Orville, R.E. Locating initial breakdown pulses using electric field change network. J. Geophys. Res.-Atmos. 2013, 118, 7129–7141. [Google Scholar] [CrossRef] [Green Version]
  9. Rison, W.; Thomas, R.J.; Krehbiel, P.R.; Hamlin, T.; Harlin, J. A GPS-based three-dimensional lightning mapping system: Initial observations in central New Mexico. Geophys. Res. Lett. 1999, 26, 3573–3576. [Google Scholar] [CrossRef] [Green Version]
  10. Thomas, R.J.; Krehbiel, P.R.; Rison, W.; Hunyady, S.J.; Winn, W.P.; Hamlin, T.; Harlin, J. Accuracy of the Lightning Mapping Array. J. Geophys. Res. 2004, 109, D14207. [Google Scholar] [CrossRef]
  11. Bitzer, P.M.; Christian, H.J.; Stewart, M.; Burchfield, J.; Podgorny, S.; Corredor, D. Characterization and applications of VLF/LF source locations from lightning using the Huntsville Alabama Marx Meter Array. J. Geophys. Res. Atmos. 2013, 118, 3120–3138. [Google Scholar] [CrossRef] [Green Version]
  12. Yoshida, S.; Wu, T.; Ushio, T.; Kusunoki, K.; Nakamura, Y. Initial results of LF sensor network for lightning observation and characteristics of lightning emission in LF band. J. Geophys. Res.-Atmos. 2014, 119, 12034–12051. [Google Scholar] [CrossRef]
  13. Betz, H.D.; Schmidt, K.; Oettinger, P.; Wirz, M. Lightning detection with 3D discrimination of intracloud and cloud-to-ground discharges. Geophys. Res. Lett. 2004, 31, L11108. [Google Scholar] [CrossRef]
  14. Betz, H.D.; Schmidt, K.; Fuchs, B.; Oettinger, W.P.; Holler, H. Cloud lightning: Detection and utilization for total lightning measured in the VLF/LF regime. J. Light. Res. 2007, 2, 1–17. [Google Scholar]
  15. Betz, H.D.; Schmidt, K.; Laroche, P.; Blanchet, P.; Oettinger, W.P.; Defer, E.; Dziewit, Z.; Konarski, J. LINET—An International Lightning Detection Network in Europe. Atmos. Resin. 2008, 5, 152–160. [Google Scholar] [CrossRef]
  16. Betz, H.D.; Marshall, T.C.; Stolzenburg, M.; Schmidt, K.; Oettinger, W.P.; Defer, E.; Konarski, J.; Laroche, P.; Dombai, F. Detection of In-Cloud Lightning with VLF/LF and VHF Networks for Studies of the Initial Discharge Phase. Geophys. Res. Lett. 2008, 35, L035820. [Google Scholar] [CrossRef]
  17. Cai, L. Ground-Based VLF/LF Three-Dimensional Total Lightning Location Technology. Ph.D. Thesis, Wuhan University, Wuhan, China, 2013. (In Chinese). [Google Scholar]
  18. Brook, M.; Kitagawa, N. Electric-field changes and the design of lightning-flash counters. J. Geophys. Res. 1960, 65, 1927–1930. [Google Scholar] [CrossRef]
  19. Rhodes, C.T.; Shao, X.M.; Krehbiel, P.R.; Thomas, R.J.; Hayenga, C.O. Observations of lightning phenomena using radio interferometry. J. Geophys. Res. 1994, 99, 13059–13082. [Google Scholar] [CrossRef]
Figure 1. Geographical distribution of the Foshan Total Lightning Location System (FTLLS), in which a full operation of nine sub-stations in the Foshan area were shown. Sub-station location is indicated by a black dot.
Atmosphere 10 00149 g001
Figure 2. (a) The network configuration and setup. Each sub-station contains a GPS antenna, GPS card, data acquisition card, electrical field antenna and an industrial personal computer. (b) The installation diagram of DTZ. An elevated flat plate antenna used for measuring electric field pulses at the DTZ.
Atmosphere 10 00149 g002
Figure 3. The equivalent circuit of flat plate antenna.
Atmosphere 10 00149 g003
Figure 4. The sensor frequency response curve, the test frequency ranges from 100 Hz to 1 MHz.
Atmosphere 10 00149 g004
Figure 5. The recording length is set to 500 μs with a pre-trigger of 150 μs.
Atmosphere 10 00149 g005
Figure 6. The triggered frequency per minute within an hour of the CCJ station on 17 May 2014.
Atmosphere 10 00149 g006
Figure 7. Typical waveforms of different discharge types corresponding to +CG, −CG, +IC, −IC, +NBE, −NBE.
Atmosphere 10 00149 g007
Figure 8. The simulation model of estimating location error.
Atmosphere 10 00149 g008
Figure 9. The estimated locating errors at an altitude of 10 km ((a) horizontal error, (b) vertical error).
Atmosphere 10 00149 g009
Figure 10. Distribution of located IC and CG strokes from May to October in 2014. Each bin in the figure represents a normalized number of strokes that occurred within a 25-km-wide concentric ring around the center station (CCJ). Flash numbers are normalized to unit area (1 km2) at each range.
Atmosphere 10 00149 g010
Figure 11. The proportions of different types of lightning in 2014.
Atmosphere 10 00149 g011
Figure 12. The average distribution of lightning hourly frequency in one day.
Atmosphere 10 00149 g012
Figure 13. Evolution of an overhead thunderstorm mapped by the FTLLS on 19 August 2014. Stroke locations for all types are shown in the latitude/longitude panel and vertical sections, the black dots are locations of the nine sub-station of the FTLLS.
Atmosphere 10 00149 g013
Figure 14. (a) Time series of total strokes, CG stroke numbers and IC/total strokes ratio on 19 August 2014 in the discrimination area as shown in Figure 13. (b) Vertical distribution of stroke numbers for the same events as in (a).
Atmosphere 10 00149 g014
Figure 15. Reflectivity scan by DSR research radar for a storm cell on 19 August 2014. Prominent areas of higher reflectivity exhibit dominant IC events (black dots), CG strokes (red dots), and NBE (white dots), respectively. The radar station (red plus) is situated on the east side of the network (red diamond).
Atmosphere 10 00149 g015aAtmosphere 10 00149 g015b

