1. Introduction
El Niño–Southern Oscillation (ENSO) is a dominant interannual mode of climate variability that originates from air–sea interaction in the tropical Pacific [
1,
2]. ENSO can significantly influence the global climate through ENSO-related atmospheric teleconnections [
3,
4]. In East Asia, the East Asian winter monsoon (EAWM) tends to be weak (strong) during El Niño (La Niña) winters [
5,
6,
7,
8,
9,
10]. Previous studies have indicated that an anomalous lower-tropospheric anticyclone (cyclone) around the Philippine Sea is the key system that induces these impacts during El Niño (La Niña) winters [
6,
7,
8,
9]. The southerly (northerly) wind anomalies associated with the anomalous anticyclone (cyclone) along the coasts of East Asia induce widespread warming (cooling) in southern East Asia [
6,
7,
8,
9]. The atmospheric Rossby wave, in response to the convective cooling (warming) anomalies around the western North Pacific associated with ENSO, is the key physical process responsible for the formation of this anomalous circulation [
6,
8]. This ENSO teleconnection can be roughly reproduced in current climate models [
11,
12,
13,
14,
15]. Recent studies have also indicated that there are other types of ENSO events with pronounced warming or cooling over the central Pacific (CP), known as the CP ENSO events [
16,
17]. The formation mechanism and climate impacts associated with the CP ENSO are quite different compared with the traditional ENSO [
18,
19,
20], and the CP ENSO has relatively little influence on the East Asian winter climate compared with that of the conventional ENSO [
20,
21].
Some previous studies have mentioned that the relationship between EAWM and ENSO may be unstable and modulated in the decadal timescale [
22,
23,
24,
25,
26,
27,
28,
29,
30]. For example, Wang et al. [
24] indicated that the nonstationary ENSO–EAWM relationship is modulated by the phase of the Pacific decadal oscillation (PDO). ENSO tends to exert stronger influence on the East Asian winter climate during the negative phases of the PDO than during its positive phases. He and Wang [
27] reported that the ENSO–EAWM relationship experienced a significant interdecadal weakening around the mid-1970s, and they further indicated that the oscillation of the ENSO–EAWM relationship may be modulated by the combined effect of the PDO and Atlantic Multidecadal Oscillation (AMO). Recently, some studies have found that the ENSO–EAWM relationship seems to have recovered after the late 1990s [
29,
30]. Jia and Ge [
29] reported that the change in the ENSO–EAWM relationship may be related to the changes in the EAWM itself. Kim et al. [
30] indicated that the changes in the zonal location and intensity of the ENSO-related anomalous lower-tropospheric anticyclone near the Philippine Sea may have contributed to the changes in the ENSO–EAWM relationship during recent decades.
Despite many efforts to interpret the changes in the ENSO–EAWM relationship as demonstrated above, it remains unclear whether other factors can modulate the influence of ENSO on the East Asian winter climate. For example, in addition to the anticyclone near the Philippines, another anomalous low-level anticyclone over the Kuroshio Extension region, known as the Kuroshio anticyclone, sometimes also develops during the mature phase of warm ENSO events [
8,
31]. However, it remains open to debate what role the Kuroshio anticyclone plays in the modulation of ENSO’s influence on the East Asian climate. Meanwhile, previous studies on the relationship between ENSO and the East Asian winter climate are mainly based on the EAWM index [
25,
26,
27,
30]. In view of the tangled EAWM indices, a single EAWM index may not wholly represent the variations of the East Asian winter climate, including the temperature variation [
32]. In view of the importance of the degree of coldness in winter weather, the influence of ENSO on the East Asian winter temperature should be investigated directly. Therefore, the objective of this study is to explore whether the relationship between ENSO and the East Asian winter temperature also experienced evident decadal changes during the past decades. If so, what physical processes are responsible for the decadal changes, especially during the last two decades? Understanding the decadal changes has important implications for the ENSO-related prediction of the winter temperature anomalies over East Asia.
The rest of this study is organized as follows:
Section 2 describes the dataset and methods used in this study.
Section 3 provides the results of this study, including the decadal changes in the influence of ENSO on the East Asian winter temperature and the role of the Kuroshio anticyclone responsible for the changes.
Section 4 provides a summary and discussion.
2. Data and Methods
In this study, the observational proxies of the monthly mean surface air temperature (SAT), sea level pressure (SLP), and winds data are from the Japanese 55 year (JRA-55) Reanalysis dataset, which spans the period from January 1958 to the present with a horizontal resolution of 1.25° × 1.25° [
33]. The monthly sea surface temperature (SST) data used in this study are from the Extended Reconstructed SST version 5 (ERSST v5) dataset [
34], which has a horizontal resolution of 2° × 2° and covers the period from January 1854 to the present.
In view of the relatively strong influence of the conventional ENSO on the East Asian climate compared with that of the CP ENSO [
16,
20,
21], the conventional ENSO is considered in this study, and the Niño-3 index (i.e., area-averaged SST anomalies in 5° S–5° N, 150°–90° W) is used to measure the intensity of ENSO hereafter. To reveal the direct impact of ENSO on the simultaneous East Asian SAT, we define an index as the area-averaged winter mean SAT over East Asia (20°–40° N, 110°–145° E), denoted as the EAT index. To depict the magnitude of the ENSO-related Kuroshio anticyclone, we define a Kuroshio Anticyclone index (KACI) as the area-averaged ENSO-related SLP anomalies (i.e., the SLP anomalies regressed onto the wintertime Niño-3 index) over the Kuroshio Extension region (30°–50° N, 135°–165° E). Following Trenberth and Hurrell [
35], the Aleutian Low index (ALI) is defined as the winter mean SLP averaged over the North Pacific (30°–65° N, 160E°–140° W). Here, winter 1959 refers to the 1958–1959 winter, and the winter means were calculated by averaging the monthly mean data of December, January, and February. The two-tailed Student’s
t-test was adopted to evaluate the confidence level of linear correlation and regression.
3. Results
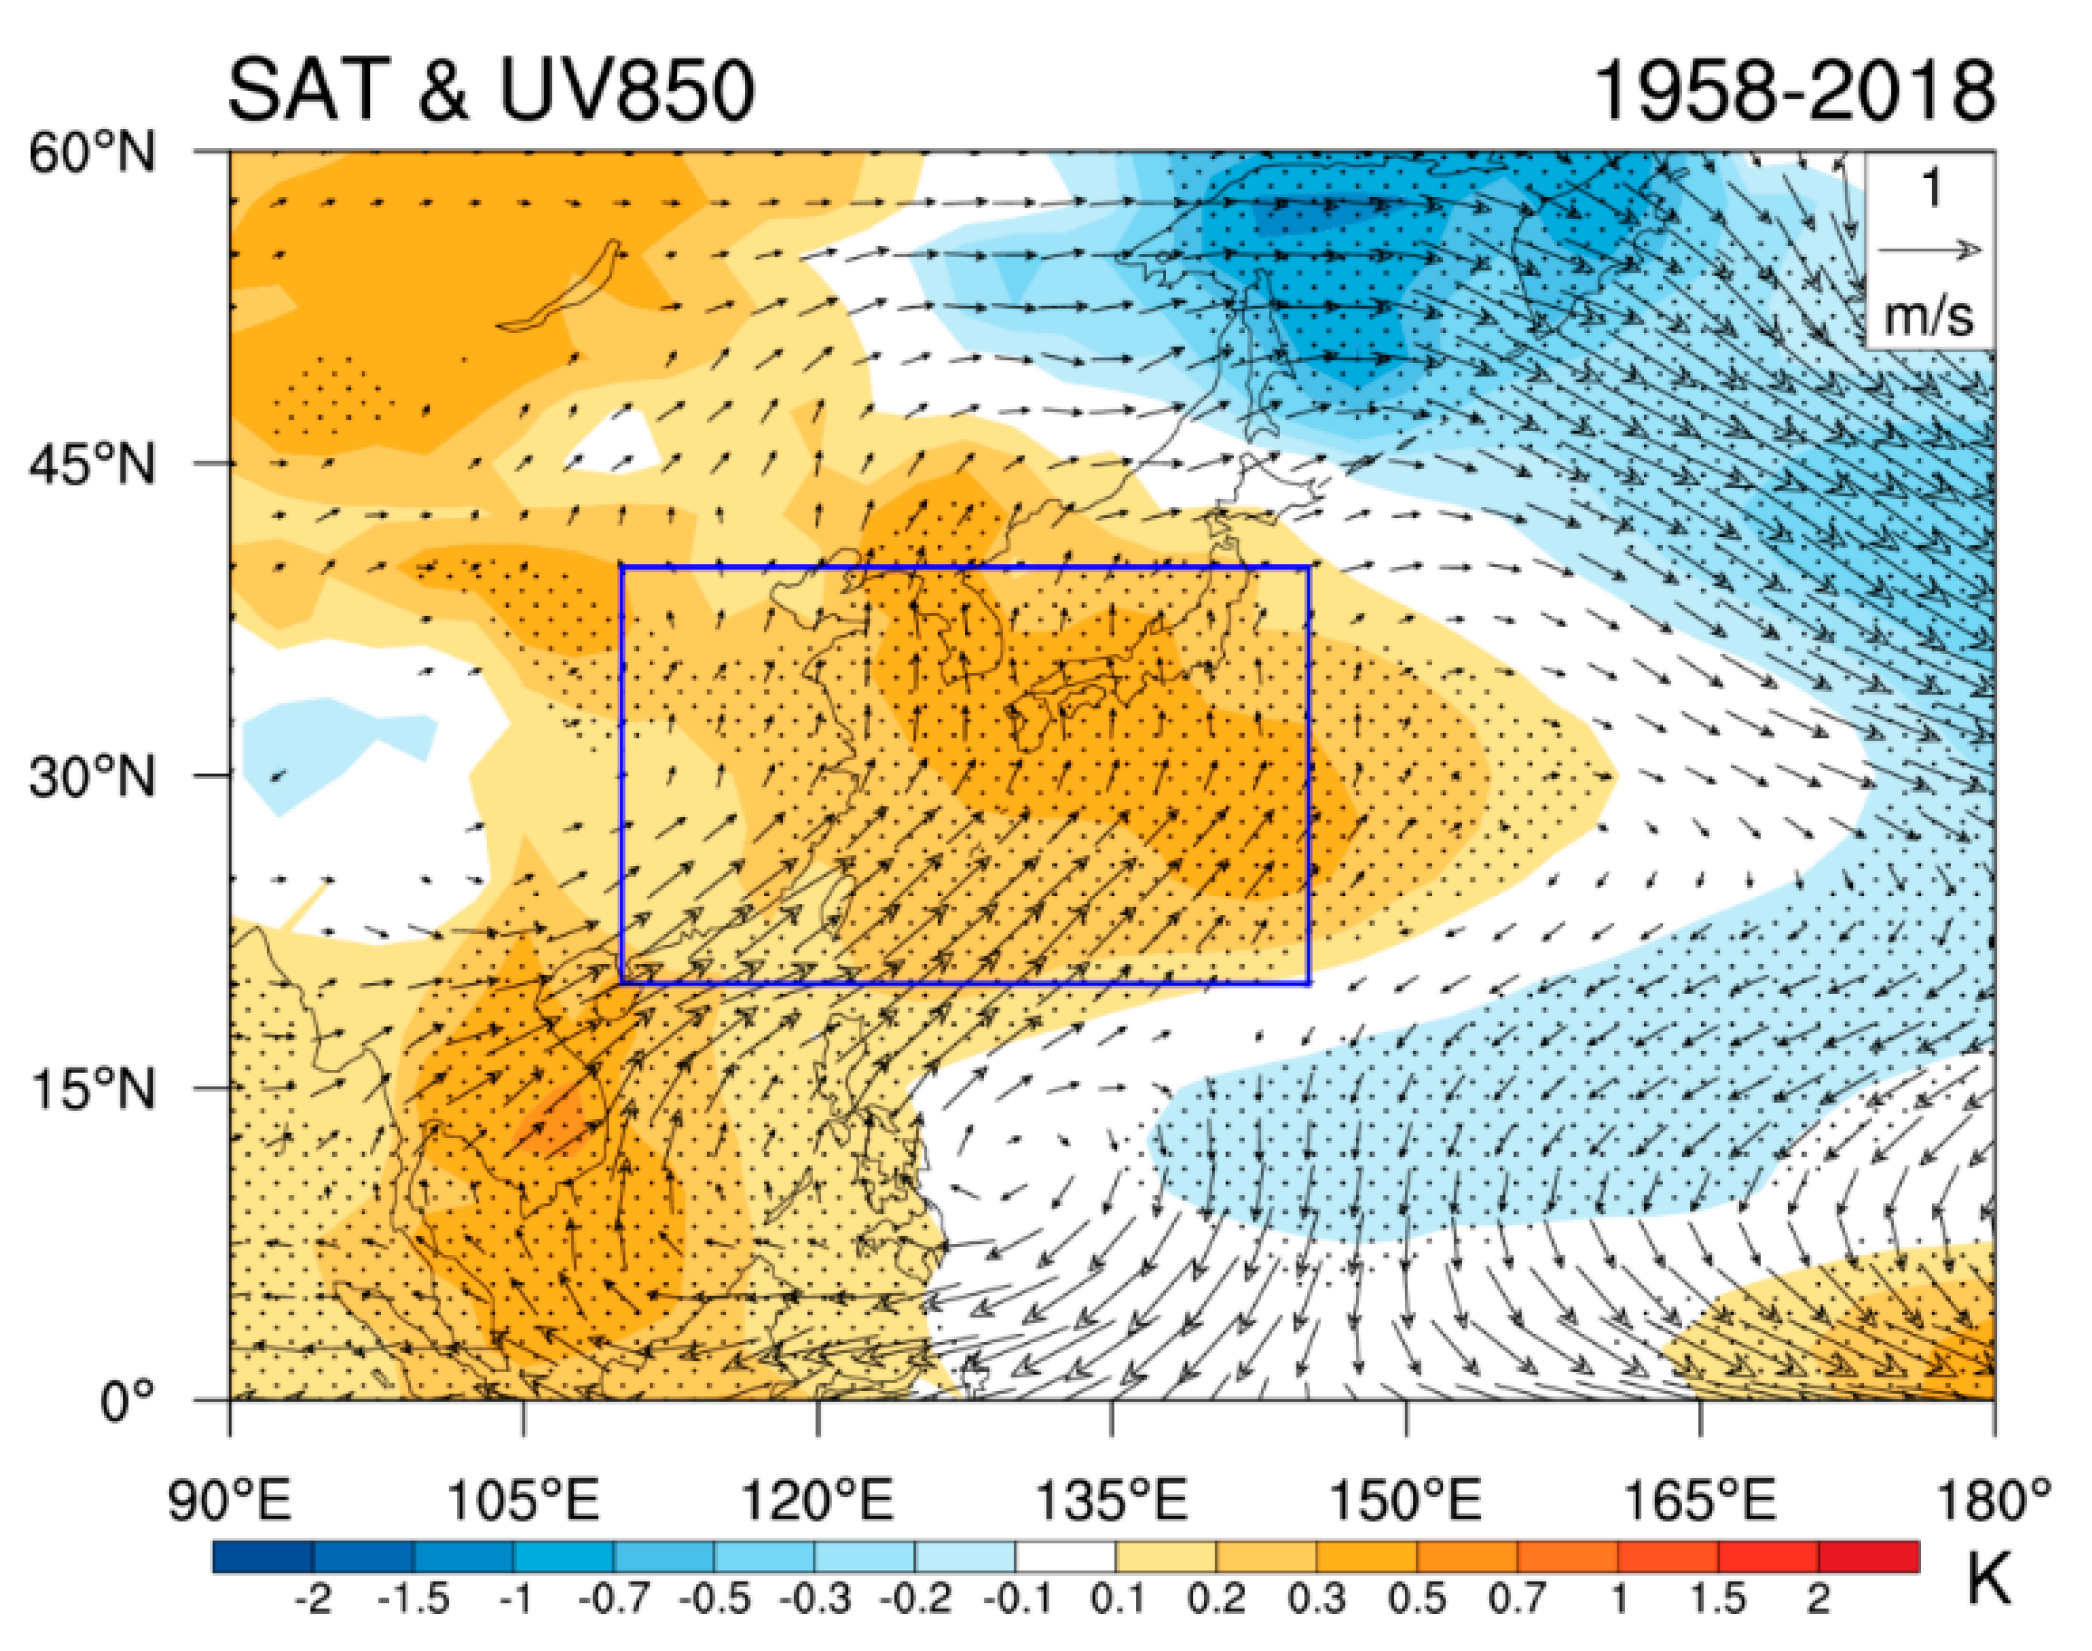
Figure 1 shows the wintertime (December to February) anomalies of SAT and 850 hPa wind regressed onto the normalized winter Niño-3 index over East Asia during 1958–2018. An evident anomalous anticyclone can be observed around the Philippines, accompanied by significant southwesterly anomalies over the coast of East Asia (
Figure 1). The southerly wind anomalies bring the warm air from the low latitudes to East Asia and induce widespread warming over East Asia during the warm phases of ENSO (
Figure 1). This result supports the previous findings that the conventional ENSO can significantly influence the East Asian winter temperature variations [
5,
6,
7,
8,
9,
10]. Previous studies have reported that the relationship between ENSO and a specified EAWM index experienced noticeable decadal changes [
23,
24,
25,
26,
27,
28,
29,
30]; however, whether the influence of ENSO on the East Asian winter temperature is stable or also varied with time remains unclear. To clarify this, we defined an index as the area-averaged wintertime SAT over the regions of 20°–40° N, 110°–145° E to represent the winter SAT variations over East Asia (EAT).
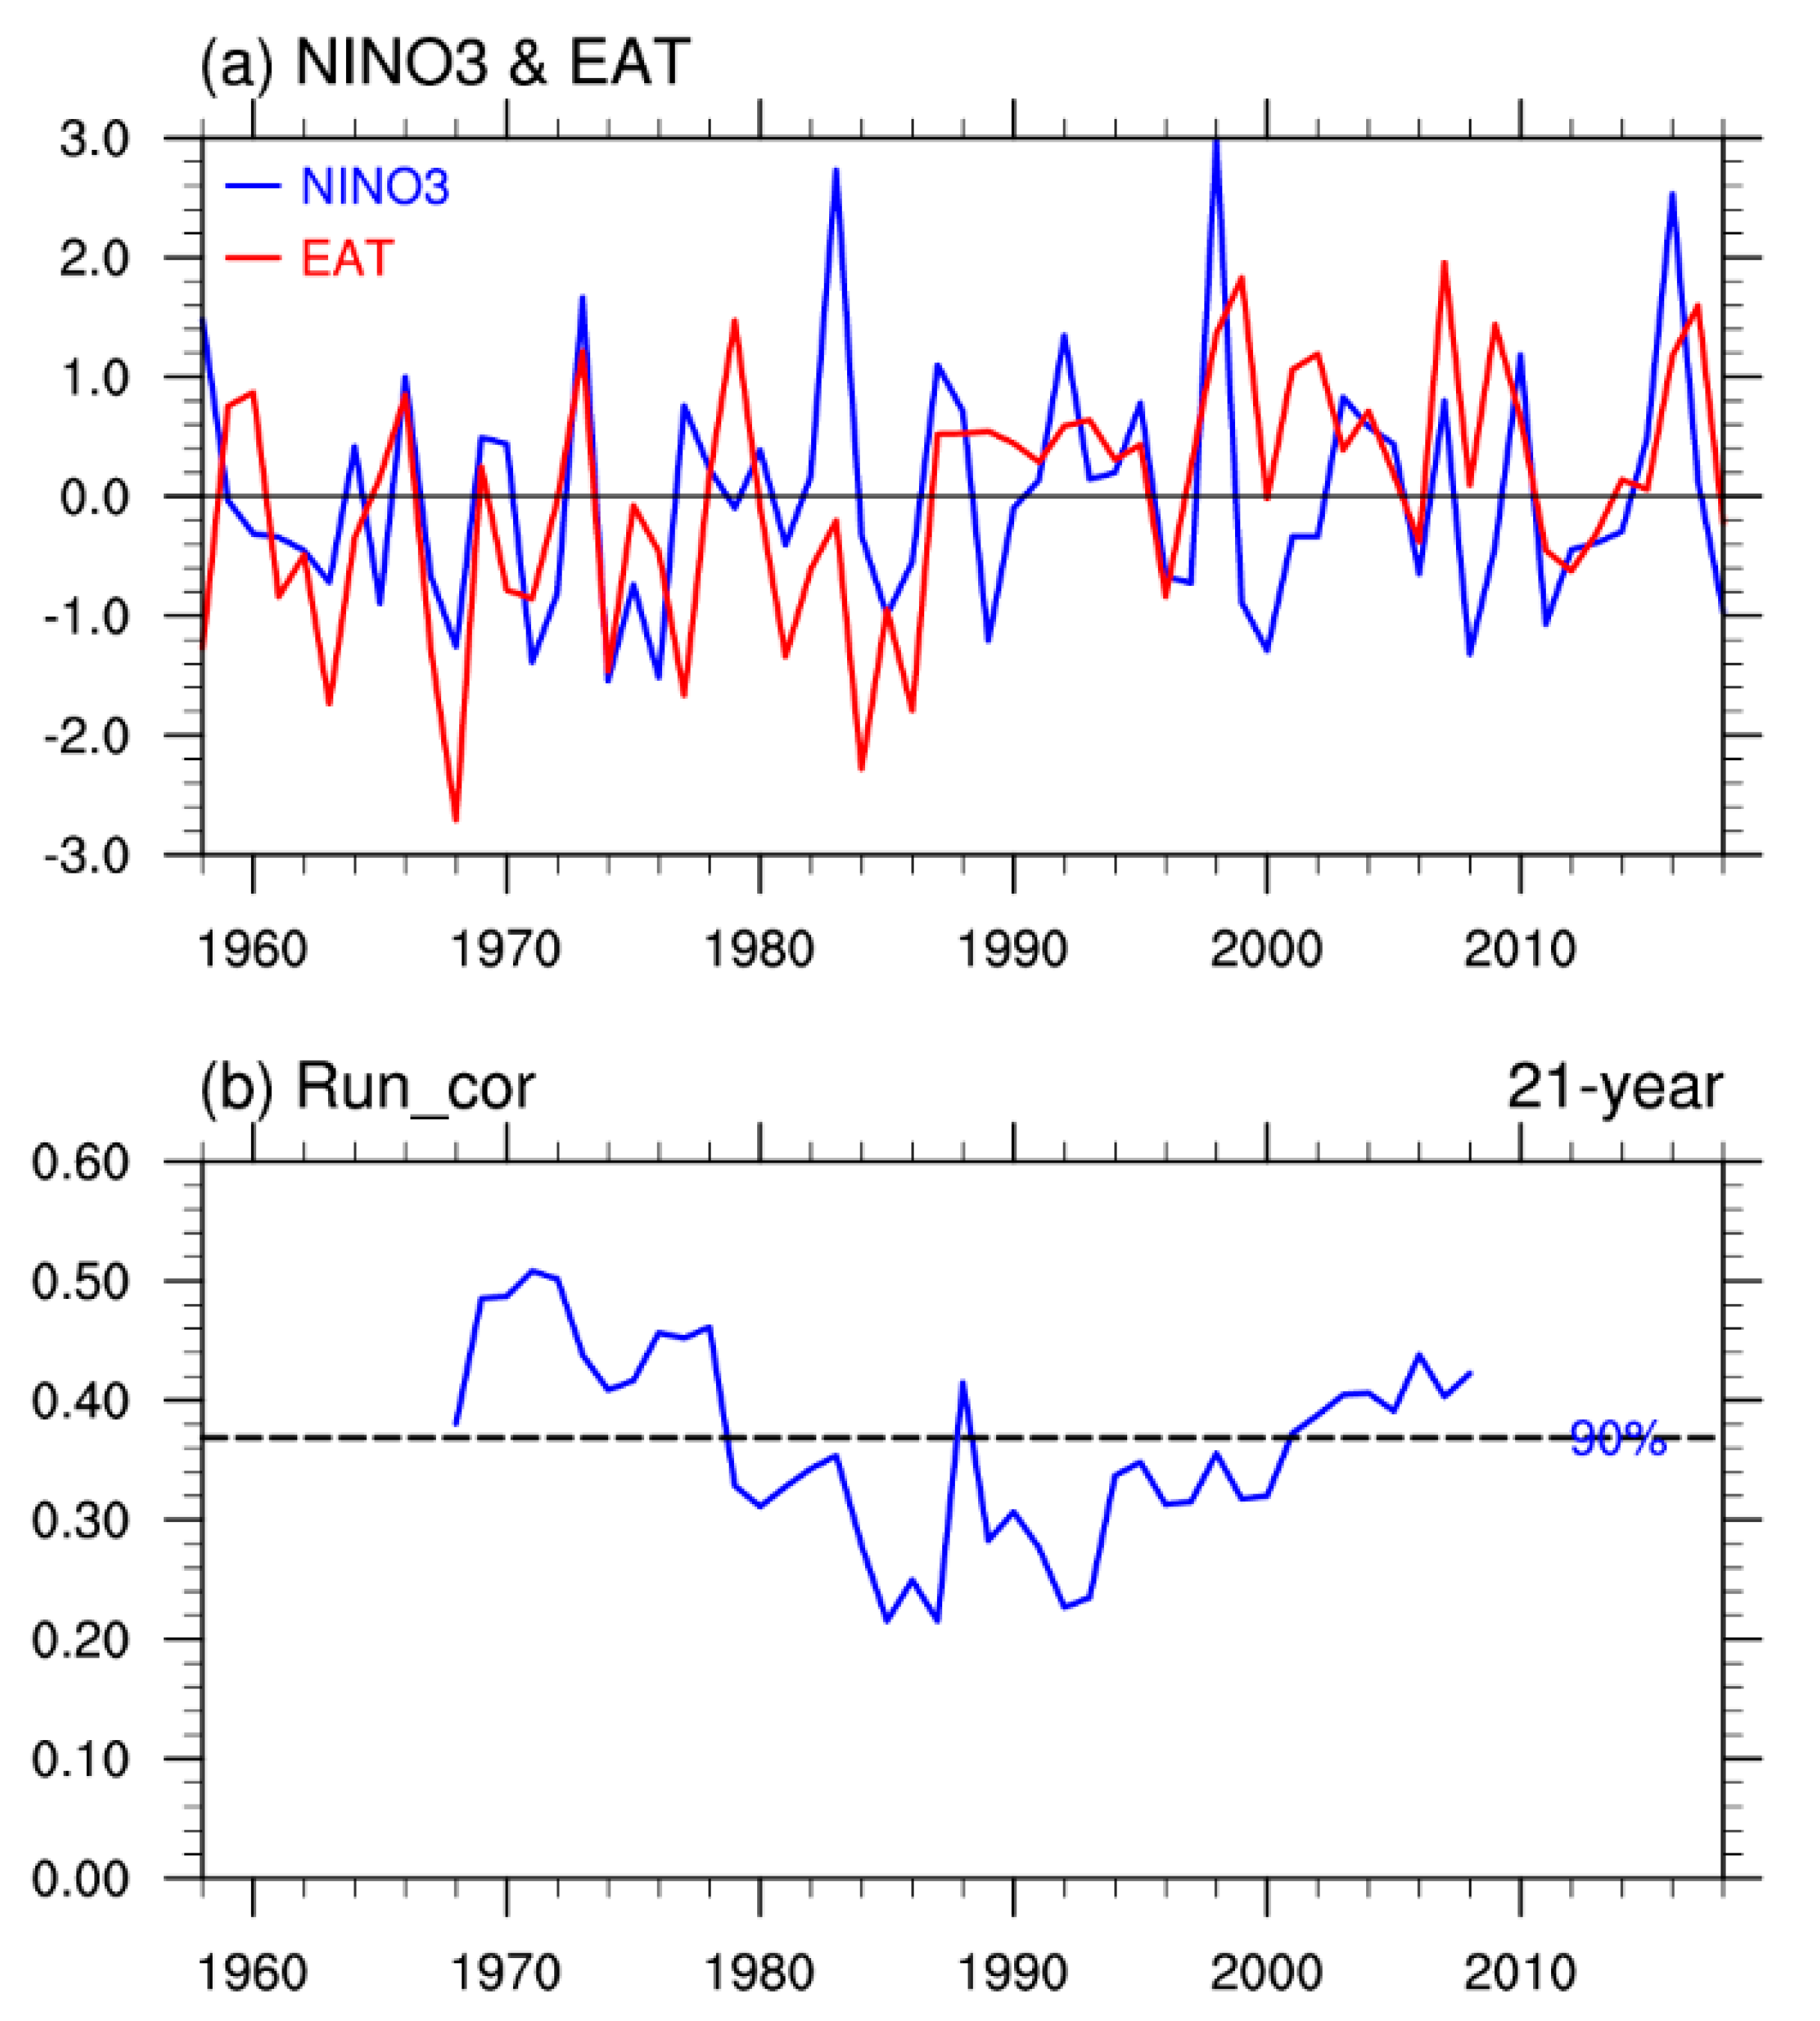
Figure 2a shows the normalized time series of the winter Niño-3 index and the EAT index from 1958 to 2018. The correlation coefficient between the winter Niño-3 index and the simultaneous EAT index reached 0.36 during the period of 1958–2018, exceeding a 95% confidence level. This result confirms that the winter ENSO has a significant positive relation with the EAT. However, a careful examination indicates that the in-phase ENSO–EAT relationship was not stationary during the past decades (
Figure 2a). This is confirmed by the 21 year sliding correlations between the winter Niño-3 index and the EAT index (
Figure 2b). The years displayed in the
x-axis of
Figure 2b correspond to the central year of the 21 year sliding window. The correlation coefficient between the winter Niño-3 index and EAT index was significant before the mid-1970s. It decreased afterward and became insignificant from the mid-1970s to the late 1990s. After that, it increased slowly and reestablished a significant ENSO–EAT relationship after the late 1990s. This oscillation of the ENSO–EAT relationship is basically consistent with the previous findings about the ENSO–EAWM relationship [
23,
24,
25,
26,
27]. This result confirms that the influence of ENSO on the East Asian winter climate indeed experiences evident decadal changes.
Because many studies have analyzed the possible physical process responsible for the decadal weakening of ENSO on the East Asian winter climate around the mid-1970 s [
25,
26,
27], the recently strengthened influence of ENSO on the East Asian temperature variation was investigated in this study. According to the 21 year sliding correlation, the two periods with the lowest and recent highest correlations were singled out for the contrasting analysis throughout this study. According to
Figure 2b, one spans the winters of 1975–1995, corresponding to the lowest correlation coefficient centered in the year 1985. Another one spans the winters of 1996–2016, corresponding to the highest correlation coefficient centered in the year 2006.
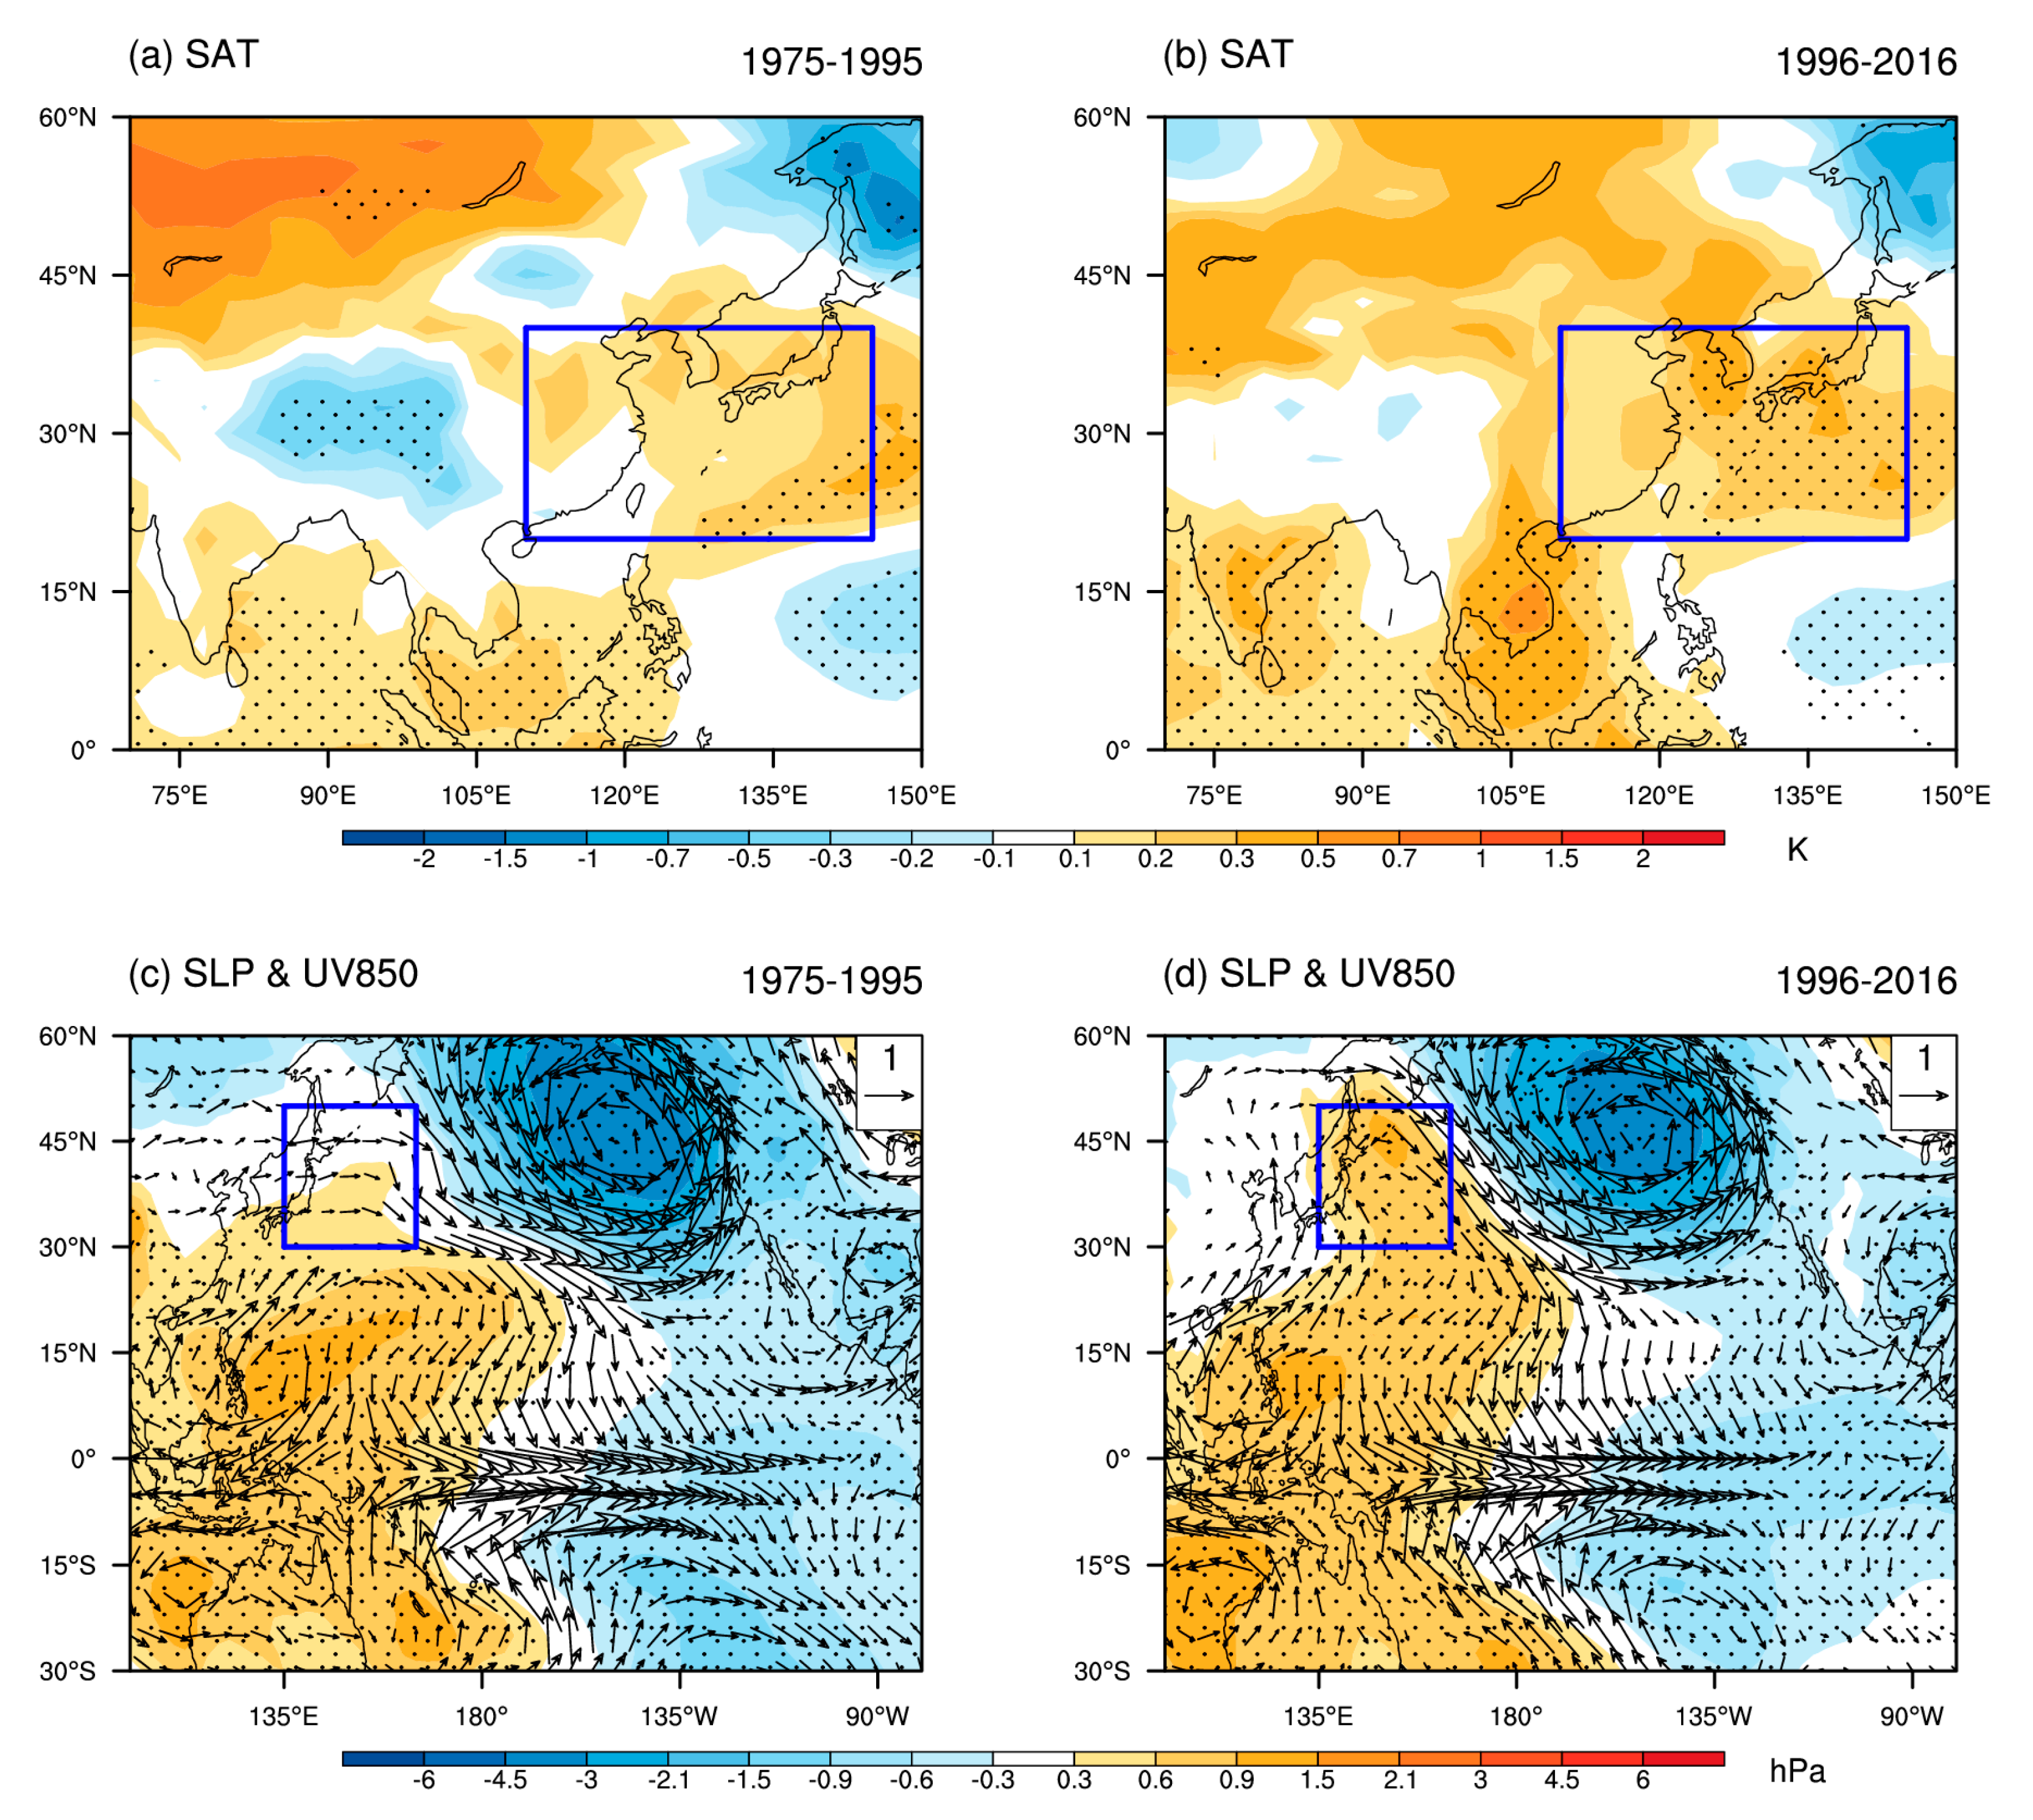
Figure 3a,b shows the regressed winter SAT anomalies against the winter Niño-3 index over East Asia during the two periods, respectively. The SAT anomalies display notable differences over East Asia between the two periods. During 1975–1995, in association with the warm phases of ENSO, the SAT warming was very weak and insignificant over East Asia (
Figure 3a). In contrast, the ENSO-related SAT warming was stronger and more significant over the coast of East Asia during 1985–2005 (
Figure 3b).
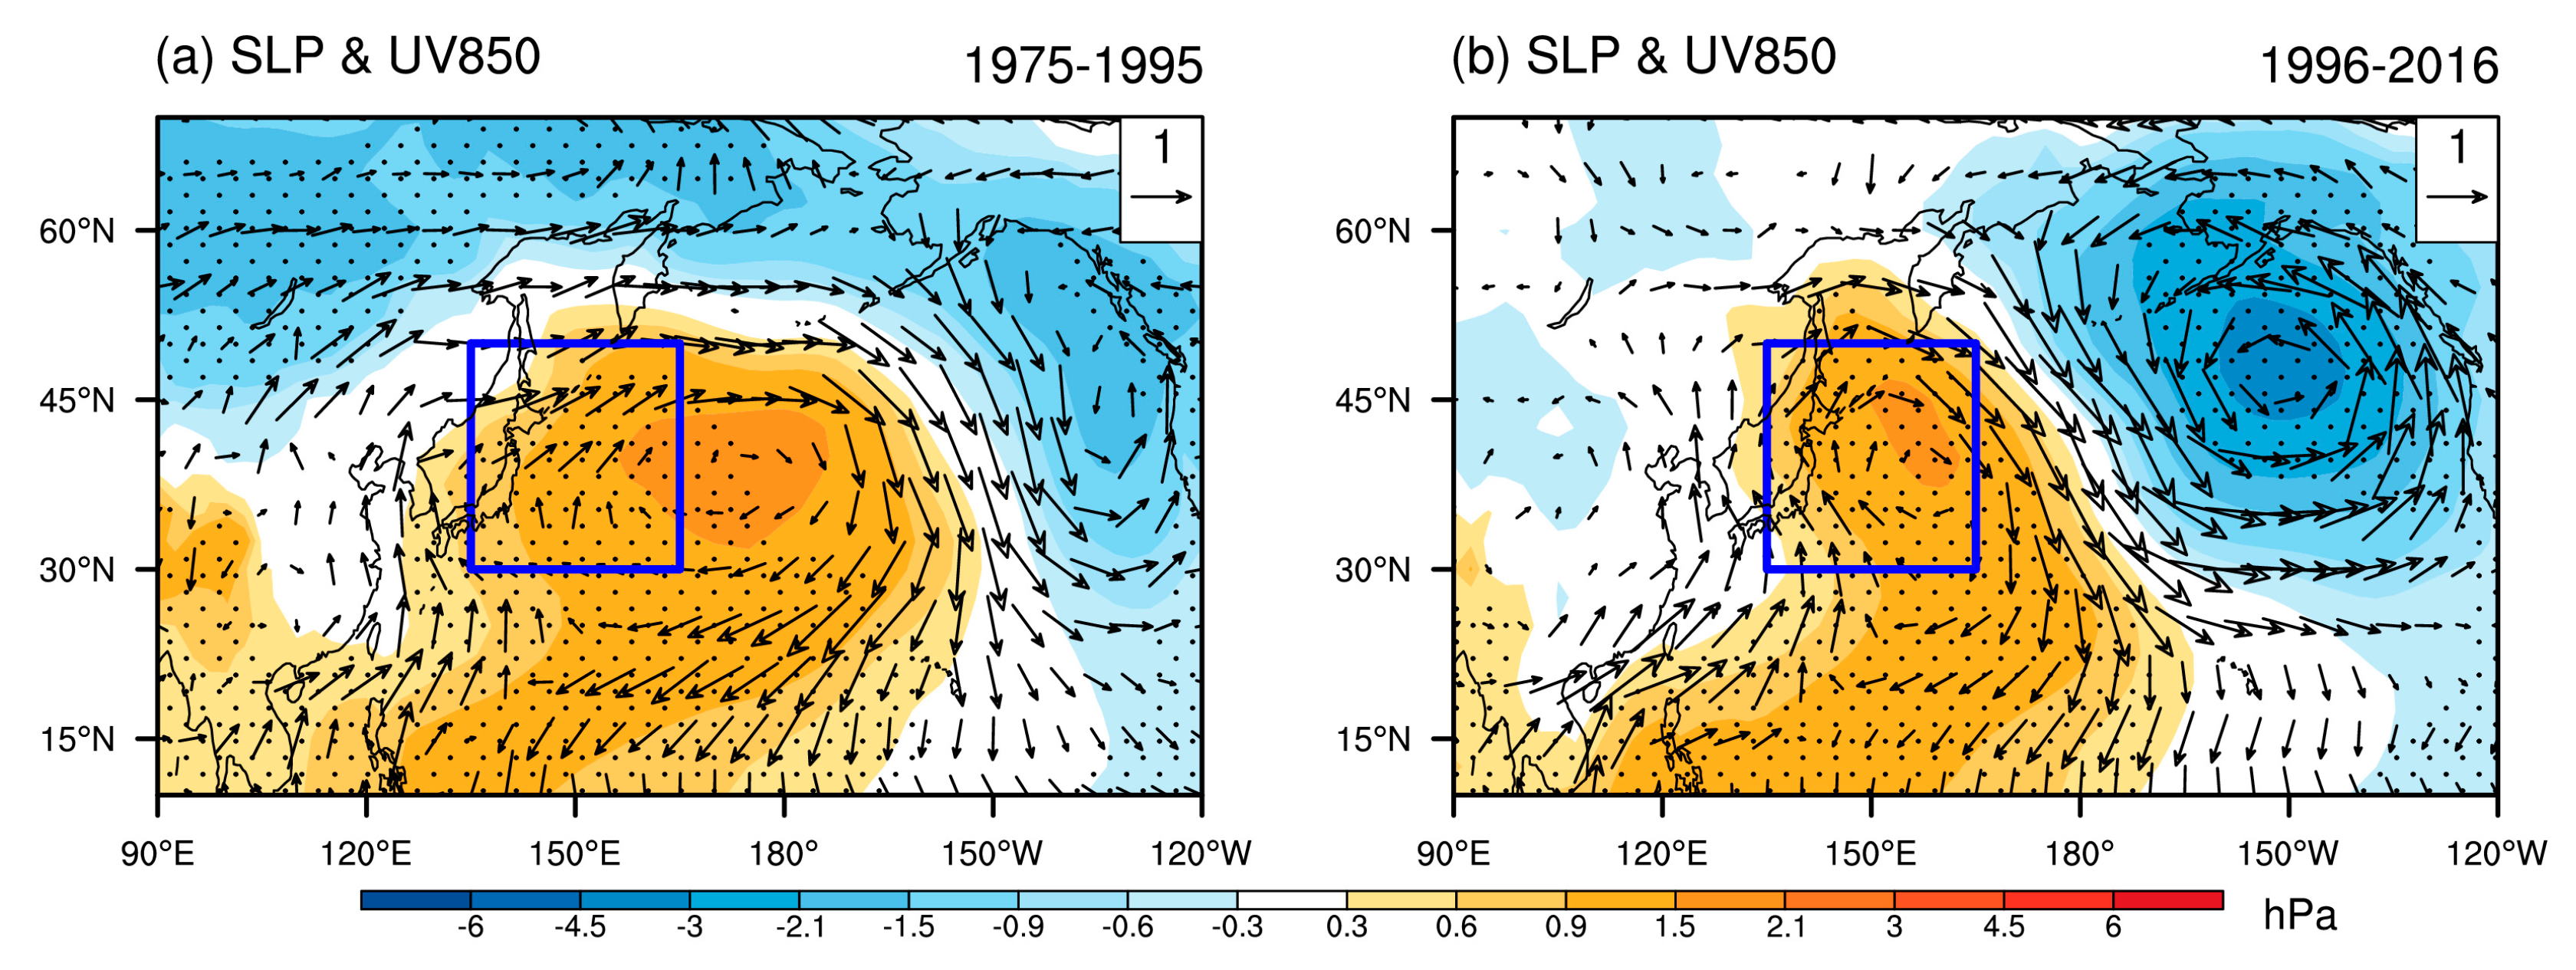
Although the ENSO-related circulation anomalies are very similar over most regions of the Pacific North America section, pronounced differences mainly appeared over the East Asia region between the two periods (
Figure 3c,d). The southerly wind anomalies extended northward to 50° N of East Asia during 1996–2016, whereas they only reached around 30° N during 1975–1995. It is noted that the Kuroshio anticyclone was pronounced during 1996–2016, accompanied by significant positive SLP anomalies in this region (
Figure 3d). In contrast, the anticyclonic anomalies almost disappeared over the Kuroshio Extension region during 1975–1995 (
Figure 3c). Wang et al. [
24] indicated that the ENSO-related pressure gradient anomalies between the cold Eurasian continent and the warm North Pacific are important for the influence of ENSO on the East Asian winter climate. The existence of the Kuroshio anticyclone may decrease the pressure gradient between East Asia and the North Pacific, which facilitates the northward extension of the southerly wind anomalies from the anticyclone over the Philippines and strengthens the influence of ENSO on the East Asian winter climate. Therefore, the intensity of the ENSO-related Kuroshio anticyclone may be a critical factor influencing the ENSO–EAT relationship, which was generally ignored by previous studies.
To verify the influence of the Kuroshio anticyclone on the modulation of the ENSO–EAT relationship, we defined an index as area-averaged ENSO-related SLP anomalies over the Kuroshio Extension region (KACI, 30°–50° N, 135°–165° E) to represent the magnitude of the Kuroshio anticyclone. The relationship between the ENSO and EAT is measured by the correlation coefficient between the winter Niño-3 index and the simultaneous EAT index (i.e., r
NINO3,EAT).
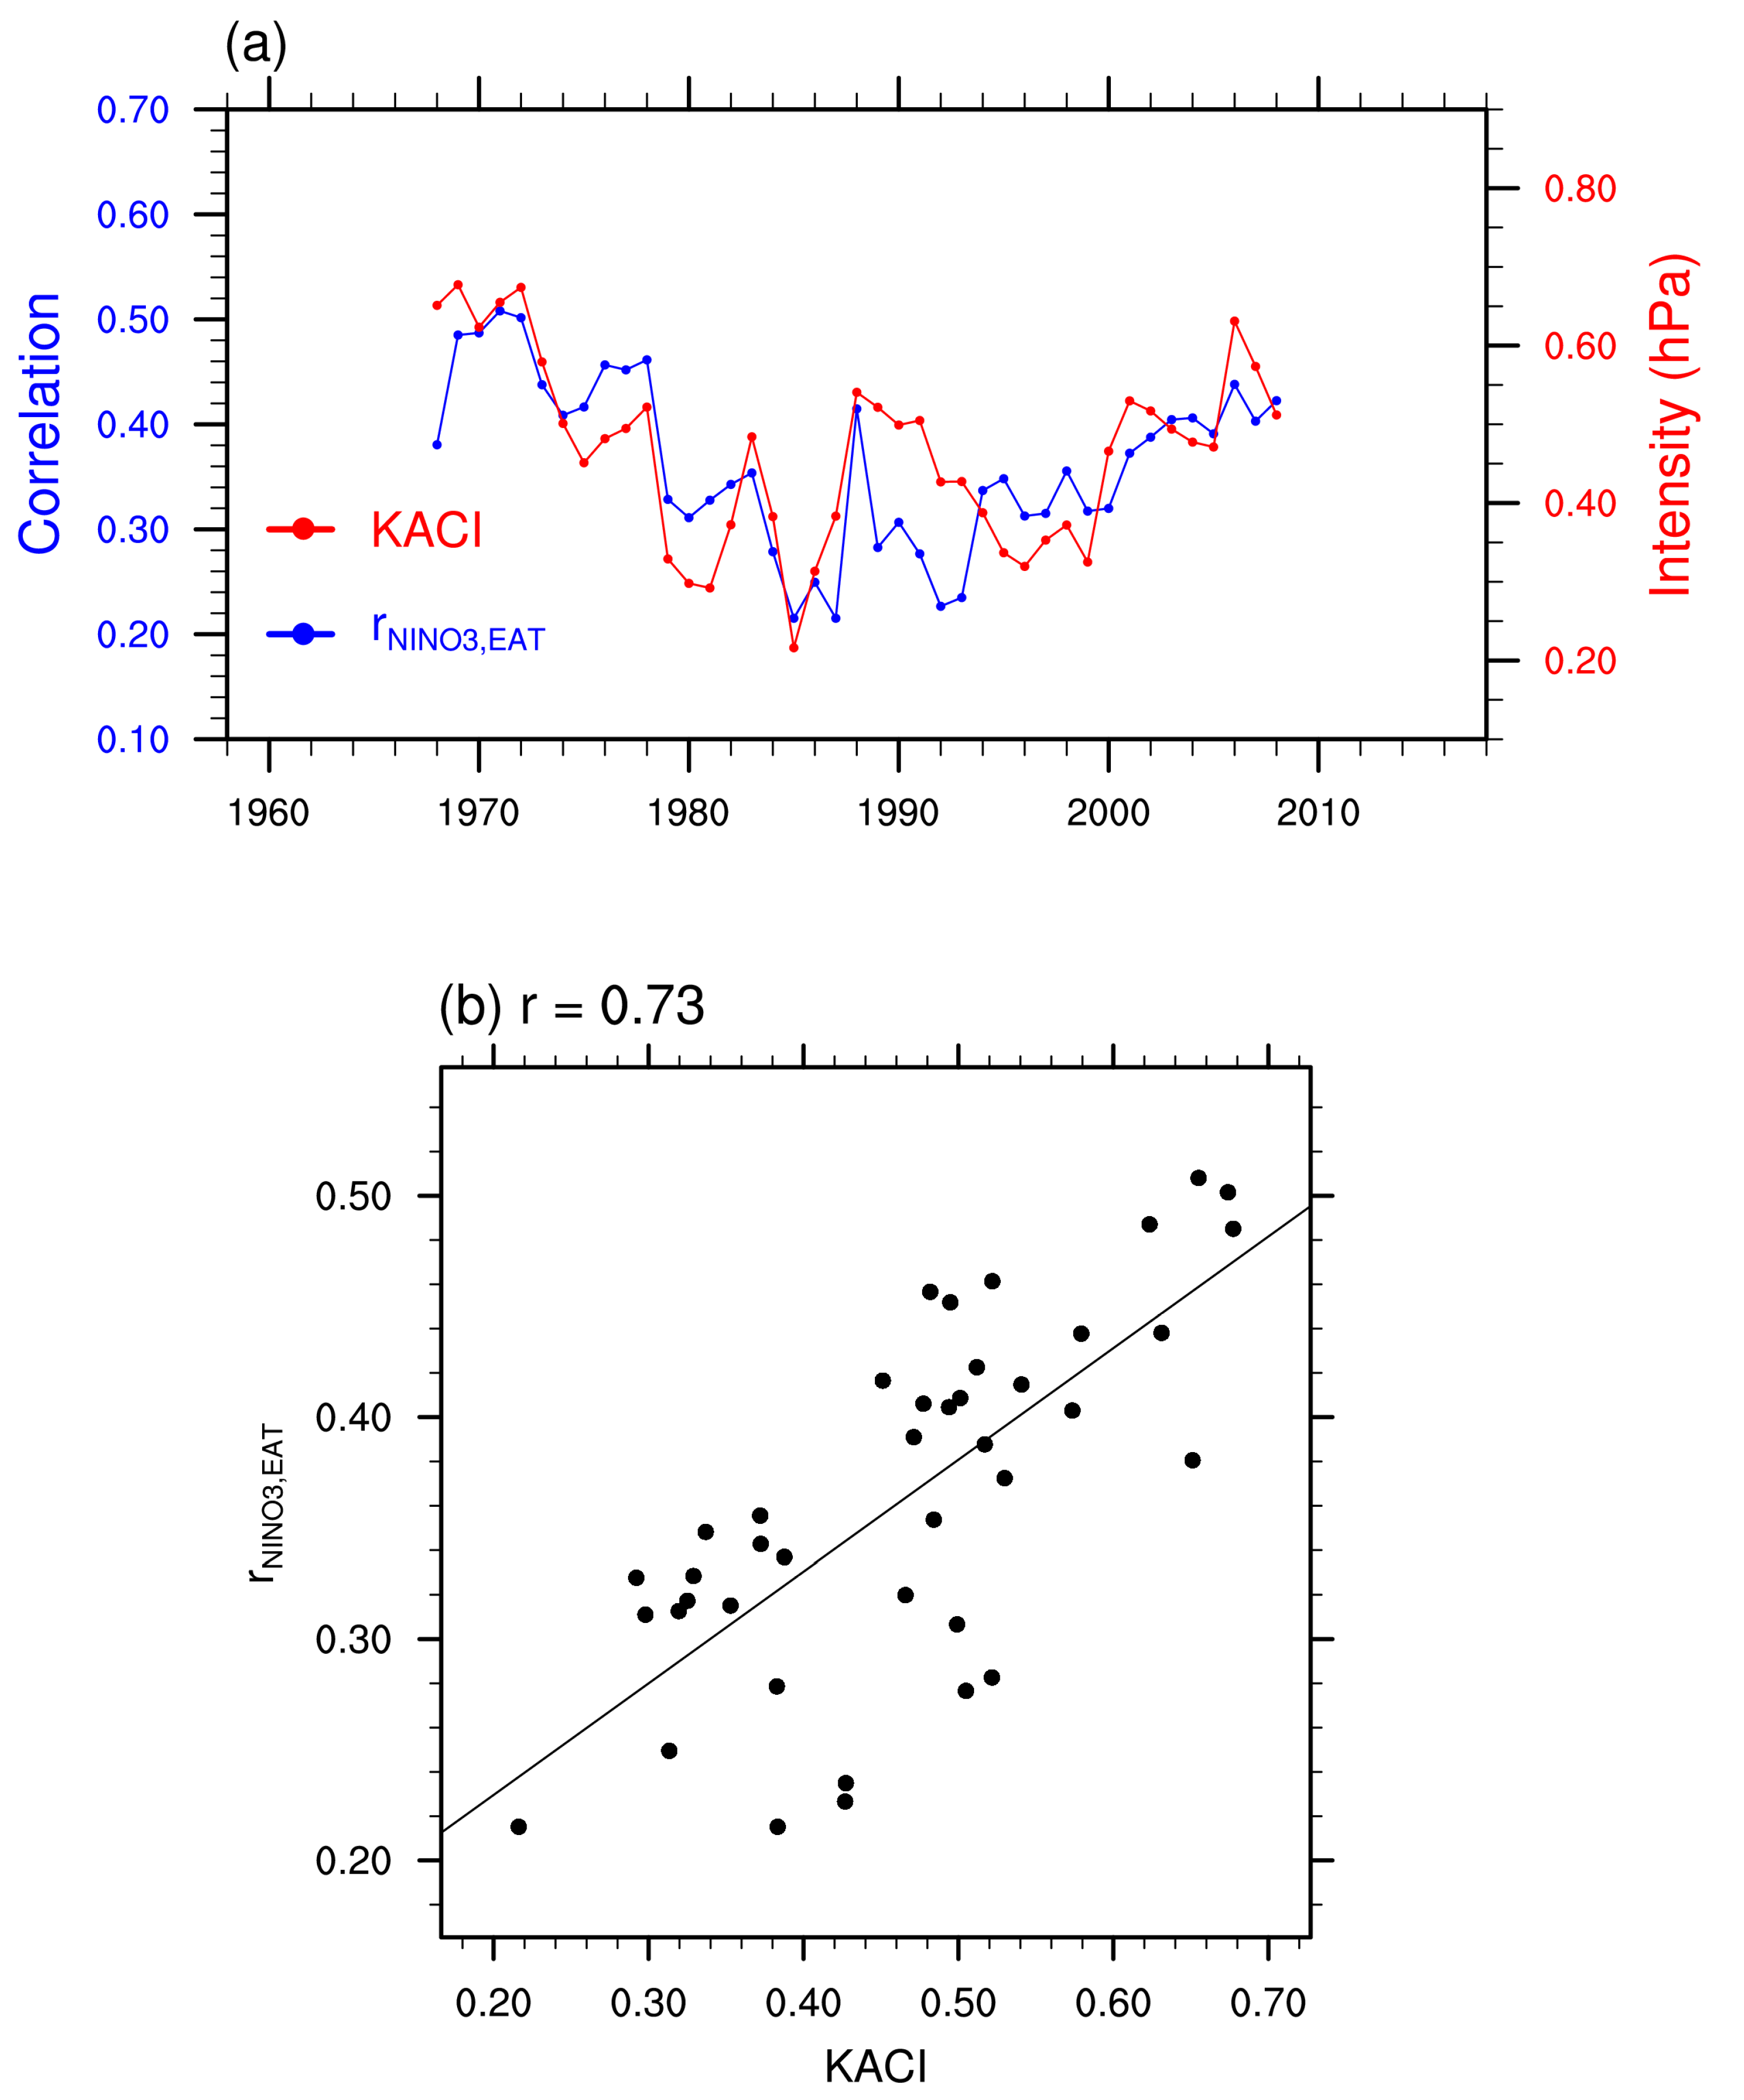
Figure 4a shows the sliding KACI and r
NINO3,EAT with a 21 year window. Apparent multidecadal changes are observed both in the sliding KACI and r
NINO3,EAT during 1958–2018. The temporal evolution of r
NINO3,EAT is highly consistent with that of KACI (
Figure 4a). Linearly clustered dots can also be seen clearly in the scatter diagram between the KACI (
x-axis) and r
NINO3,EAT (
y-axis) in the 21 year moving epoch during 1958–2018 (
Figure 4b). The correlation coefficient between the x and y variables reaches 0.73, and the KACI contributes 53.3% of the variance of the r
NINO3,EAT variability (
Figure 4b). These results support the hypothesis that the multidecadal changes in the influence of winter ENSO on the EAT are largely modulated by the intensity of the Kuroshio anticyclone.
The above results confirm the critical role of the Kuroshio anticyclone in the ENSO–EAT relationship. However, another question arises: what process is responsible for the varied intensity of the ENSO-related Kuroshio anticyclone? Note that the ENSO–SST anomaly pattern is very similar between the two periods (figure not shown). Therefore, the differences of ENSO-related atmospheric circulation anomalies between the two periods may be from the influence of internal atmospheric circulation variability. The location of the anomalous Kuroshio anticyclone is over the western part of the North Pacific. Therefore, the North Pacific circulation variability may play a role in the intensity of the Kuroshio anticyclone. Previous studies have pointed out that the Aleutian Low (AL) is the dominant variability of atmospheric circulation over the North Pacific, which has a potential connection with the atmospheric circulation variability over other midlatitude regions [
26,
35,
36]. Therefore, we tried to understand whether the AL can modulate the influence of ENSO on the circulation variability over the Kuroshio Extension region. To answer this question, the circulation anomalies related to the AL-independent ENSO variability were investigated in the two periods. To obtain the ENSO variability independent of the AL, the AL-related variability was removed from the original ENSO variability through a linear regression method [
37,
38,
39] as follows:
where R
Niño-3,AL is the regression coefficient of the Niño-3 index with respect to the AL index (see definition in
Section 2). The Niño-3
RM_AL is the AL-independent Niño-3 index, and it was used to calculate the AL-independent ENSO-related teleconnections via linear regression. The influences of ENSO on the winter atmospheric circulation anomalies in the coast of East Asia and the western North Pacific region were similar between the two periods when the AL variability was linearly removed (
Figure 5a,b). The AL-independent ENSO-induced anomalous anticyclones over the Philippines and Kuroshio Extension region were both pronounced between the two periods. The resultant southerly wind anomalies can both extend northward to 50° N (
Figure 5a,b). This result indicates that the varied intensity of the ENSO-related Kuroshio anticyclones and the resultant oscillational ENSO–EAT relationship are largely induced by the AL variability. This result is consistent with the previous findings that the ENSO–EAWM relationship may be influenced by the AL [
26]. Note that the atmospheric circulation anomalies associated with the AL-independent ENSO over the North Pacific are somewhat different between the two periods. The reasons are unclear and should be investigated further in future studies.
However, the mechanism responsible for the AL modulating the relationship between ENSO and the Kuroshio anticyclone, as well as the EAT in the recent decadal change may be different from the previous deduction. He et al. [
26] indicated that the weakened impact of ENSO on the East Asian winter climate may be related to the shifting eastward of the AL after the mid-1970s. It is noted that although the ENSO-related circulation anomalies over the North Pacific seemed to shift eastward after the mid-1970s [
26], the eastward movement of the AL itself was not apparent before and after the mid-1970s (figure not shown). The evident change of the AL pattern occurred in the past two decades.
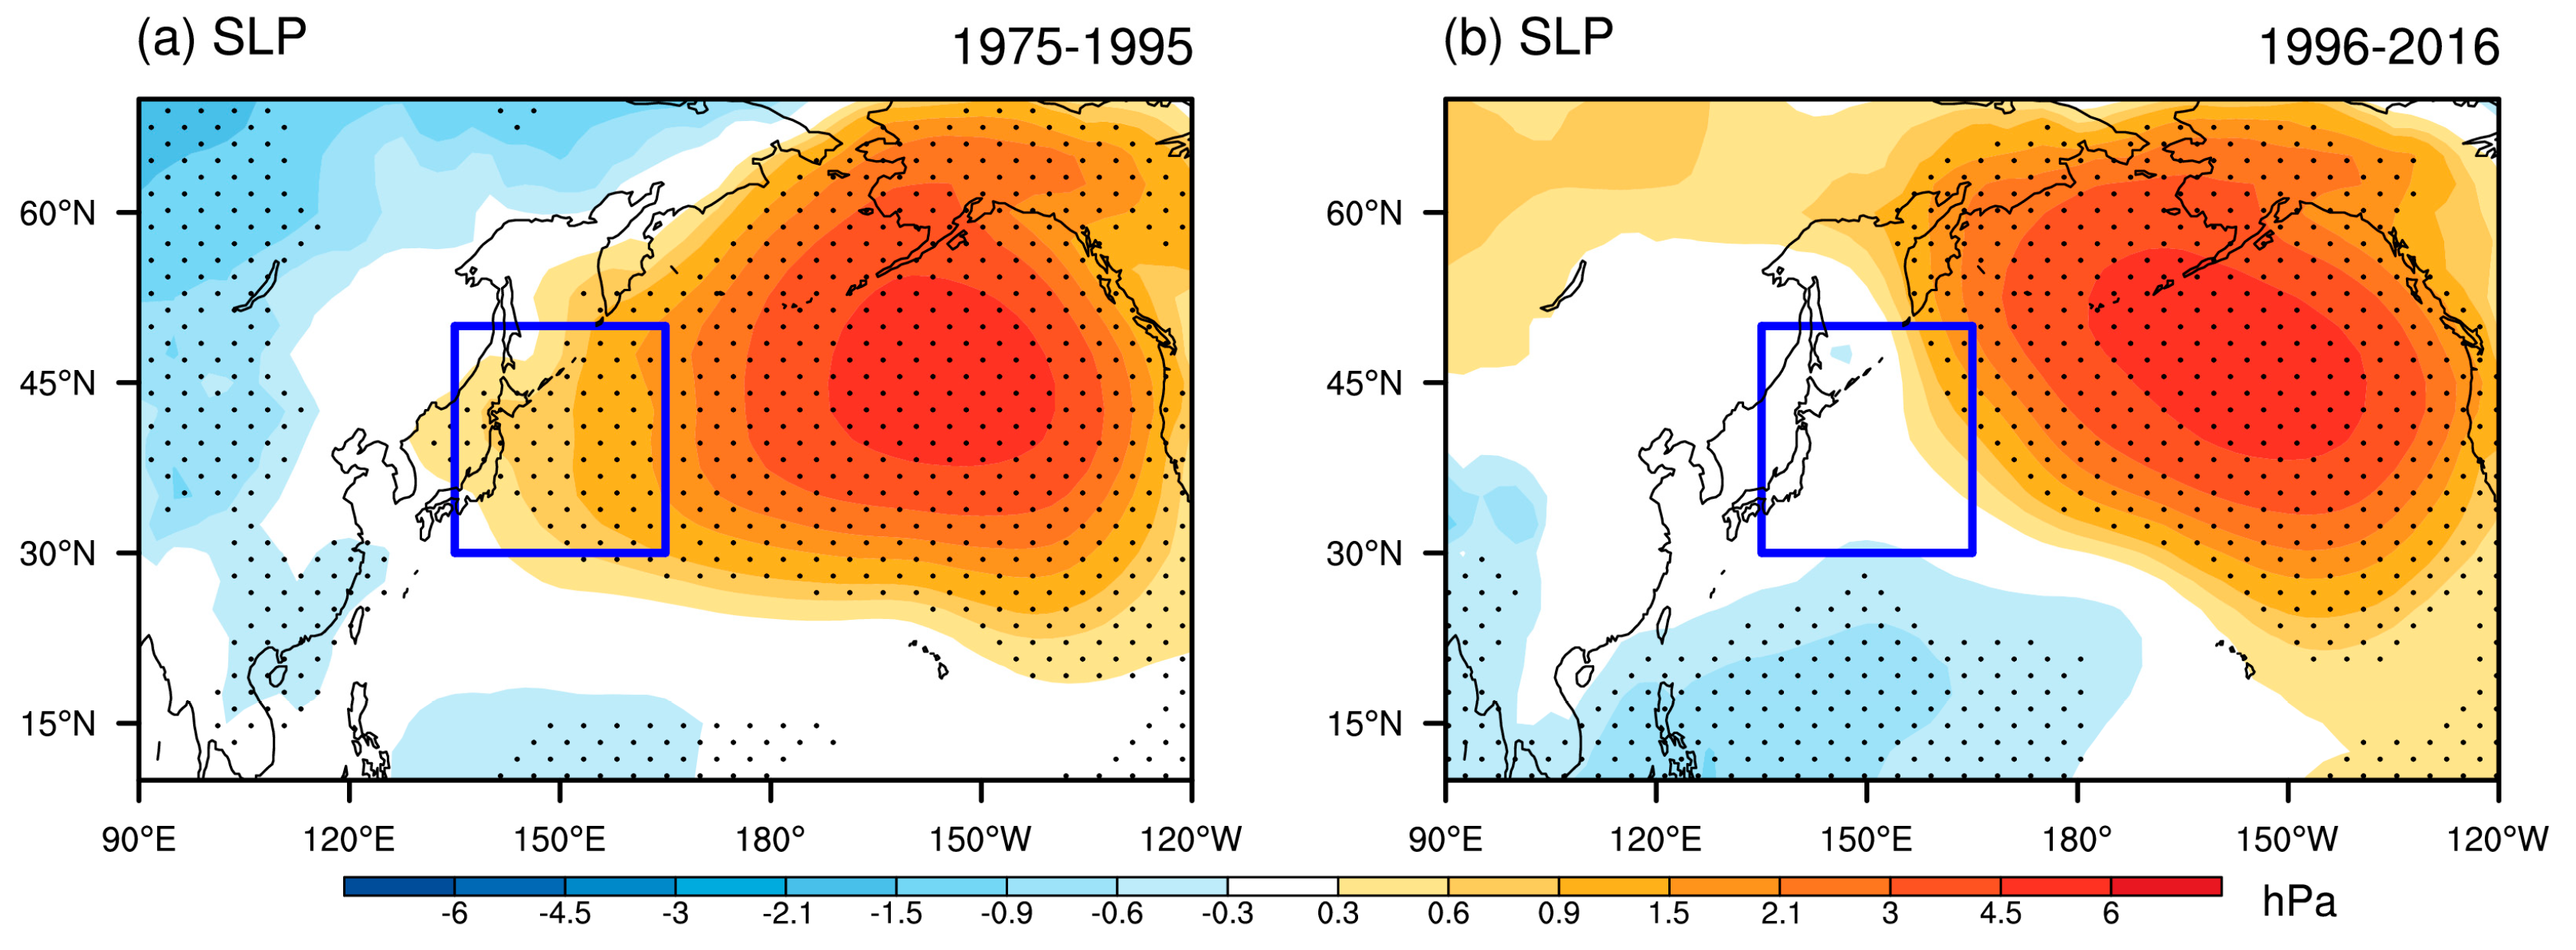
Figure 6a,b displays the AL patterns in the periods of 1975–1995 and 1996–2016, respectively. Although the location of the AL center was somewhat close between the two periods, the west boundary of AL shows obvious eastward shrinking during 1996–2016 compared with that during 1975–1995 (
Figure 6a,b). It induces the relatively weak influence of the AL on the circulation variability over the Kuroshio Extension region during 1996–2016. Meanwhile, there are significant negative correlations between ENSO and the AL, with the correlation coefficients of −0.53 and −0.67 in the two periods, respectively, with both exceeding a 99% confidence level. Therefore, the mechanism responsible for the modulation of the AL on the intensity of the Kuroshio anticyclones during the last decadal change can be summarized as follows: During 1975–1995, in association with the warm ENSO events, the AL was strengthening. This induced the negative anomalies of SLP over the North Pacific, including the Kuroshio Extension region. The negative anomalies of SLP offset the positive SLP anomalies caused by ENSO over the Kuroshio Extension region, weakened the Kuroshio anticyclone, and also weakened the influence of ENSO on the EAT. In contrast, this offset effect was much weaker during 1996–2016 than that during 1975–1995 due to the weak link of circulation variability between the AL and Kuroshio Extension region. Therefore, the relationship between ENSO and the Kuroshio anticyclones, as well as the EAT, was recovered during 1996–2016 to a certain extent.
4. Summary and Discussion
In this study, we revisit the influence of ENSO on the East Asian winter climate based on the investigation of the ENSO–EAT relationship during 1958–2018. Because the CP ENSO has little impact on the East Asian winter climate, we focused on the conventional ENSO. Our results indicate that the ENSO–EAT relationship experienced notable decadal changes during the past decades. The ENSO–EAT relationship was significant before the mid-1970 s, and it decreased afterward until the late 1990s. After that, it increased slowly to the present and reestablished a significant ENSO–EAT relationship.
The decadal changes of the ENSO–EAT relationship are largely attributed to the varied magnitudes of the ENSO-related Kuroshio anticyclone. The intensity of the Kuroshio anticyclone contributed more than 50% of the variance of the oscillating ENSO–EAT variability during the past few decades. The two periods with the lowest and recent highest correlations were singled out for the contrasting analysis of the strengthened influence of ENSO on the EAT after the late 1990s. During 1975–1995, in association with the warm phases of ENSO, the Kuroshio anticyclone almost disappeared, and the southerly wind anomalies were mainly confined to the south of 30° N of East Asia and induced a weak and insignificant influence of ENSO on the EAT. In contrast, the Kuroshio anticyclone was pronounced during 1996–2016, which facilitated the northward extension of the southerly wind anomalies from the anomalous anticyclone over the Philippines to 50° N of East Asia and significantly strengthened the impact of ENSO on the EAT variation.
The changes in the magnitudes of the ENSO-related Kuroshio anticyclone may be related to the changes in the AL pattern. During 1975–1995, the AL had a significant positive correlation with the circulation over the Kuroshio Extension region. In contrast, this connection became very weak during 1996–2016. Because ENSO had a significant negative correlation with the AL in both of the two periods, the significant influence of AL on the circulation variability over the Kuroshio Extension region offset the effect of ENSO on the formation of the Kuroshio anticyclone. Therefore, the southerly wind anomalies were weakened and confined to the southern part of East Asia and induced a weak influence of ENSO on the EAT during 1975–1995. In contrast, this offset effect almost disappeared during 1996–2016 due to the weak link of circulation variability between the AL and Kuroshio Extension region. Therefore, the relationship between ENSO and the Kuroshio anticyclones as well as the EAT recovered during 1996–2016 to a certain extent.
It should be noted that the factors that influence the changes in the winter AL pattern are not clear. Wang et al. [
24] reported that the influence of ENSO on the East Asian winter climate is most pronounced when the PDO is in negative phases. The PDO shifted to its negative phases around the late 1990s, which agrees with the recently strengthening influence of ENSO on the EAT. Because the decadal changes of atmospheric circulation may be closely tied to the underlying SST anomalies [
40], the changes in the winter AL pattern may be related to the decadal changes of the PDO phases. The mechanism of PDO-related SST anomalies over the high latitudes of the North Pacific subtropical gyre on the varied ENSO’s impacts on the East Asian winter climate need to be systematically investigated in future studies. The analysis of this study was mainly from the perspective of internal atmospheric circulation to illustrate the mechanism of the ENSO–EAT relationship, and the possible synergistic effects of external SST forcing and internal circulation variability for the formation of the oscillational ENSO–EAT relationship need to be investigated in future studies.
