Article

Aerosol Optical Depth of the Main Aerosol Species over Italian Cities Based on the NASA/MERRA-2 Model Reanalysis

1
CNR/ISAC, Unit of Lecce, 73100 Lecce, Italy
2
Università Politecnica delle Marche, UNIVPM/DIISM, 60131 Ancona, Italy
*
Author to whom correspondence should be addressed.
Atmosphere 2019, 10(11), 709; https://doi.org/10.3390/atmos10110709
Submission received: 9 October 2019 / Revised: 29 October 2019 / Accepted: 6 November 2019 / Published: 14 November 2019
(This article belongs to the Special Issue Recent Advances of Air Pollution Studies in Italy)

Abstract

:
The Modern-Era Retrospective Analysis for Research and Applications, version 2 (MERRA-2) provides data at 0.5° × 0.625° resolution covering a period from 1 January 1980 to the present. Natural and anthropogenic aerosols are simulated in MERRA-2, considering the Goddard chemistry, aerosol, radiation, and transport model. This model simulates the sources, sinks, and chemistry of mixed aerosol tracers: dust, sea salt, hydrophobic and hydrophilic black carbon and organic carbon, and sulfate. MERRA-2 aerosol reanalysis is a pioneering tool for investigating air quality issues, noteworthy for its global coverage and its distinction of aerosol speciation expressed in the form of aerosol optical depth (AOD). The aim of this work was to use the MERRA-2 reanalysis to study urban air pollution at a national scale by analyzing the AOD. AOD trends were evaluated for a 30-year period (1987–2017) over five Italian cities (Milan, Rome, Cagliari, Taranto, and Palermo) in order to investigate the impacts of urbanization, industrialization, air quality regulations, and regional transport on urban aerosol load. AOD evolution predicted by the MERRA-2 model in the period 2002–2017 showed a generalized decreasing trend over the selected cities. The anthropogenic signature on total AOD was between 50% and 80%, with the largest contribution deriving from sulfate.

1. Introduction

Atmospheric aerosols play an important role in the surface energy budget, with changes in the concentration, size, and chemical composition influencing aerosol radiative climate effects [1]. Aerosols originate from many sources, both natural and anthropogenic, and may be found in extremely variable space–time and size distributions. Concerning the chemical compositions of the different aerosol species commonly found in the air, it is important to differentiate between natural and anthropogenic. Among the natural aerosol species, the most important are desert (mineral) dust and sea salt, the emissions of which are surface-wind-speed-dependent. The anthropogenic aerosols may be broadly classified as sulfate (SO4), organic carbon (OC), and black carbon (BC). Emissions of anthropogenic aerosols emerge mostly from fossil fuel combustion, biomass burning, and other minor emission mechanisms. Atmospheric aerosols induce negative radiative forcing, with most aerosol species (e.g., mineral dust, sulfate, and OC) scattering solar radiation, and only BC absorbing solar radiation [1].
Reanalysis is the process by which a static data assimilation system is used to provide a coherent reprocessing of meteorological observations based on an underlying forecast model in order to combine disparate observations in a physically consistent manner [2]. The National Aeronautics and Space Administration (NASA) Global Modeling and Assimilation Office (GMAO) reanalysis development started (in the mid-twentieth century) with the production of the Goddard Earth Observing System, version 1 (GEOS-1) reanalysis. It first advanced significantly with the production of the Modern-Era Retrospective Analysis for Research and Applications (MERRA) [3], and recently with the MERRA-2 global atmospheric reanalysis [2]. In recent years, the European Centre for Medium-Range Weather Forecasts (ECMWF) has also provided reanalysis of atmospheric composition following the Copernicus Atmospheric Monitoring Service (CAMS) project [4], specifically when ESA-Envisat (2002), NASA-Aqua (2002), and NASA-Aura (2004) retrievals became available.
MERRA-2 was designed to replace the original MERRA reanalysis [3], including recent advances in modeling and data assimilation for near-real-time climate analysis. It can be considered an important step toward an integrated earth systems analysis, since it includes aerosol fields that are radiatively coupled with atmospheric variables. It was one of the first multidecadal reanalyses within which meteorological and aerosol observations were jointly assimilated into a global assimilation system. MERRA-2 simulates natural and anthropogenic aerosols considering the Goddard chemistry, aerosol, radiation, and transport (GOCART) model [5]. The GOCART model simulates the sources, sinks, and chemistry of mixed aerosol tracers: dust, sea salt (SS), hydrophobic and hydrophilic BC and OC, and sulfate. One of the goals of MERRA-2 is to provide information about changes in the anthropogenic component of aerosols and their interaction with the circulation and climate [3]. There is already an abundance of literature on applications of the MERRA-2 model reanalysis, which may be found via the MERRA-2 webpage [6].
The aerosol data assimilation utilizes an ensemble method to assimilate AOD from both ground-based Aerosol Robotic Network (AERONET) sun photometers [7] and satellite retrievals [3]. It is important to mention that the Moderate Resolution Imaging Spectroradiometer (MODIS) sensors on-board the Terra and Aqua spacecrafts actually provide the vast majority of the AOD observations assimilated in MERRA-2, especially after 2002, when both Aqua and Terra became operative.
Aerosols have an impact on urban air quality and the health of the exposed population. Stirnberg et al. [8] investigated satellites’ AOD measurements as a proxy of ground-level aerosol concentrations. These authors observed a nonlinear relationship between satellite-derived AOD and ground PM10 concentration varying with meteorological conditions (e.g., ambient relative humidity, boundary layer height, and wind speed and direction). Alpert et al. [9] investigated the AOD trends over the world’s megacities using three space-based aerosol sensors (i.e., the Multi-angle Imaging Spectro-Radiometer (MISR), MODIS-Terra, and MODIS-Aqua), and found mainly declining AOD trends for the European megacities. They further verified that where all three sensors showed similar AOD trends, the results could be considered reliable. The decreasing AOD trend over Europe was also observed by Che et al. [10] in a recent work considering MERRA-2 reanalysis at decadal timescales in different regions of the world.
Manara et al. [11] reported negative AOD trends for a set of grid points over Italy based on MERRA-2 data in the 1981–2017 period. However, Italy is one of the countries of the European Union that suffers the greatest health impact due to aerosols, with more than 60,000 premature deaths in 2015 related to PM2.5 [12]. Bocchi et al. [13] reported the oxidative stress and genotoxicity of organic and inorganic components of urban aerosol (PM2.5 and PM1) from Bologna (Italy). In the 2003–2015 period, sulfate was the major (about 50% of total AOD) aerosol component over the three most populated cities in Italy (i.e., Rome, Milan, and Naples), followed by mineral dust from the Sahara Desert [14]. Considering AOD speciation in urban areas located in one of the largest dust-source regions, the Arabian Peninsula, a MERRA-2 model showed mineral dust to be the largest contributor (up to 70%) to total AOD, followed by sulfate (up to 30%) over an 11-year period [15].
The aim of this work was to apply a recent methodology established by Provençal et al. [14] that utilized the first version of the NASA’s MERRA offline aerosol reanalysis (MERRAero) to study air quality issues around the world. This methodology may be considered a very useful tool for its global and constant coverage and its distinction of aerosol speciation expressed in the form of AOD. For this purpose, we extended the investigated period and used the updated version of MERRA-2. In the context of the present work, the CAMS reanalysis was not considered because our analysis covered the 1987–2017 period.
As evidenced by Provençal et al. [14], air quality on the European continent has significantly improved over the last decades, with reductions in anthropogenic emissions leading to negative AOD trends over several aged-background sites [16]. To verify this context, AOD trends were evaluated over a 30-year period in five of the most populated cities in Italy (Milan, Rome, Cagliari, Taranto, and Palermo). These cities were selected considering two main source parameters of aerosol pollution in urban environments: (i) the presence of industries in the metropolitan area, and (ii) road traffic. Milan and Taranto are two of the most important industrial sites of Europe, while Rome experiences deep, congested traffic every day. Finally, Palermo and Cagliari, being relatively close to the Sahara Desert, were chosen to verify whether there was a common dust signature on their urban aerosol load.

2. Methods and Data

2.1. MERRA-2 Model

MERRA-2 provides data beginning in 1980. MERRA-2 is produced using the Goddard Earth Observing System, version 5 (GEOS-5) atmospheric model and data assimilation system version 5.12.4 [4,17]. Additional advances in both the GEOS data assimilation system and the Grid-point Statistical Interpolation (GSI) assimilation system [18] are included in MERRA-2. The GSI uses an incremental analysis update procedure every 6 h [19]. The spatial resolution remains about the same (about 50 km in the latitudinal direction) as in MERRA. The GEOS-5 model resolution on the native cubed-sphere grid is roughly 50 km, with 72 hybrid-eta layers from the surface to 0.01 hPa [20]. Along with the enhancements of the meteorological assimilation, MERRA-2 takes some significant steps towards the Earth system reanalysis currently under development at GMAO. MERRA-2 is the foremost long-term global reanalysis that assimilates space-based observations of aerosols and represents their interactions with other physical processes in the climate system [6].

2.2. MERRA-2 Aerosol Reanalysis

Reanalyses attempt to take advantage of the best features of both models and observations to produce a four-dimensional, gridded output that optimally combines the continuity of a model with real-world observations that may be sparse and/or irregularly spaced both spatially and temporally. The aerosol data assimilation consists of an analysis-splitting technique used to assimilate AOD at 550 nm considering the following sources [3]: (i) reflectances from the Advanced Very-High-Resolution Radiometer (AVHRR) sensor (1979–2002); (ii) reflectances from the MODIS on Terra (2000–present) and Aqua (2002–present); (iii) AOD retrievals from MISR (2000–2014); and (iv) AOD measurements from AERONET (1999–2014).
The MODIS instrument has 36 channels spanning the spectral range from 0.41 to 15 μm and a 2330 km screening swath, providing a daily global coverage on a 1 × 1 grid [9]. The MISR instrument employs nine discrete cameras spanning (0, 70.5) degrees in both forward and backward directions. Each camera has four retrieval wavelengths, with the 555 nm one utilized for AOD calculations. MISR provides global coverage data every 9 days [9].
AERONET is a global grid of sun photometers currently led by NASA and the French National Centre for Scientific Research. It includes a large number of worldwide Cimel sun photometers, processed according to the same aerosol retrieval procedures [21] and made available in almost real time through the NASA web-portal [22]. The main quantity measured by sun photometers is the AOD, which represents the integral over altitude of the aerosol extinction coefficient (units of length−1).

2.3. GOCART Aerosol Module

Natural and anthropogenic aerosols are simulated in MERRA-2 considering the GOCART model [5,23]. The GOCART model simulates the sources, sinks, and chemistry of mixed aerosol tracers: dust (DU, five noninteracting size bins), SS (five noninteracting size bins), hydrophobic and hydrophilic BC and OC (four bulk tracers), and SO4 (one bulk tracer), as depicted in Table 1.
Emissions of natural aerosol (dust and sea salt) are wind-speed-dependent for each size bin, as described by Marticorena and Bergametti [24] and Gong [25]. The emission strength of sea salt is further modulated considering the sea-surface temperature correction introduced by Jaeglé et al. [26]. Sulfate and carbonaceous aerosol emissions derive from both natural and anthropogenic sources. Primary sulfate and carbonaceous aerosol species are emitted principally from fossil fuel combustion, biomass burning (Reanalysis of the tropospheric chemical composition version 2; RETROv2; [27]), and biofuel consumption, with additional biogenic sources of organic carbon [28]. Secondary sources of sulfate include chemical oxidation of sulfur dioxide gas (SO2; Global Fire Emissions Database version 3 (GFEDv3.1)) and dimethyl sulfide [29]. GOCART also includes a database of volcanic SO2 emissions and injection heights from the AeroCom Phase II project [30,31], covering eruptive and degassing volcanoes on each day for the period 1979–2010. Anthropogenic aerosol sources are emitted into the lowest model layer. Energy-sector emissions of SO2 (Emission Database for Global Atmospheric Research version 4.2; EDGARv4.2; [32]) are emitted between 100 and 500 m above the surface [33].
Loss processes for all aerosol species have been described considering dry deposition and gravitational settling, plus large-scale wet removal and convective scavenging. It is important to point out that the aerosol wet deposition induced by precipitation depends on the MERRA-2-corrected precipitation product [34]. This last has been modified to better match the diurnal precipitation changes with the observations.
Numerous studies [23,35,36,37] have demonstrated the success of the GOCART aerosol module in simulating AOD and other observable aerosol properties.

3. Results and Discussion

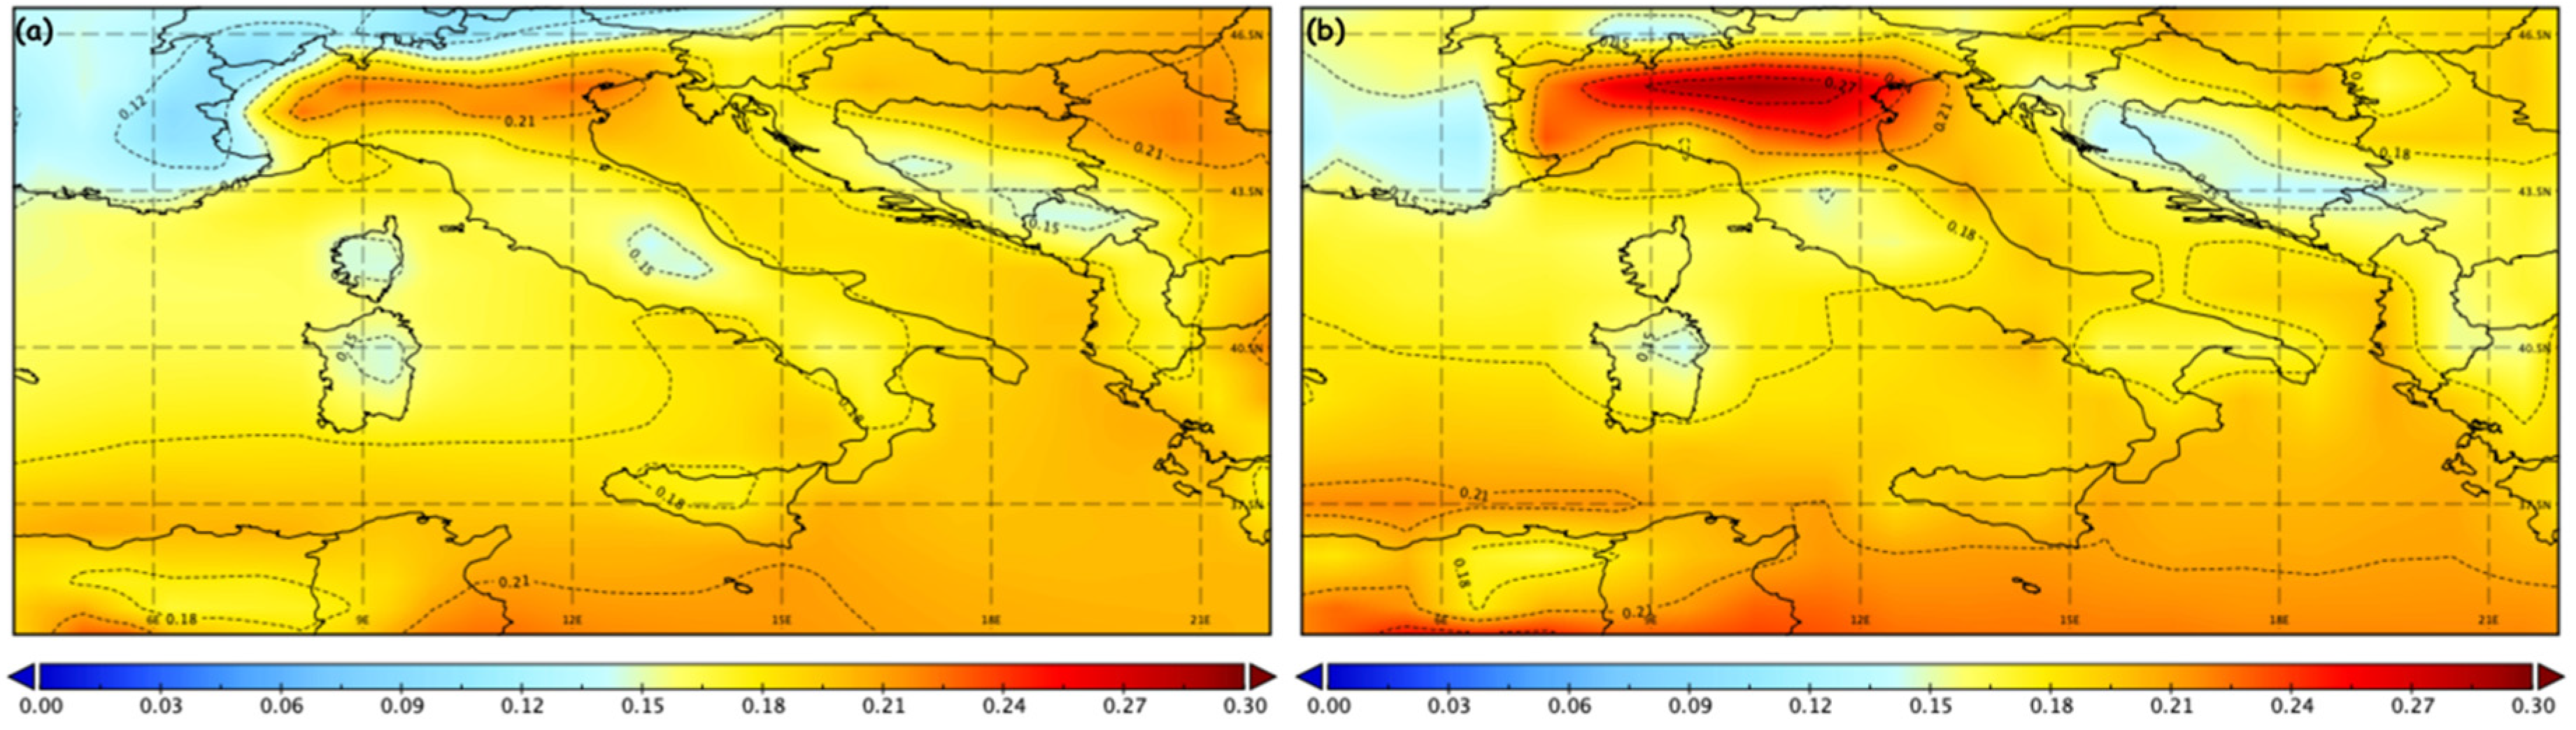
3.1. Spatial AOD Distribution

MERRA-2 includes an aerosol data assimilation system that is described in Randles et al. [20]. The extended temporal coverage and the coupling between the aerosols and atmospheric circulation is a step forward compared to previous EOS-era reanalyses such as MERRAero [33]. The aerosol data assimilation utilizes an analysis-splitting technique and an ensemble method to assimilate AODs from ground-based (AERONET) direct measurements and satellite (AVHRR sensor on the Polar Operational Environmental Satellite, MISR on the Terra satellite, MODIS sensors on the Terra and Aqua satellites) retrievals [3]. It is important to point out that MODIS actually provided the vast majority of the AOD observations assimilated in MERRA-2, especially after 2002 when both Aqua and Terra spacecrafts became operative. The dark target (DT) correction algorithm [38] was utilized for radiances over land and ocean. The time-averaged map of AOD or aerosol optical thickness (AOT) over the Italian peninsula aggregated over the period July 2002–December 2017 is shown in Figure 1.
The MERRA-2 total aerosol extinction AOT at 550 nm, with a spatial resolution of 0.5° × 0.625° (M2TMNXAER) is depicted in Figure 1a. Figure 1b shows the combined DT and deep blue (DB) AOD at 550 nm for land and ocean, with a 1° × 1° resolution, for MODIS-Terra (MOD08_M3, collection 6.1) merged with MODIS-Aqua (MYD08_M3, collection 6.1). The optimal spatial correlations between MERRA-2 reanalysis and MODIS retrievals are evident, especially over the northern part of the domain covering the Padan plain. Being a densely populated and intensively industrialized area, the Padan plain experiences the highest AOD value in Europe [14]. AOD retrievals from MODIS sensors show higher time-aggregated values compared with MERRA-2 reanalysis. This may be due to the fact that MERRA-2 utilizes additional sources of data (MISR, AERONET) in its aerosol data assimilation system.

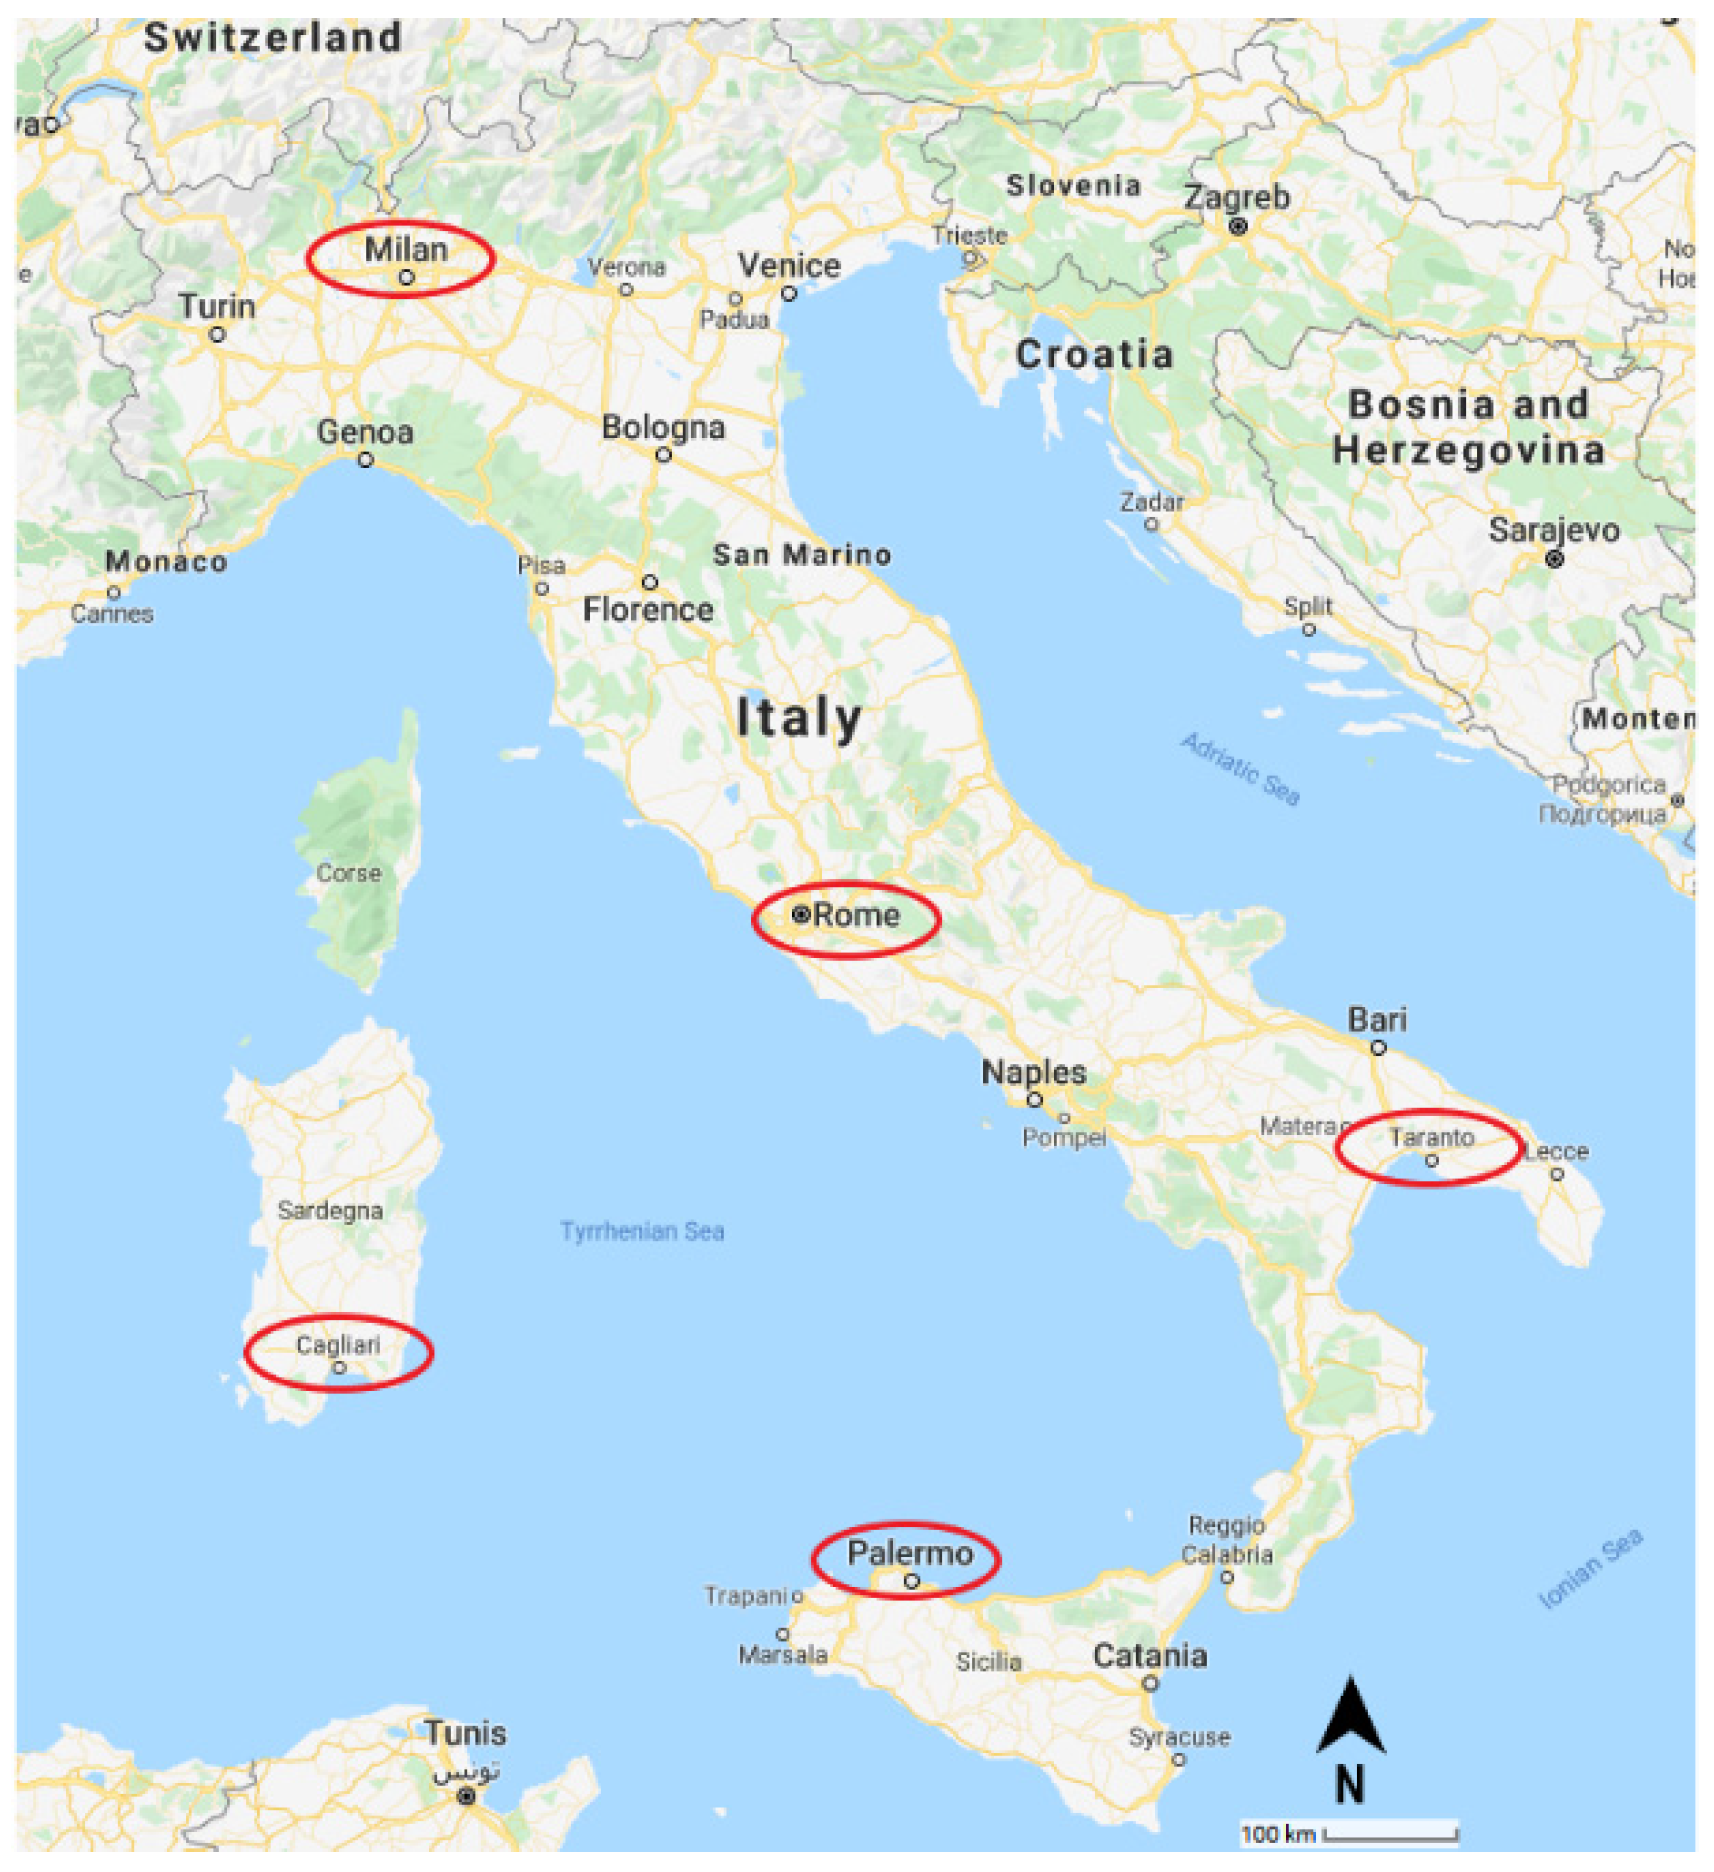
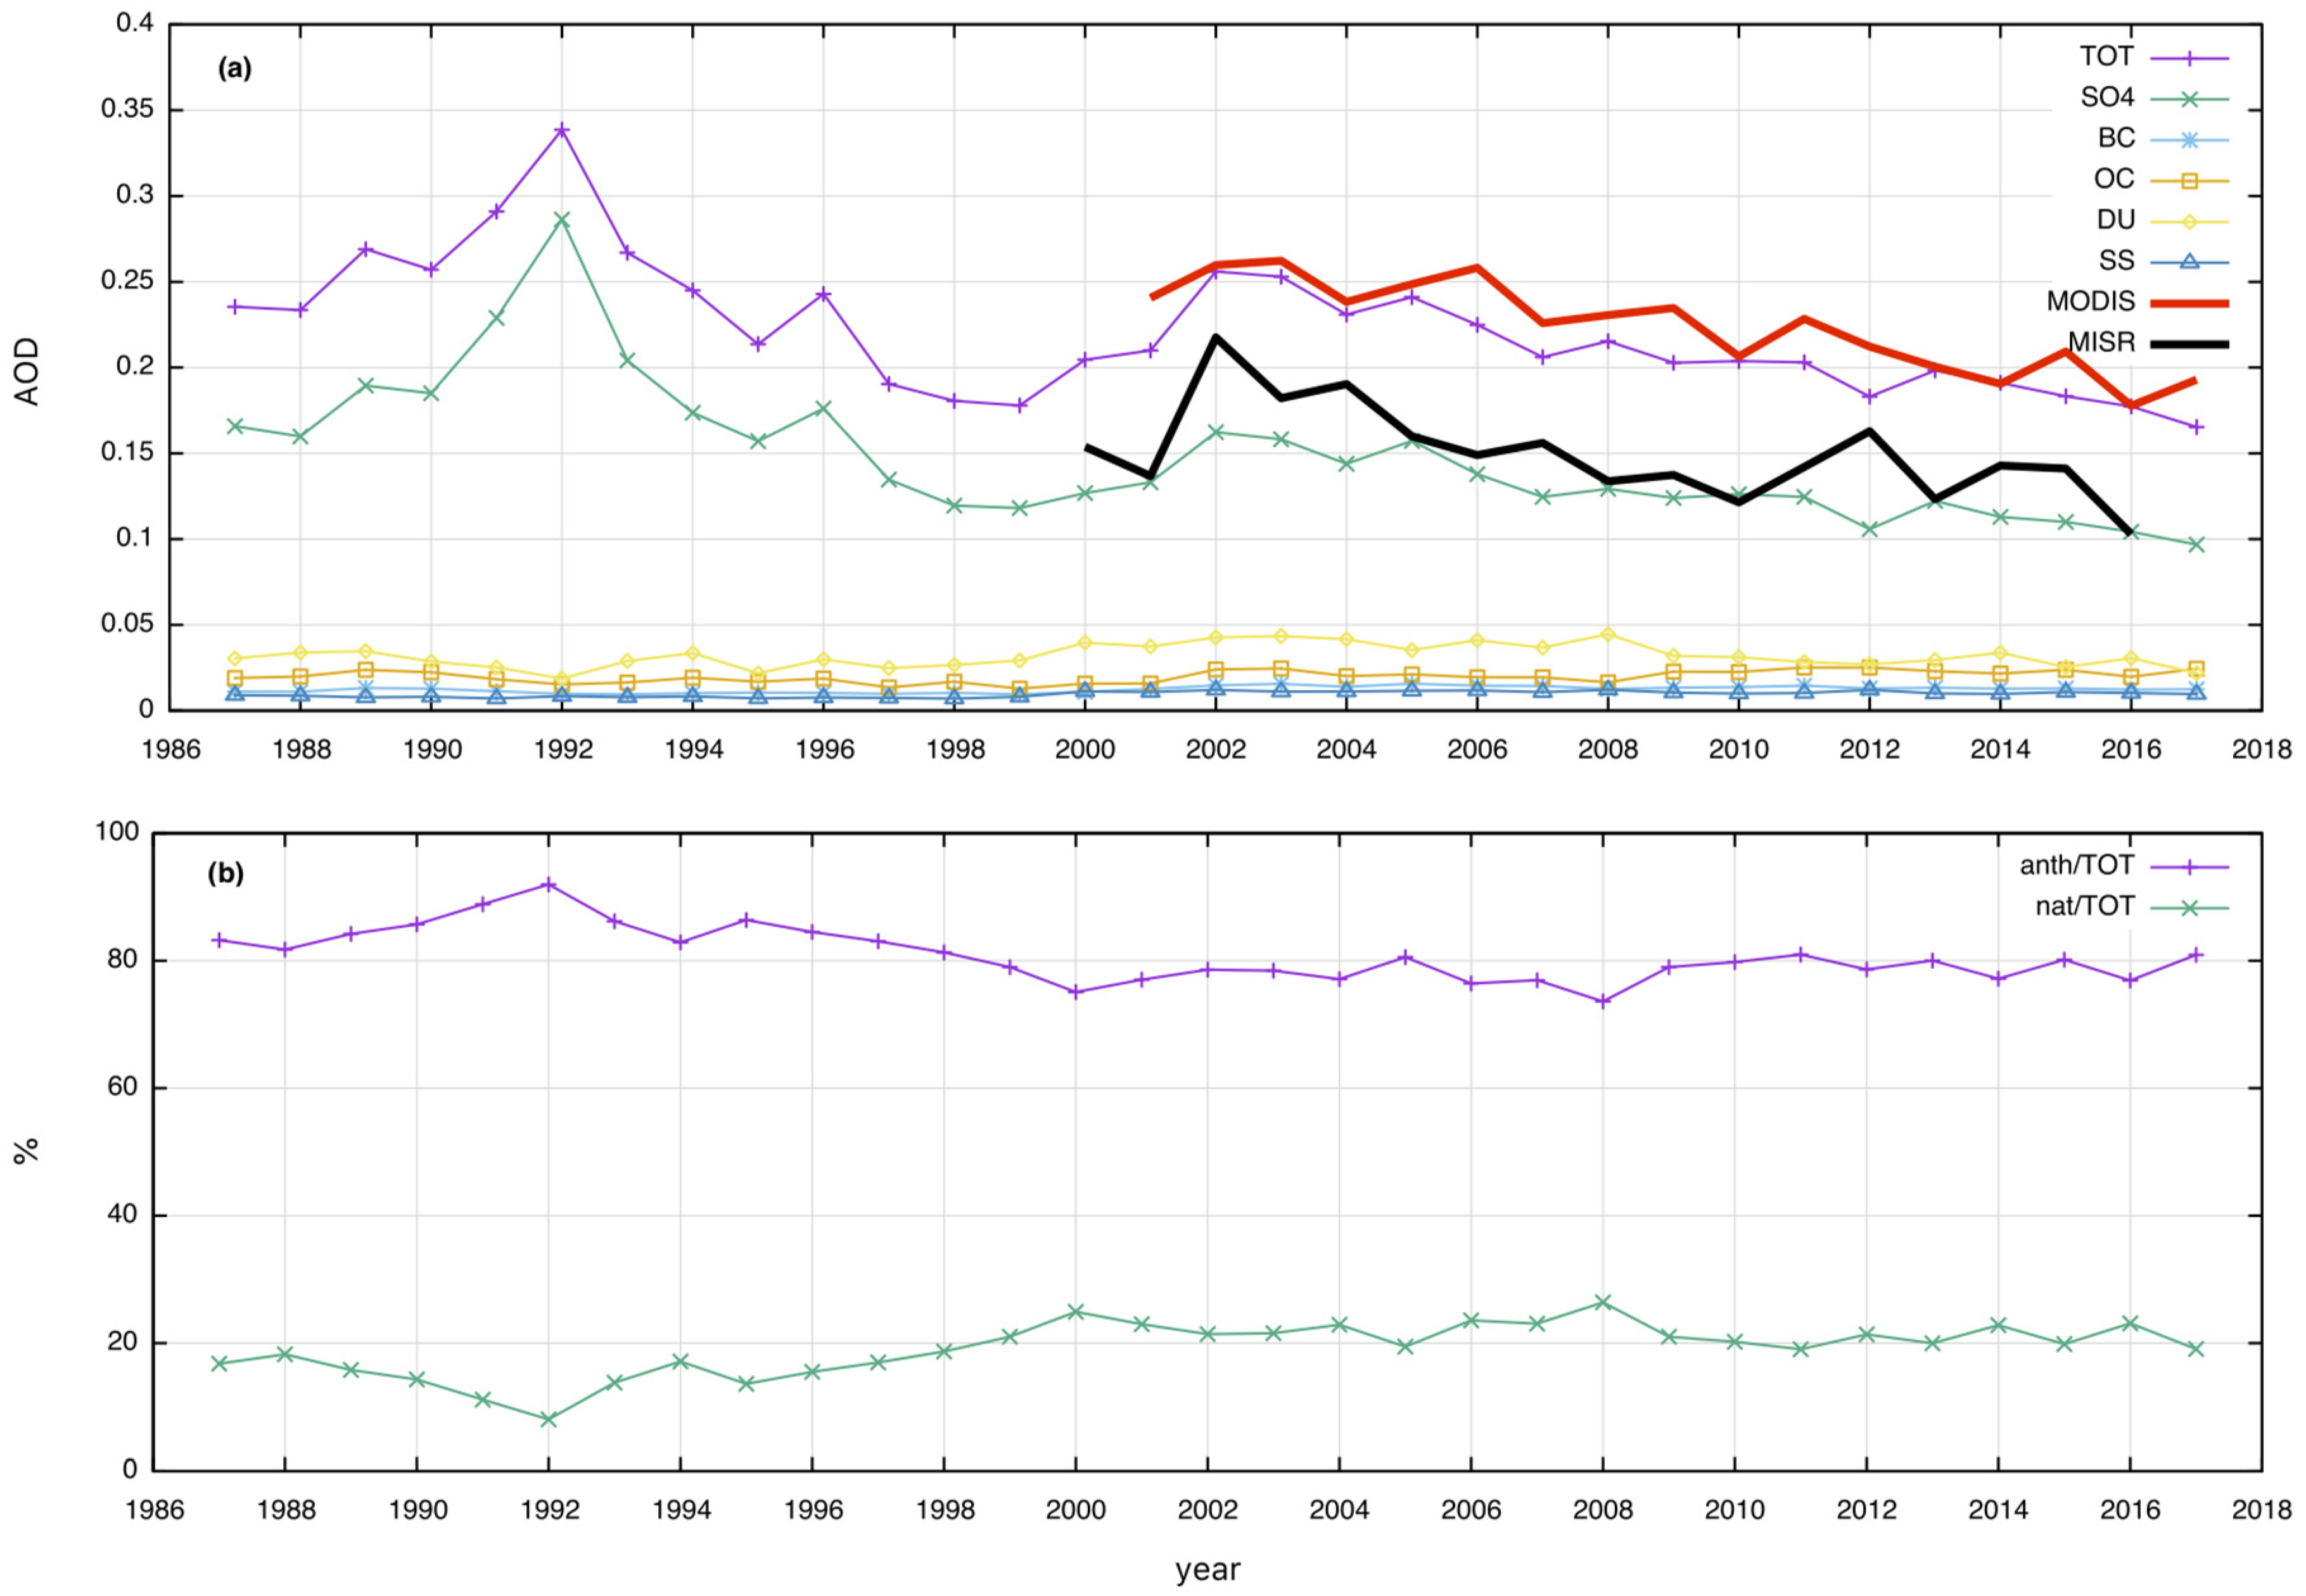
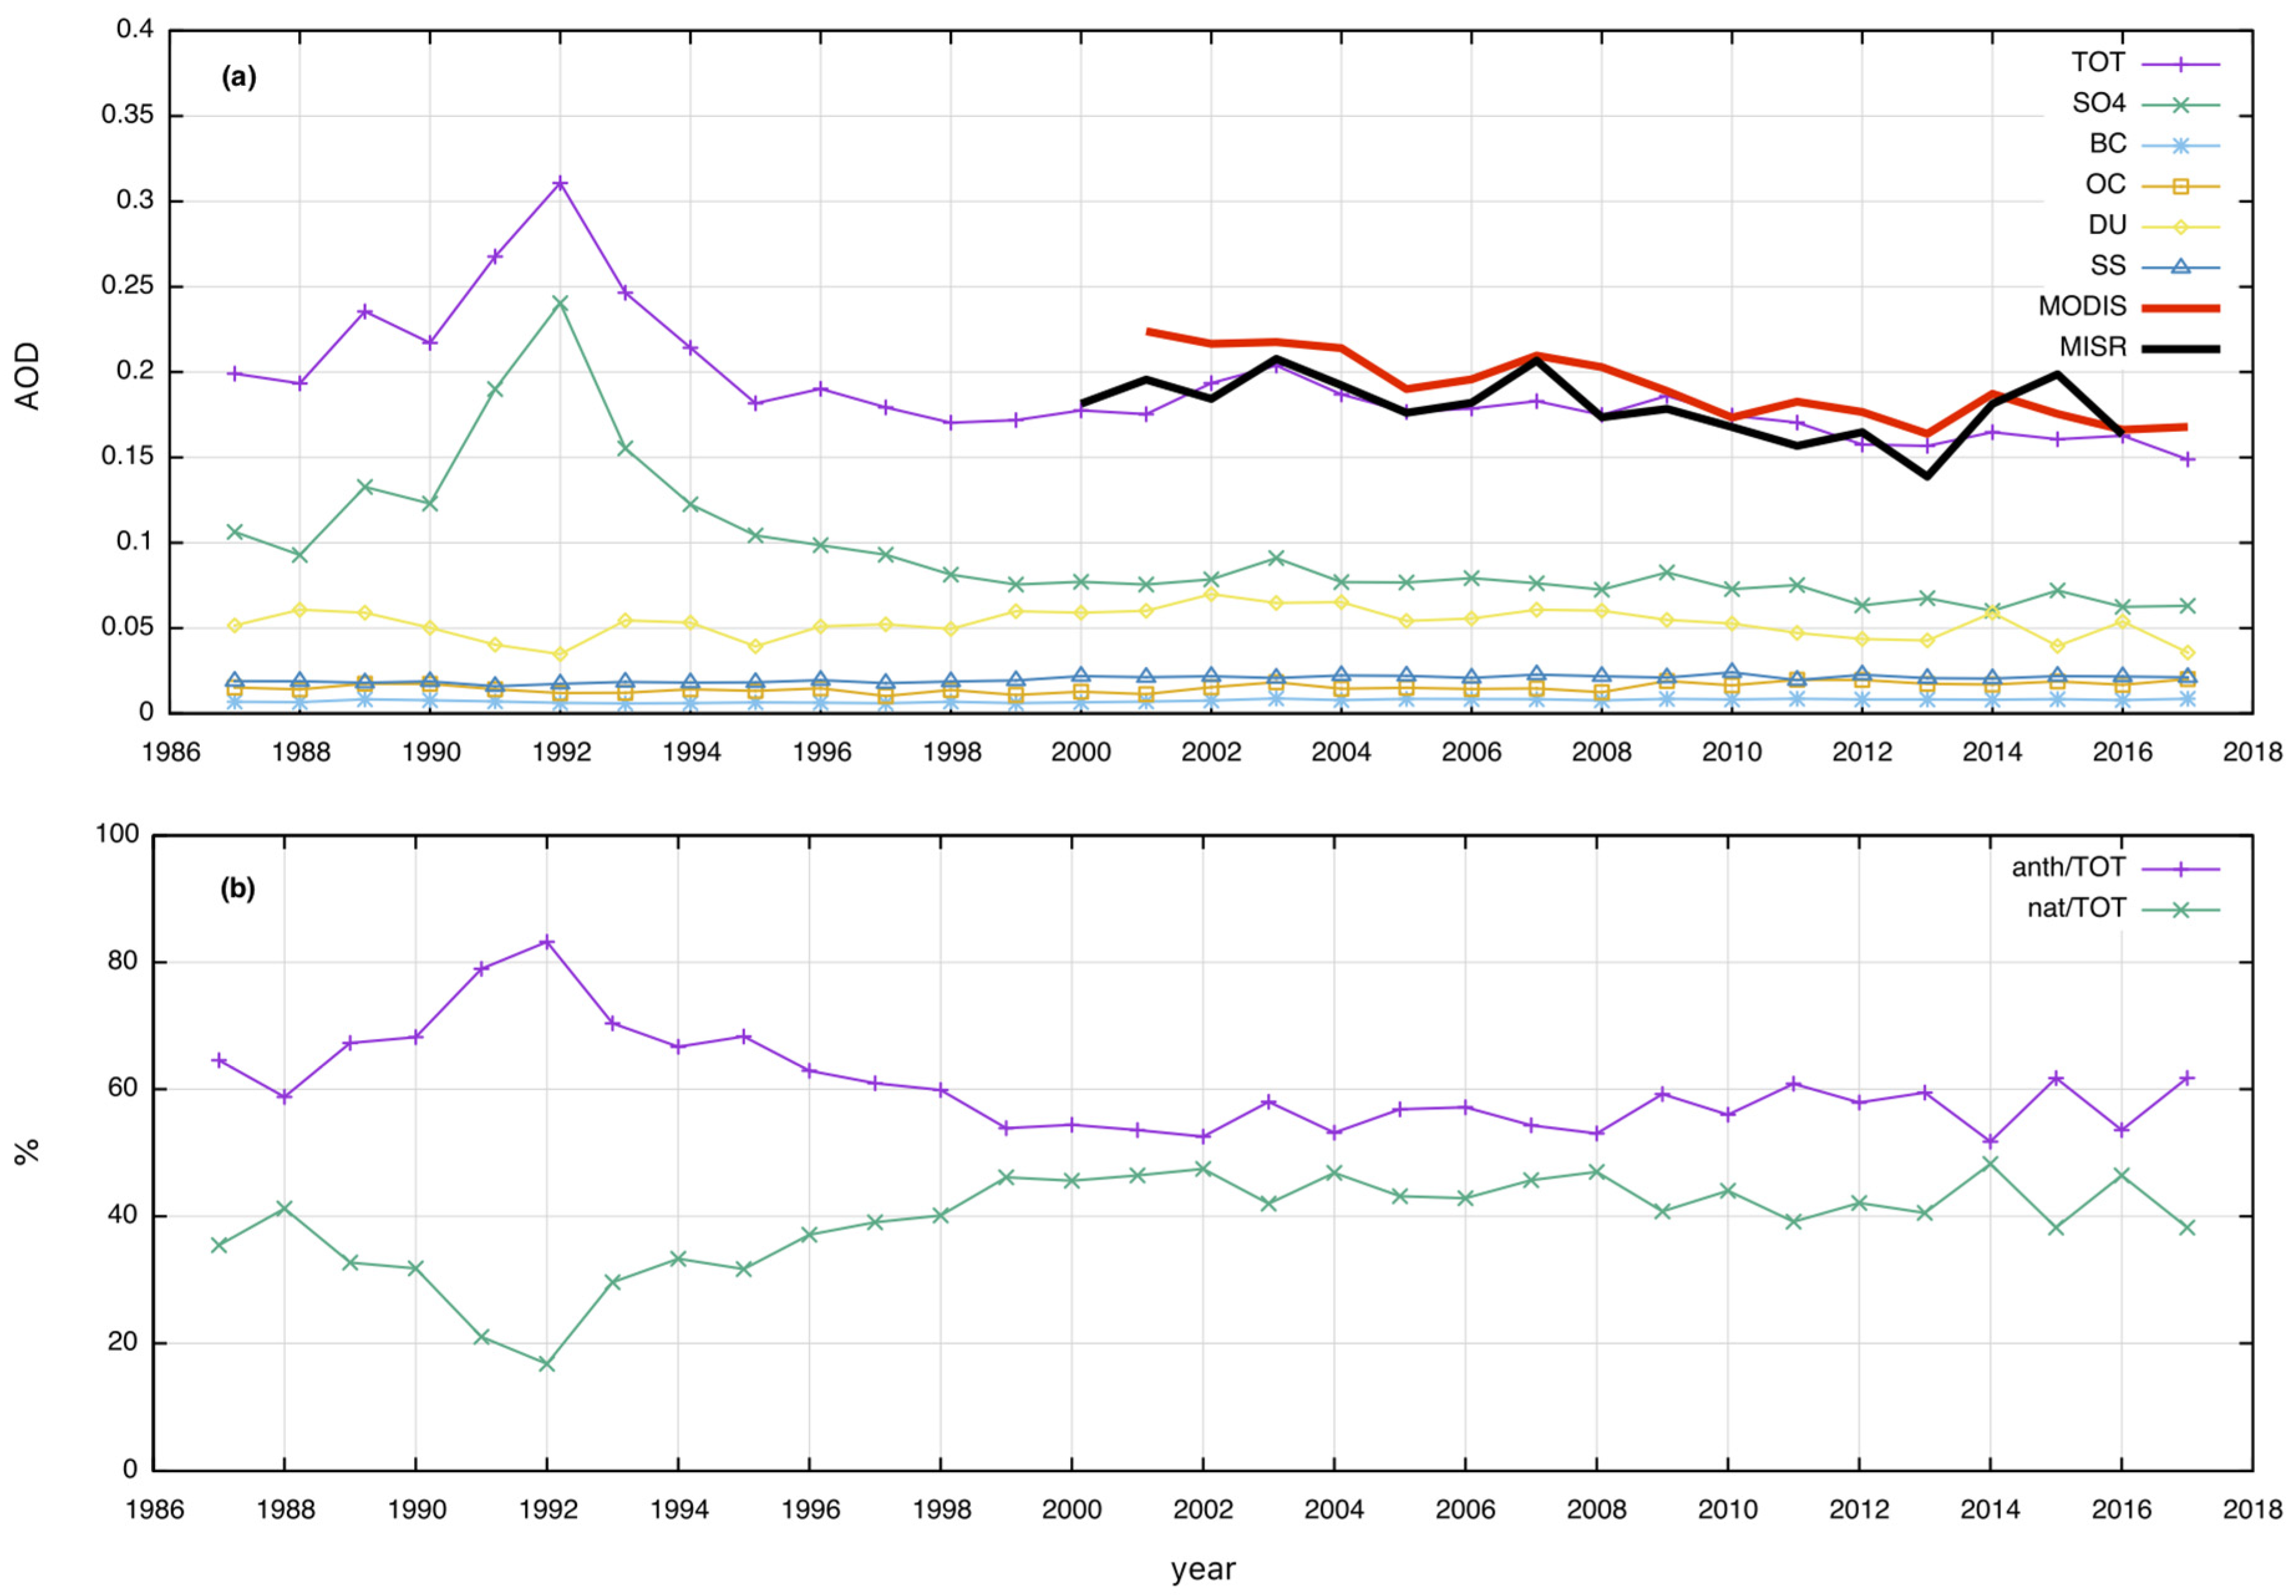
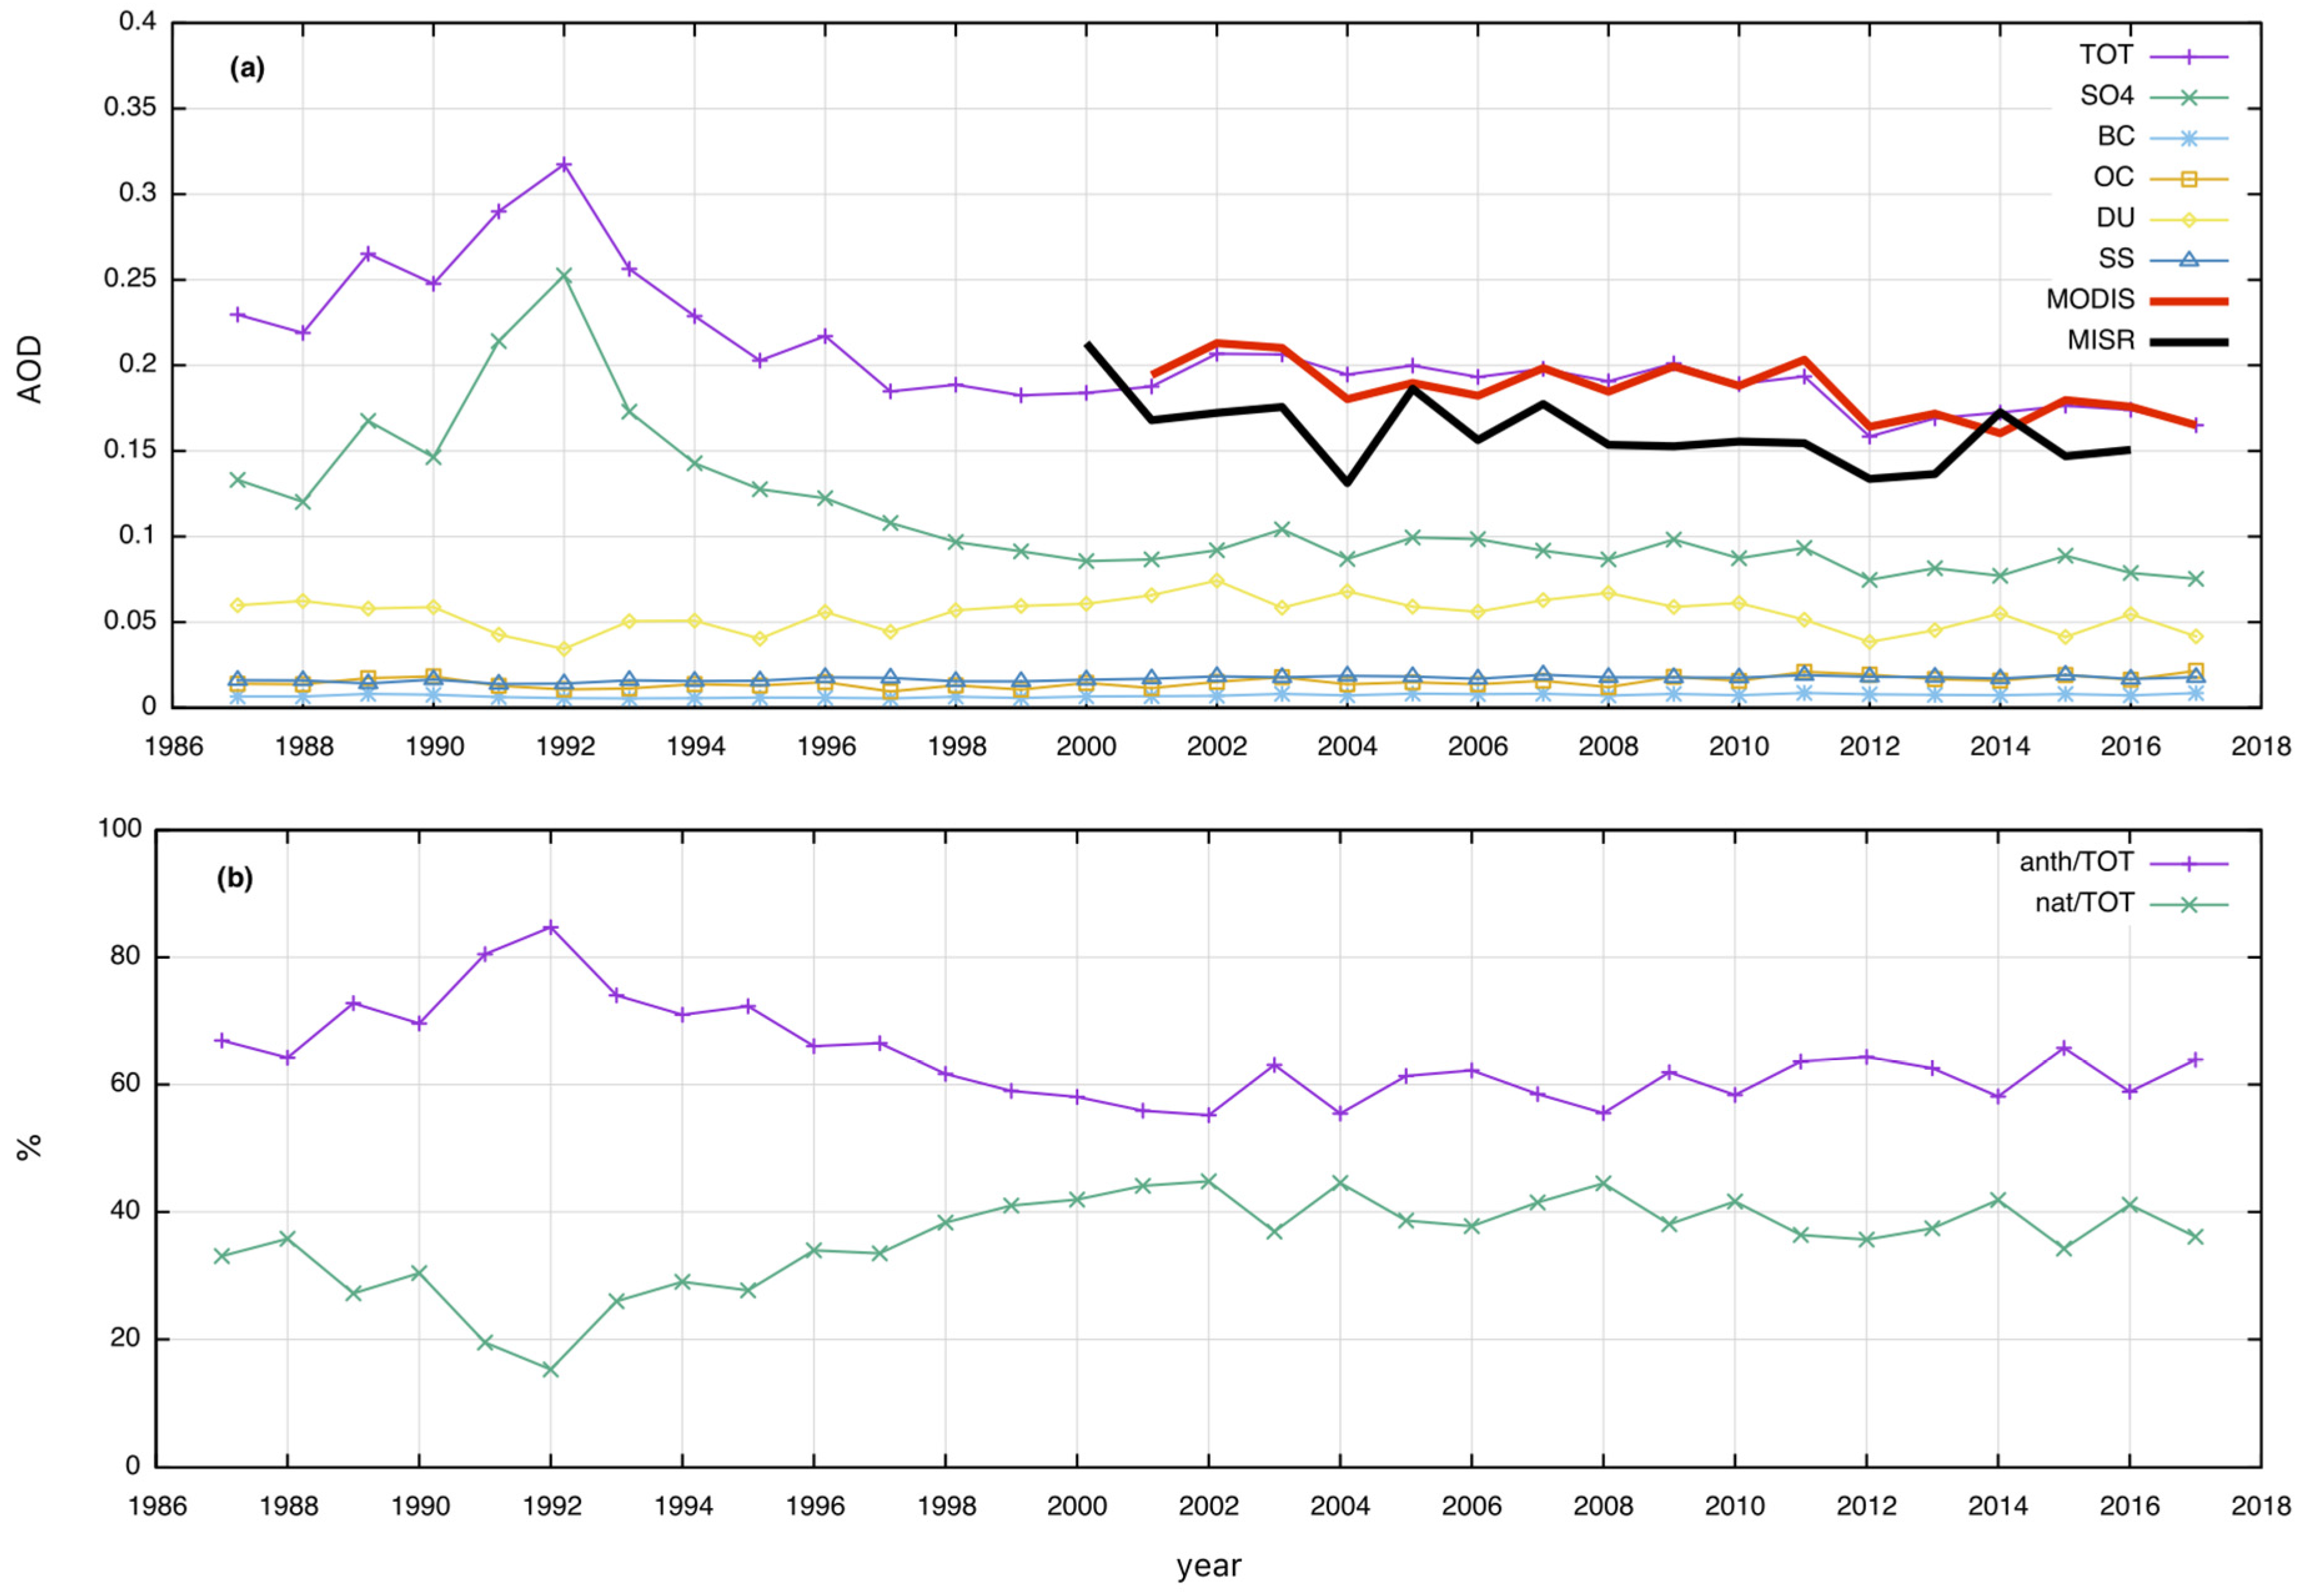
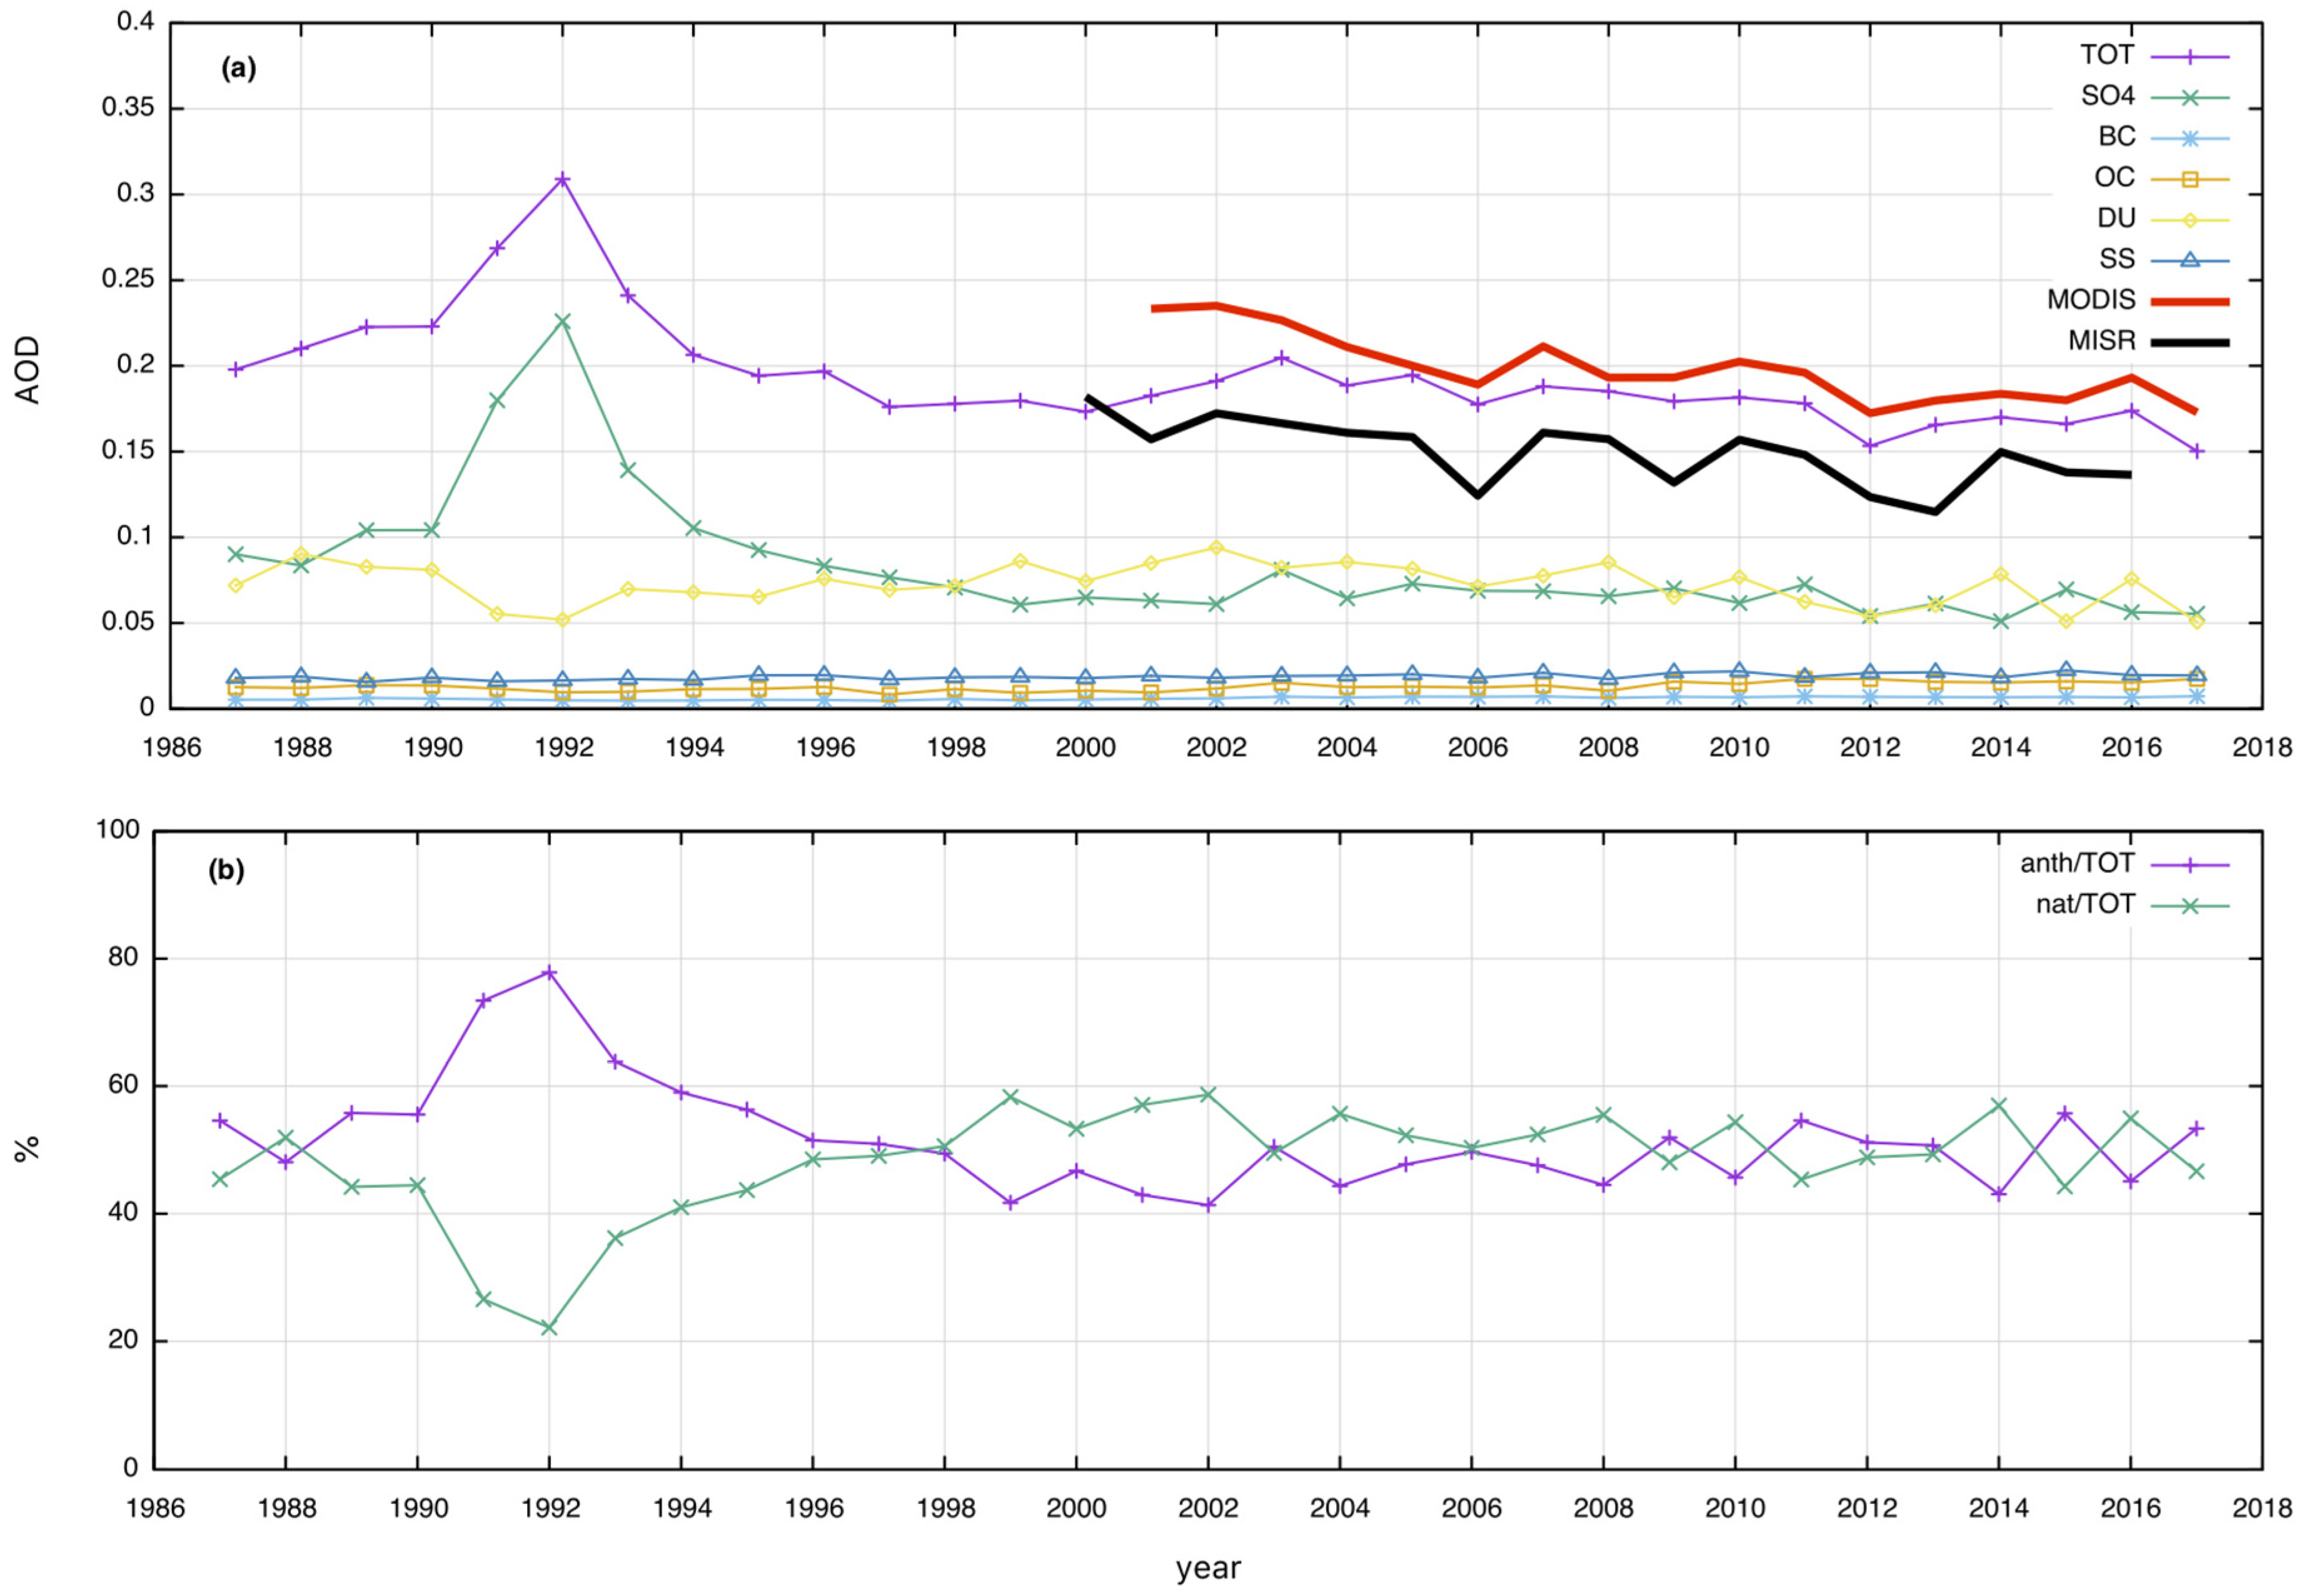
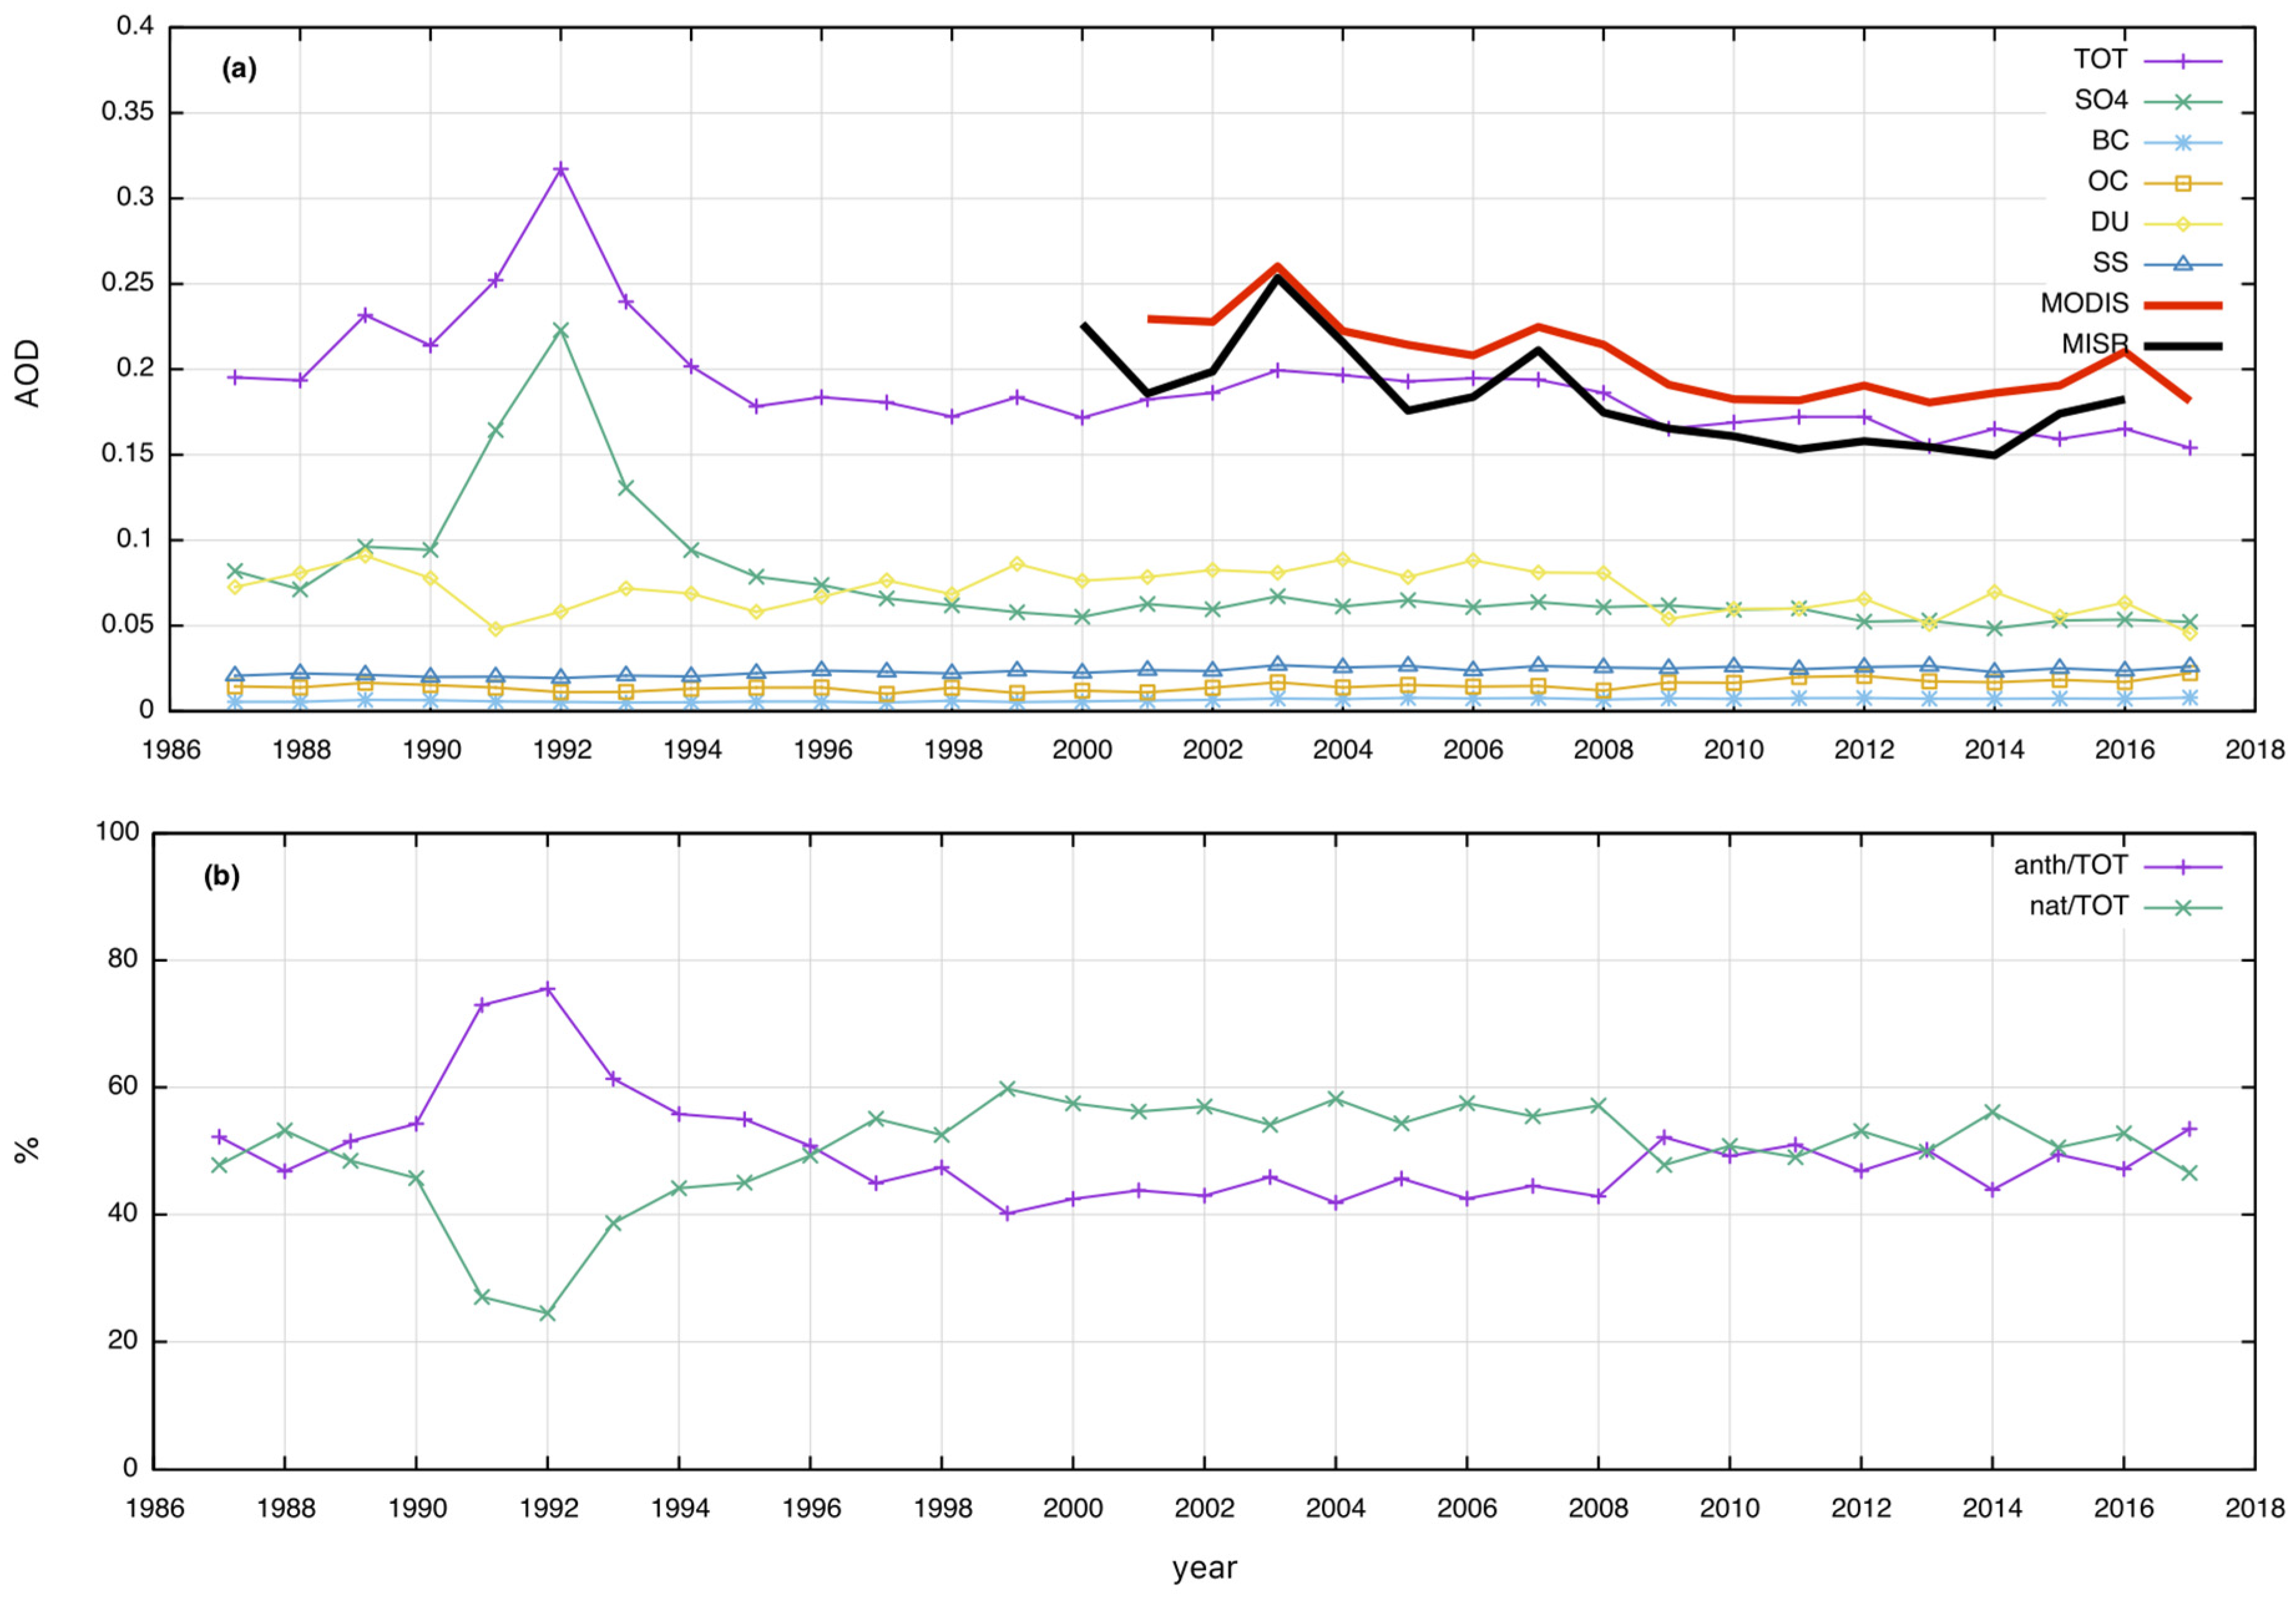
3.2. AOD Time Series in the Selected Cities

The time-aggregated AOD values from the MERRA-2 model were further evaluated in five Italian cities (Figure 2). These cities were selected based on the presence of industries in the metropolitan area and the road traffic. Milan and Taranto are two of the most important industrial sites in Europe, while Rome is subject heavy, congested traffic every day. Finally, Palermo and Cagliari, due to their closeness to Sahara Desert, were chosen to verify whether there was a dust signature in their urban aerosol loads.
The analysis of total AOD time-series started with the city of Milan, as depicted in Figure 3. Figure 3a displays the total AOD from the MERRA-2 model (violet line), together with the speciated AOD for SO4 (green line), BC (light blue line), OC (orange line), DU (yellow line), and SS (blue line). The continuous thick red and black lines refer to the year-aggregated MODIS and MISR retrievals for the period 2001–2017 for MODIS, and 2000–2017 for MISR.
Examining the total AOD from the MERRA-2 data, it is evident that there was a close reproduction of the MODIS data and an overestimation of the MISR retrievals, probably caused by complex surface conditions [39], e.g., closeness of the Alps to the studied area.
The largest contribution of total AOD in Milan metropolitan area derived from SO4, which was considered reasonable due to presence of industries in the region. A decreasing rate of the total AOD was also evident, starting from 2002. The 1992 peak was caused by the Pinatubo eruption, the second-largest volcanic eruption of the century, which dispersed ash plumes all around the globe starting from 15 June 1991.
The AOD splitting between anthropogenic and natural components is shown in Figure 3b. The most remarkable evidence was the predominant anthropogenic contribution to the total AOD, which was around 80% of the total. This AOD strong signature for the city of Milan is due to the extremely high density of industrial sites in the largest (more than 7.4 million inhabitants) metropolitan area in Italy.
The next city analyzed was Rome, capital of Italy, with more than 4.3 million habitants in the metropolitan area. Due to the presence of ministries, there is heavy, congested traffic on its roads every day.
As shown in Figure 4a, it was evident that the total AOD from the MERRA-2 model was optimally matched with the retrievals from the MODIS and MISR sensors. Another point of note was the contribution of SO4 to the total AOD, which was comparable to the contribution from mineral dust (i.e., DU). Figure 4b shows that the anthropogenic and natural contributions to the total AOD oscillated around 60% and 40%, respectively. MERRA-2 reanalysis showed a gradual decreasing AOD trend starting from 2002. The city of Rome showed a different AOD signature to the one observed in Milan, with a smaller SO4 contribution to the AOD.
Figure 5 shows the total AOD for the city of Taranto. Several emissions-intensive activities (e.g., steel production, cement production, oil refining, and port activities) operate in Taranto, resulting in adverse environmental [40] and health [41] impacts.
Analyzing the total AOD displayed in Figure 5a, it was possible to highlight two distinct periods. In the 1997–2011 period, the total AOD remained constant at around 0.20, while in the following six-year period (2012–2017), the AOD decreased to 0.165. Furthermore, the ideal matching of the total AOD from MERRA-2 with the MODIS retrievals was evident, while the MISR sensor showed an underestimation of the total AOD (Figure 5a). The anthropogenic/natural split depicted in Figure 5b revealed more than 60% of anthropogenic contribution to the total AOD.
Finally, the cities of Palermo (Figure 6) and Cagliari (Figure 7) were jointly analyzed because they presented a similar AOD signature.
They were chosen because of their relative proximity to the Sahara Desert, which made it feasible to quantify the relative contribution of desert dust to their total AODs. In particular, Figure 6a and Figure 7a show: (i) a slight decrease of the total AOD for both cities in the 2002–2017 period; (ii) the optimal fitting of the total AOD with both sensors (MODIS, MISR); (iii) the desert dust contribution to the total AOD equaled the SO4 contribution, from which resulted (Figure 6b and Figure 7b) a percentage of 50% for both anthropogenic and natural components.

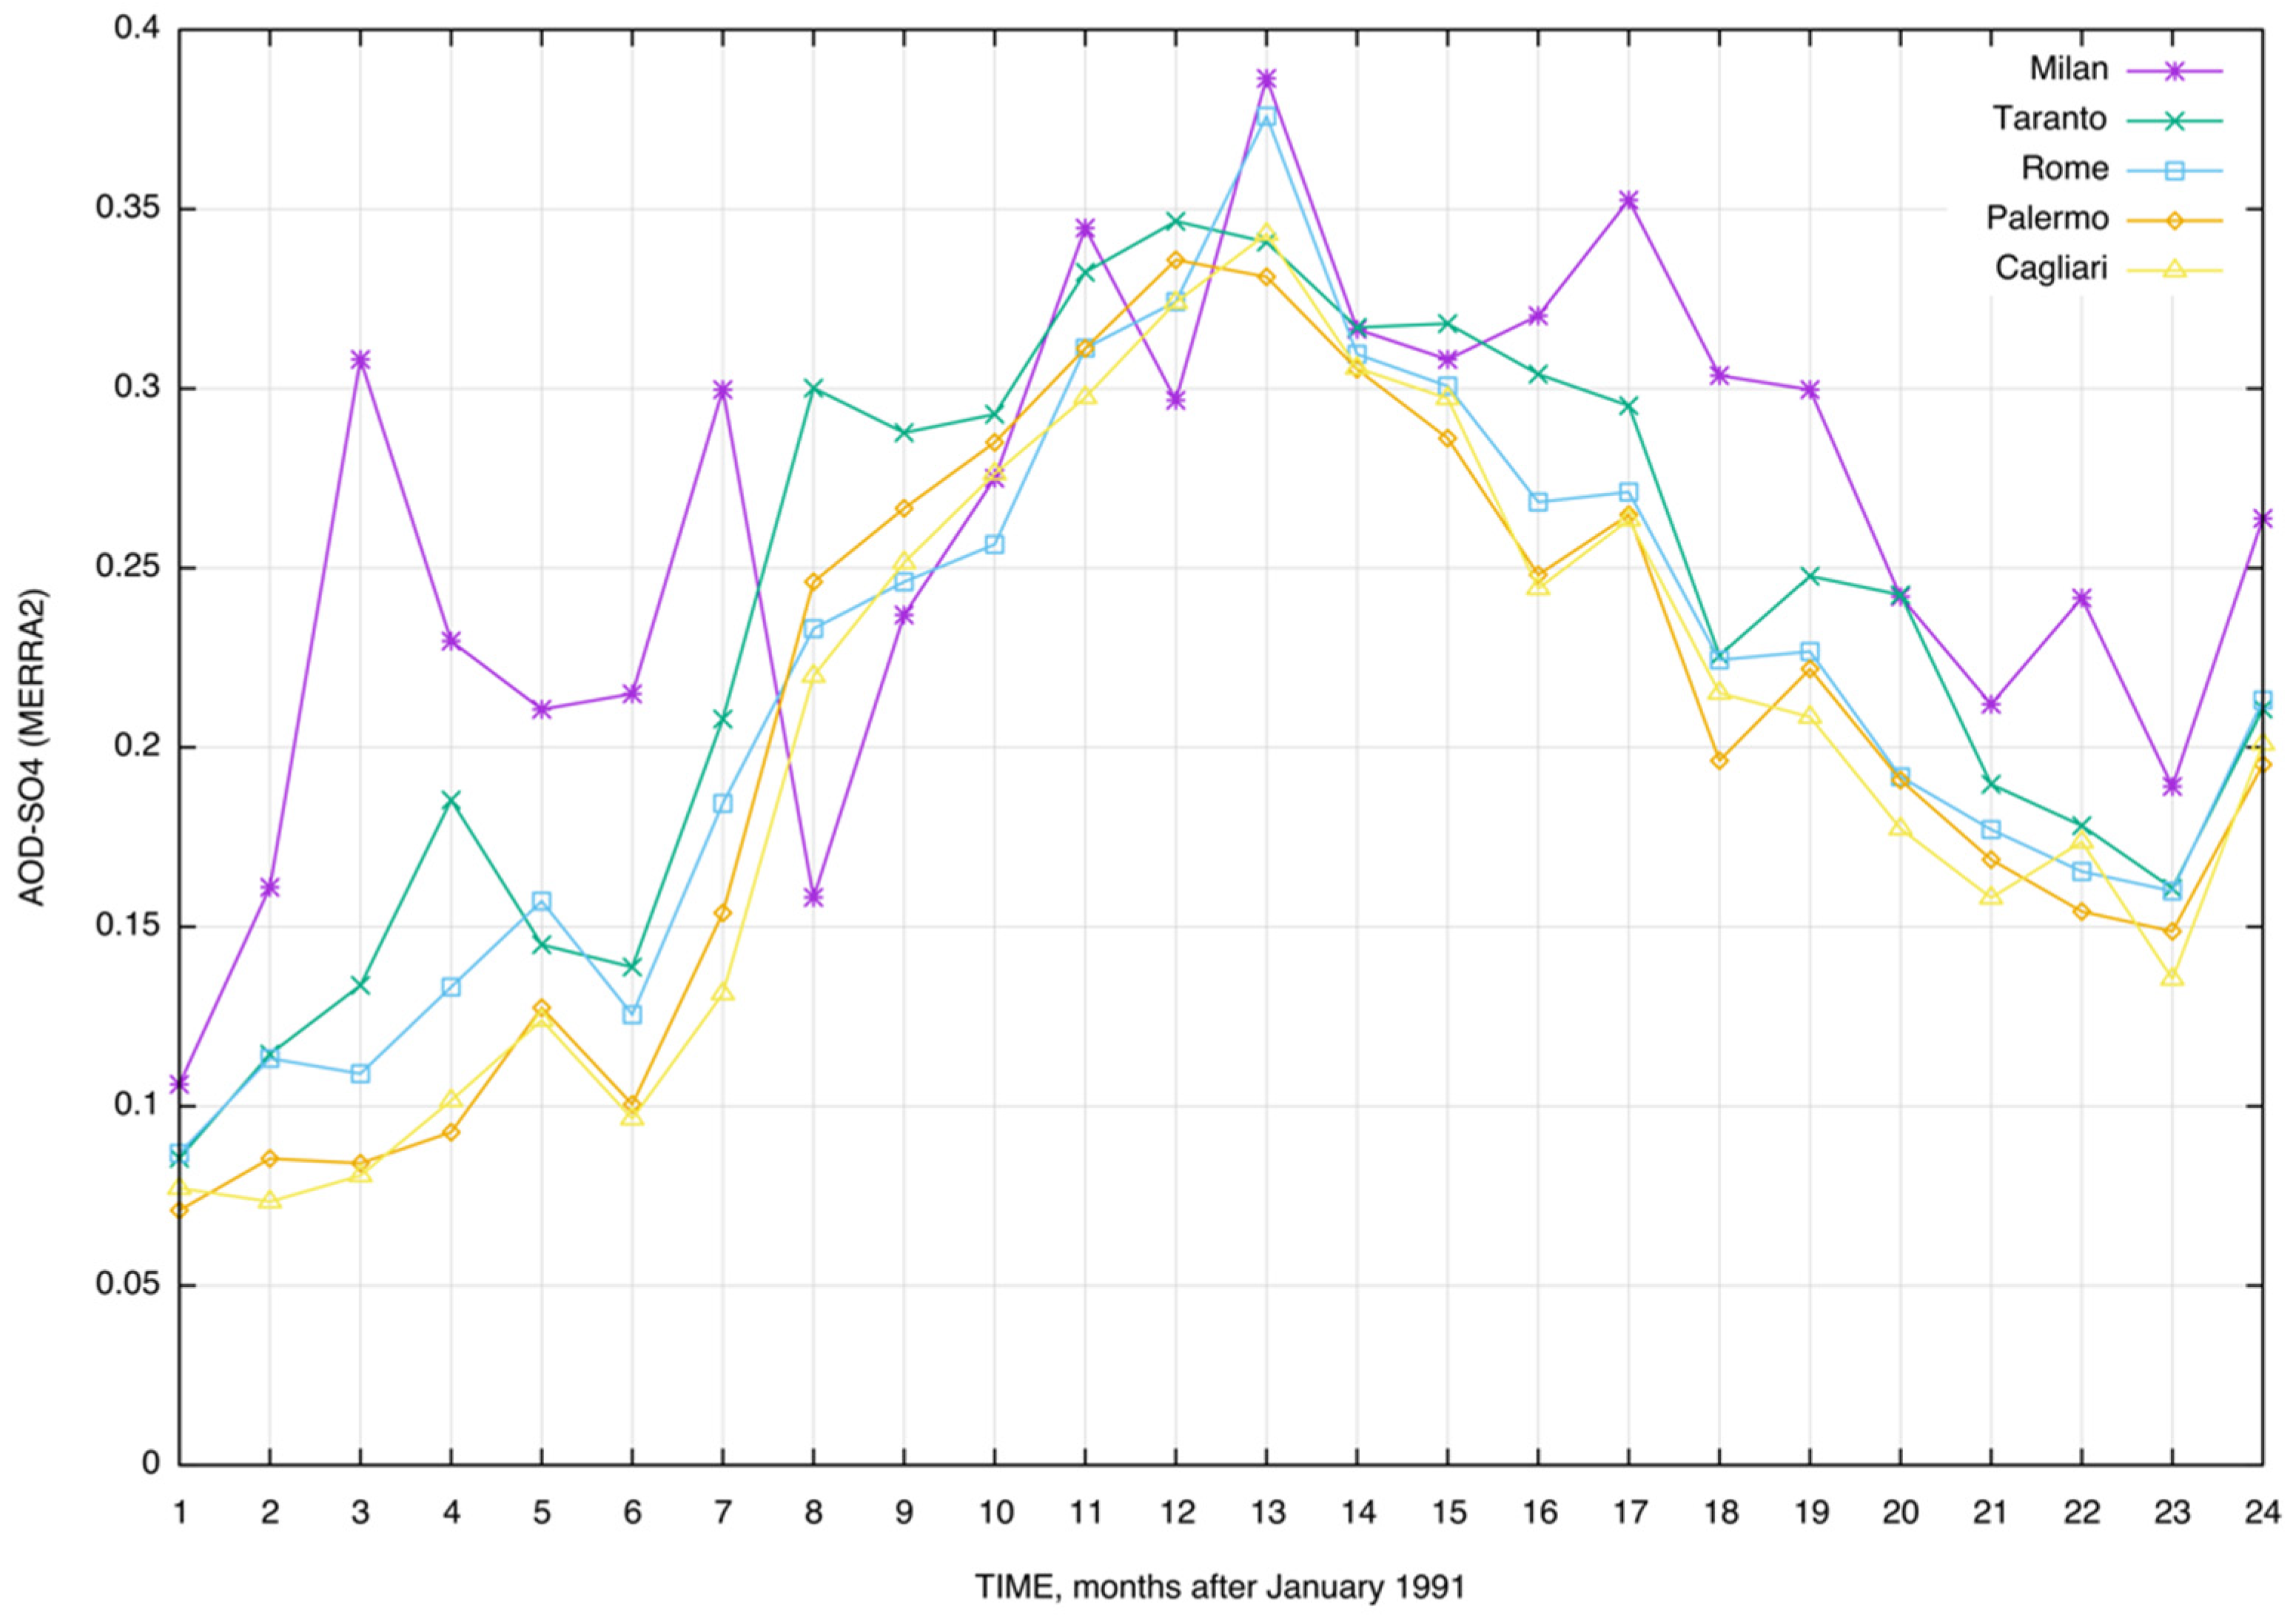
3.3. The Pinatubo Signature
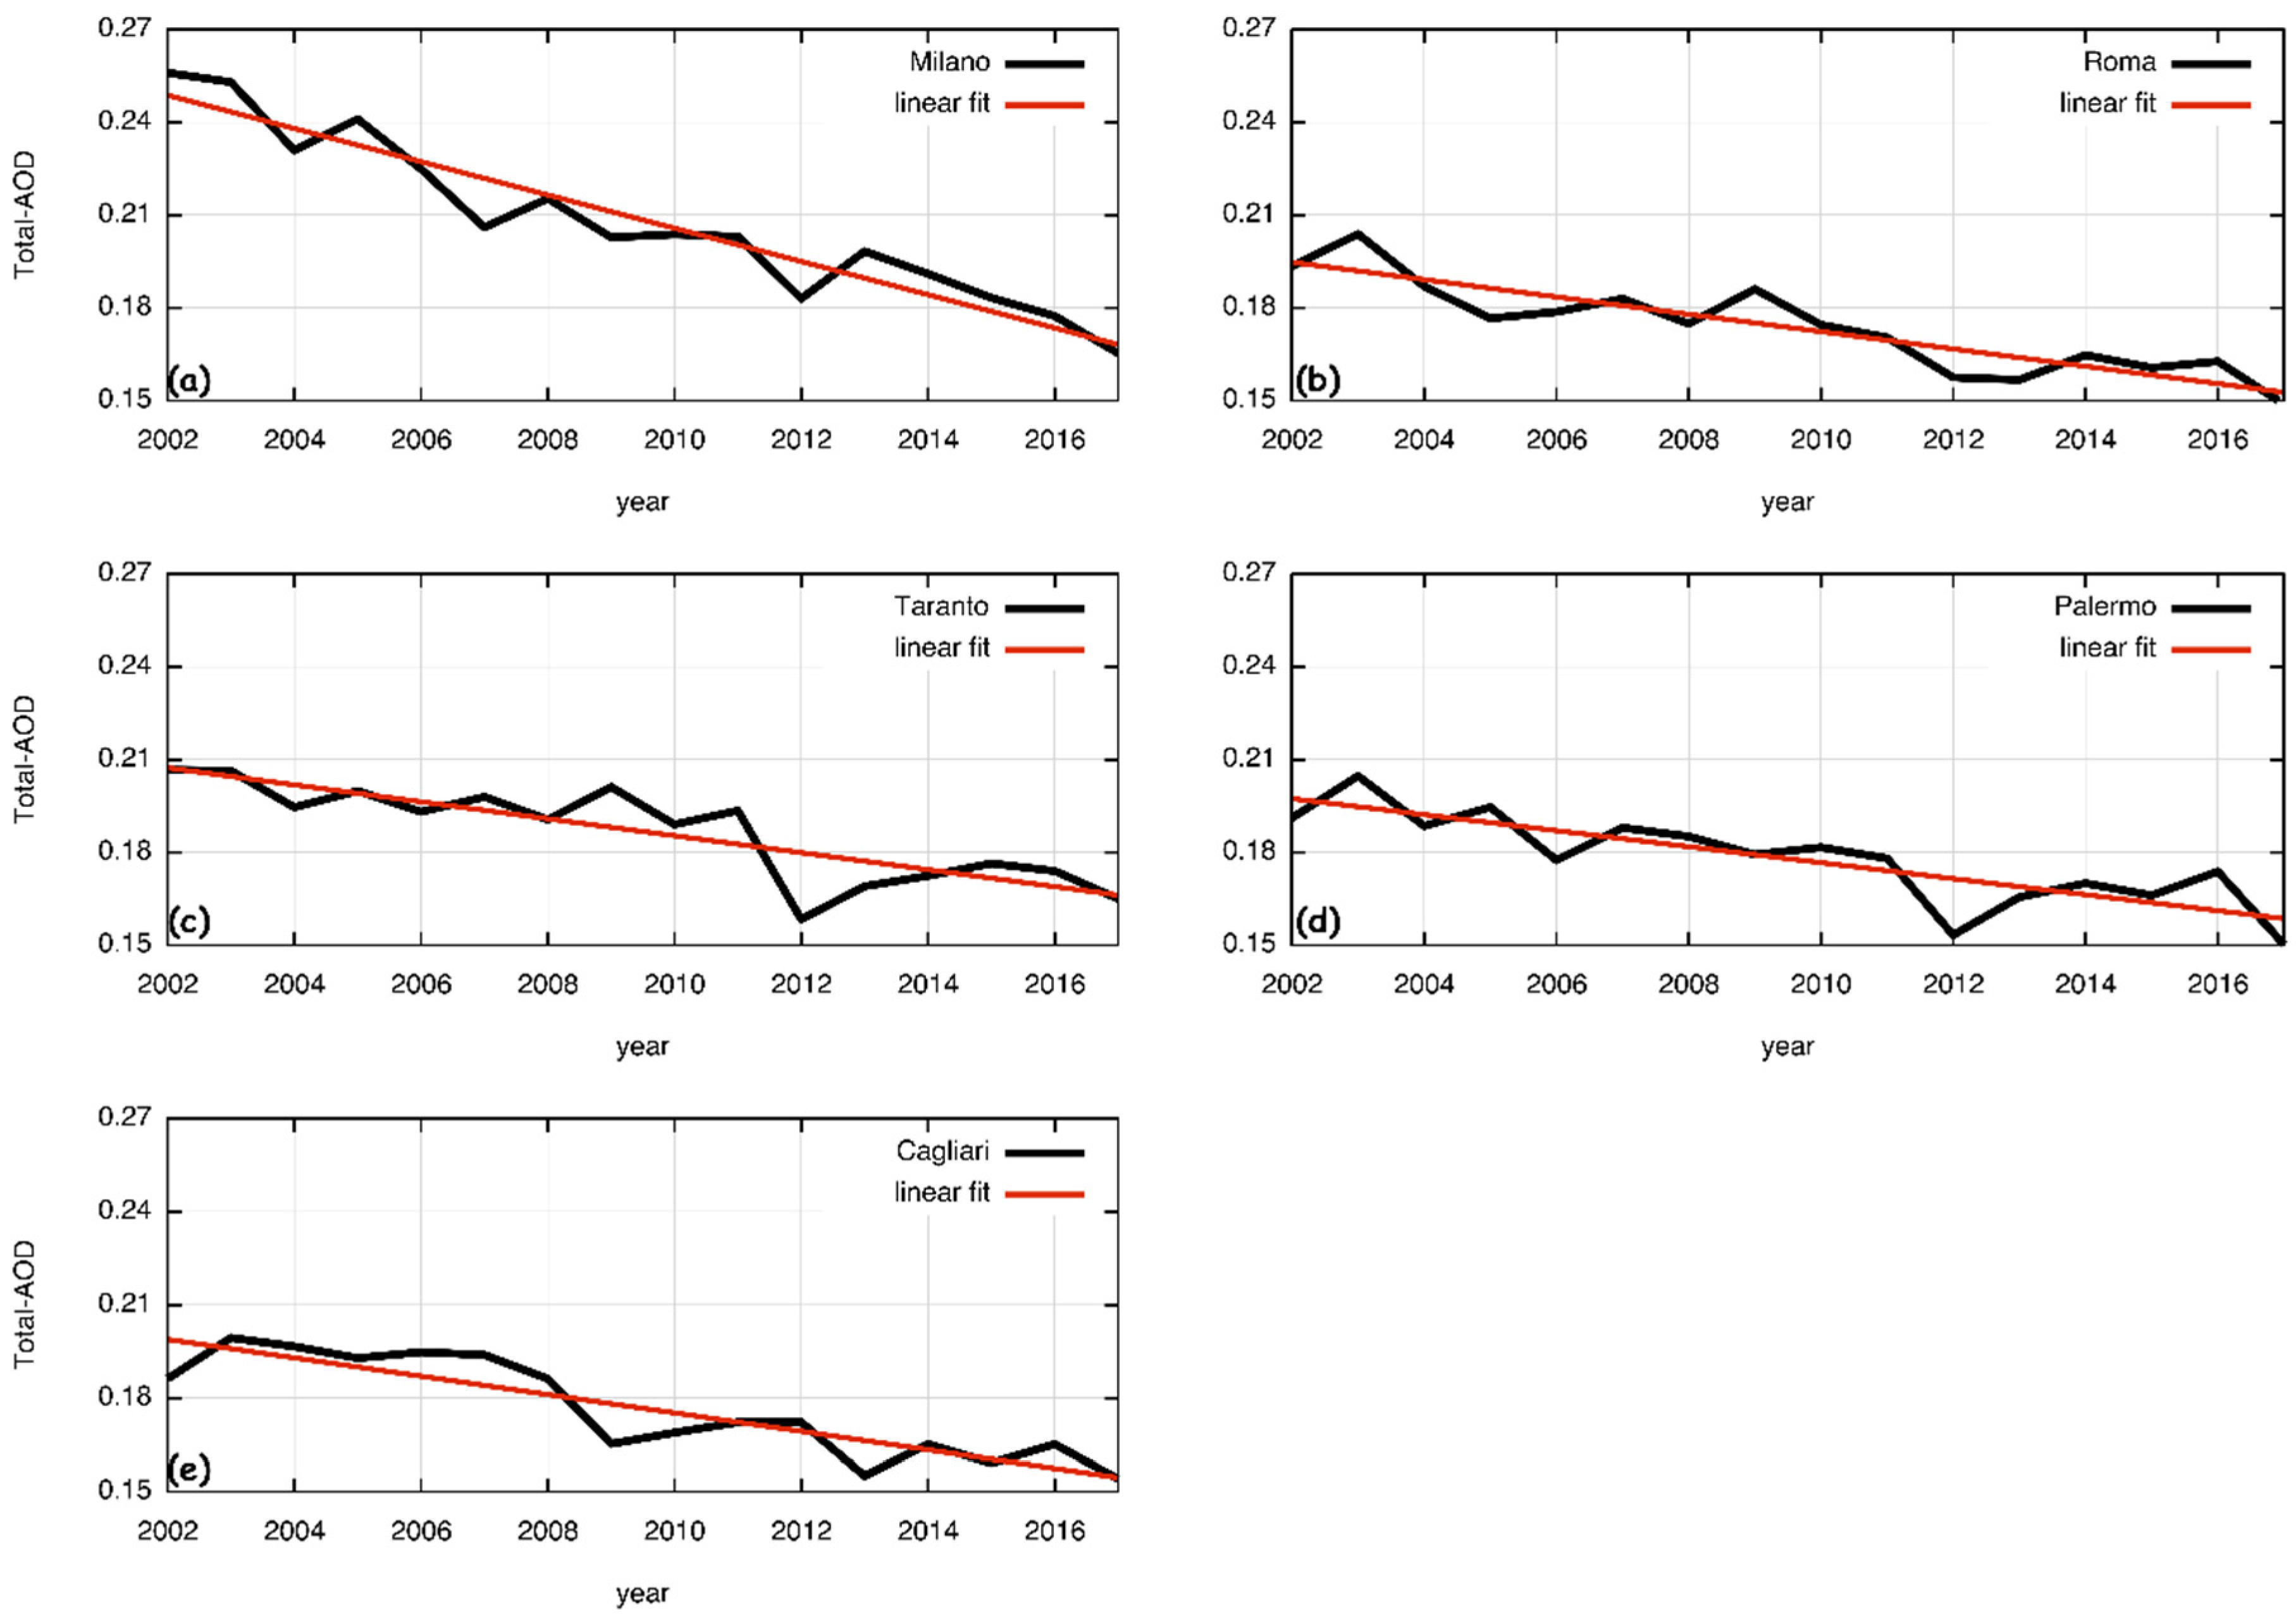
A strong increase in sulfate aerosols and total AOD was observed in 1992 over different regions around the globe (e.g., the Yangtze River Delta in China [42], South and East Asia, the Amazon basin in South America, and northern Africa [3]) due to the 1991 eruption of Mont Pinatubo in the Philippines. This has been considered the second-largest volcanic eruption of the century, which spread volcanic ash aerosols and sulfate all over the globe until the end of 1993 [43], with a clear spike in the stratospheric AOD at 525 nm irrespective of the latitude [16].
As can be seen in Figure 3a and Figure 7a, the total AOD time-series had a peak in 1992 that varied from 0.34 in Milan to 0.31 in Rome and Palermo. Sulfate aerosols had comparably high levels throughout 1991–1993. This represents a clear Pinatubo signature on the AOD caused by the massive eruption in June 1991.
Figure 8 shows the monthly time-series of the MERRA-2 sulfate aerosol for the years 1991 and 1992. A strong increase in AOD-SO4 for all the Italian cities that were considered in the present study was evident. The peak value occurred in January 1992 in Milan (0.29), and in December 1991 for the other cities (0.22–0.26).
The most important aspect to point out is that the AOD-SO4 anomalies started in July 1991 and ended in December 1993. This agrees with previous studies and observations of the evolution of the Pinatubo aerosols in Europe [43]. It is important to remark that caution should be paid in interpreting results from volcanic events using MERRA-2, because the aerosol reanalysis was biased by the overestimated height of plume injection and the underestimated size of stratospheric SO4 aerosols, leading to an overestimate of total AOD and sulfate aerosol, and an underestimate of dust and sea salt aerosol species [20].

3.4. AOD Trends

The linear trend between 2002 and 2017 for total AOD in the five cities studied is shown in Figure 9a–e. The trend was negative in each city. The fitting curve was obtained using a least-square method on the total AOD annual time series from the MERRA-2 model.
The greatest decrease rate was for the city of Milan, with a net decrease between 2002 and 2017 of −5.4 × 10⁻³ AOD (Table 2), mainly drived by a sharp decrease of AOD-SO4 aerosol particles (Figure 3, green line) caused by a strong reduction from non industrial combustion and energy production sectors [44]. The other cities showed decrease rates between −2.3 and −2.8 × 10⁻³ AOD in the same period. Based on these results, these cities may be characterized by a declining AOD tendency. This corroborated the results of Alpert et al. [9], who analyzed data from MODIS and MISR sensors and found declining AOD trends for almost all European cities, as a consequence of the effective air quality regulations established in many European countries.
Between 2004 and 2015, the implementation of the EU Large Combustion Plant Directive, several overlapping energy policies and a combination of other factors (e.g., the 2007–2008 financial crisis and the consequent fall in industrial production) led to a drastic reduction in NOx, SO2, and total suspended particulate emissions from large combustion plants (i.e., plants generating heat and/or energy with an installed capacity > 50 megawatts thermal energy) [45].
In Italy, between 2000 and 2017, anthropogenic emissions of PM2.5 and PM10 dropped by 16% and 20%, respectively, as well as aerosol precursors such as SOx (−85%), NOx (−52%), and NH3 (−16%) [46]. Our findings were in line with the results of Manara et al. [11], who observed a negative trend for AOD for a set of grid-points over the Italian Peninsula based on MERRA-2 data over the 1981–2017 period.

4. Conclusions

MERRA-2 aerosol reanalysis, with its differentiation of aerosol speciation, is an advanced tool capable of estimating the AOD of individual aerosol species with a global coverage. This may be considered particularly helpful for the evaluation of urban air pollution at a regional/global level, since different cities may have the tendency to exhibit a mixed aerosol composition [14].
In this context, we analyzed the MERRA-2 reanalysis to evaluate the trend of urban air pollution by elaborating the AOD over a period of 30 years (1987–2017) in five of the most populated cities in Italy in order to assess the impacts of urbanization, industrialization, air quality regulations, and regional transport on urban aerosol load.
This was done in the framework of a recent methodology developed by Provençal et al. [14] to study air quality issues around the world, which evidenced that air quality on the European continent has significantly improved in recent decades.
To verify this, AOD trends were evaluated for five Italian cities, namely Milan, Rome, Cagliari, Taranto, and Palermo. These cities were selected considering the two main parameters of urban aerosol pollution, like the presence of industries in the metropolitan area, and the road traffic. Milan and Taranto are two of the most important industrial sites of Europe, while Rome experiences congested traffic every day. Finally, due to their closeness to Sahara Desert, Palermo and Cagliari were chosen to verify whether there was a common dust signature in their urban aerosol load.
AOD evolution in the period 2002–2017, predicted by the MERRA-2 model for the selected cities, showed: (i) a generalized decreasing trend for the AOD; (ii) the AOD decreasing trend for the city of Milan is twice compared with the other cities; (iii) the anthropogenic signature for total AOD was quite different between cities, with 80% in Milan, 60% in Rome and Taranto, and 50% in Palermo and Cagliari; (iv) the contribution of mineral dust to the total AOD reached the highest values in the cities of Palermo and Cagliari, with about 40% of the total. Of the anthropogenic speciated aerosols, sulfate made the greatest contribution to the total AOD across the Italian Peninsula.

Author Contributions

Conceptualization, U.R.; Data curation, S.V.; Funding acquisition, G.P.; Methodology, U.R.; Software, M.M.; Supervision, U.R.; Writing—original draft, U.R.; Writing—review & editing, E.M.

Funding

The present research received no external funding.

Acknowledgments

The authors gratefully acknowledge the NASA GES-DISC Interactive Online Visualization and Analysis Infrastructure (GIOVANNI) for providing MERRA-2 reanalysis, MODIS, and MISR satellite aerosol data.

Conflicts of Interest

The authors of the present study declare no conflict of interest.

References

  1. Stocker, T.F.; Qin, D.; Plattner, G.-K.; Tignor, M.; Allen, S.K.; Boschung, J.; Nauels, A.; Xia, Y.; Bex, V.; Midgley, P.M. IPCC, 2013: Climate Change 2013: The Physical Science Basis. Contribution of Working Group I to the Fifth Assessment Report of the Intergovernmental Panel on Climate Change IPCC; Cambridge University Press: Cambridge, UK; New York, NY, USA, 2013; p. 1535. [Google Scholar]
  2. Gelaro, R.; McCarty, W.; Suárez, M.J.; Todling, R.; Molod, A.; Takacs, L.; Wargan, K. The modern-era retrospective analysis for research and applications, version 2 (MERRA-2). J. Clim. 2017, 30, 5419–5454. [Google Scholar] [CrossRef]
  3. Rienecker, M.M.; Suarez, M.J.; Gelaro, R.; Todling, R.; Bacmeister, J.; Liu, E.; Bosilovich, M.G. MERRA: NASA’s modern-era retrospective analysis for research and applications. J. Clim. 2011, 24, 3624–3648. [Google Scholar] [CrossRef]
  4. Inness, A.; Inness, A.; Ades, M.; Agusti-Panareda, A.; Barré, J.; Benedictow, A.; Blechschmidt, A.M.; Dominguez, J.J. The CAMS reanalysis of atmospheric composition. Atmos. Chem. Phys. 2019, 19, 3515–3556. [Google Scholar] [CrossRef]
  5. Chin, M.; Ginoux, P.; Kinne, S.; Torres, O.; Holben, B.N.; Duncan, B.N.; Martin, R.V.; Logan, J.A.; Higurashi, A.; Nakajima, T. Tropospheric aerosol optical thickness from the GOCART model and comparisons with satellite and Sun photometer measurements. J. Atmos. Sci. 2002, 59, 461–483. [Google Scholar] [CrossRef]
  6. Global Modeling and Assimilation Office. Available online: https://gmao.gsfc.nasa.gov/reanalysis/MERRA-2/ (accessed on 3 July 2019).
  7. Holben, B.N.; Eck, T.F.; Slutsker, I.; Tanre, D.; Buis, J.P.; Setzer, A.; Vermote, E.; Reagan, J.A.; Kaufman, J.; Nakajima, T.; et al. AERONET—A federated instrument network and data archive for aerosol characterization. Remote Sens. Environ. 1998, 66, 1–16. [Google Scholar] [CrossRef]
  8. Stirnberg, R.; Cermak, J.; Andersen, H. An Analysis of Factors Influencing the Relationship between Satellite-Derived AOD and Ground-Level PM10. Remote Sens. 2018, 10, 1353. [Google Scholar] [CrossRef]
  9. Alpert, P.; Shvainshtein, O.; Kishcha, P. AOD trends over megacities based on space monitoring using MODIS and MISR. Am. J. Clim. Chang. 2012, 1, 117. [Google Scholar] [CrossRef]
  10. Che, H.; Gui, K.; Xia, X.; Wang, Y.; Holben, B.N.; Goloub, P.; Cuevas-Agulló, E.; Wang, H.; Zheng, Y.; Zhao, H.; et al. Large contribution of meteorological factors to inter-decadal changes in regional aerosol optical depth. Atmos. Chem. Phys. 2019, 19, 10497–10523. [Google Scholar] [CrossRef]
  11. Manara, V.; Brunetti, M.; Gilardoni, S.; Landi, T.C.; Maugeri, M. 1951–2017 changes in the frequency of days with visibility higher than 10 km and 20 km in Italy. Atmos. Environ. 2019, 214, 116861. [Google Scholar] [CrossRef]
  12. European Environment Agency. Air Quality in Europe—2018 Report; Publication Office of the European Union: Luxembourg, 2018. [Google Scholar] [CrossRef]
  13. Bocchi, C.; Bazzini, C.; Fontana, F.; Pinto, G.; Martino, A.; Cassoni, F. Characterization of urban aerosol: Seasonal variation of genotoxicity of the water-soluble portion of PM2.5 and PM1. Mutat. Res. Gen. Tox. Environ. 2019, 841, 23–30. [Google Scholar] [CrossRef]
  14. Provençal, S.; Kishcha, P.; da Silva, A.M.; Elhacham, E.; Alpert, P. AOD distributions and trends of major aerosol species over a selection of the world’s most populated cities based on the 1st version of NASA’s MERRA Aerosol Reanalysis. Urban Clim. 2017, 20, 168–191. [Google Scholar] [CrossRef] [PubMed]
  15. Roshan, D.R.; Koc, M.; Isaifan, R.; Shahid, M.Z.; Fountoukis, C. Aerosol Optical Thickness over Large Urban Environments of the Arabian Peninsula—Speciation, Variability, and Distributions. Atmosphere 2019, 10, 228. [Google Scholar] [CrossRef]
  16. Shantikumar, N.S.; Larson, E.J.; Dumka, U.C.; Estelles, V.; Campanelli, M.; Steve, C. Long-term (1995–2018) aerosol optical depth derived using ground based AERONET and SKYNET measurements from aerosol aged-background sites. Atmos. Pollut. Res. 2019, 10, 608–620. [Google Scholar] [CrossRef]
  17. Molod, A.; Takacs, L.; Suarez, M.; Bacmeister, J.; Song, I.-S.; Eichmann, A. The GEOS-5 Atmospheric General Circulation Model: Mean Climate and Development from MERRA to Fortuna; NASA Technical Report Series on Global Modeling and Data Assimilation; NASA TM—2012-104606; NASA, Goddard Space Flight Center: Greenbelt, MD, USA, 2012; pp. 28, 117.
  18. Wu, W.-S.; Purser, R.J.; Parrish, D.F. Three-dimensional variational analysis with spatially inhomogeneous covariances. Mon. Wea. Rev. 2002, 130, 2905–2916. [Google Scholar] [CrossRef]
  19. Bloom, S.; Takacs, L.; DaSilva, A.; Ledvina, D. Data assimilation using incremental analysis updates. Mon. Wea. Rev. 1996, 124, 1256–1271. [Google Scholar] [CrossRef]
  20. Randles, C.A.; da Silva, A.; Buchard, V.; Colarco, P.R.; Darmenov, A.S.; Govindaraju, R.C.; Smirnov, A.; Ferrare, R.A.; Hair, J.W.; Shinozuka, Y.; et al. The MERRA-2 Aerosol Reanalysis, 1980-onward, Part I: System Description and Data Assimilation Evaluation. J. Clim. 2017, 30, 6823–6850. [Google Scholar] [CrossRef]
  21. Dubovik, O.; Smirnov, A.; Holben, B.N.; King, M.D.; Kaufman, Y.J.; Eck, T.F.; Slutsker, I. Accuracy assessments of aerosol optical properties retrieved from Aerosol Robotic Network (AERONET) Sun and sky radiance measurements. J. Geophys. Res. Atmos. 2000, 105, 9791–9806. [Google Scholar] [CrossRef]
  22. AERONET Aerosol Robotic Network. Available online: https://aeronet.gsfc.nasa.gov (accessed on 3 July 2019).
  23. Colarco, P.; da Silva, A.; Chin, M.; Diehl, T. Online simulations of global aerosol distributions in the NASA GEOS-4 model and comparisons to satellite and ground-based aerosol optical depth. J. Geophys. Res. Atmos. 2010. [Google Scholar] [CrossRef]
  24. Marticorena, B.; Bergametti, G. Modeling the atmospheric dust cycle: 1. Design of a soil-derived dust emission scheme. J. Geophys. Res. Atmos. 1995, 100, 16415–16430. [Google Scholar] [CrossRef]
  25. Gong, S.L. A parameterization of sea-salt aerosol source functionfor sub- and super-micron particles. Glob. Biogeochem. Cycles 2003, 17, 1097. [Google Scholar] [CrossRef]
  26. Jaeglé, L.; Quinn, P.K.; Bates, T.S.; Alexander, B.; Lin, J.-T. Global distribution of sea salt aerosols: New constraints from in situ and remote sensing observations. Atmos. Chem. Phys. 2011, 11, 3137–3157. [Google Scholar] [CrossRef]
  27. Duncan, B.N.; Martin, R.V.; Staudt, A.C.; Yevich, R.; Logan, J.A. Interannual and seasonal variability of biomass burning emissions constrained by satellite observations. J. Geophys. Res. Atmos. 2003, 108, 4040. [Google Scholar] [CrossRef]
  28. Guenther, A.; Hewitt, C.N.; Erickson, D.; Fall, R.; Geron, C.; Graedel, T.; Pierce, T. A global model of natural volatile organic compound emissions. J. Geophys. Res. Atmos. 1995, 100, 8873–8892. [Google Scholar] [CrossRef]
  29. Lana, A.; Bell, T.G.; Simó, R.; Vallina, S.M.; Ballabrera-Poy, J.; Kettle, A.J.; Johnson, J.E. An updated climatology of surface dimethlysulfide concentrations and emission fluxes in the global ocean. Glob. Biogeochem. Cycles 2011. [Google Scholar] [CrossRef]
  30. Diehl, T.; Heil, A.; Chin, M.; Pan, X.; Streets, D.; Schultz, M.; Kinne, S. Anthropogenic, biomass burning, and volcanic emissions of black carbon, organic carbon, and SO2 from 1980 to 2010 for hindcast model experiments. Atmos. Chem. Phys. Discuss. 2012, 12, 24895–24954. [Google Scholar] [CrossRef]
  31. Aerosol Comparisons between Observations and Models. Available online: https://aerocom.met.no (accessed on 3 September 2019).
  32. European Commission, Joint Research Centre (JRC). Emission Database for Global Atmospheric Research (EDGAR), Release Version 4.2. Available online: https://edgar.jrc.ec.europa.eu/overview.php?v=42 (accessed on 1 September 2018).
  33. Buchard, V.; Randles, C.A.; da Silva, A.; Darmenov, A.S.; Colarco, P.R.; Govindaraju, R.C.; Ferrare, R.A.; Hair, J.W.; Beyersdorf, A.; Ziemba, L.D.; et al. The MERRA-2 aerosol reanalysis, 1980-onward. Part II: Evaluation and case studies. J. Clim. 2017, 30, 6851–6872. [Google Scholar] [CrossRef]
  34. Reichle, R.H.; Draper, C.S.; Liu, Q.; Girotto, M.; Mahanama, S.P.; Koster, R.D.; De Lannoy, G. Assessment of MERRA-2 land surface hydrology estimates. J. Clim. 2017, 30, 2937–2960. [Google Scholar] [CrossRef]
  35. Nowottnick, E.; Colarco, P.; Ferrare, R.; Chen, G.; Ismail, S.; Anderson, B.; Browell, E. Online simulations of mineral dust aerosol distributions: Comparisons to NAMMA observations and sensitivity to dust emission parameterization. J. Geophys. Res. 2010, 115, D03202. [Google Scholar] [CrossRef]
  36. Bian, H.; Colarco, P.R.; Chin, M.; Chen, G.; Rodriguez, J.M.; Liang, Q.; Diskin, G. Source attributions of pollution to the Western Arctic during the NASA ARCTAS field campaign. Atmos. Chem. Phys. 2013, 13, 4707–4721. [Google Scholar] [CrossRef]
  37. Rizza, U.; Miglietta, M.M.; Mangia, C.; Ielpo, P.; Morichetti, M.; Iachini, C.; Virgili, S.; Passerini, G. Sensitivity of WRF-Chem model to land surface schemes: Assessment in a severe dust outbreak episode in the Central Mediterranean (Apulia Region). Atmos. Res. 2018, 201, 168–180. [Google Scholar] [CrossRef]
  38. Levy, R.C.; Remer, L.A.; Kleidman, R.G.; Mattoo, S.; Ichoku, C.; Kahn, R.; Eck, T.F. Global evaluation of the Collection 5 MODIS dark-target aerosol products over land. Atmos. Chem. Phys. 2010, 10, 10399–10420. [Google Scholar] [CrossRef] [Green Version]
  39. Filonchyk, M.; Yan, H.; Zhang, Z.; Yang, S.; Li, W.; Li, Y. Combined use of satellite and surface observations to study aerosol optical depth in different regions of China. Sci. Rep. 2019, 9, 6174. [Google Scholar] [CrossRef] [PubMed]
  40. Ielpo, P.; Mangia, C.; Marra, G.P.; Comite, V.; Rizza, U.; Uricchio, V.F.; Fermo, P. Outdoor spatial distribution and indoor levels of NO2 and SO2 in a high environmental risk site of the South Italy. Sci. Total Environ. 2019, 648, 787–797. [Google Scholar] [CrossRef]
  41. Comba, P.; Pirastu, R.; Conti, S.; De, M.S.; Iavarone, I.; Marsili, G.; Musmeci, L. Environment and health in Taranto, southern Italy: Epidemiological studies and public health recommendations. Epidemiol. Prev. 2012, 36, 305–320. [Google Scholar]
  42. Sun, W.; Liu, J.; Wang, B.; Chen, D.; Liu, F.; Wang, Z.; Chen, M. A “La Niña-like” state occurring in the second year after large tropical volcanic eruptions during the past 1500 years. Clim. Dyn. 2019, 52, 7495–7509. [Google Scholar] [CrossRef] [Green Version]
  43. Ansmann, A.; Mattis, I.; Wandinger, U.; Wagner, F.; Reichardt, J.; Deshler, T. Evolution of the Pinatubo aerosol: Raman lidar observations of particle optical depth, effective radius, mass, and surface area over Central Europe at 53.4 N. J. Atmos. Sci. 1997, 54, 2630–2641. [Google Scholar] [CrossRef]
  44. Romano, D.; Arcarese, C.; Bernetti, A.; Caputo, A.; Contaldi, M.; Cordella, M.; De Lauretis, R.; Di Cristofaro, E.; Federici, S.; Gagna, A.; et al. Italian Greenhouse Gas Inventory 1990–2017 – National Inventory Report 2019; ISPRA: Rome, Italy, 2019; p. 581.
  45. European Environment Agency. Assessing the effectiveness of EU policy on large combustion plants in reducing air pollutant emissions. EEA Report No 7/2019. Luxemb. Publ. Off. Eur. Union 2019. [Google Scholar] [CrossRef]
  46. European Environment Agency. European Union emission inventory report 1990-2017 under the UNECE Convention on Long-range Transboundary Air Pollution (LRTAP). EEA Report No 08/2019. Luxemb. Publ. Off. Eur. Union 2019. [Google Scholar] [CrossRef]
Figure 1. Time-averaged map of the Italian Peninsula showing (a) total aerosol extinction, aerosol optical thickness (AOT) 550 nm, monthly 0.5° × 0.625°, MERRA-2 Model M2TMNXAER v5.12.4, over July 2002–December 2017; (b) combined dark target and deep blue aerosol optical depth (AOD) at 550 nm for land and ocean, monthly 1°, MODIS-Terra MOD08_M3 v6 merged with MODIS-Aqua MYD08_M3 v6, over July 2002–December 2017.
Atmosphere 10 00709 g001
Figure 2. The five Italian cities analyzed in this study are circled in red.
Atmosphere 10 00709 g002
Figure 3. Time series of aerosol optical depth (AOD) for the city of Milan (a) and percentage of anthropogenic (black carbon (BC), organic carbon (OC), and SO4) and natural (dust (DU), and sea salt (SS)) AOD components (b). TOT — total; nat — natural; anth — anthropogenic.
Atmosphere 10 00709 g003
Figure 4. Time series of aerosol optical depth (AOD) for the city of Rome (a) and percentages of anthropogenic (black carbon (BC), organic carbon (OC), and SO4) and natural (dust (DU), and sea salt (SS)) AOD components (b). TOT — total; nat — natural; anth — anthropogenic.
Atmosphere 10 00709 g004
Figure 5. Time series of aerosol optical depth (AOD) for the city of Taranto (a) and percentage of anthropogenic (black carbon (BC), organic carbon (OC), and SO4) and natural (dust (DU), and sea salt (SS)) AOD components (b). TOT — total; nat — natural; anth — anthropogenic.
Atmosphere 10 00709 g005
Figure 6. Time series of aerosol optical depth (AOD) for the city of Palermo (a) and percentage of anthropogenic (black carbon (BC), organic carbon (OC), and SO4) and natural (dust (DU), and sea salt (SS)) AOD components (b). TOT — total; nat — natural; anth — anthropogenic.
Atmosphere 10 00709 g006
Figure 7. Time series of aerosol optical depth (AOD) for the city of Cagliari (a) and percentage of anthropogenic (black carbon (BC), organic carbon (OC), and SO4) and natural (dust (DU), and sea salt (SS)) AOD components (b). TOT — total; nat — natural; anth — anthropogenic.
Atmosphere 10 00709 g007
Figure 8. Time series of AOD for the SO4 component for the five selected cities in the 1991–1992 period.
Atmosphere 10 00709 g008
Figure 9. AOD evolution predicted by MERRA-2 for the 2002–2017 period and its linear interpolation for (a) Milan; (b) Rome; (c) Taranto; (d) Palermo; and (e) Cagliari.
Atmosphere 10 00709 g009
Table 1. Aerosol species in the hybrid bulk/sectional Goddard chemistry, aerosol, radiation, and transport (GOCART) aerosol speciation scheme.
Aerosol SpeciesBins
Dust (DU)5
Sea salt (SS)5
Hydrophobic/hydrophilic (OC)1/1
Hydrophobic/hydrophilic (BC)1/1
Sulfate (SO4)1
Table 2. Coefficients of the linear fit y = a + bx, the asymptotic standard error on parameters (a,b) and the AOD decrease rate year−1 for the 2002–2017 period.
CityabStandard Error (%)AOD Decrease RateYear (10−3)
Milan11.00−0.00508−5.4
Rome5.81−0.002812.75−2.8
Taranto5.70−0.002716−2.7
Palermo5.38−0.002617−2.6
Cagliari6.12−0.003013−2.3

