Article

On the Effect of Red Sea and Topography on Rainfall over Saudi Arabia: Case Study

by
Motirh Al-Mutairi
1,
Heshmat Abdel Basset
2,*,
Mostafa Morsy
2 and
Abdallah Abdeldym
2
1
Faculty of Arts, Princess Nourah Bint Abdulrahman University, Riyadh 11671, Saudi Arabia
2
Department of Astronomy and Meteorology, Faculty of Science, Al-Azhar University, Cairo 11884, Egypt
*
Author to whom correspondence should be addressed.
Atmosphere 2019, 10(11), 669; https://doi.org/10.3390/atmos10110669
Submission received: 9 October 2019 / Revised: 26 October 2019 / Accepted: 29 October 2019 / Published: 31 October 2019
(This article belongs to the Section Meteorology)

Abstract

:
This paper aimed to investigate the impact of Red Sea topography and water on the development and rainfall of a case of cyclogenesis occurs over Saudi Arabia during the period 16–18 November 2015 using the Weather Research and Forecasting (WRF) model. The WRF Control Run (WRF-CR) experiment was performed with presence of actual topography and surface water of the Red Sea, while the other three sensitivity experiments were carried out without (i) Red Sea Topography (NRST), (ii) Red Sea Water (NRSW), and (iii) Red Sea Topography and Water (NRSTW). The simulated rainfall in the control experiment depicts in well agreement with Tropical Rainfall Measurement Mission (TRMM) rainfall estimates in terms of intensity as well as spatio-temporal distribution. Results demonstrate that rainfall intensity and spatio-temporal distribution significantly changes through each sensitivity experiment compared to the WRF-CR, where the significant variation was found in the NRST experiment. The absence of topography (NRST) leads to formation of strong convergence area over the middle of Red Sea which enhanced uplift motion that further strengthened the low-level jet over Red Sea and the surrounding regions, which enhanced the moisture and temperature gradient and created a conditionally unstable atmosphere that favored the development of the cyclonic system. The absence of Red Sea water (NRSW) changed rainfall spatial distribution and reduced its amount by about 30–40% due to affecting of the dynamics of the upward motion and moisture gradient, suggesting that surface fluxes play an important role in regulating the low-level moist air convergence prior to convection initiation and development.

1. Introduction

The east Mediterranean region is considered one of the most cyclogenetic areas in the world because of the surrounded mountains, orographic barriers, and arid regions, which interact with the air flow and play an important role in the formation of low-pressure centers [1]. Saudi Arabia receives most of the precipitation during the period from November to April from synoptic-scale disturbances as a result of the invasion of the Red Sea Trough (RST) over the east Mediterranean, accompanied by warm and moist southern winds from tropical region [2]. The upper level middle latitude trough and the RST are the long-recognized cyclogenesis system developments over the east Mediterranean region [3]. The development of such cyclogenetic systems and rainstorms over Saudi Arabia, particularly its western areas, is principally due to the environmental and atmospheric conditions associated with the Red Sea features and topography [4,5,6].
The major factors that affect such convective systems are the development of cyclone over the Mediterranean and anticyclone over the Arabian Peninsula [7,8], high tropospheric moisture content, and warm sea surface temperatures (SST) of the Red Sea, as well as the local topography [9]. Numerical models provide a powerful tool for atmospheric research by performing sensitivity experiments. Their purpose is to isolate the effect of different factors on certain atmospheric fields in one or more case studies. Sensitivity studies often evaluate the influence of only one factor, such as topography [10,11], but many investigations test several factors and try to estimate their relative importance. The effect of orographic features, which are sometimes combined with some other parameters, on the precipitation intensity and spatial distribution was examined over different regions in the world. In Southern California, the blocking of complex topography and its influence on Rainfall Distribution was studied using the mesoscale model (MM5) [12], their results indicate that the orographic blocking substantially affects and plays a major role in determining the precipitation distribution along of the coastal areas. From a topography height change point of view, in Rwanda, it was clarified that the reduction in topography height by 50% led to rainfall decreasing with varying magnitudes during two rainy seasons using the Weather Research and Forecasting (WRF) model [13]. Similarly, in the Ethiopian Highlands, the results of MM5 models revealed that the amount of precipitation is significantly reduced and shifted spatially when the topography height was reduced by 50%, while there no clear pattern of rainfall was revealed when increasing the topography height by 50% [14].
Numerous studies have been performed over the different regions in Saudi Arabia to analyze and discuss the rainfall features and variation [15] and its associated meso-scale synoptic systems and cyclogenesis [4,7,16] using different numerical weather prediction (NWP) models. Moreover, the influences and the explicit role of topography and surface heat exchange to the atmosphere on the development of heavy rainfall during 25 November 2009 over Jeddah, Saudi Arabia, using the WRF model, were examined [6]. They proved that the Red Sea topography, as well as the surface heating exchange, played an important role in determining the rainfall intensity and its spatial distribution over Jeddah. In addition, two other severe rainfall events of 30 December 2010 and 14 January 2011 have been studied over Saudi Arabia using the Weather Research and Forecasting (WRF) model [9]. Their results indicated that the WRF model was able to accurately simulate the three heavy rainfall events with driving convective processes. The convergence and moisture transportation over the Red Sea generate favorable conditions for severe convection development and enhance the storm intensity especially in western Saudi Arabia [16]. Other researchers [3] found that the rotational component of the moisture flux brings moisture from two main regions: the first is the Indian Ocean, Arabian Sea, Gulf of Aden, and the northeast of Sudan and the second is the Atlantic and Mediterranean Sea. As a result of the major role and influence of topography individually or along with several parameters on the precipitation and associated weather systems, which can be considered as a vital and necessary issue in mountainous regions overall the world, it is essential to examine it over the Red Sea, Saudi Arabia, and adjacent areas. The aim of this study was to investigate the impact of removing Red Sea topography, water, and both topography and water on the development and rainfall of a case of cyclogenesis that occurred over Saudi Arabia during the period 16–18 November 2015. This objective was achieved using the WRF model that was configured in three sensitivity experiments as follows: (i) without Red Sea Topography (NRST), (ii) without Red Sea Water (NRSW), and (iii) without Red Sea Topography and Water (NRSTW).

2. Data and Methodology

2.1. Data Used

Three different types of data were used in this study; the first one was taken from the archives of the European center for Medium Range Forecasts (ECMWF) Reanalysis Interim (Era-Interim) dataset [17]. It consists of the horizontal and vertical wind components (u-eastward, v-northward, and w-vertical velocity) in m s−1, temperature (°C), and the geopotential height (gpm) in six-hourly 1° × 1° horizontal resolution for isobaric levels 1000, 850, 700, 500, 400, 300, 250, 200, 150, and 100 hPa. The period of study was from 14 to 18 November 2015 over the area bounded by 20° W–80° E and 0°–80° N. This Era-Interim dataset was used for the purposes of synoptic discussion and examine the WRF model performance to simulate the cyclogenesis system pattern during the period of study.
The observed daily precipitation, during the selected severe precipitation event, of 0.25° × 0.25° horizontal resolution are obtained from Tropical Rainfall Measuring Mission (TRMM) 3B42-Version 7 products [18] to assess and evaluate the simulated rainfall from the WRF model.
Soil parameters, land use, and orography at 2 arc minutes resolution from the United States Geological Survey (USGS) database were used as input WRF static data. The WRF initial and lateral boundary conditions were downloaded from the National Centers for Environment Prediction (NCEP) global reanalysis dataset, with a 1° × 1° spatial grid every 6 h. The utilized weather parameters in the WRF simulation include: three dimensional meteorological parameters of pressure, geopotential height, temperature, relative humidity, and zonal and meridional wind at the standard 17 pressure levels, as well as four soil layers (0–10, 10–40, 40–100, and 100–200 cm) data of soil temperature and soil moisture and two dimensional surface meteorological variables of mean sea level pressure, 10 m zonal and meridional wind components, 2 m temperature and 2 m relative humidity. Finally, considering the short duration of the run, the fixed sea surface temperature (SST) from NCEP reanalysis dataset is also provided throughout the WRF simulation [19].

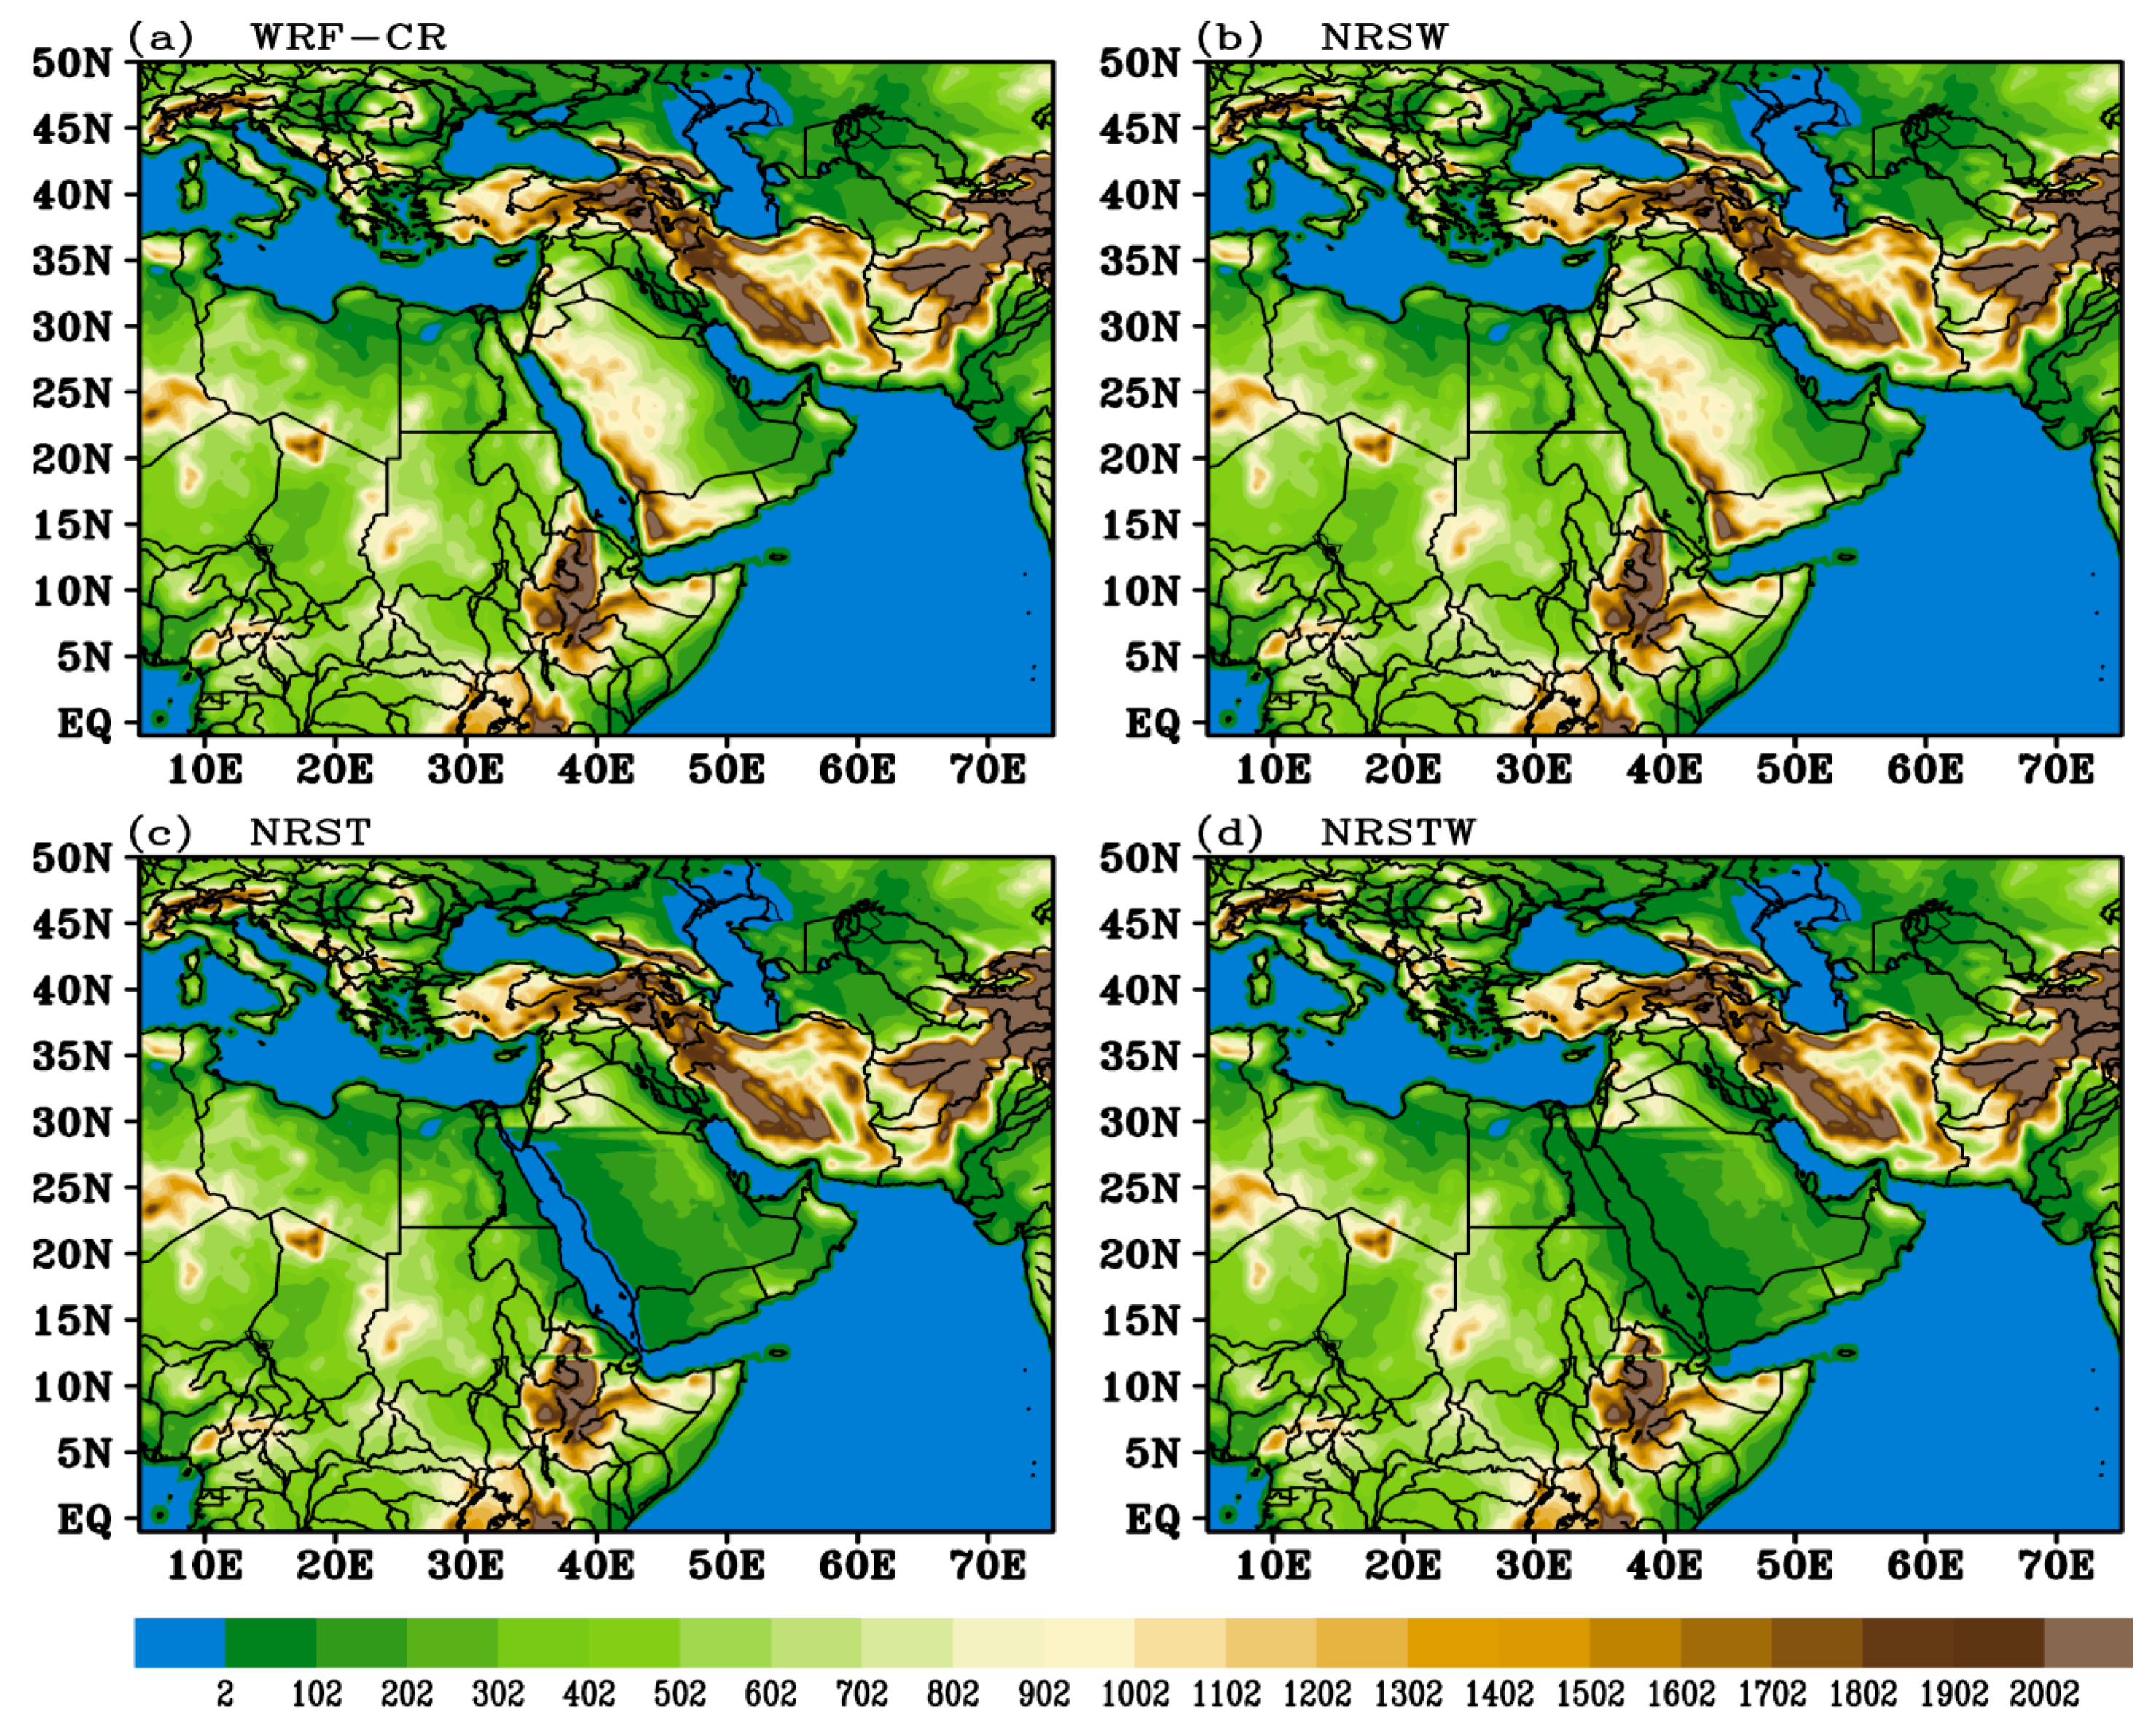
2.2. WRF Description, Configuration, and Experimental Setup

The WRF model is the latest and widely used mesoscale numerical weather prediction (NWP) system, which is used by both operational and research communities [20]. The WRF model has been developed by collaboration between many institutions in the USA, mainly the National Center for Atmospheric Research (NCAR), the National Centers for Environmental Prediction (NCEP), and the Forecast Systems Laboratory (FSL). It contains two principle dynamical cores, the Advanced Research WRF (ARW) core and the Nonhydrostatic Mesoscale Model (NMM) core. The ARW dynamical core, which was utilized in the present study, is based on a set of equations that is fully compressible, Eulerian and non-hydrostatic with a run-time hydrostatic option and uses terrain-following, hydrostatic-pressure vertical coordinate. Therefore, the WRF model has the ability to simulate extreme weather events or events of short lengths of time.
The WRF-ARW version 3.7.1 was employed in this study to simulate the mesoscale weather system, synoptic pattern, and rainfall distribution during the period of 15–18 November 2015 over the study area (Figure 1a). One WRF control run (WRF-CR) was performed with the presence of actual topography and surface water of the Red Sea to investigate the WRF model accuracy in simulating the synoptic pattern and rainfall of our case study. Three different WRF sensitivity experiments, namely (i) without Red Sea Topography (NRST), (ii) without Red Sea Water (NRSW), and (iii) without Red Sea Topography and Water (NRSTW), were carried out to investigate the influence of these parameters on the synoptic pattern and rainfall of our case study.
In the NRST experiment, terrain heights on both sides of the Red Sea within the area between latitudes 12° to 31° N and longitudes 30° to 44° E were multiplied by 0.5 × (r/R), where r is the grid distance form longitude 30° N, while R is the total distance from longitude 30° to 44° E, to reduce the elevations of the terrain and so that there is no sudden rise at the end of the domain and its borders (Figure 1c). The Red Sea region and the mountains are not large enough to effect a change that extends to relatively remote places. Moreover, it is well known that the Red Sea water plays an important role in and contribute significantly to the initiation and development of local and mesoscale convection systems and rainstorms over the nearby regions. In the NRSW experiment, the properties of the Red Sea surface were modified by changing the related variables, as illustrated in Table 1 and Figure 1b. Finally, in the NRSTW experiment, the procedures applied to reduce the Red Sea terrain and remove the Red Sea water were combined together (Figure 1d).
The simulations were performed on a Mercator projected single domain, which has 196 × 169 grid points with a horizontal resolution of 36 km and 34 vertical levels. This wide domain was selected to understand and illustrate the mesoscale weather and synoptic systems necessary for this rainfall event to occur, focusing on Saudi Arabia. Additionally, 150 s has been set for the WRF computational iteration as an adaptive time step and integrated every one-hour model output beginning from 00:00 UTC on 14 November 2015, where the first 24 h of simulation is allowed as spin-up period [21]. The implemented WRF physics schemes and configuration options to simulate the selected extreme rainfall event over the study area are: Eta (coarse) for microphysics scheme, which represent the simple efficient scheme with diagnostic mixed-phase processes [22]; the rapid radiative transfer model for GCMs (RRTMG) scheme (provides improved efficiency with minimal loss of accuracy) for short- and long-wave radiation [23]; the Monin-Obukhov Eta scheme for the surface layer processes [24]; five-layer thermal diffusion scheme for Land Surface [25]; the Planetary boundary layer (PBL) option is the Yonsei University (YSU) scheme [26]; and the Kain-Fritsch scheme for Cumulus Parameterization [27]. The corresponding options for these selected physics schemes are clarified in Table 2.

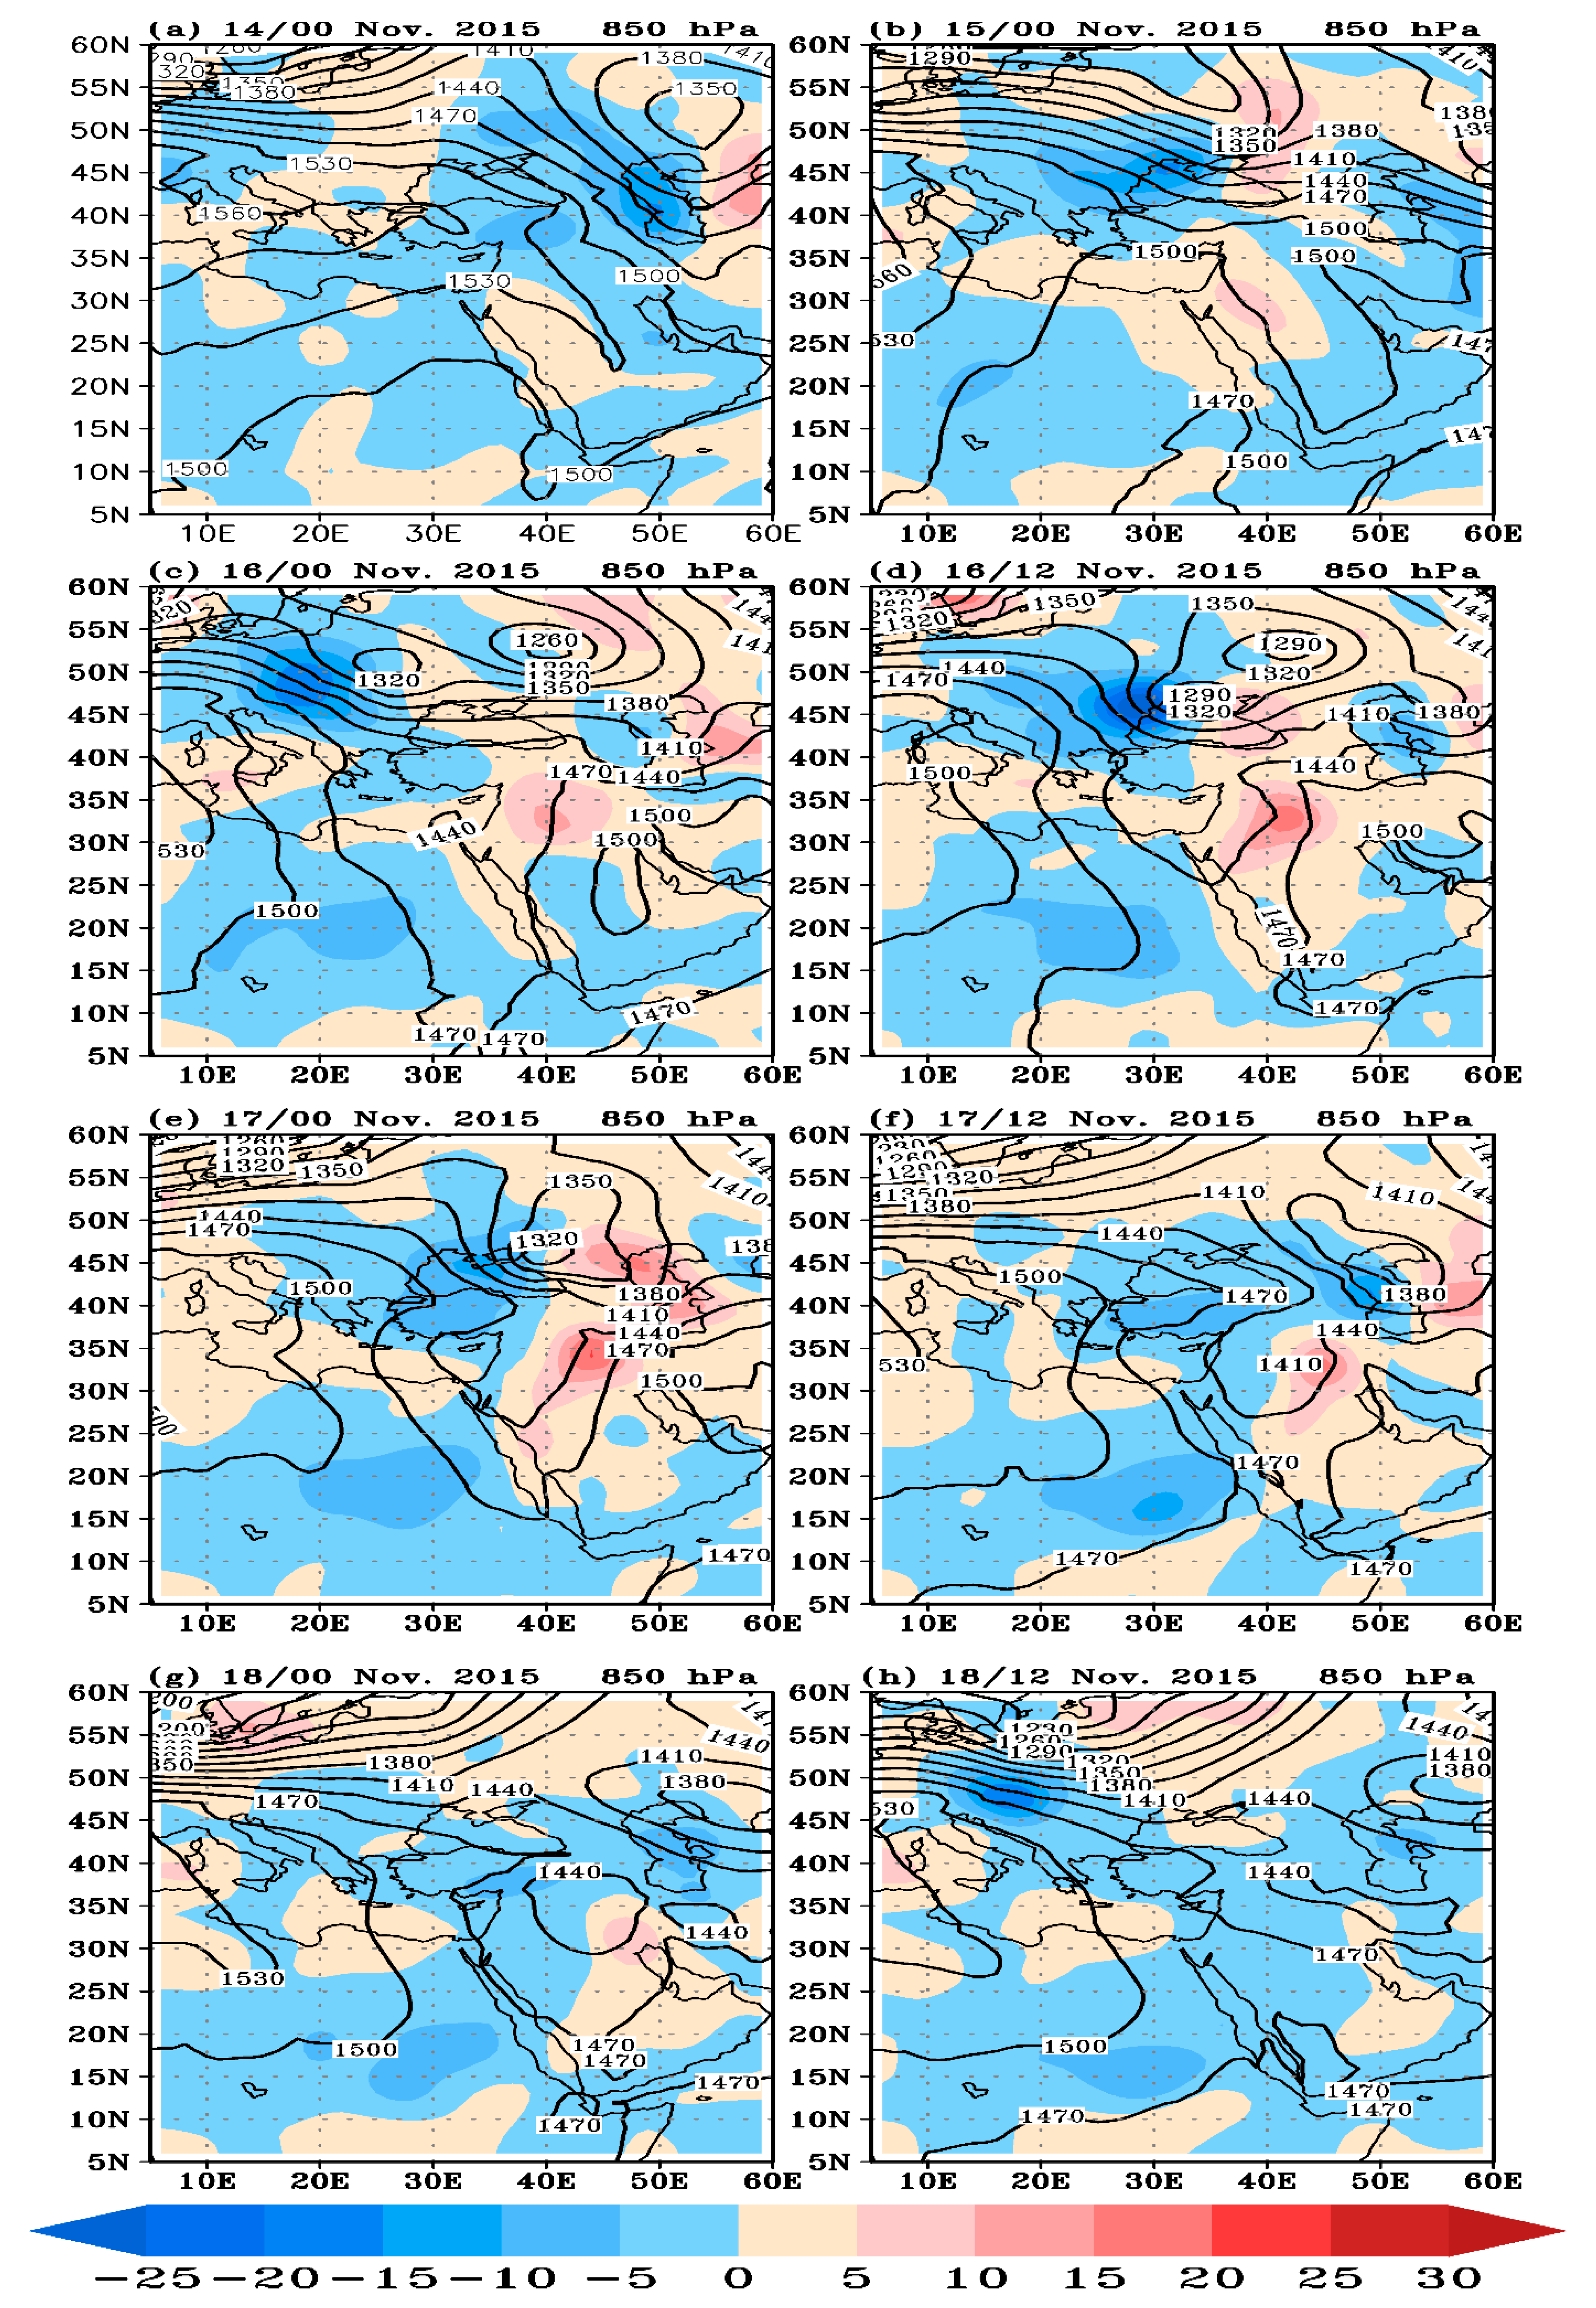
3. Synoptic Discussion of the Case Study

During the period 15–18 November 2015 most of Saudi Arabia, specially the north and middle parts, exposed to heavy rainstorms and reached to about 100 mm during 16 and 17 November. Figure 2 and Figure 3 show the geopotential height (gpm) in meters with the temperature in °C on 1000 and 500 hPa levels, while Figure 4 illustrate the horizontal distribution of the geopotential height (gpm) and temperature advection on 850 hPa. Figure 2a shows that, at 00:00 UTC 14 November 2015, the subtropical high pressure extended to cover most area of North Africa and the Mediterranean and covered the northern part of Saudi Arabia. Contrarily, the Sudan monsoon low and its associated Red Sea trough (RST) extended northward to cover the south eastern part of Egypt and the Red Sea region. Additionally, there was an obvious thermal gradient (red dashed line) associated with the RST and extended zonally to cover the northern part of Sudan and the southern part of Saudi Arabia (Figure 2a). Simultaneously, the upper air (500 hPa) trough appeared in the west of Libya as an extension of the traveling depression (Figure 3a). During 15 November, the Sudan monsoon low deepened with slowly northward propagation of RST to cover most Egypt, while the subtropical high-pressure weakened and moved eastward (Figure 2b). Figure 4b illustrates that there was an area of cold advection over north of Mediterranean, while the warm advection appeared over and southeast of the Mediterranean. Furthermore, the 500 hPa cut-off low started to deepen and moved eastward to cover the north of Libya and the northwestern parts of Egypt (Figure 3b). The intense development of surface (1000 hPa) and upper air pressure systems occurred in the beginning of 16 November 2015 and continued until 18 November 2015. At 00:00 UTC 16 November 2015, the surface RST extended northward and covered the northern region of the study domain (Egypt, East Mediterranean, and Saudi Arabia). The Sudan low was cantered over the Red Sea with a geopotential height of 60 gpm at its center (Figure 2c). Moreover, the 500 hPa cut-off low deepened more and moved slowly eastward to cover the north of Libya and Egypt, with a geopotential height of 5550 gpm at its center (Figure 3c). On 850 hPa, it is clear that the areas of cold and warm advection moved eastward with the movement of our cyclone, where a strong cold advection appeared over east of the Mediterranean, north of Saudi Arabia and the Red Sea, while the area of cold advection moved southeastward. During the period 12:00 UTC 16 November 2015 to 06:00 UTC18 November 2015 (the rainy period), a strong interaction between the extended surface RST from the tropical region (Figure 2d–g) and upper air trough from mid-latitude region (Figure 3d–g) occurred and became more intense. These two depressions (RST and upper air trough) amalgamated to build up a single system. The most significant function of the extended RST was the northward transporting of tropical warm and moist air, as well as the upper air trough provides a polar strong southward cold advection (Figure 4d–f). The interaction between these tropical warm and polar cold air masses contributed to intensify the atmospheric instability over the East Mediterranean and Saudi Arabia. After 12:00 UTC 18 November 2015, the RST moved southwestward (Figure 2h) and the upper air trough moved northeastward (Figure 3h), and their interaction vanished and the atmospheric stability and the high-pressure system dominated the region.
The clear warm advection on 850 hPa (Figure 4) helps to create strong atmospheric instability, especially on 16 November 2015. The sounding profile at 1200 UTC on 16 November 2015 in Jeddah revealed that the atmosphere was extremely unstable, as the CAPE (convective available potential energy) exceeded 3900 J kg−1 with precipitable water (PW) of 40.56 mm, while the Equilibrium Level (EL) decreased to 126.40 hPa, the Level of Free Convection (LFC) reaches 869.70 hPa, and the Lifting Condensation Level (LCL) was about 900 hPa (http://weather.uwyo.edu/upperair/sounding.html), as shown in Figure 5.

4. Results and Discussion

4.1. Control Run Investigation

The spatial distribution of the total daily rainfall from both TRMM and the WRF-CR are presented in Figure 6 in the left and right column, respectively. Generally, the WRF-CR simulation reasonably predicts the spatial distribution pattern of rainfall with relatively good agreement compared to TRMM. The daily values of the WRF-CR rainfall overestimate the corresponding accumulated daily values of TRMM by about 16%, especially over the regions of maximum rainfall (middle and north of the Red Sea and the northwest of Saudi Arabia, Syria, and Iraq). It was found that the area average rainfall values over the domain (36–41° E, 24.5–30° N) on 16 November for the WRF-CR and TRMM were 20.5 and 16.6 mm, respectively. Additionally, the area average rainfall values over the domain (38–41° E, 21.5–26° N) on 17 November for the WRF-CR and TRMM were 17.2 and 14.4 mm, respectively.
For further assessment and assurance for the performance and accuracy of the WRF model simulation, the synoptic pattern of geopotential height (gpm) and temperature gradient (°C) on 1000 hPa (Figure 7, left column) and 500 hPa (Figure 7, right column) were compared with Era-Interim dataset (Figure 2 and Figure 3, right column). The comparison on 1000 hPa illustrated that the WRF model simulates well the temperature gradient and the cyclonic and anticyclonic systems with very small differences in their centers and horizontal expansion area coverage. Additionally, the extended center of RST over east Mediterranean and Saudi Arabia along the period of study in both the WRF-CR simulation and Era-Interim were very similar. This similarity can be observed when tracing the geopotential height contour 120 gpm and its coverage area either east or west of the Red Sea. On the other hand, 500 hPa charts along the period of the study illustrates that there was no difference in the spatial distribution of the upper air geopotential height trough between the WRF control simulation and Era-Interim, except at very small values (up to 20 gpm) in the center of cut-off low. Generally, Figure 8 demonstrates the variation in the geopotential of the trough centers between the WRF-CR and Era-Interim on 1000 and 500 hPa charts during the period 15–18 November 2015. It is obvious that the WRF was lower than Era-Interim by 20 gpm on 1000 hPa after 06:00 UTC on 17 November, while it was lower by 50 gpm on 500 hPa from 00:00 to 18:00 on 16 November 2015. This means that the simulated cyclone and its associated trough from the WRF were similar to the Era-Interim reanalysis during the period of study. The comparison between surface and upper air charts illustrate that the WRF model proved its competence and produced a good simulation for this rainstorm. Therefore, we can use the WRF model to conduct the sensitivity experiments related to changes in some land features (NRST, NRSW, and NRSTW) to determine the new changes and modifications in the prevailing cyclogenesis system and rainfall pattern.

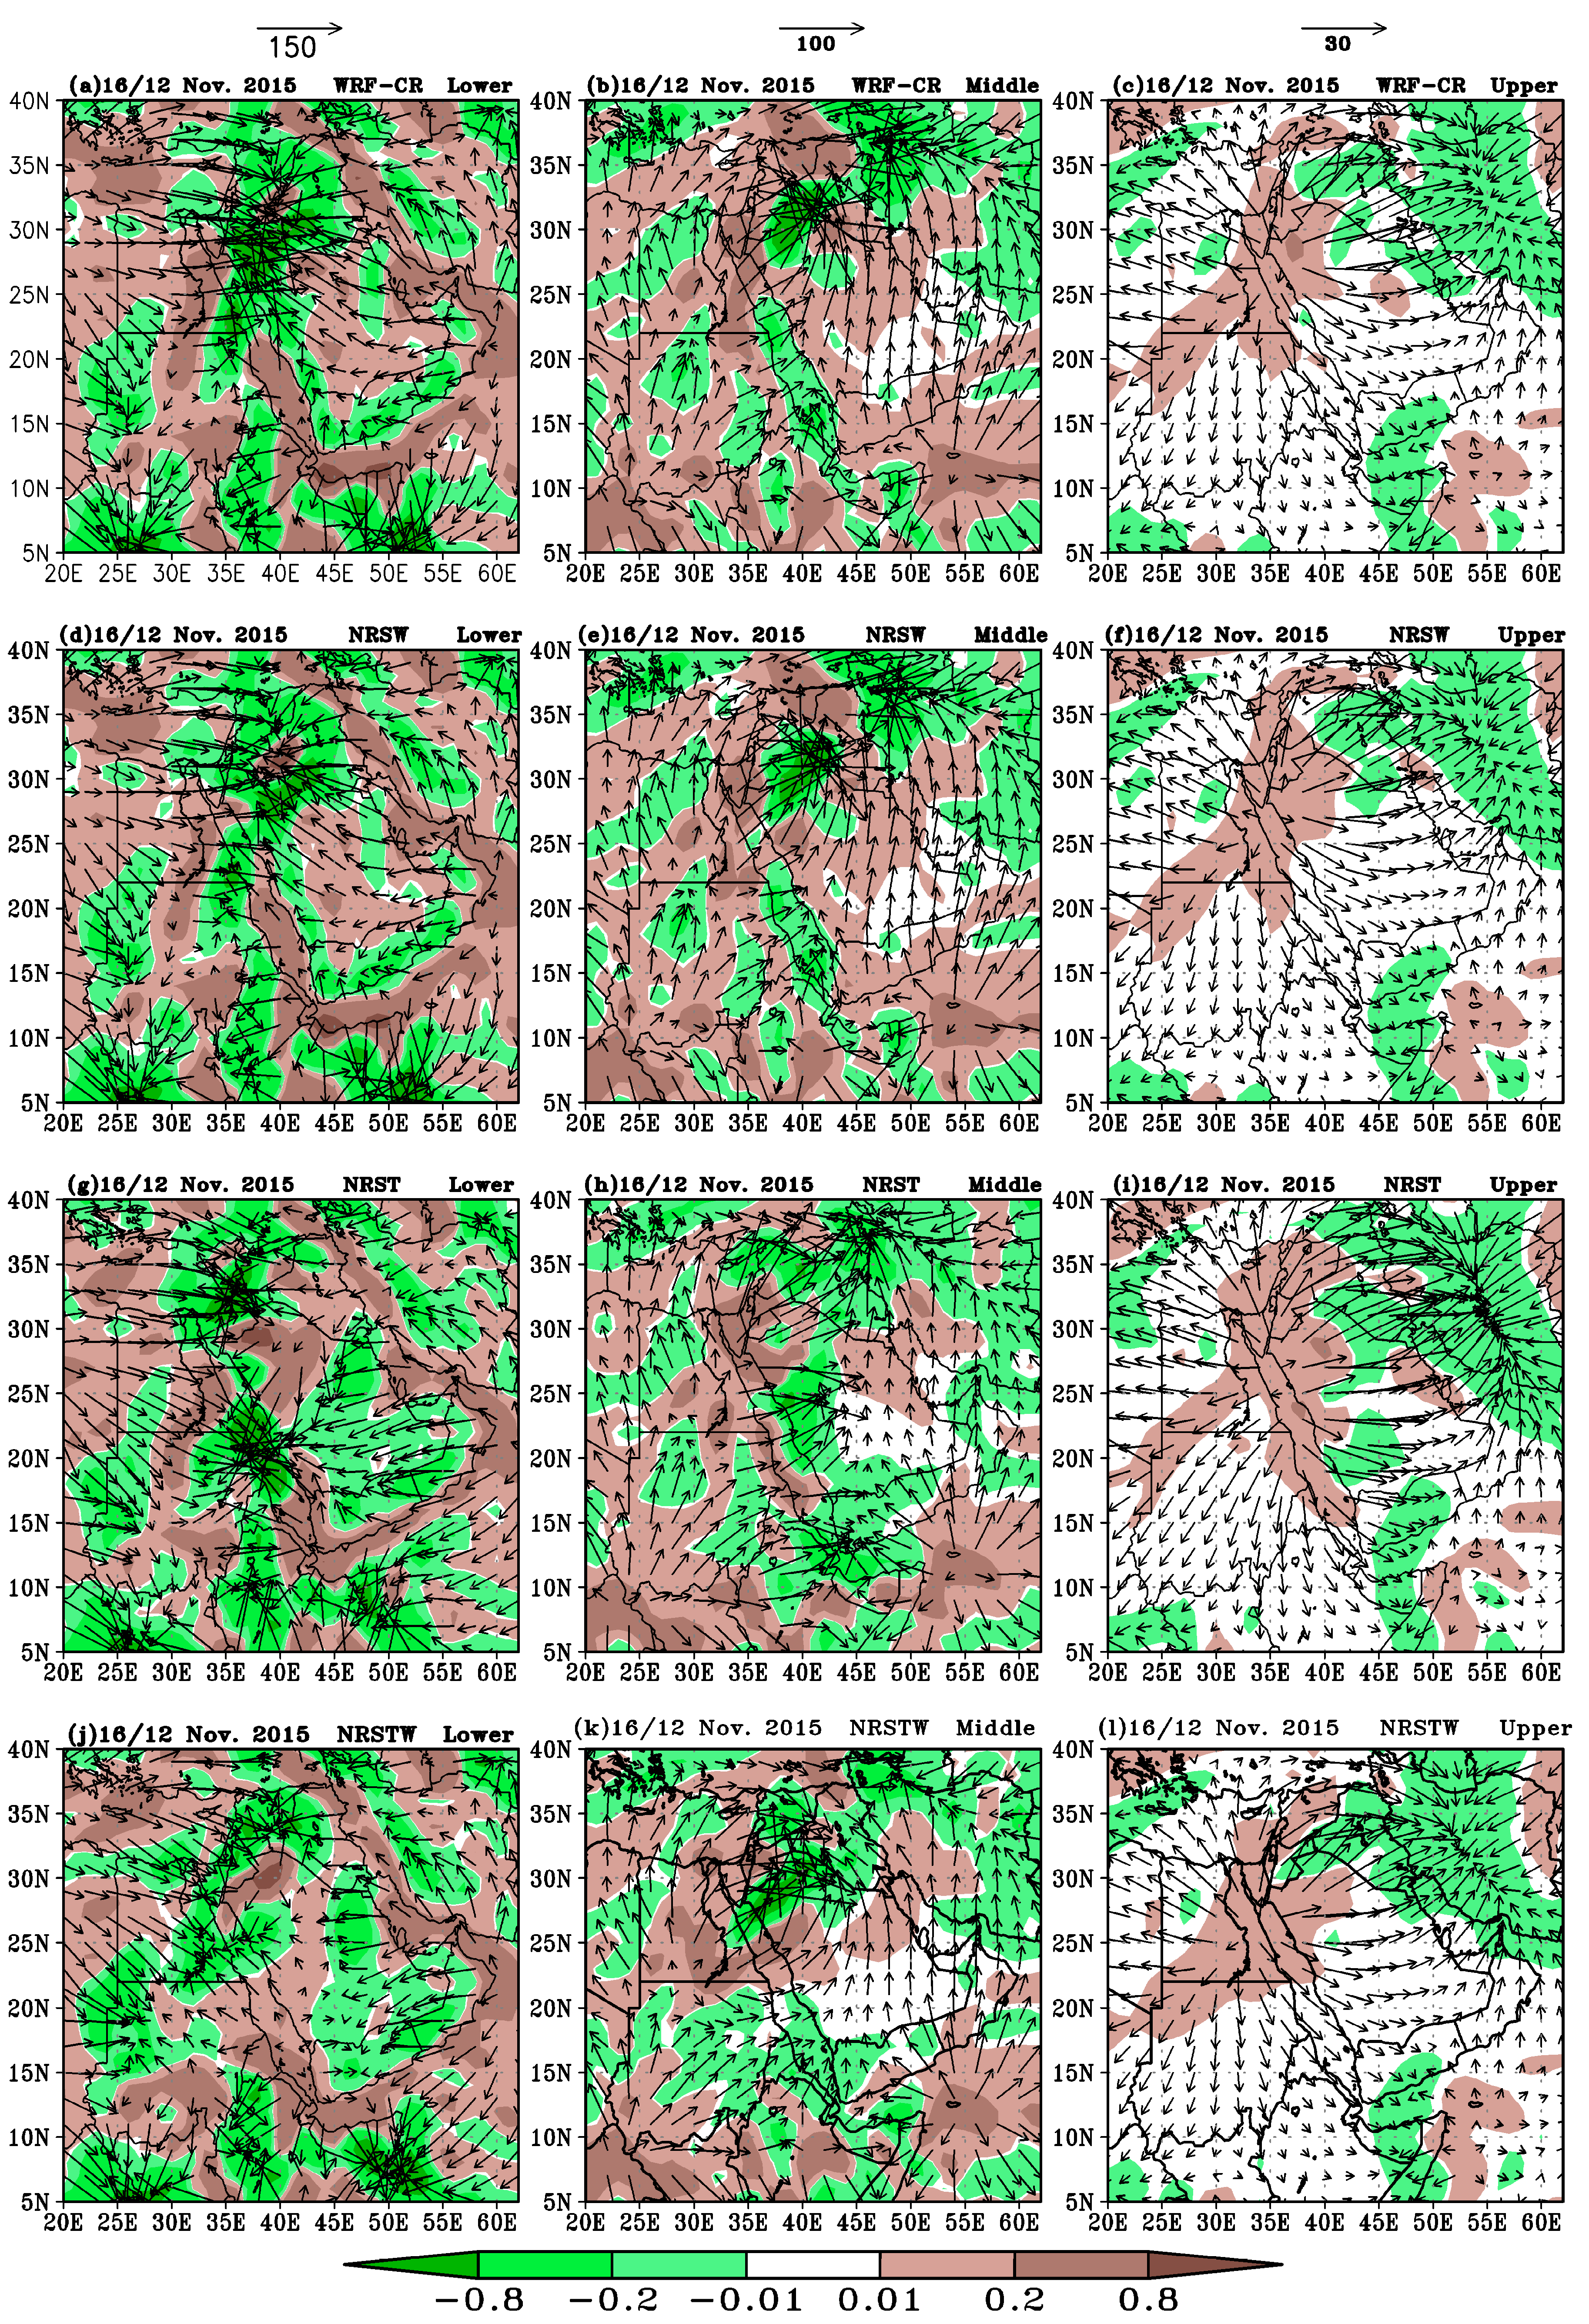
4.2. Sensitivity Experiments

To investigate and understand the influence of the Red Sea topography and water in the development of our cyclonic system, three sensitivity experiments were performed: (i) no Red Sea topography (NRST), (ii) no Red sea water (NRSW), and (iii) no Red Sea topography nor water (NRSTW). The three sensitivity experiments throughout the current study were performed with a broader and more comprehensive perspective.

4.2.1. The Simulated Rainfall Patterns

The spatial distribution of accumulated daily rainfall during the period 15–18 November 2015 arising from the three WRF sensitivity experiments (NRST, NRSW and NRSTW) are presented in Figure 9. It can be seen that, on 15 November, the spatial distribution and amount of rainfall in the northwest of the study area (northern part of Libya and northwest of Egypt) of the three WRF sensitivity experiments (Figure 9a–c) were very similar to those from the WRF-CR (Figure 6b). On the other hand, the pattern of rainfall over the Red Sea surrounding area and Saudi Arabia was strongly influenced by the modifications in the Red Sea features and varied from experiment to experiment in the study period of 15–18 November 2015. The results of the NRSW experiment show that the spatial distribution of rainfall pattern (Figure 9a,d,g,j) was generally similar to those from the WRF-CR (Figure 6b,d,f,h) over the study area through all days from 15–18 November 2015. Although there is a similarity in rainfall pattern, its daily amount decreased by 30–40 mm at a maximum area of rainfall over Saudi Arabia, especially on 16 and 17 November. The area average rainfall values over the domain (22–30° E, 33–39° N) on 16 November for the WRF-CR and TRMM were 17.2 and 11.6 mm, respectively. The area average rainfall values over the domain (18–26° E, 36–41° N) at 17 November for the WRF-CR and TRMM were 11.8 and 7.4 mm, respectively.
With respect to the NRST experiment, it was found that there is a clear and great difference in rainfall locations and amount (Figure 9b,e,h,f) compared to WRF-CR (Figure 6b,d,f,h) during the period 15–18 November 2015. It was observed that the pattern of rainfall location and amount were concentrated only over and along the Red Sea (15–25° N) and reached to about 120 mm. The maximum rainfall amount over land (Saudi Arabia) did not exceed 10–15 mm during the period of 15–18 November 2015. The simulation of the third WRF sensitivity experiment (NRSTW) revealed that there was a clear difference in rainfall location and amount from WRF-CR on 15 November, while there was a similarity in rainfall location on 16 November, especially over the eastern part of the Mediterranean and the north west of Saudi Arabia (Figure 9c,f,i,l). The maximum rainfall value appeared over Egypt, and was less than 60 mm; the maximum value over Saudi Arabia was less than 30 mm on 15 and 16 November 2015. Additionally, the simulated rainfall from NRSTW sensitivity experiment different in the location and amount as compared with the WRF-CR at 17 November, where there was no rainfall over the Red Sea and the middle of Saudi Arabia. On 18 November, the NRSTW experiment illustrated that there was a difference in rainfall amount over the west of Iran.
Generally, it is clear from the above results that the exclusion of Red Sea water (NRSW) causes a small difference in the location and amount of rainfall pattern over the study area, while the exclusion of Red Sea topography (NRST) causes a big difference especially over the Red Sea. Finally, the exclusion of Red Sea water and topography together (NRSTW) causes a considerable difference in the location and amount of rainfall pattern. To explain the above results, we will discuss the synoptic patterns and the most relevant atmospheric variables associated with the three experiments (NRSW, NRST, and NRSTW) during the period of study.

4.2.2. The Simulated Synoptic Patterns

The nature of the Red Sea (Orographic and Water) significantly interacts with the atmospheric airflows and it plays a major role in the cyclogenesis process and development of mesoscale convective systems associated with thunderstorms and heavy rainfall. This meaning originated not only as a result of changes in the rainfall distribution and amount, but also due to the variation in the prevailing weather systems under the new adjustments in the Red Sea features. From the analysis of the surface and upper air synoptic charts, it was found that most of the new changes in the cyclogenesis pattern and weather system occurred in the lower tropospheric layer (1000 and 850 hPa), where it contains Red Sea mountains. The synoptic pattern charts of 1000 and 850 hPa that resulted from the three WRF sensitivity experiments simulations are presented in Figure 10 and Figure 11, respectively.
In case of NRSW (Figure 10a,d,g,j), it was found that there was no significant difference between the synoptic pattern of 1000 hPa with the corresponding of WRF-CR (Figure 7a,d,g,j) throughout the period of study. On 16 and 17 November, the small difference appeared in the northward extension of RST with a weak deepening, especially over the northeast of the Arabian Peninsula. On 17 November, the RST moved to the east and northeast of the Arabian Peninsula. On 18 November, the synoptic patterns on the surface and upper air were similar to that of the WRF-CR. This small variation in the synoptic patterns of the WRF-CR from the NRSW experiment in the lower and upper levels interpolated the small differences in the location and amount of rainfall throughout the period of study. The comparison between Figure 11a,d,g,j and Figure 7b,e,h,k illustrates that there was no difference in the synoptic pattern of 850 hPa in case of the NRSW experiment and those corresponding resulting from WRF-CR experiment. This means that the absence of Red Sea water (NRSW) did not lead to changes in the pattern of cyclonic system, but its influence was shown in reducing the amount of rainfall.
In the case of NRST (Figure 10b,e,h,k), on 15 November, the difference from the WRF-CR (Figure 7c,f,i,l) appeared in the horizontal extension (east–west) of the RST south latitude 20° N associated with a weakening in geopotential gradient (tracing the contour line 120 gpm). On 16 November, the main feature was the strong squeezing of RST around the Red Sea that tended to increase in geopotential and temperature gradient around the Red Sea (to be centered over the Red Sea). The same pattern continued on 17 November with eastward movement, with a cut-off low formulated over the east of the Mediterranean. On 18 November, the RST shifted more to the east, with a considerable geopotential and temperature gradient over the Red Sea and Saudi Arabia.
The analysis of 850 hPa charts (Figure 11b,e,h,k) illustrated that on 15 November the cut of low associated with the upper trough in the case of the NRST experiment was weaker than those corresponding to the results from the WRF-CR experiment (Figure 7b,e,h,k) and is about five longitudes behind it to the east, where the first lies north of Egypt, while the second lies north of the Red Sea. Generally, this situation continued during 16–18 November, where we found that the low, in case of the NRST, moved slower than those in the WRF-CR experiment and the distance between their centers reached 10 longitudes. It is interesting to note that the upper trough in case of NRST usually extended southeastward, reaching the middle and south of the Red Sea. This situation of the upper trough led to an increase of successive cold advection from eastern Asia (north of 45° N) and also a strong advection of the warm moist air south of the Arabian sea and the Indian ocean, producing conditional instability on south and middle Red Sea and its environment. This resulted in strong convective activity associated with a heavy rainfall event.
The NRSTW sensitivity experiment has been made to illustrate the influence of Red Sea water and topography together on the rainfall pattern and amount during the period of study. Figure 10, right column, presents the simulated synoptic patterns from the NRSTW experiment on 1000 hPa. The major characteristic on the 1000 hPa charts is the obvious weakening in RST; it extended horizontally to the east of the Arabian Peninsula and the west of the Red Sea. Strong weakening occurred in the RST during the period of 16–18 November, associated with a strong decrease in geopotential and temperature gradients; the contour lines and isotherms became zonal.
The comparison between the 850 hPa charts of the NRSTW and WARF-CR experiments (Figure 11c,f,i,l and Figure 7b,e,h,k) illustrate that on 15 November, the cut-off low associated with the upper trough in case of NRSTW experiment disappeared. Additionally, the geopotential height increased over Egypt, east of the Mediterranean, and Saudi Arabia, with a decrease in temperature gradient over these areas. During the period of 16–18 November, we found that the upper trough in the case of the NRSTW weakened, shifted northward, and moved slightly slower than those in the WRF-CR experiment.

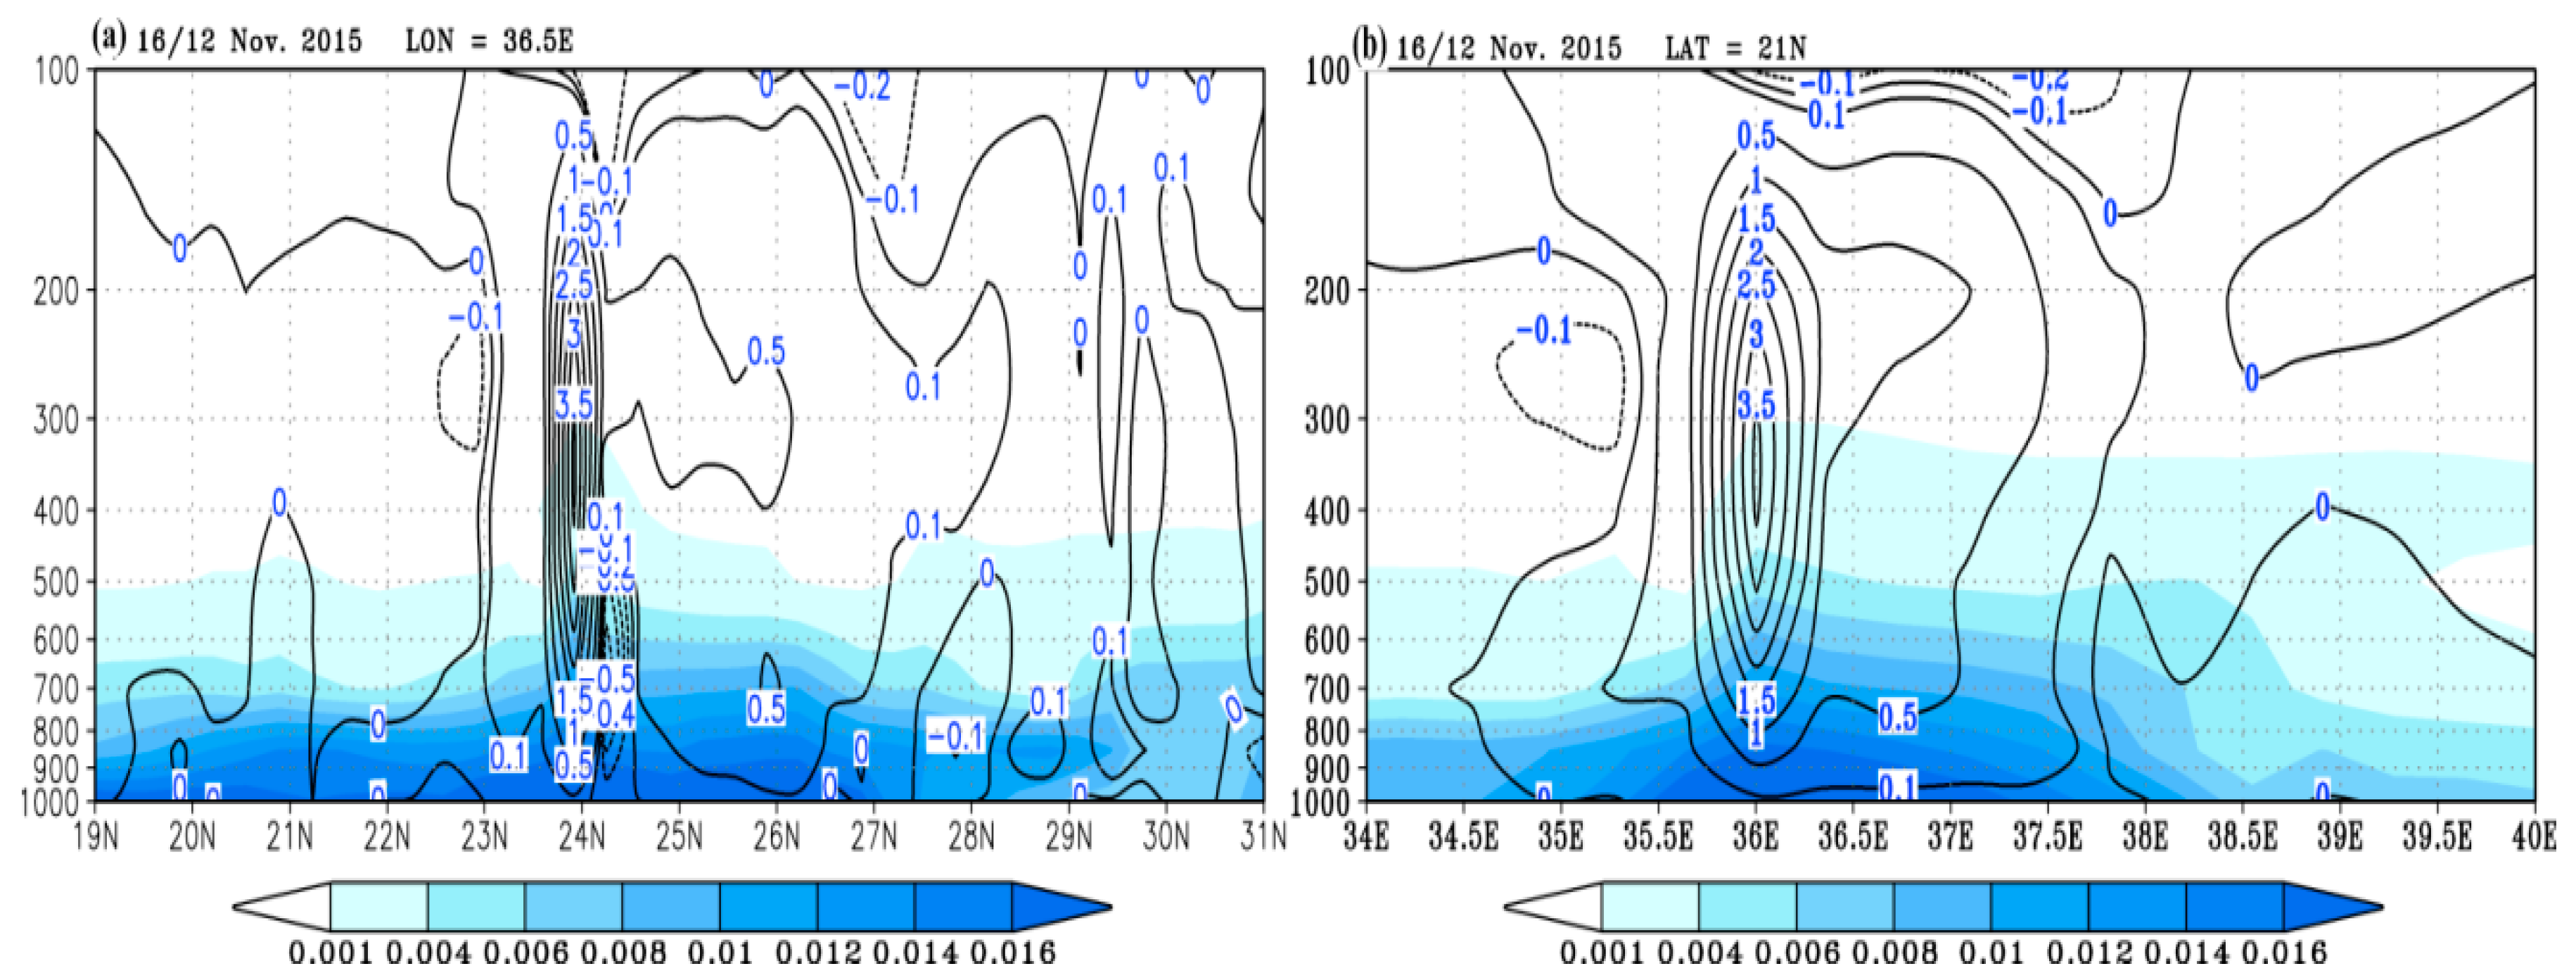
4.2.3. Moisture Flux Variation

To clarify the influence of Red Sea water and topography on rainfall associated with our case study, we studied the behavior of the divergent and rotational components of the total water vapor flux along with precipitable water content in the three WRF experiments (NRSW, NRST, and NRSWT). Here, the rotational component describes the atmospheric water vapor transport and the divergent component reflects the moisture source and sink region. We divided the troposphere into three layers; the lower one was taken from 1000 to 850 hPa, while the middle was taken from 700 to 500 hPa, and the upper layer from 400–100 hPa [3,28]. Figure 12 illustrates the integrated moisture flux rotational component (vector) along with precipitable water content (shaded; kg m−1 s−1) in the three tropospheric layers for the WRF-CR (first row) and the three WRF experiments (second, third, and fourth rows) on 16 November 2015. It is clear that there was no significant difference between the WRF-CR and NRSW experiments in the lower and middle tropospheric layers, while in the upper layer, the moisture flux increased with small values of about 6 kg m−1 s−1 in the northern part of Saudi Arabia. A significant difference was observed in the other two WRF sensitivity experiments (NRST and NRSWT), where the role of NRST and NRSWT was very obvious, especially in the lower tropospheric layer. For WRF-CR, the moisture flux rotational component in the lower layer of south Saudi Arabia moved westward until it reached the Red Sea then changed its direction to the north to transport moisture from the Indian Ocean and Arabian Sea (including the south of the Red sea, the north of Ethiopia, and the middle of Sudan) to the north and northwest of Saudi Arabia, accompanied by heavy rainfall. This dynamical pattern changed in the NRST and NRSWT experiments, where the rotational wind over the south of the Arabian Peninsula due to the absence of Red Sea terrain extended westward more than in the WRF-CR. It reached to about 25° E (over Sudan) and then moved northward and northeastward, carrying a large amount of moisture above the Red Sea and the northwest of Saudi Arabia. This southern moisture flux prevailed over the Rea Sea and most parts of the west and north of Saudi Arabia, causing heavy rainfall over most of these regions. Although there was a large significant difference between this scenario (WRF-CR) and the others two scenarios (NRST and NRSWT) in the lower tropospheric layer (in the moisture flux rotational component and precipitable water content), there was no significant difference in the upper tropospheric layer, except the value of the moisture amount.
On the other hand, Figure 13 presents the divergent integrated moisture flux along with the divergent (source) and convergent (sink) moisture flux in the three tropospheric layers for the WRF-CR, NRSW, NRST, and NRSWT experiments for 16 November 2015. Generally, it is interesting to note that the convergence areas in the lower and middle tropospheric layers coincided with the divergence areas in the upper layer (and vice versa).
Figure 13a shows the presence of a strong convergence area over the north and northwest of Saudi Arabia on the lower layer. In the middle layer, there was a convergence area over the north of Saudi Arabia (south of Jordan and central Iraq) (Figure 13b). In the upper layer, there was a strong divergence area north of the Red Sea and Saudi Arabia (Figure 13c). Figure 13d–f illustrate the horizontal distribution of the convergence and divergence areas in the three layers of the first scenario (NRSW). It is clear that there was a consistence in the locations of the areas of convergence and divergence with the results of WRF-CR, while the difference appeared in the values of convergence and divergence on the three layers. The results of the second scenario (NRST) indicate that the areas of convergence and divergence were different from that corresponding in NRSW, where Figure 13g shows the existence of a strong convergence area in the lower layer above the Red Sea (15–25° N). In the middle layer, there was an area of weak convergence in the middle west of Saudi Arabia (Figure 13h). In the upper layer, there was a strong divergence area over the Red Sea and the east of Saudi Arabia, extending from 15° N to the southeast of the Mediterranean (Figure 13i). The results of the third scenario (NRSWT) were different from the previous two scenarios (NRSW, NRST), as there was a weak convergence area over the center of the Red Sea and a weak divergence over the north of Saudi Arabia (Figure 13j). In the middle layer, there was a strong convergence area north of the Red Sea and Saudi Arabia (southeast of Mediterranean) (Figure 13k), while in the upper layer, the area of divergence dominated the north of the Red Sea and the northwest of Saudi Arabia, and extended to the east and southeast of Egypt (Figure 13l).
On 17 November, there was an eastward movement of the divergent and convergent areas over the east Mediterranean and the Arabian Peninsula (not shown). There, it was found that the main convergent area at the lower layer appeared over the northeast of the Arabian Peninsula, and the convergence area appeared over the middle and southeast of Saudi Arabia in the lower layer. In the middle layer, there was a divergent area in the north of Saudi Arabia, which started from the center of the Red Sea and extended to the northeast of Saudi Arabia, Iraq, and the northeast of Iran; there was another area of convergence over the Empty Quarter in Saudi Arabia (not shown).
In the upper layer, the area of divergence extended northeast from the center of the Red Sea to central Iran. The analysis of the horizontal distribution of convergence and divergence areas on the three layers of the first scenario (NRSW) illustrate that there was a consistence in the locations of the areas of convergence and divergence with the results of WRF-CR (not shown); the differences appeared only in the values of convergence and divergence in the three layers.
The spatial distribution of the convergence and divergence areas in the three layers of the second scenario (NRST) shows that there was a difference in the distribution of divergence and convergence areas in the three different layers in the case of NRST from the WRF-CR and NRSW (not shown), where there was an area of convergence over the meridional center of Saudi Arabia that extended north from the south of the Red Sea to the northeast of Saudi Arabia (over Syria and Iraq) in the lower layer. Divergence appeared over the Red sea and the west of Saudi Arabia in the middle layer. For the upper atmospheric layer, there was a strong divergence area that extended from the southwest of Saudi Arabia and the Red Sea to the northeast of Saudi Arabia (not shown). In the NRSWT scenario, it was found that the location of the divergence and convergence areas was differ from that corresponding in the WRF-CR, NRST, and NRSW, especially in the lower and middle layers (not shown). On 18 November (not shown) the interested area of convergence on the lower and middle levels appeared over Iran in association with the movement and location of the cyclone. Over this area, in the upper layer, there was a strong divergence area; this appeared with the WRF-CR and the other scenarios, with maximum divergence values in the NRST scenario.

5. Remarks and Discussion

The circulation patterns of 1000 and 850 hPa simulated by the WRF model in the three sensitivity experiments (NRST, NRSW, and NRSTW) are presented in Figure 10 and Figure 11 and discussed in association with WRF-CR in Section 4.2.2. From the control experiment (Figure 12a), it was found that the low level jet (LLJ), which transports the warm moist air to Red Sea, north of Saudi Arabia and adjacent areas, created conditional instability, which increased the extensive vertical motion associated with strong convergence in the lower layer (Figure 13a), and thus, caused heavy rainfall on these regions, as discussed in Section 4.2.3. Figure 14 shows the rotational component of the integrated moisture-flux for (a) WRF-CR, (b) NRSW, (c) NRST, and (d) NRSTW, along with the precipitable water content in the lower tropospheric layer (1000–850 hPa) for 12:00 UTC 16 November 2015. The figure illustrates the difference between the strength of LLJ and the amount of precipitable water content of the four experiments. Figure 15 illustrate the Meridional (at longitude 36.5° E) and zonal (at latitude 21° N) cross sections of vertical velocity along with water vapor mixing ratio for NRST run at 12:00 UTC 16 November 2015. It indicates the strong vertical velocity over the lower convergence area in the middle of Red Sea region.
The analysis of 1000 and 850 hPa in case of NRST (Figure 10 and Figure 11, middle column) illustrate that the absence of topography causes a strong squeezing of RST on the surface, associated with increasing the geopotential and temperature gradients, which enhance the southward wind (LLJ) over the Red Sea (Figure 12g and Figure 14c), carrying a huge amount of moisture to the middle and north of Red Sea. Additionally, the absence of the topography permitted the northwestern wind to extend southward to meet with the LLJ above the Red Sea (15–25° N). This led to the formation of a strong convergence in the lower and middle layers, while in the upper layer there was strong divergence. As a result, a strong upward motion (Figure 15a,b) occurred above the convergence area in the lower and middle layers, which contributed to the construction of towering clouds by enhancing the vertical motion and the LLJ (Figure 14c) that maintains the supply of moisture and heat in the area. The above analysis illustrates why the amount of rainfall in the NRST experiment was greater than that of the control experiment. This situation continued on 17 November, while on 18 November, the system moved northeastward.
In case of NRSW, the analysis of 1000 and 850 hPa (Figure 10 and Figure 11, left column) shows that there was a small variation in the synoptic patterns of the NRSW from WRF-CR experiment, which interpolated the small differences in the location and amount of rainfall during the period of study. In the NRSW experiment, the lower layer circulation concentrated on the Red Sea indicates a reduced wind speed (Figure 12d) compared to the WRF-CR (Figure 12a). Additionally, the weakening of the heat and moisture content in the lower layer caused a decrease in the convection on the Red Sea. The dissimilarity between the NRSW experiment and WRF-CR was evident in terms of the weakening in the extended subtropical eastern jet and reduction in wind speed to 12 m s−1 (Figure 12d). Besides the systematic warming due to the latent heat release in the atmosphere, the upper air trough and the associated cold advection were less extended southward. For NRSW, a weak LLJ tended to show less flow of heat and moisture at the low-level. The position of the significant upward motion shifted more eastward in the eastern side of the Red Sea above the center of the convergence zone (22° N, 32° E) (Figure 13d).
In the case of the NRSTW experiment, it was found that the major characteristic on 1000 hPa charts was the obvious weakening in the RST, associated with a strong decrease in geopotential and temperature gradients; moreover, the contour lines and isotherms became zonal. In the upper layer, the upper trough weakened shifted northward, and moving slightly slower compared to its corresponding trough in the WRF-CR experiment. The considerable difference between the WRF-CR and NRSTW experiments was evident in terms of the (weakening in the) extended subtropical eastern jet to reach the middle and west of Sudan with a reduction in the southern LLJ speed (Figure 12j). Additionally, it is clear that the amount of moisture associated with the southern LLJ was less than that of the WRF-CR, which shows the decrease in rainfall in the NRSTW experiment.

6. Conclusions

The aim of this work was to investigate the impact of removing Red Sea features (topography, water and their combination) on rainfall intensity and spatial distribution over Saudi Arabia. The nonhydrostatic Weather Research and Forecasting (WRF) model was utilized to simulate the extreme precipitation event on 16–18 November 2015, over the middle and north of Saudi Arabia. The simulated rainfall in the control experiment was in agreement with the Tropical Rainfall Measurement Mission (TRMM) rainfall estimates in terms of intensity and horizontal distribution. The role of Red Sea topography and water was investigated during the development of the extreme precipitation event. For this purpose, three additional sensitivity experiments were carried out: the first without topography (NRST), the second without Red Sea Water (NRSW), and the third without Red Sea topography and Water (NRSTW).
The synoptic analysis and the results of the WRF-CR experiment illustrate that this strong rainfall event was characterized by the interaction between the upper air cold trough associated with a Mediterranean cyclone above the east of the Mediterranean and the lower-level Red Sea trough, leading to the intensification of the southward LLJ over the Red Sea. This LLJ advected the southern humid air from the Arabian Sea and the Red Sea towards northern Saudi Arabia and its neighboring. The results indicate that the convergence of the southern warm humid air in the low-level in addition to the complex terrain in the region has played an important role in provoking convection and associated rains on northern Saudi Arabia and its neighboring regions.
The results show that the absence of topography played an unexpected role in determining the spatial distribution and intensity of the extreme rainfall over the middle and north of Saudi Arabia. The absence of topography led to the formation of a strong convergence area over the middle of the Red Sea, which enhanced the uplift motion that further strengthened the low-level jet over the Red Sea and the surrounding regions. This enhanced the moisture and temperature gradient and created a conditionally unstable atmosphere that favored the development of the cyclonic system.
The warming of the lower layer by transferring heat and moist air from the warm Red Sea enhanced the convection system. The absence of Red Sea water (NRSW) changed the rainfall spatial distribution and reduced its amount by about 30–40% due to affecting the dynamics of the upward motion and moisture gradient, suggesting that surface fluxes play an important role in regulating the low-level moist air convergence prior to the convection initiation and development.

Author Contributions

Conceptualization, M.A.-M. and H.A.B.; methodology, M.M.; software, A.A.; validation, H.A.B., M.M. and A.A.; formal analysis, M.A.-M.; investigation, H.A.B.; resources, M.A.-M.; data curation, A.A.; writing—original draft preparation, M.M.; writing—review and editing, H.A.B.; visualization, A.A.; supervision, M.A.-M.; project administration, M.A.-M.; funding acquisition, M.A.-M.

Funding

This research was funded by Deanship of Scientific Research at Princess Nourah Bint Abdulrahman University, grant number 39 / P / 275.

Acknowledgments

The researchers express their great thanks and appreciation to the Higher Studies and Scientific Research Agency at the University of Princess Nourah Bint Abdulrahman for their support of research project No. (39 / P / 275) and thank the Princess Nora bint Abdulrahman University for providing all the facilities to work in this research, and to all those who contributed in this study. We also thank the National Center for Atmospheric Research (NCAR) for providing the data used in this study. The authors sincerely acknowledge to NCEP for availability of reanalysis meteorological fields and NOAA for availability of rainfall observations from TRMM through their websites.

Conflicts of Interest

The funders had no role in the design of the study; in the collection, analyses, or interpretation of data; in the writing of the manuscript, or in the decision to publish the results.

References

  1. Ribó, M.; Llasat, M.C. Study of the impact of cyclogenesis at the Mediterranean Sea. In Proceedings of the 11th EGU Plinius Conference on Mediterranean Storms, Barcelona, Spain, 7–10 September 2009; Volume 11. Plinius-11-88. [Google Scholar]
  2. El-Fandy, M.G. The effect of the Sudan monsoon low on the development of thundery conditions in Egypt, Palestine and Syria. Q. J. R. Meteorol. Soc. 1948, 74, 31–38. [Google Scholar] [CrossRef]
  3. Abdeldym, A.; Basset, H.A.; Sayad, T.; Morsy, M. Kinetic energy budget and moisture flux convergence analysis during interaction between two cyclonic systems: Case study. Dyn. Atmos. Oceans 2019, 86, 73–89. [Google Scholar] [CrossRef]
  4. Haggag, M.; El-Badry, H. Mesoscale numerical study of quasi-stationary convective system over Jeddah in November 2009. Atmos. Clim. Sci. 2013, 3, 73–86. [Google Scholar] [CrossRef]
  5. Hasanean, H.; Almazroui, M. Rainfall: Features and Variations over Saudi Arabia, a Review. Climate 2015, 3, 578–626. [Google Scholar] [CrossRef]
  6. Almazroui, M.; Raju, P.V.S.; Yusef, A.; Hussein, M.A.A.; Omar, M. Simulation of extreme rainfall event of November 2009 over Jeddah, Saudi Arabia: The explicit role of topography and surface heating. Theor. Appl. Clim. 2018, 132, 89–101. [Google Scholar] [CrossRef]
  7. De Vries, A.J.; Tyrlis, E.; Edry, D.; Krichak, S.O.; Steil, B.; Lelieveld, J. Extreme precipitation events in the Middle East: Dynamics of the active Red Sea trough. J. Geophys. Res. Atmos. 2013, 118, 7087–7108. [Google Scholar] [CrossRef]
  8. El Kenawy, A.M.; McCabe, M.F.; Stenchikov, G.L.; Raj, J. Multi-decadal classification of synoptic weather types, observed trends and links to rainfall characteristics over Saudi Arabia. Front. Environ. Sci. 2014, 2, 37. [Google Scholar] [CrossRef]
  9. Deng, L.; McCabe, M.F.; Stenchikov, G.; Evans, J.P.; Kucera, P.A. Simulation of Flash-Flood-Producing Storm Events in Saudi Arabia Using the Weather Research and Forecasting Model. J. Hydrometeorol. 2015, 16, 615–630. [Google Scholar] [CrossRef]
  10. McGinley, J.; Goerss, J. Effects of terrain height and blocking initialization on numerical simulation of Alpine lee cyclogenesis. Mon. Weather. Rev. 1986, 114, 1578–1590. [Google Scholar] [CrossRef]
  11. Dell’Osso, L. High-resolution experiments with the ECMWF model: A case study. Mon. Weather. Rev. 1984, 112, 1853–1884. [Google Scholar] [CrossRef]
  12. Hughes, M.; Hall, A.; Fovell, R.G. Blocking in areas of complex topography, and its influence on rainfall distribution. J. Atmos. Sci. 2009, 66, 508–518. [Google Scholar] [CrossRef]
  13. Ntwali, D.; Ogwang, B.; Ongoma, V. The Impacts of Topography on Spatial and Temporal Rainfall Distribution over Rwanda Based on WRF Model. Atmos. Clim. Sci. 2016, 6, 145–157. [Google Scholar] [CrossRef] [Green Version]
  14. Enyew, B.D.; Steeneveld, G.J. Analysing the Impact of Topography on Precipitation and Flooding on the Ethiopian Highlands. J. Geol. Geosci. 2014, 3, 1–6. [Google Scholar] [CrossRef]
  15. Al-Khalaf, A.K.; Abdel Basset, H. Diagnostic study of a severe thunderstorm over Jeddah. Atmospheric and Climate Sciences 2013, 3, 150–164. [Google Scholar] [CrossRef]
  16. Almazroui, M. Sensitivity of a regional climate model on the simulation of high intensity rainfall events over the Arabian Peninsula and around Jeddah (Saudi Arabia). Theor. Appl. Clim. 2011, 104, 261–276. [Google Scholar] [CrossRef] [Green Version]
  17. Dee, D.P.; Uppala, S.M.; Simmons, A.J.; Berrisford, P.; Poli, P.; Kobayashi, S.; Andrae, U.; Balmaseda, M.A.; Balsamo, G.; Bauer, P.; et al. The ERA-interim reanalysis: Configuration and performance of the data assimilation system. Q. J. R. Meteorol. Soc. 2011, 137, 553–597. [Google Scholar] [CrossRef]
  18. Huffman, G.J.; Adler, R.F.; Bolvin, D.T.; Nelkin, E.J. The TRMM multi-satellite precipitation analysis (TMPA). In Satellite Rainfall Applications for Surface Hydrology; Springer: Dordrecht, The Netherlands, 2010; pp. 3–22. [Google Scholar]
  19. Chawla, I.; Osuri, K.K.; Mujumdar, P.P.; Niyogi, D. Assessment of the Weather Research and Forecasting (WRF) model for simulation of extreme rainfall events in the upper Ganga Basin Hydrol. Earth Syst. Sci. 2018, 22, 1095–1117. [Google Scholar] [CrossRef]
  20. Mohan, M.; Sati, A.P. WRF model performance analysis for a suite of simulation design. Atmos. Res. 2016, 169, 280–291. [Google Scholar] [CrossRef]
  21. Maussion, F.; Scherer, D.; Mölg, T.; Collier, E.; Curio, J.; Finkelnburg, R. Precipitation seasonality and variability over the Tibetan Plateau as resolved by the High Asia Reanalysis. J. Clim. 2014, 27, 1910–1927. [Google Scholar] [CrossRef]
  22. Rogers, E.; Black, T.; Ferrier, B.; Lin, Y.; Parrish, D.; Dimego, G. Changes to the NCEP Meso Eta Analysis and Forecast System: Increase in resolution, new cloud microphysics, modified precipitation assimilation, modified 3DVAR analysis. NWS Tech. Proced. Bull. 2001, 488, 15. [Google Scholar]
  23. Iacono, M.J.; Delamere, J.S.; Mlawer, E.J.; Shephard, M.W.; Clough, S.A.; Collins, W.D. Radiative forcing by long–lived greenhouse gases: Calculations with the AER radiative transfer models. J. Geophys. Res. 2008, 113, D13103. [Google Scholar] [CrossRef]
  24. Monin, A.S.; Obukhov, A.M. Basic laws of turbulent mixing in the surface layer of the atmosphere. Contrib. Geophys. Inst. Acad. Sci. USSR 1954, 151, 163–187. (In Russian) [Google Scholar]
  25. Dudhia, J. A multi-layer soil temperature model for MM5. In Proceedings of the Sixth PSU/NCAR Mesoscale Model Users’ Workshop, Boulder, CO, USA, 22–24 July 1996. [Google Scholar]
  26. Hong, S.Y.; Noh, Y.; Dudhia, J. A new vertical diffusion package with an explicit treatment of entrainment processes. Mon. Weather. Rev. 2006, 134, 2318–2341. [Google Scholar] [CrossRef]
  27. Kain, J.S. The Kain-Fritsch convective parameterization: An update. J. Appl. Meteorol. 2004, 43, 170–181. [Google Scholar] [CrossRef]
  28. Chakraborty, A.; Behera, S.K.; Mujumdar, M.; Ohba, R.; Yamagata, T. Diagnosis of tropospheric moisture over Saudi Arabia and influences of IOD and ENSO. Mon. Weather. Rev. 2006, 134, 598–617. [Google Scholar] [CrossRef]
Figure 1. The WRF (Weather Research and Forecasting) model domain; (a) with Red Sea water and topography (m), (b) without Red Sea water, (c) without Red Sea topography, and (d) without Red Sea topography and water. EQ refers to Equator.
Atmosphere 10 00669 g001
Figure 2. 1000 hPa geopotential height with 20 m contour intervals (blue and green solid lines) and temperature (red dashed lines) every 3 °C (ah) for the period 14–18 November 2015.
Atmosphere 10 00669 g002
Figure 3. 500 hPa geopotential height with 40 m contour intervals (blue and green solid lines) and temperature (red dashed lines) every 3 °C (ah) for the period 14–18 November 2015.
Atmosphere 10 00669 g003
Figure 4. 850 hPa geopotential height with 20 m contour intervals (black solid lines) and horizontal advection of temperature (red and blue shaded areas) (ah) for the period 14–18 November 2015.
Atmosphere 10 00669 g004
Figure 5. (a) CAPE and PW, while (b) EL, LCL, and LFC over Jeddah during the period from 09:00 UTC 14 November to 21:00 UTC 17 November 2015. (CAPE: convective available potential energy, PW: precipitable water, EL: Equilibrium Level, LFC: Level of Free Convection, LCL: Lifting Condensation Level).
Atmosphere 10 00669 g005
Figure 6. The daily spatial rainfall pattern from the TRMM dataset (a,c,e,g) and the WRF control run (b,d,f,h) for the period 15–18 November 2015.
Atmosphere 10 00669 g006
Figure 7. 1000 hPa (a,d,g,j), 850 hPa (b,e,h,k), and 500 hPa (c,f,i,l) geopotential height with 20 m contour intervals for 1000 and 850 hPa, and 40 m contour intervals for 500 hPa (blue and green solid lines), along with the temperature (red dashed lines) every 3 °C; was produced by the WRF control run at 12:00 UTC for the period 15–18 November 2015.
Atmosphere 10 00669 g007
Figure 8. The geopotential height in the trough centers of the WRF-CR and Era-Interim on (a) 1000 hPa chart and (b) 500 hPa carts during the period 00:00 UTC 15 November until 00:00 UTC 19 November 2015.
Atmosphere 10 00669 g008
Figure 9. The accumulated daily rainfall from NRSW (a,d,g,j), NRST (b,e,h,k), and NRSTW (c,f,i,l) for the period of 15–18 November 2015.
Atmosphere 10 00669 g009
Figure 10. 1000 hPa geopotential height with 20 m contour intervals (blue and green solid lines) along with the temperature (red dashed lines) every 3 °C from the NRSW (a,d,g,j), the NRST (b,e,h,k), and the NRSTW (c,f,i,l) at 12Z for the period of 15–18 November 2015.
Atmosphere 10 00669 g010
Figure 11. 850 hPa geopotential height with 20 m contour intervals (blue and green solid lines) along with the temperature (red dashed lines) every 3 °C from the NRSW (a,d,g,j), the NRST (b,e,h,k), and the NRSTW (c,f,i,l) at 12Z for the period of 15–18 November 2015.
Atmosphere 10 00669 g011
Figure 12. Rotational component of integrated moisture-flux (vector; kg m−1 s−1) for WRF-CR (ac), NRSW (df), NRST (gi), and NRSTW (jl), along with precipitable water content (shaded; mm) in the three tropospheric layers: the lower layer with 1000–850 hPa (c,f,i,l), the middle layer with 700–500 hPa (b,e,h,k), and the upper with 400–100 hPa (a,d,g,j) for 12Z on 16 November 2015.
Atmosphere 10 00669 g012
Figure 13. Divergent component of integrated moisture-flux vector for WRF-CR (ac), NRSW (df), NRST (gi), and NRSTW (jl), and the colored regions are the divergent (source) and convergent (sink) component of the moisture flux (10−3 kg m−2 s−1) in three tropospheric layers: the lower with 1000–850 hPa (a,d,g,j), the middle with 700–500 hPa (b,e,h,k), and the upper layer with 400–100 hPa (c,f,i,l) for 12Z of 16 November 2015.
Atmosphere 10 00669 g013
Figure 14. Rotational component of integrated moisture-flux (red contours, kg m−1 s−1) for (a) WRF-CR, (b) NRSW, (c) NRST, and (d) NRSTW, along with precipitable water content (shaded; mm) in the lower tropospheric layer (1000-850 hPa) on 12:00 UTC 16 November 2015.
Atmosphere 10 00669 g014
Figure 15. (a) Meridional cross section (at 36.5° E) and (b) zonal cross section (at 21° N) of vertical velocity (contour, cm s−1) and water vapor mixing ratio (shaded, kg kg−1).
Atmosphere 10 00669 g015
Table 1. The modification in the variables related to the Red Sea surface properties.
Variable NameModified Value
Soil type, Vegetation type, Sand fraction, Clay fraction, Maximum snow albedo, Dominant land use category, Soil temperature, Surface humidity mixing ratio, Surface temperature, Surface potential temperature, Skin sea surface temperature. Equal to the value of the adjacent ground point on the same latitude.
Land cover (land)1
Annual mean deep soil temperature 305.118
Dominant category top-layer soil type 6.0
Dominant category bottom-layer soil type 6.0
Monthly surface albedo 38.0
Table 2. WRF physics scheme specifications and options used in the simulations. (RRTMG: rapid radiative transfer model for GCMs).
Physics SchemeScheme SpecificationPhysics Option
Microphysics Eta (coarse)mp_physics = 95
Long-wave radiationRRTMGra_lw_physics = 4
Short-wave radiationRRTMGra_sw_physics = 4
Surface LayerMonin-Obukhovsf_sfclay_physics = 1
Land SurfaceThermal Diffusionsf_surface_physics = 1
Planetary boundary-layerYonsei University (YSU)bl_pbl_physics = 1
Cumulus ConvectionKain-Fritschcu_physics = 1

