Whole Genome Resequencing of Arkansas Progressor and Regressor Line Chickens to Identify SNPs Associated with Tumor Regression


Abstract
1. Introduction
2. Materials and Methods
2.1. Chicken Lines and DNA Preparation
2.2. Illumina Sequencing and Sequence Assembly
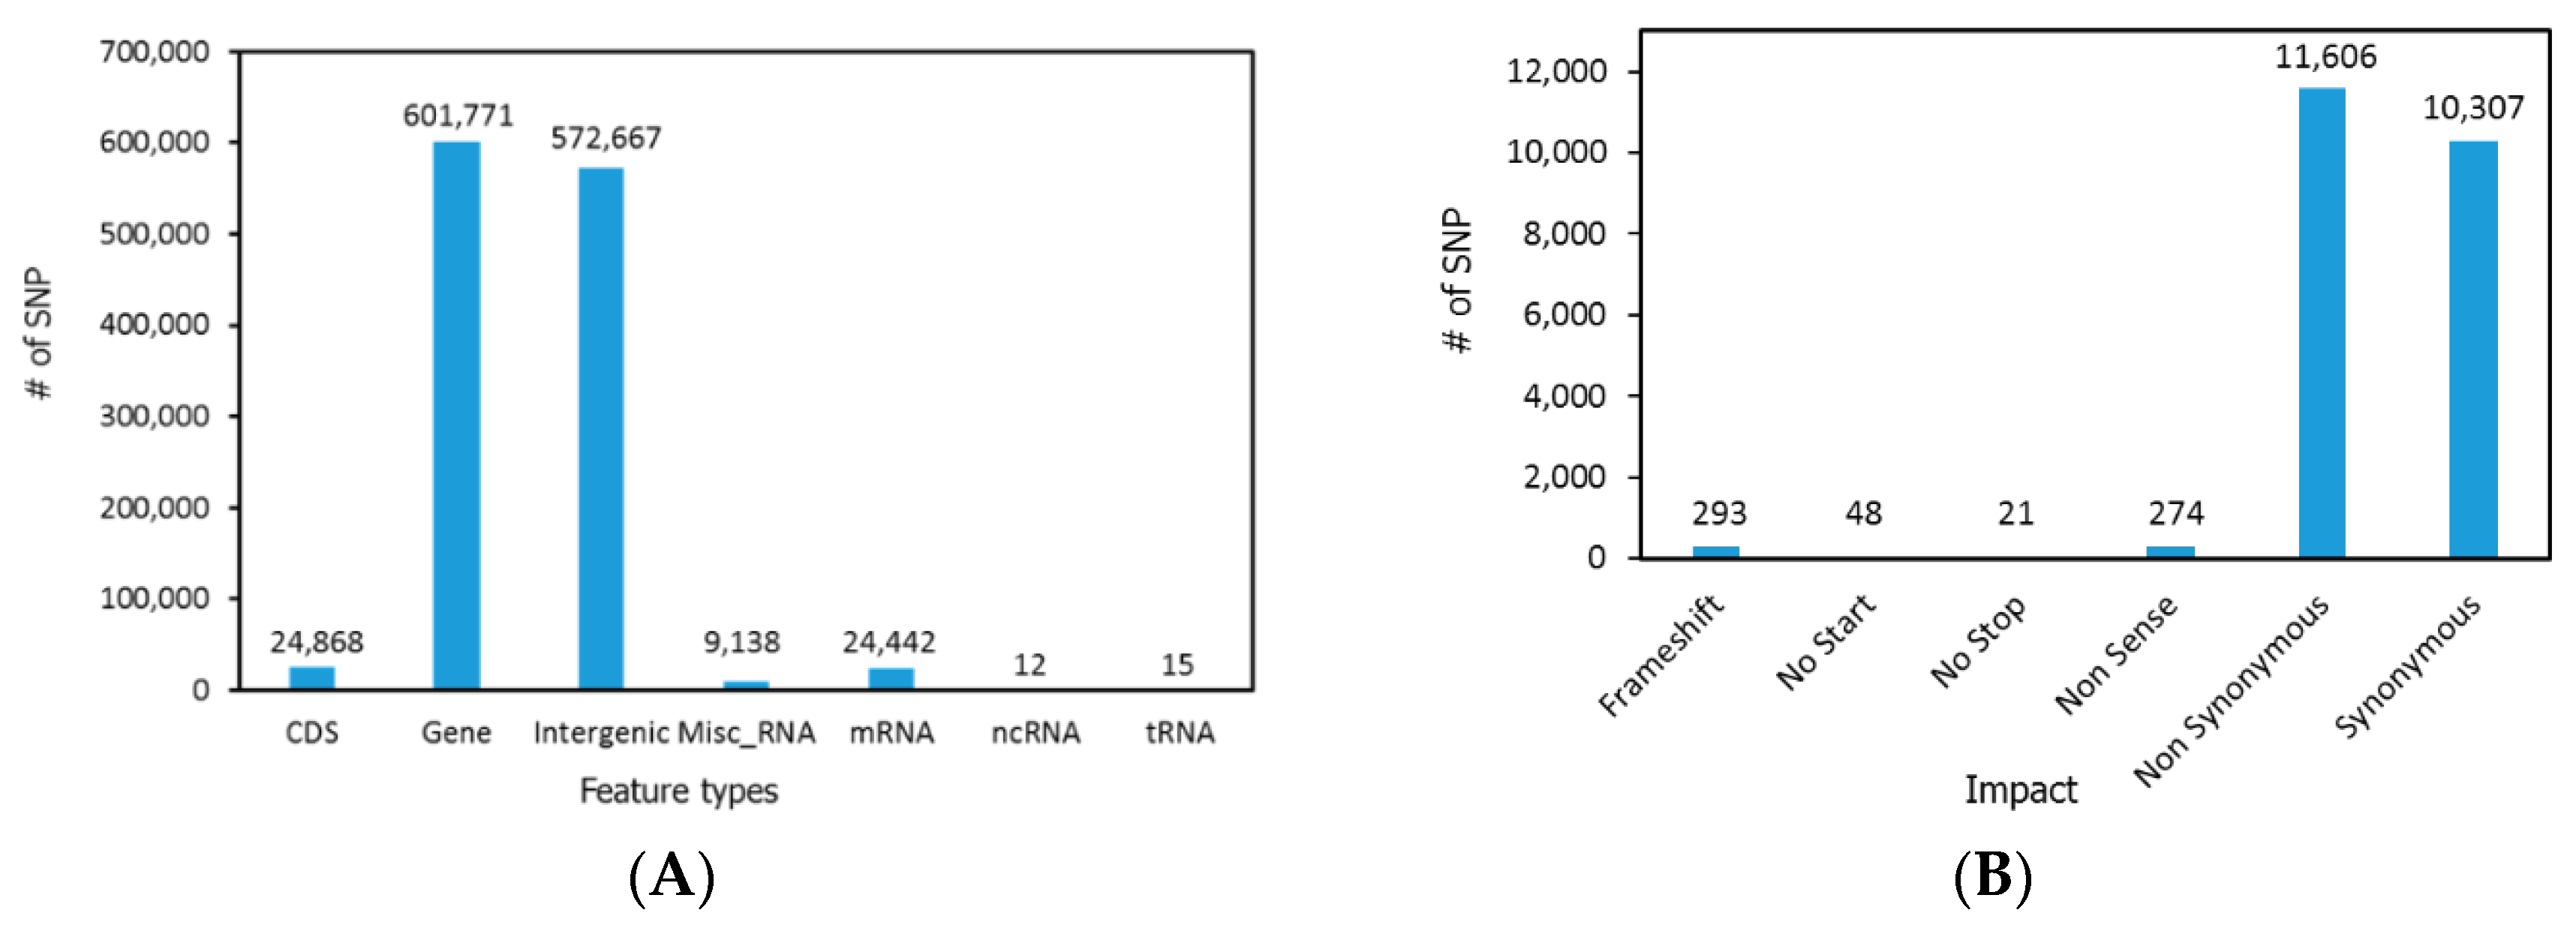
2.3. SNP Detection and Analysis
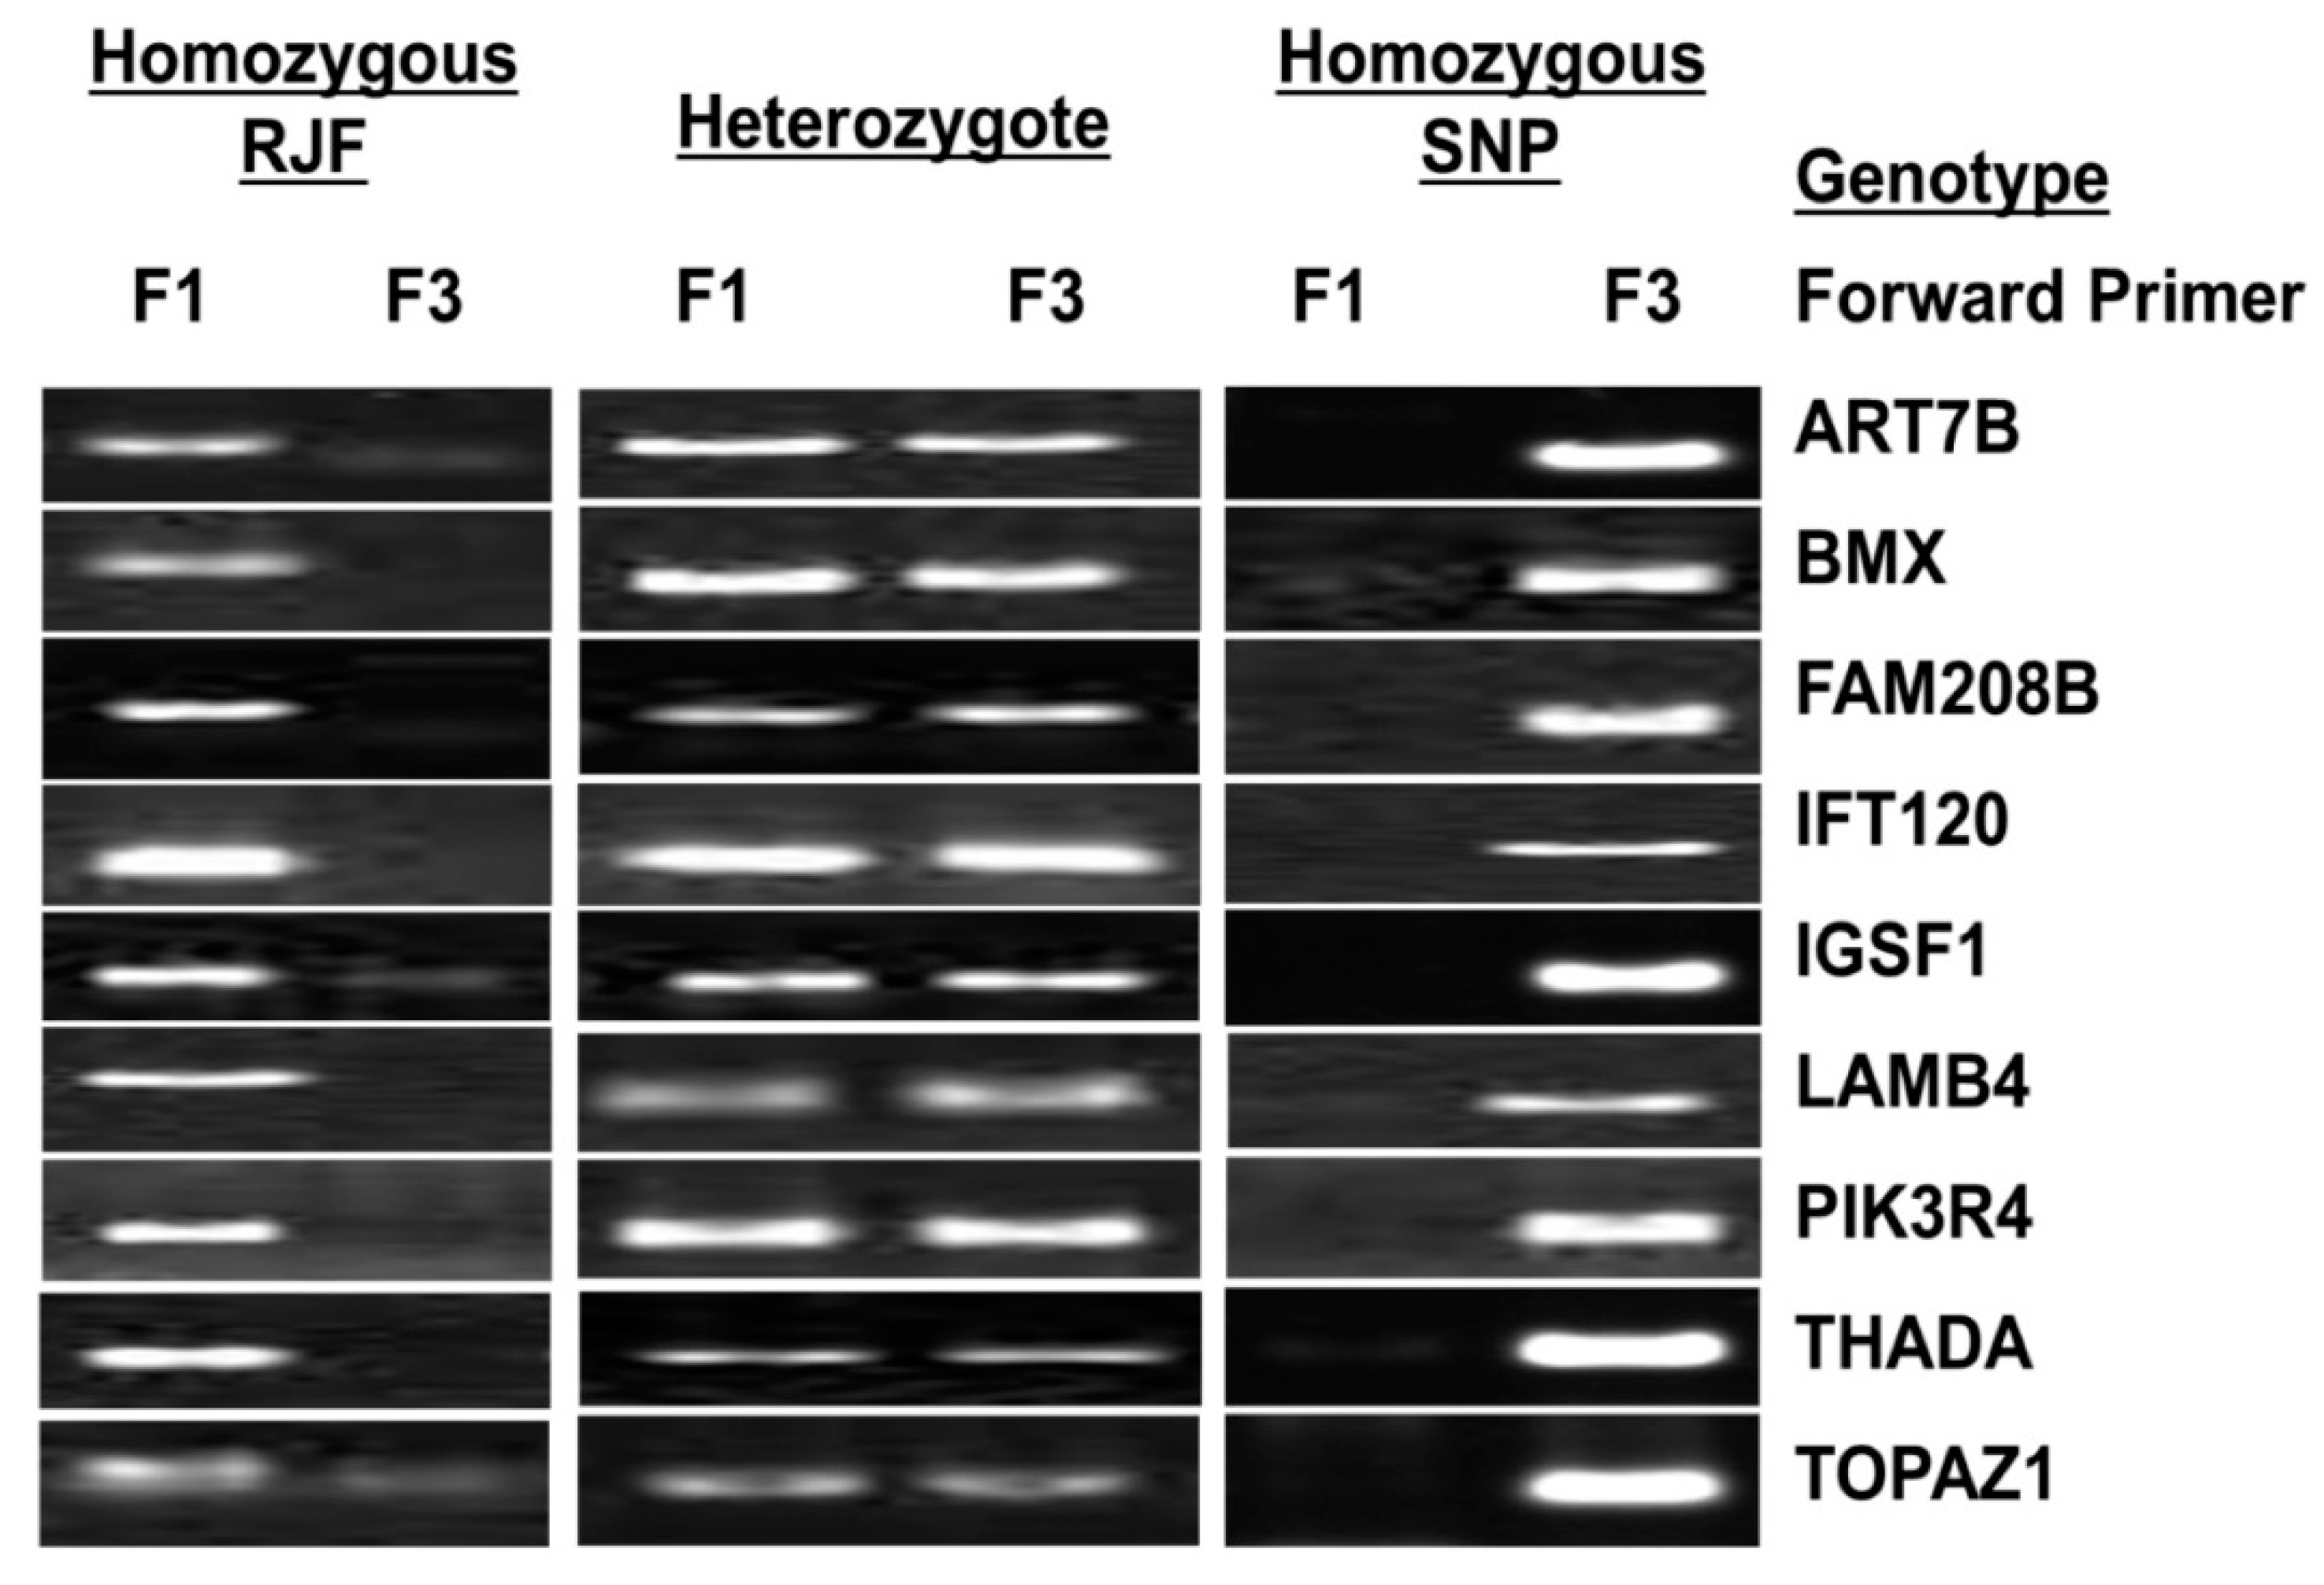
2.4. Validation of SNPs
2.5. Ingenuity Pathways Analysis
3. Results and Discussion
3.1. Genome Sequencing and Assembly
3.2. SNP Validation
3.3. Ingenuity Pathway Analysis of Candidate Causal Genes
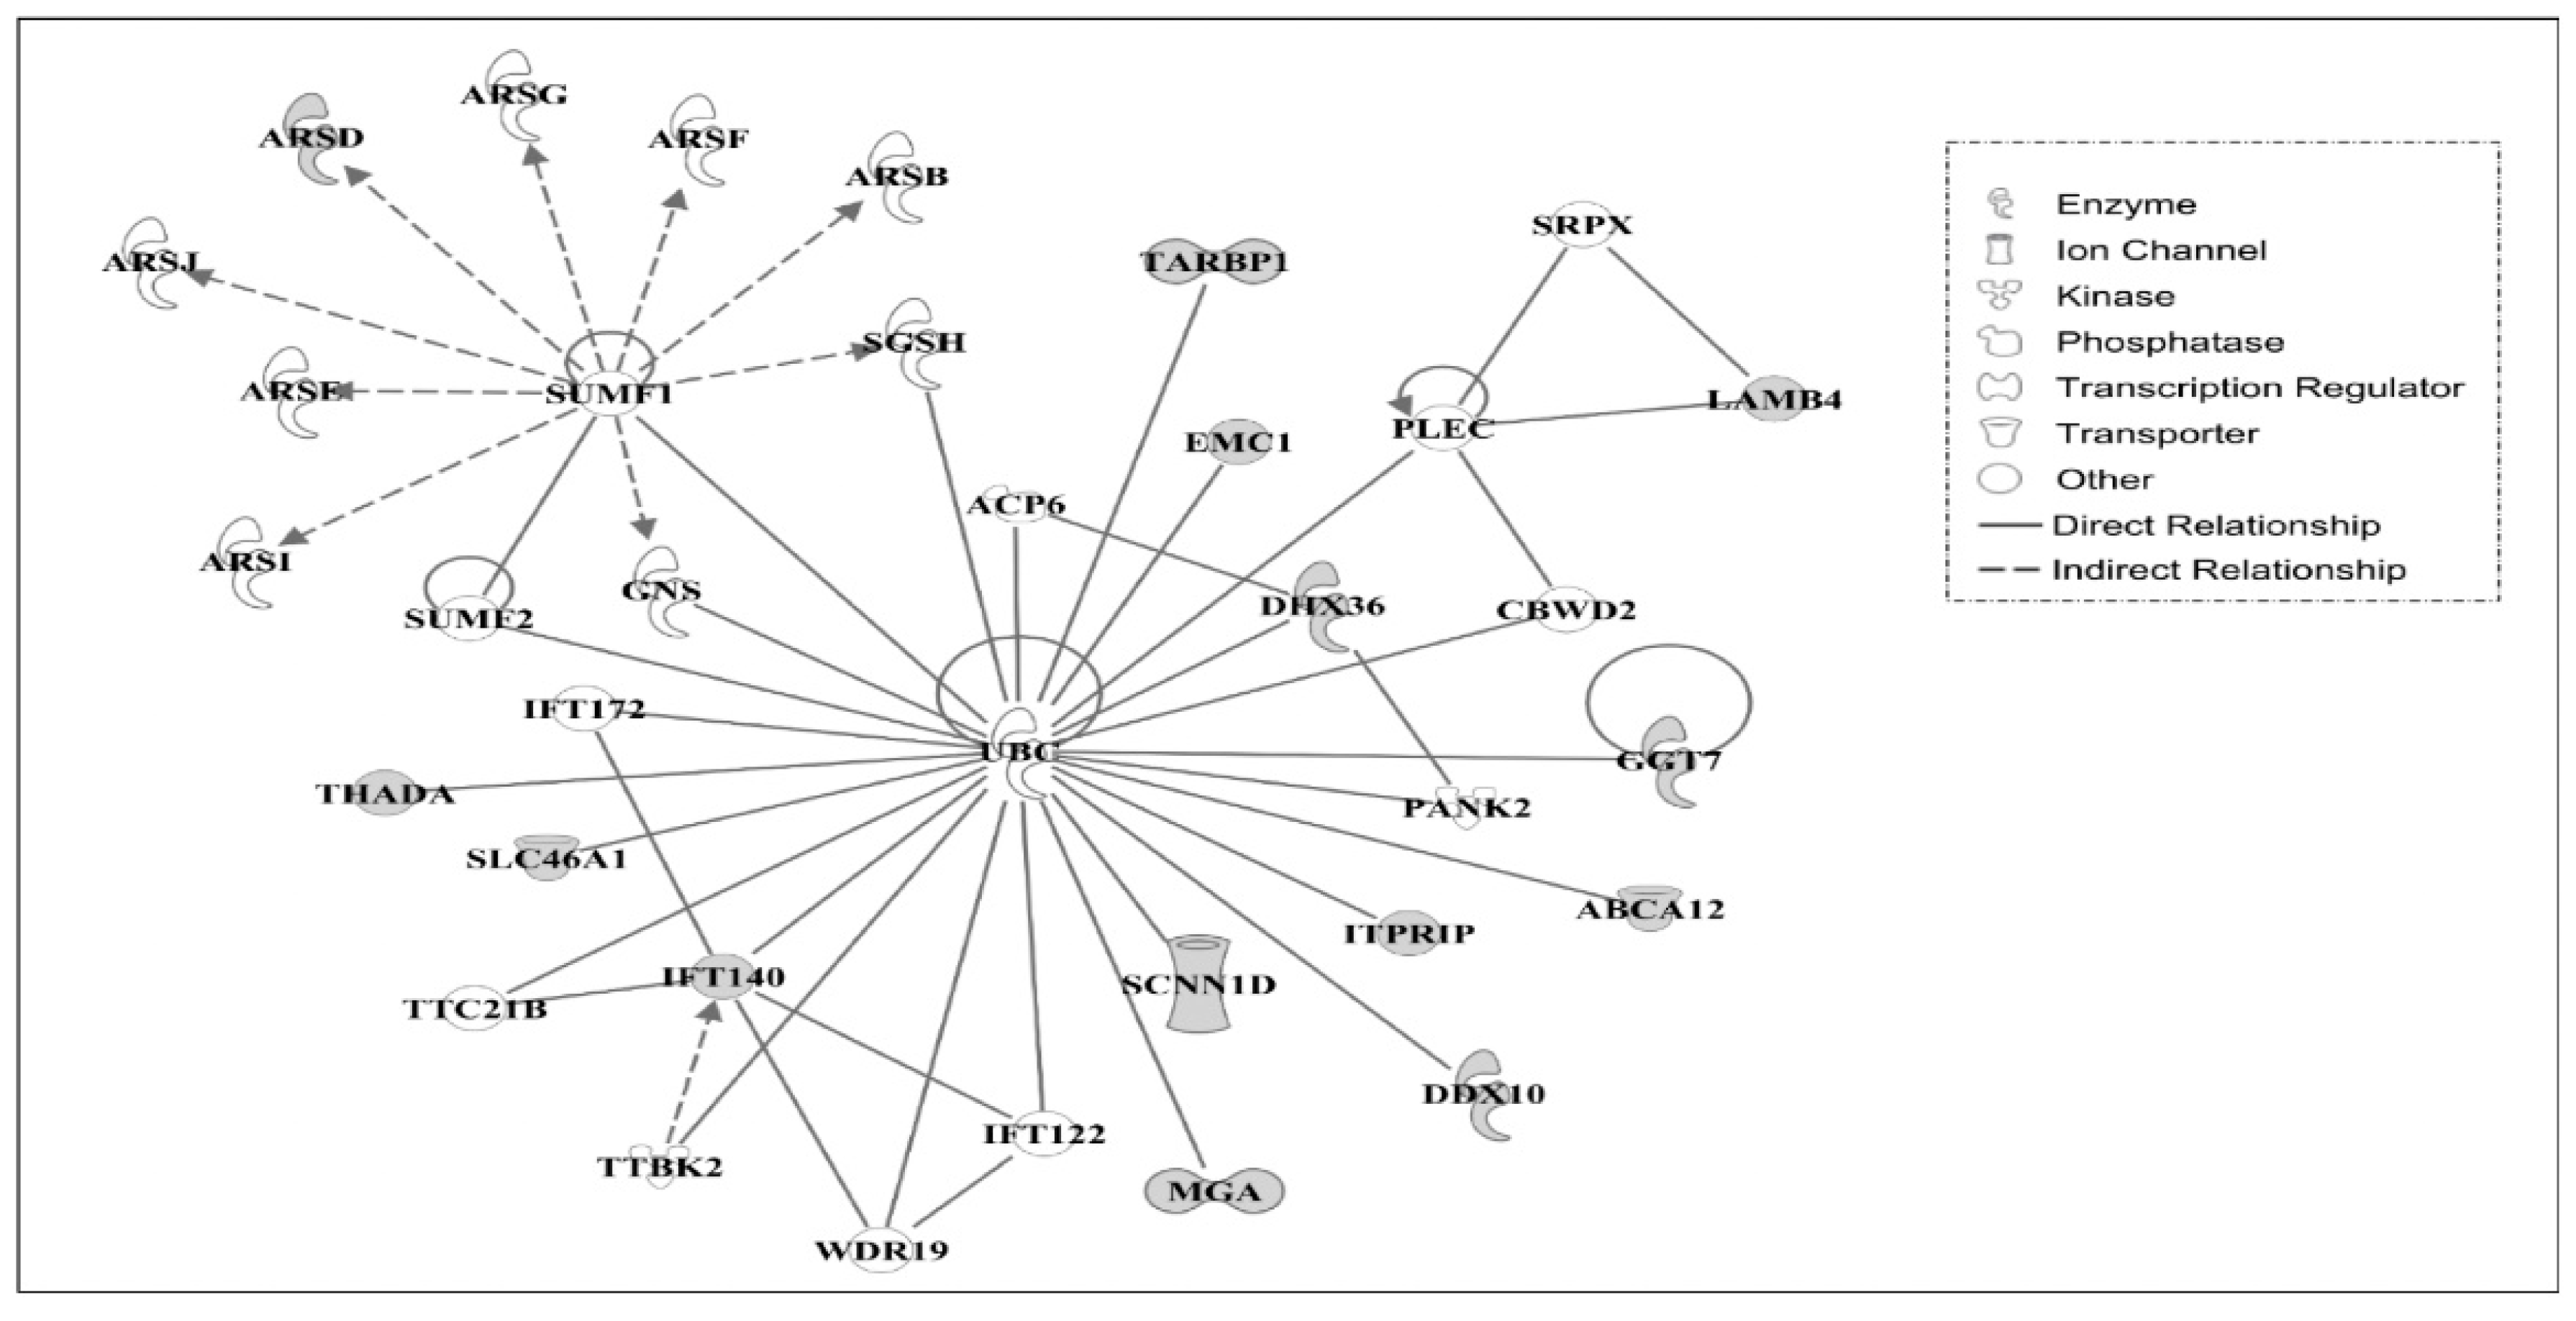
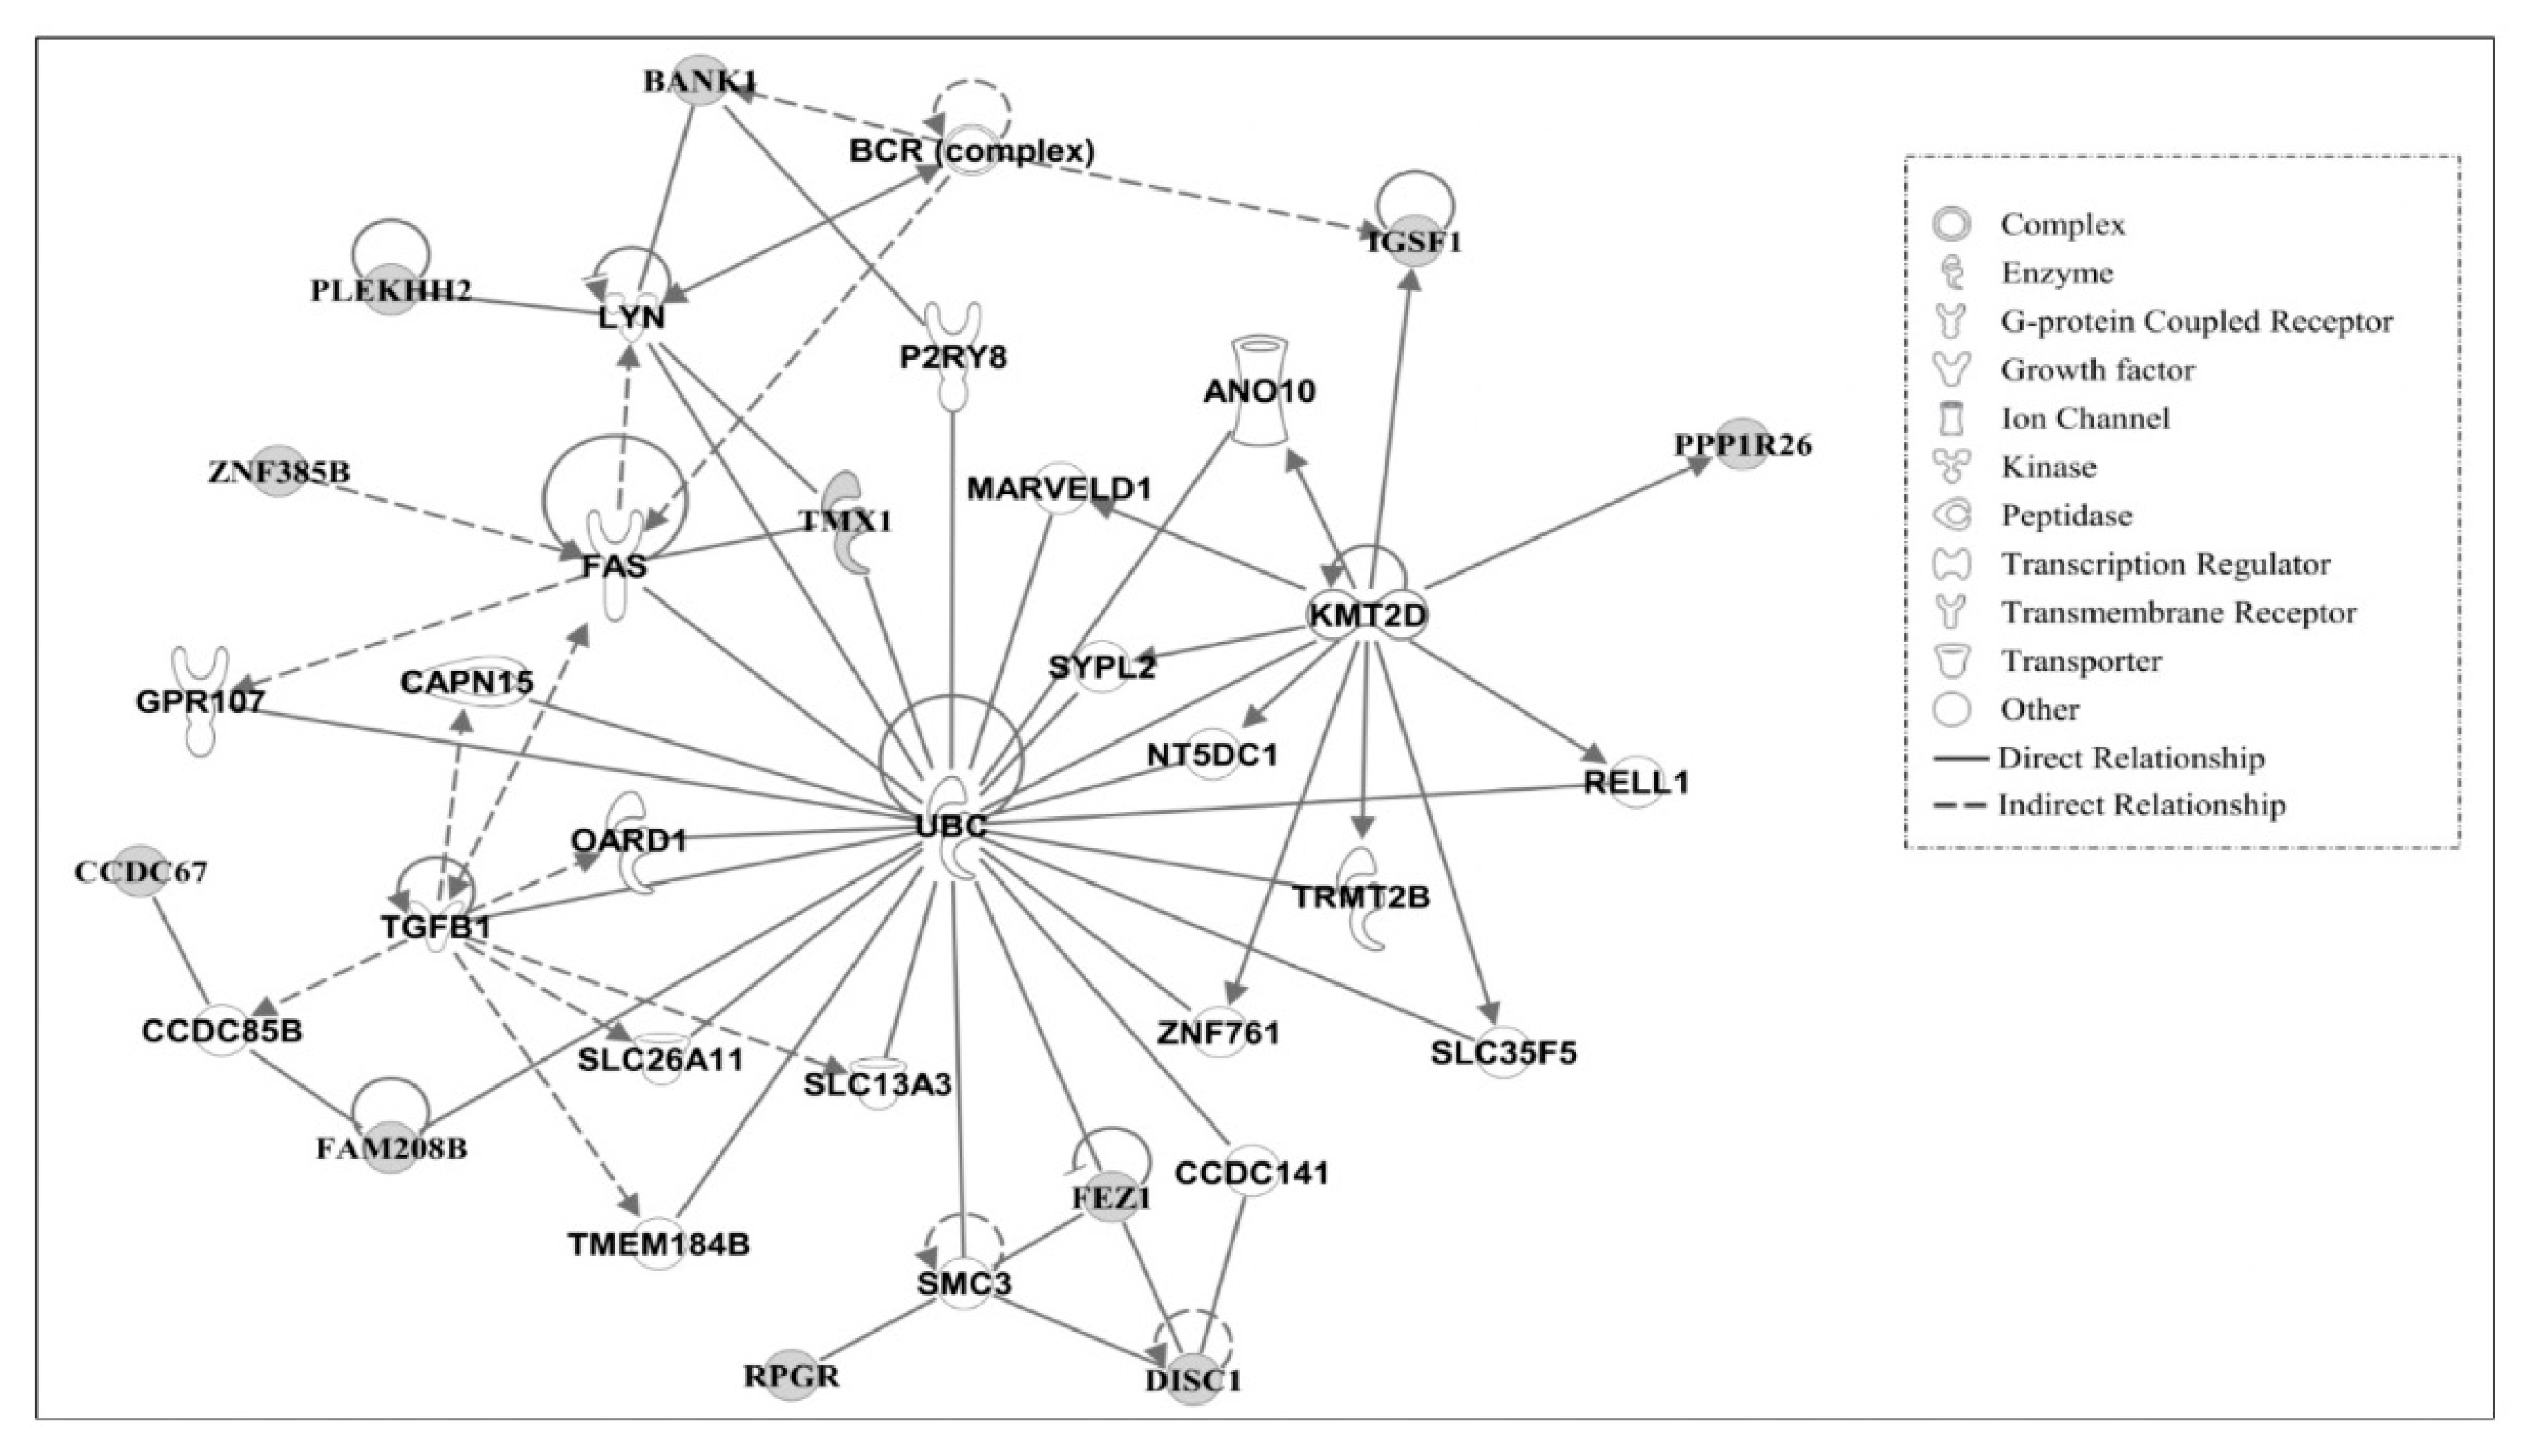
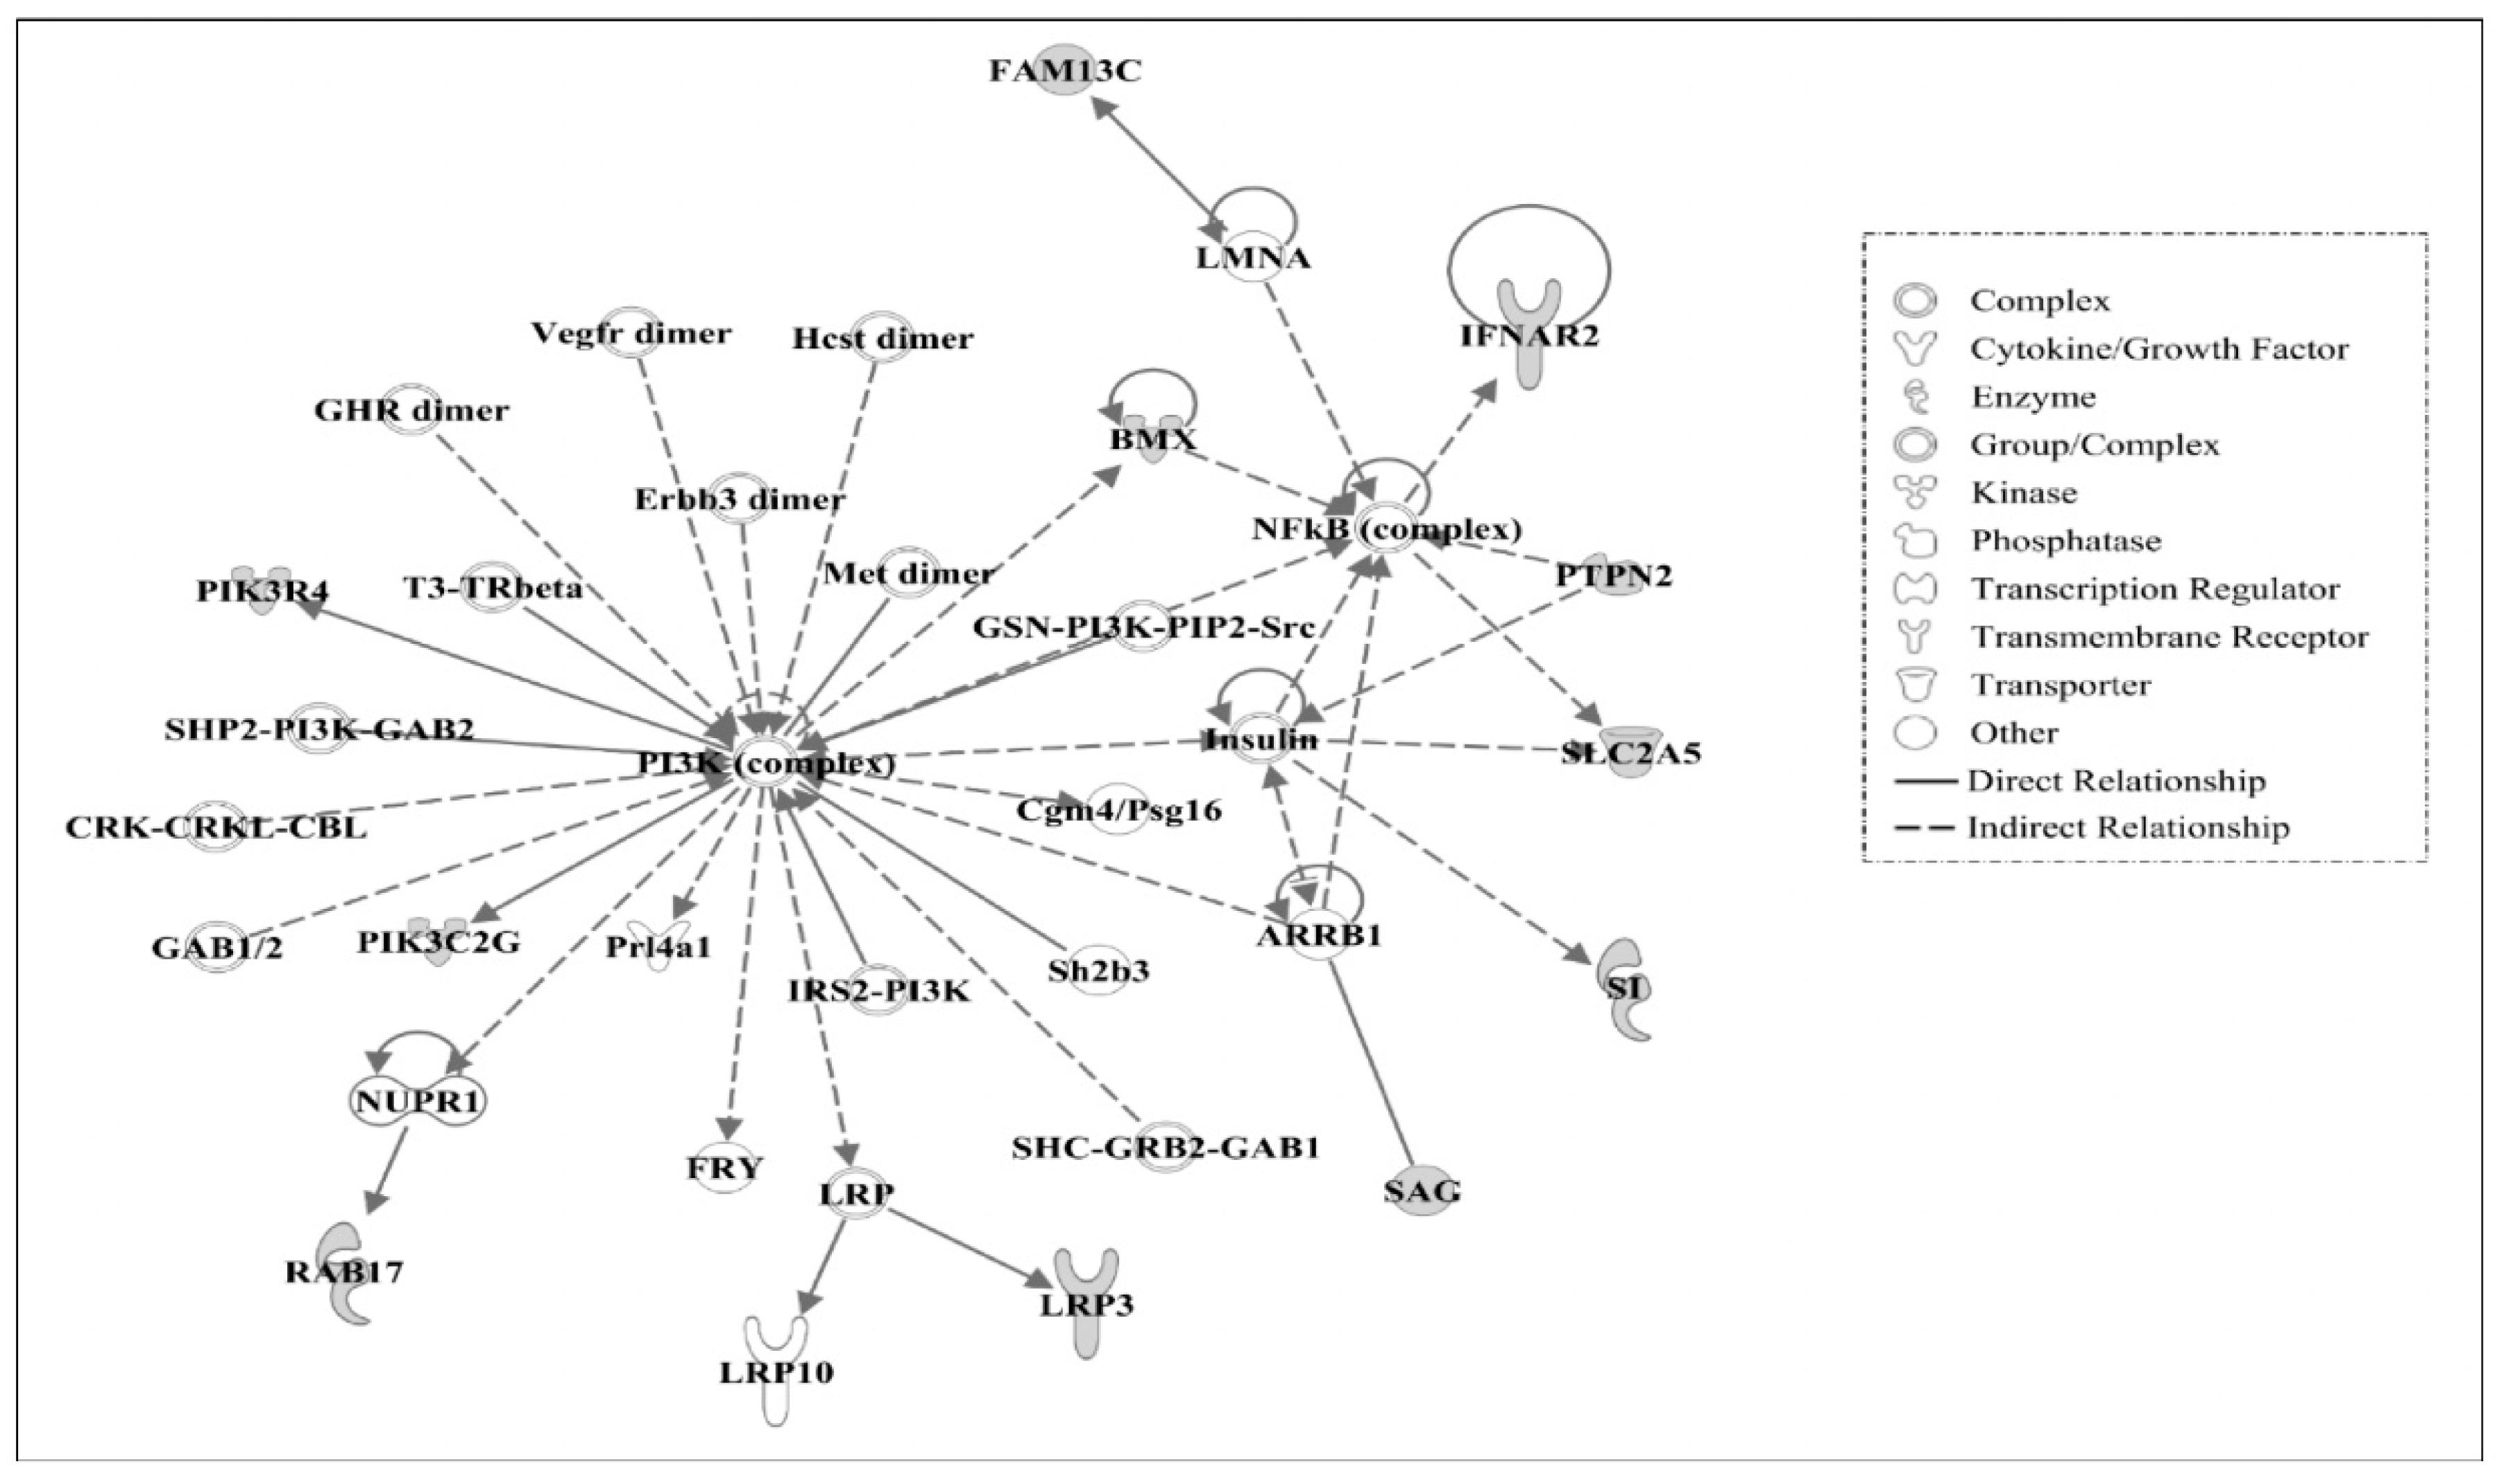
3.4. Gene Networks
4. Conclusions
Supplementary Materials
Author Contributions
Funding
Acknowledgments
Conflicts of Interest
References
- Andersson, L. Genetic dissection of phenotypic diversity in farm animals. Nat. Rev. Genet. 2001, 2, 130–138. [Google Scholar] [CrossRef] [PubMed]
- Andersson, L.; Georges, M. Domestic-animal genomics: deciphering the genetics of complex traits. Nat. Rev. Genet. 2004, 5, 202–212. [Google Scholar] [CrossRef] [PubMed]
- Fan, W.; Ng, C.S.; Chen, C.; Lu, M.J.; Chen, Y.; Liu, C.; Wu, S.; Chen, C.; Chen, J.; Mao, C. Genome-wide patterns of genetic variation in two domestic chickens. Genome Biol. Evol. 2013, 5, 1376–1392. [Google Scholar] [CrossRef] [PubMed]
- Li, D.; Lian, L.; Qu, L.; Chen, Y.; Liu, W.; Chen, S.; Zheng, J.; Xu, G.; Yang, N. A genome-wide SNP scan reveals two loci associated with the chicken resistance to Marek’s disease. Anim. Genet. 2013, 44, 217–222. [Google Scholar] [CrossRef] [PubMed]
- Zhou, H.; Mitchell, A.; McMurtry, J.; Ashwell, C.; Lamont, S.J. Insulin-like growth factor-I gene polymorphism associations with growth, body composition, skeleton integrity, and metabolic traits in chickens. Poult. Sci. 2005, 84, 212–219. [Google Scholar] [CrossRef] [PubMed]
- Kong, H.R.; Anthony, N.B.; Rowland, K.C.; Khatri, B.; Kong, B.C. Genome re-sequencing to identify single nucleotide polymorphism markers for muscle color traits in broiler chickens. Asian-Australas. J. Anim. Sci. 2018, 31, 13–18. [Google Scholar] [CrossRef] [PubMed]
- Ou, J.; Tang, S.; Sun, D.; Zhang, Y. Polymorphisms of three neuroendocrine-correlated genes associated with growth and reproductive traits in the chicken. Poult. Sci. 2009, 88, 722–727. [Google Scholar] [PubMed]
- Dorshorst, B.; Molin, A.; Rubin, C.; Johansson, A.M.; Strömstedt, L.; Pham, M.; Chen, C.; Hallböök, F.; Ashwell, C.; Andersson, L. A complex genomic rearrangement involving the endothelin 3 locus causes dermal hyperpigmentation in the chicken. PLoS Genet. 2011, 7, e1002412. [Google Scholar] [CrossRef] [PubMed]
- Wright, D.; Boije, H.; Meadows, J.R.; Bed’Hom, B.; Gourichon, D.; Vieaud, A.; Tixier-Boichard, M.; Rubin, C.; Imsland, F.; Hallböök, F. Copy number variation in intron 1 of SOX5 causes the pea-comb phenotype in chickens. PLoS Genet. 2009, 5, e1000512. [Google Scholar] [CrossRef] [PubMed]
- Hayden, A. Identification of biomarkers associated with Rous sarcoma virus-induced tumors in two divergently selected chicken lines. Master’s Thesis, University of Arkansas, Fayetteville, AR, USA, 2016. [Google Scholar]
- Devaney, J.A.; Gyles, N.R.; Lancaster, J.L., Jr. Evaluation of Arkansas Rous sarcoma regressor and progressor lines and giant jungle fowl for genetic resistance to the northern fowl mite. Poult. Sci. 1982, 61, 2327–2330. [Google Scholar] [CrossRef] [PubMed]
- Sun, W.; Yang, J. Functional mechanisms for human tumor suppressors. J. Cancer 2010, 1, 136–140. [Google Scholar] [CrossRef] [PubMed]
- Taylor, R.L., Jr. Major histocompatibility (B) complex control of responses against Rous sarcomas. Poult. Sci. 2004, 83, 638–649. [Google Scholar] [CrossRef] [PubMed]
- Rubin, C.; Zody, M.C.; Eriksson, J.; Meadows, J.R.; Sherwood, E.; Webster, M.T.; Jiang, L.; Ingman, M.; Sharpe, T.; Ka, S. Whole-genome resequencing reveals loci under selection during chicken domestication. Nature 2010, 464, 587–591. [Google Scholar] [CrossRef] [PubMed]
- Sachidanandam, R.; Weissman, D.; Schmidt, S.C.; Kakol, J.M.; Stein, L.D.; Marth, G.; Sherry, S.; Mullikin, J.C.; Mortimore, B.J.; Willey, D.L.; et al. A Map of human genome sequence variation containing 1.42 million single nucleotide polymorphisms. Nature 2001, 409, 928–933. [Google Scholar] [PubMed]
- Shastry, B.S. SNPs: Impact on gene function and phenotype. Single Nucleotide Polymorphisms. Methods Mol. Biol. 2009, 578, 3–22. [Google Scholar] [PubMed]
- Syvanen, A.C. Accessing genetic variation: genotyping single nucleotide polymorphisms. Nat. Rev. Genet. 2001, 2, 930–942. [Google Scholar] [CrossRef] [PubMed]
- Malek, M.; Hasenstein, J.; Lamont, S. Analysis of chicken TLR4, CD28, MIF, MD-2, and LITAF genes in a salmonella enteritidis resource population. Poult. Sci. 2004, 83, 544–549. [Google Scholar] [CrossRef] [PubMed]
- Zhang, L.; Li, P.; Liu, R.; Zheng, M.; Sun, Y.; Wu, D.; Hu, Y.; Wen, J.; Zhao, G. The identification of loci for immune traits in chickens using a genome-wide association study. PLoS ONE 2015, 10, e0117269. [Google Scholar] [CrossRef] [PubMed]
- Luo, C.; Qu, H.; Ma, J.; Wang, J.; Hu, X.; Li, N.; Shu, D. A genome-wide association study identifies major loci affecting the immune response against infectious bronchitis virus in chicken. Infect. Genet. Evol. 2014, 21, 351–358. [Google Scholar] [CrossRef] [PubMed]
- Andrews, S. FastQC: A Quality Control Tool for High Throughput Sequence Data. Reference Source. Available online: http://www.bioinformatics.babraham.ac.uk/projects/fastqc/ (accessed on 19 October 2018).
- Bushnell, B. BBMap Short Read Aligner. Available online: http://sourceforge.net/projects/bbmap (accessed on 25 October 2016).
- Jang, H.M.; Erf, G.F.; Rowland, K.C.; Kong, B.W. Genome resequencing and bioinformatic analysis of SNP containing candidate genes in the autoimmune vitiligo Smyth line chicken model. BMC Genom. 2014, 15, 707. [Google Scholar] [CrossRef] [PubMed]
- Liu, J.; Huang, S.; Sun, M.; Liu, S.; Liu, Y.; Wang, W.; Zhang, X.; Wang, H.; Hua, W. An improved allele-specific PCR primer design method for SNP marker analysis and its application. Plant Methods 2012, 8, 34. [Google Scholar] [CrossRef] [PubMed]
- Kong, B.W.; Lee, J.Y.; Bottje, W.G.; Lassiter, K.; Lee, J.; Foster, D.N. Genome-wide differential gene expression in immortalized DF-1 chicken embryo fibroblast cell line. BMC Genom. 2011, 12, 571. [Google Scholar] [CrossRef] [PubMed]
- Pértille, F.; Guerrero-Bosagna, C.; Da Silva, V.H.; Boschiero, C.; da Silva Nunes, J.D.R.; Ledur, M.C.; Jensen, P.; Coutinho, L.L. High-throughput and cost-effective chicken genotyping using next-generation sequencing. Sci. Rep. 2016, 6, 26929. [Google Scholar] [CrossRef] [PubMed]
- Popovic, D.; Vucic, D.; Dikic, I. Ubiquitination in disease pathogenesis and treatment. Nat. Med. 2014, 20, 1242–1253. [Google Scholar] [CrossRef] [PubMed]
- Courtney, K.D.; Corcoran, R.B.; Engelman, J.A. The PI3K pathway as drug target in human cancer. J. Clin. Oncol. 2010, 28, 1075–1083. [Google Scholar] [CrossRef] [PubMed]
- Hennessy, B.T.; Smith, D.L.; Ram, P.T.; Lu, Y.; Mills, G.B. Exploiting the PI3K/AKT pathway for cancer drug discovery. Nat. Rev. Drug Discov. 2005, 4, 988–1004. [Google Scholar] [CrossRef] [PubMed]
- Liu, P.; Cheng, H.; Roberts, T.M.; Zhao, J.J. Targeting the phosphoinositide 3-Kinase pathway in cancer. Nat. Rev. Drug Discov. 2009, 8, 627–644. [Google Scholar] [CrossRef] [PubMed]
- Wee, S.; Jagani, Z.; Xiang, K.X.; Loo, A.; Dorsch, M.; Yao, Y.M.; Sellers, W.R.; Lengauer, C.; Stegmeier, F. PI3K pathway activation mediates resistance to MEK inhibitors in KRAS mutant cancers. Cancer Res. 2009, 69, 4286–4293. [Google Scholar] [CrossRef] [PubMed]
- Ismail, H.A.; Lessard, L.; Mes-Masson, A.M.; Saad, F. Expression of NF-kappaB in prostate cancer lymph node metastases. Prostate 2004, 58, 308–313. [Google Scholar] [CrossRef] [PubMed]
- Dolcet, X.; Llobet, D.; Pallares, J.; Matias-Guiu, X. NF-kB in development and progression of human cancer. Virchows Arch. 2005, 446, 475–482. [Google Scholar] [CrossRef] [PubMed]
- Levine, A.J.; Finlay, C.A.; Hinds, P.W. P53 is a tumor suppressor gene. Cell 2004, 116, S67–S69. [Google Scholar] [CrossRef]
- Grandage, V.L.; Gale, R.E.; Linch, D.C.; Khwaja, A. PI3-kinase/Akt is constitutively active in primary acute myeloid leukaemia cells and regulates survival and chemoresistance via NF-kappaB, Mapkinase and p53 Pathways. Leukemia 2005, 19, 586–594. [Google Scholar] [CrossRef] [PubMed]
- Potter, D.S.; Kelly, P.; Denneny, O.; Juvin, V.; Stephens, L.R.; Dive, C.; Morrow, C.J. BMX acts downstream of PI3K to promote colorectal cancer cell survival and pathway inhibition sensitizes to the BH3 mimetic ABT-737. Neoplasia 2014, 16, 147–157. [Google Scholar] [CrossRef] [PubMed]
- Qiu, Y.; Kung, H.J. Signaling network of the Btk family kinases. Oncogene 2000, 19, 5651–5661. [Google Scholar] [CrossRef] [PubMed]
- Vogt, P.K.; Hart, J.R. PI3K and STAT3: A new alliance. Cancer Discov. 2011, 1, 481–486. [Google Scholar] [CrossRef] [PubMed]


| Gene | Primer Name | Oligo Sequence (5’ → 3’) | Annealing Temperature (°C) |
|---|---|---|---|
| BMX | BMX-F1 | GAACTTACATACAGATCGTC | 55 |
| BMX-F3 | GAACTTACATACAGATCGTT | 55 | |
| BMX-R | CTTCCAACCCAAGCCATTAC | 55 | |
| FAM208B | FAM208B-F1 | CCACTCCTTGGTGGAGTATT | 55 |
| FAM208B-F3 | CCACTCCTTGGTGGAGTATC | 55 | |
| FAM208B-R | AGAAAGATGAGGATCGTGCG | 55 | |
| IFT140 | IFT140-F1 | AAATCCATCAAGTTGATTAA | 55 |
| IFT140-F3 | AAATCCATCAAGTTGATTAG | 55 | |
| IFT140-R | TCTTTCTGAGAACGAAAGGG | 55 | |
| IGSF | IGSF-F1 | CAATGGGACTGTGCTGAGTC | 63 |
| IGSF-F2 | CAATGGGACTGTGCTGAGTT | 63 | |
| IGSF-R | TCTCAGGCAGAGGTGATGAT | 63 | |
| LAMB4 | LAMB4-F1 | TCTCTTATTTGCGTTCAATT | 55 |
| LAMB4-F3 | TCTCTTATTTGCGTTCAATC | 55 | |
| LAMB4-R | TTGCAGATGAGAGTGTGCCT | 55 | |
| PIK3R4 | PIK3R4-F1 | ACTAGGGTGAGATGTTTAAT | 55 |
| PIK3R4-F3 | ACTAGGGTGAGATGTTTAAC | 55 | |
| PIK3R4-R | GGGGATCATCAGAAGTCTGT | 55 | |
| THADA | THADA-F1 | ACAAACCATGCTGGCATACT | 63 |
| THADA-F3 | ACAAACCATGCTGGCATACC | 63 | |
| THADA-R | CAGGACATGCTAACCTCTGT | 63 | |
| TOPAZ1 | TOPAZ1-F1 | AAGCTCTGGTAGGCTACGGG | 63 |
| TOPAZ1-F3 | AAGCTCTGGTAGGCTACGGT | 63 | |
| TOPAZ1-R | CAGGCCAGAATACTGCATCT | 63 |
| Line | # of Reads | # of Reads Aligned | # of Reads Not Aligned | Coverage | Total # of SNP |
|---|---|---|---|---|---|
| AP | 69,221,284 | 55,224,050 | 10,903,306 | 14× | 7,372,778 |
| AR | 55,368,344 | 44,328,649 | 8,551,173 | 11× | 7,173,788 |
| Contig ID | C | Ref Pos | Ref Base | Called Base | Impact | SNP% | Feature Name | DNA Change | AA Change | Depth | A Cnt | C Cnt | G Cnt | T Cnt | Del |
|---|---|---|---|---|---|---|---|---|---|---|---|---|---|---|---|
| NC_006088 | 1 | 1034107 | T | C | N-syn | 1 | FAM208B [4] | c.4777A > G | p.K1593E | 13 | 0 | 13 | 0 | - | 0 |
| NC_006088 | 1 | 14729572 | T | C | N-syn | 0.8 | LAMB4 | c.4640A > G | p.K1547R | 10 | 0 | 8 | 0 | - | 0 |
| NC_006088 | 1 | 64181733 | G | T | N-syn | 1 | PIK3C2G | c.1585G > T | p.A529S | 10 | 0 | 0 | - | 10 | 0 |
| NC_006088 | 1 | 65873551 | C | G | N-syn | 0.9 | LOC101748372 | c.960G > C | p.R320S | 11 | 0 | - | 10 | 0 | 0 |
| NC_006088 | 1 | 104629701 | G | A | N-syn | 1 | IFNAR2 | c.1099G > A | p.A367T | 11 | 11 | 0 | - | 0 | 0 |
| NC_006088 | 1 | 112303547 | A | C | N-syn | 0.8 | RPGR | c.2209A > C | p.I737L | 10 | - | 8 | 0 | 0 | 0 |
| NC_006088 | 1 | 121349181 | C | T|C | N-syn | 0.75 | BMX | c.[1549G > G] | p.D517N, | 12 | 0 | - | 0 | 9 | 0 |
| +[1549G > A] | p.D517D | ||||||||||||||
| NC_006088 | 1 | 127837266 | G | T | N-syn | 0.89 | ARSD | c.449G > T | p.W150L | 10 | 0 | 0 | - | 9 | 0 |
| NC_006088 | 1 | 179358329 | A | T|A | N-syn | 0.76 | DDX10 | c.[1849T > T] | p.Y617N, | 13 | - | 0 | 0 | 10 | 0 |
| +[1849T > A] | p.Y617Y | ||||||||||||||
| NC_006088 | 1 | 185190031 | T | C | N-syn | 0.8 | CCDC67 | c.983A > G | p.Q328R | 10 | 0 | 8 | 0 | - | 0 |
| NC_006088 | 1 | 193338454 | A | T | N-syn | 1 | ART7B | c.590T > A | p.L197Q | 13 | - | 0 | 0 | 13 | 0 |
| NC_006089 | 2 | 19385973 | C | T | N-syn | 1 | LOC420515 | c.3400G > A | p.V1134I | 10 | 0 | - | 0 | 10 | 0 |
| NC_006089 | 2 | 41279450 | G | T | N-syn | 1 | TOPAZ1 | c.2924C > A | p.T975N | 10 | 0 | 0 | - | 10 | 0 |
| NC_006089 | 2 | 42201510 | T | T|C | N-syn | 0.75 | PIK3R4 | c.[1937A > G] | p.D646D, | 12 | 0 | 9 | 0 | - | 0 |
| +[1937A > A] | p.D646G | ||||||||||||||
| NC_006089 | 2 | 63518627 | T | C | N-syn | 0.89 | LOC101751154 | c.137T > C | p.I46T | 10 | 0 | 9 | 0 | - | 0 |
| NC_006089 | 2 | 96924595 | G | A | N-syn | 1 | PTPN2 | c.934G > A | p.A312T | 10 | 10 | 0 | - | 0 | 0 |
| NC_006089 | 2 | 1.06E+08 | G | C | N-syn | 0.9 | COPN5L1 | c.17C > G | p.A6G | 11 | 1 | 10 | - | 0 | 0 |
| NC_006089 | 2 | 1.21E+08 | T | C | N-syn | 0.91 | LOC101751416 | c.194T > C | p.L65P | 82 | 0 | 75 | 0 | - | 0 |
| NC_006090 | 3 | 24479109 | T | C | N-syn | 1 | THADA | c.859A > G | p.S287G | 10 | 0 | 10 | 0 | - | 0 |
| NC_006090 | 3 | 24515241 | T | C | N-syn | 1 | PLEKHH2 | c.1522T > C | p.F508L | 10 | 0 | 10 | 0 | - | 0 |
| NC_006090 | 3 | 37785831 | A | G | N-syn | 1 | TARBP1 | c.1321A > G | p.I441V | 10 | - | 0 | 10 | 0 | 0 |
| NC_006090 | 3 | 37785856 | C | T | N-syn | 1 | TARBP1 | c.1346C > T | p.T449I | 10 | 0 | - | 0 | 10 | 0 |
| NC_006090 | 3 | 38965704 | G | T | N-syn | 1 | DISC1 | c.1027C > A | p.L343I | 10 | 0 | 0 | - | 10 | 0 |
| NC_006090 | 3 | 105934067 | C | G | N-syn | 0.85 | GVINP1 | c.6146G > C | p.R2049T | 14 | 0 | - | 12 | 0 | 0 |
| NC_006091 | 4 | 120829955 | C | T | N-syn | 0.8 | LOC771752 | c.62G > A | p.R21Q | 10 | 0 | - | 0 | 8 | 0 |
| NC_006091 | 4 | 31100937 | A | C | N-syn | 0.9 | TTC29 | c.903T > G | p.D301E | 11 | - | 10 | 0 | 0 | 0 |
| NC_006091 | 4 | 56709491 | G | G|A | N-syn | 0.76 | C4H4ORF21 | c.[631G > G] | p.D211N, | 13 | 10 | 0 | - | 0 | 0 |
| +[631G > A] | p.D211D | ||||||||||||||
| NC_006091 | 4 | 60221486 | C | T | N-syn | 1 | BANK1 | c.934C > T | p.P312S | 12 | 0 | - | 0 | 12 | 0 |
| NC_006092 | 5 | 24297188 | T | C | N-syn | 1 | MGA | c.7214T > C | p.M2405T | 13 | 0 | 13 | 0 | - | 0 |
| NC_006092 | 5 | 45169641 | T | C | N-syn | 1 | LOC100858625 | c.2191A > G | p.I731V | 10 | 0 | 10 | 0 | - | 0 |
| NC_006092 | 5 | 57915337 | A | G | N-syn | 0.86 | TMX1 | c.230A > G | p.D77G | 15 | - | 0 | 13 | 0 | 0 |
| NC_006093 | 6 | 130323 | G | T | N-syn | 1 | FAM13C | c.1446G > T | p.E482D | 10 | 0 | 0 | - | 10 | 0 |
| NC_006093 | 6 | 23801282 | T | C | N-syn | 0.81 | ITPRIP | c.1528A > G | p.I510V | 11 | 0 | 9 | 0 | - | 0 |
| NC_006094 | 7 | 4260582 | C | T | N-syn | 0.8 | ABCA12 | c.2110G > A | p.A704T | 10 | 0 | - | 1 | 8 | 0 |
| NC_006094 | 7 | 4717753 | G | A | N-syn | 0.8 | RAB17 | c.601G > A | p.V201I | 10 | 8 | 0 | - | 0 | 0 |
| NC_006094 | 7 | 4717765 | G | A | N-syn | 0.9 | RAB17 | c.613G > A | p.V205I | 11 | 10 | 0 | - | 0 | 0 |
| NC_006094 | 7 | 14344085 | A | G | N-syn | 1 | ZNF385B | c.131A > G | p.H44R | 13 | - | 0 | 13 | 0 | 0 |
| NC_006094 | 7 | 15047308 | A | G | N-syn | 1 | LOC770919 | c.1253A > G | p.Y418C | 10 | - | 0 | 10 | 0 | 0 |
| NC_006094 | 7 | 15047322 | A | G | N-syn | 1 | LOC770919 | c.1267A > G | p.K423E | 10 | - | 0 | 10 | 0 | 0 |
| NC_006096 | 9 | 713606 | G | A | N-syn | 1 | SAG | c.151G > A | p.V51M | 13 | 13 | 0 | - | 0 | 0 |
| NC_006096 | 9 | 20652272 | T | C | N-syn | 1 | SI | c.2905T > C | p.S969P | 11 | 0 | 11 | 0 | - | 0 |
| NC_006096 | 9 | 21722478 | G | A | N-syn | 0.83 | LOC425015 | c.1352G > A | p.G451D | 12 | 10 | 0 | - | 0 | 0 |
| NC_006096 | 9 | 21722484 | C | T | N-syn | 0.8 | LOC425015 | c.1358C > T | p.P453L | 10 | 0 | - | 0 | 8 | 0 |
| NC_006096 | 9 | 22653344 | T | G | N-syn | 0.89 | DHX36 | c.333T > G | p.Y111. | 10 | 0 | 0 | 9 | - | 1 |
| NC_006097 | 10 | 11164703 | C | T | N-syn | 1 | FAM154B | c.287G > A | p.R96K | 11 | 0 | - | 0 | 11 | 0 |
| NC_006098 | 11 | 9564860 | G | A | N-syn | 1 | LRP3 | c.2206G > A | p.G736R | 10 | 10 | 0 | - | 0 | 0 |
| NC_006099 | 12 | 5208897 | A | G | N-syn | 1 | LOC100857401 | c.3511A > G | p.K1171E | 10 | - | 0 | 10 | 0 | 0 |
| NC_006100 | 13 | 14403319 | C | G | N-syn | 0.9 | LOC101749661 | c.260G > C | p.G87A | 11 | 0 | - | 10 | 0 | 0 |
| NC_006101 | 14 | 1.2E+07 | T | C | N-syn | 1 | KIAA0556 | c.2794A > G | p.N932D | 10 | 0 | 10 | 0 | - | 0 |
| NC_006101 | 14 | 13770765 | A | G | N-syn | 0.89 | IFT140 | c.2372A > G | p.K791R | 10 | - | 0 | 9 | 0 | 0 |
| NC_006102 | 15 | 10822742 | T | C | N-syn | 0.89 | CCDC157 | c.1492A > G | p.S498G | 10 | 1 | 9 | 0 | - | 0 |
| NC_006104 | 17 | 6833124 | C | T | N-syn | 0.83 | GBGT1 | c.368G > A | p.R123H | 12 | 0 | - | 0 | 10 | 0 |
| NC_006104 | 17 | 7711131 | A | G | N-syn | 1 | PPP1R26 | c.637A > G | p.I213V | 11 | - | 0 | 11 | 0 | 0 |
| NC_006106 | 19 | 5656736 | C | T | N-syn | 0.8 | SLC46A1 | c.1174G > A | p.G392S | 10 | 0 | - | 0 | 8 | 0 |
| NC_006107 | 20 | 43121 | C | T | N-syn | 1 | IGSF1 | c.412C > T | p.R138C | 10 | 0 | - | 0 | 10 | 0 |
| NC_006107 | 20 | 478926 | C | T | N-syn | 0.8 | GGT7 | c.1472C > T | p.S491F | 10 | 0 | - | 0 | 8 | 0 |
| NC_006107 | 20 | 4706188 | G | T | N-syn | 0.89 | LOC101750167 | c.619G > T | p.A207S | 10 | 0 | 0 | - | 9 | 0 |
| NC_006108 | 21 | 1906952 | T | C | N-syn | 1 | TMEM52 | c.2T > C | p.M1T | 10 | 0 | 10 | 0 | - | 0 |
| NC_006108 | 21 | 1906991 | G | T | N-syn | 1 | TMEM52 | c.41G > T | p.C14F | 11 | 0 | 0 | - | 11 | 0 |
| NC_006108 | 21 | 2451062 | T | G | N-syn | 0.89 | SCNN1D | c.1912A > C | p.I638L | 10 | 0 | 0 | 9 | - | 0 |
| NC_006108 | 21 | 3241081 | C | T | N-syn | 1 | SLC2A5 | c.1246G > A | p.A416T | 11 | 0 | - | 0 | 11 | 0 |
| NC_006108 | 21 | 4662973 | C | A | N-syn | 0.89 | EMC1 | c.1070G > T | p.S357I | 10 | 9 | - | 0 | 0 | 0 |
| NC_006111 | 24 | 130579 | C | T|C | N-syn | 0.81 | FEZ1 | c.[1196C > T] | p.P399P, | 16 | 0 | - | 0 | 13 | 0 |
| +[1196C > C] | p.P399L |
| Chr | Ref Pos | Genes | Ref Base | Called Base | Impact | SNP% | Amino Acid Change | Results of 96 Birds Each from AP and AR Lines | |||||
|---|---|---|---|---|---|---|---|---|---|---|---|---|---|
| Homozygous RJF | Heterozygote | Homozygous SNP | |||||||||||
| AR | AP | AR | AP | AR | AP | ||||||||
| 1 | 193338454 | ART7B | A | T | N-syn | 1 | p.L197Q | 5 | 93 | 23 | 3 | 68 | 0 |
| 1 | 121349181 | BMX | C | T|C | N-syn | 0.75 | p.D517N, p.D517D | 16 | 96 | 26 | 0 | 54 | 0 |
| 1 | 1034107 | FAM208B | T | C | N-syn | 1 | p.K1593E | 0 | 94 | 0 | 1 | 96 | 1 |
| 14 | 13770765 | IFT140 | A | G | N-syn | 0.89 | p.K791R | 9 | 95 | 44 | 1 | 43 | 0 |
| 20 | 43121 | IGSF1 | C | T | N-syn | 1 | p.R138C | 0 | 63 | 0 | 28 | 96 | 5 |
| 1 | 14729572 | LAMB4 | T | C | N-syn | 0.8 | p.K1547R | 39 | 84 | 15 | 2 | 42 | 10 |
| 2 | 42201510 | PIK3R4 | T | T|C | N-syn | 0.75 | p.D646D, p.D646G | 16 | 71 | 4 | 16 | 76 | 9 |
| 3 | 24479109 | THADA | T | C | N-syn | 1 | p.S287G | 0 | 64 | 0 | 30 | 96 | 2 |
| 2 | 41279450 | TOPAZ1 | G | T | N-syn | 1 | p.T975N | 0 | 16 | 0 | 78 | 96 | 2 |
| ID | Entrez Gene Name | Location | Type(s) |
|---|---|---|---|
| ABCA12 | ATP-binding cassette, sub-family A (ABC1), member 12 | Plasma Membrane | Transporter |
| ARSD | arylsulfatase D | Cytoplasm | Enzyme |
| BANK1 | B-cell scaffold protein with ankyrin repeats 1 | Extracellular Space | Other |
| BMX | Bone Marrow on X chromosome (BMX) non-receptor tyrosine kinase | Cytoplasm | Kinase |
| CCDC157 | Coiled-coil domain containing 157 | Other | Other |
| CCDC67 | coiled-coil domain containing 67 | Other | Other |
| DDX10 | DEAD (Asp-Glu-Ala-Asp) box polypeptide 10 | Nucleus | Enzyme |
| DHX36 | DEAH (Asp-Glu-Ala-His) box polypeptide 36 | Cytoplasm | Enzyme |
| DISC1 | disrupted in schizophrenia 1 | Cytoplasm | Other |
| EMC1 | Endoplasmic reticulum (ER) membrane protein complex subunit 1 | Plasma Membrane | Other |
| FAM13C | Family with sequence similarity 13, member C | Other | Other |
| FAM154B | Family with sequence similarity 154, member B | Other | Other |
| FAM208B | Family with sequence similarity 208, member B | Other | Other |
| FEZ1 | Fasciculation and elongation protein zeta 1 (zygin I) | Cytoplasm | Other |
| GBGT1 | Globoside alpha-1,3-N-acetylgalactosaminyltransferase 1 | Other | Enzyme |
| GGT7 | Gamma-glutamyltransferase 7 | Plasma Membrane | Enzyme |
| GVINP1 | GTPase, very large interferon inducible pseudogene 1 | Other | Other |
| IFNAR2 | Interferon (α, β and Ω) receptor 2 | Plasma Membrane | transmembrane receptor |
| IFT140 | Intraflagellar transport 140 | Extracellular Space | Other |
| IGSF1 | Immunoglobulin superfamily, member 1 | Plasma Membrane | Other |
| ITPRIP | Inositol 1,4,5-trisphosphate receptor interacting protein | Extracellular Space | Other |
| KIAA0556 | KIAA0556 | Extracellular Space | Other |
| LAMB4 | Laminin, beta 4 | Other | Other |
| LRP3 | Low density lipoprotein receptor-related protein 3 | Plasma Membrane | transmembrane receptor |
| MGA | MYC associated factor X (MAX) dimerization protein | Nucleus | transcription regulator |
| PIK3C2G | Phosphatidylinositol-4-phosphate 3-kinase, catalytic subunit type 2 γ | Cytoplasm | Kinase |
| PIK3R4 | Phosphoinositide-3-kinase, regulatory subunit 4 | Cytoplasm | Kinase |
| PLEKHH2 | Pleckstrin homology domain containing, family H (with MyTH4 domain) member 2 | Cytoplasm | Other |
| PPP1R26 | Protein phosphatase 1, regulatory subunit 26 | Nucleus | Other |
| PTPN2 | Protein tyrosine phosphatase, non-receptor type 2 | Cytoplasm | Phosphatase |
| RAB17 | RAB17, member RAS oncogene family | Cytoplasm | Enzyme |
| RPGR | Retinitis pigmentosa GTPase regulator | Cytoplasm | Other |
| SAG | S-antigen; retina and pineal gland (arrestin) | Cytoplasm | Other |
| SCNN1D | Sodium channel, non-voltage-gated 1, δ subunit | Plasma Membrane | ion channel |
| SI | Sucrase-isomaltase (α-glucosidase) | Cytoplasm | Enzyme |
| SLC2A5 | Solute carrier family 2 (facilitated glucose/fructose transporter), member 5 | Plasma Membrane | Transporter |
| SLC46A1 | Solute carrier family 46 (folate transporter), member 1 | Plasma Membrane | Transporter |
| TARBP1 | Trans-activation response (TAR) (HIV-1) RNA binding protein 1 | Nucleus | transcription regulator |
| THADA | Thyroid adenoma associated | Other | Other |
| TMEM52 | Transmembrane protein 52 | Other | Other |
| TMX1 | Thioredoxin-related transmembrane protein 1 | Cytoplasm | Enzyme |
| TOPAZ1 | Testis and ovary specific Piwi Argonaut and Zwille (PAZ) domain containing 1 | Other | Other |
| TTC29 | Tetratricopeptide repeat domain 29 | Other | Other |
| ZNF385B | Zinc finger protein 385B | Nucleus | Other |
| LOC101748372 | Uncharacterized | N/A | N/A |
| ART7B | Uncharacterized | N/A | N/A |
| LOC420515 | Uncharacterized | N/A | N/A |
| LOC101751154 | Uncharacterized | N/A | N/A |
| COPN5L1 | Uncharacterized | N/A | N/A |
| LOC101751416 | Uncharacterized | N/A | N/A |
| LOC771752 | Uncharacterized | N/A | N/A |
| C4H4ORF21 | Uncharacterized | N/A | N/A |
| LOC100858625 | Uncharacterized | N/A | N/A |
| LOC770919 | Uncharacterized | N/A | N/A |
| ID | Molecules in Network | Score | Top Diseases and Functions |
|---|---|---|---|
| 1 | ABCA12, ACP6, ARSB, ARSD, ARSE, ARSF, ARSG, ARSI, ARSJ, CBWD2, DDX10, DHX36, EMC1, GGT7, GNS, IFT122, IFT140, IFT172, ITPRIP, LAMB4, MGA, PANK2, PLEC, SCNN1D, SGSH, SLC46A1, SRPX, SUMF1, SUMF2, TARBP1, THADA,TTBK2 | 30 | Developmental Disorder, Hereditary Disorder, Metabolic Disease |
| TTC21B, UBC, WDR19 | |||
| 2 | ANO10, BANK1, BCR (complex), CAPN15, CCDC67, CCDC141, CCDC85B, DISC1, FAM208B, FAS, FEZ1, GPR107, IGSF1, KMT2D, LYN, MARVELD1, NT5DC1, OARD1, P2RY8, PLEKHH2, PPP1R26 | 22 | Cell Death and Survival, Hematological System Development and Function, Humoral Immune Response |
| RELL1, RPGR, SLC13A3, SLC26A11, SLC35F5, SMC3, SYPL2, TGFB1, MEM184B, TMX1, TRMT2B, UBC, ZNF761, ZNF385B | |||
| 3 | ARRB1, BMX, Cgm4/Psg16, CRK-CRKL-CBL, Erbb3 dimer, FAM13C, FRY, GAB1/2, GHR dimer, GSN-PI3K-PIP2-Src, Hcst dimer, IFNAR2, Insulin, IRS2-PI3K, LMNA, LRP, LRP3, LRP10, Met dimer, NFkB (complex), NUPR1, PI3K (complex), PIK3C2G, PIK3R4, Prl4a1, PTPN2, RAB17, SAG, Sh2b3, SHC-GRB2-GAB1, SHP2-PI3K-GAB2, SI, SLC2A5, T3-TRβ, Vegfr dimer | 22 | Developmental Disorder, Gastrointestinal Disease, Hereditary Disorder |
© 2018 by the authors. Licensee MDPI, Basel, Switzerland. This article is an open access article distributed under the terms and conditions of the Creative Commons Attribution (CC BY) license (http://creativecommons.org/licenses/by/4.0/).
Share and Cite
Khatri, B.; Hayden, A.M.; Anthony, N.B.; Kong, B.C. Whole Genome Resequencing of Arkansas Progressor and Regressor Line Chickens to Identify SNPs Associated with Tumor Regression. Genes 2018, 9, 512. https://doi.org/10.3390/genes9100512
Khatri B, Hayden AM, Anthony NB, Kong BC. Whole Genome Resequencing of Arkansas Progressor and Regressor Line Chickens to Identify SNPs Associated with Tumor Regression. Genes. 2018; 9(10):512. https://doi.org/10.3390/genes9100512
Chicago/Turabian StyleKhatri, Bhuwan, Ashley M. Hayden, Nicholas B. Anthony, and Byungwhi C. Kong. 2018. "Whole Genome Resequencing of Arkansas Progressor and Regressor Line Chickens to Identify SNPs Associated with Tumor Regression" Genes 9, no. 10: 512. https://doi.org/10.3390/genes9100512
APA StyleKhatri, B., Hayden, A. M., Anthony, N. B., & Kong, B. C. (2018). Whole Genome Resequencing of Arkansas Progressor and Regressor Line Chickens to Identify SNPs Associated with Tumor Regression. Genes, 9(10), 512. https://doi.org/10.3390/genes9100512