Article

Gene Expression Analysis before and after Treatment with Adalimumab in Patients with Ankylosing Spondylitis Identifies Molecular Pathways Associated with Response to Therapy

1
Immunology Area, Pediatric Hospital Bambino Gesù, 00146 Rome, Italy
2
Department of Medicine, University of Verona, 37134 Verona, Italy
*
Author to whom correspondence should be addressed.
These authors contributed equally to this work.
Genes 2017, 8(4), 127; https://doi.org/10.3390/genes8040127
Submission received: 14 February 2017 / Revised: 14 April 2017 / Accepted: 19 April 2017 / Published: 24 April 2017
(This article belongs to the Section Human Genomics and Genetic Diseases)

Abstract

:
The etiology of Ankylosing spondylitis (AS) is still unknown and the identification of the involved molecular pathogenetic pathways is a current challenge in the study of the disease. Adalimumab (ADA), an anti-tumor necrosis factor (TNF)-alpha agent, is used in the treatment of AS. We aimed at identifying pathogenetic pathways modified by ADA in patients with a good response to the treatment. Gene expression analysis of Peripheral Blood Cells (PBC) from six responders and four not responder patients was performed before and after treatment. Differentially expressed genes (DEGs) were submitted to functional enrichment analysis and network analysis, followed by modules selection. Most of the DEGs were involved in signaling pathways and in immune response. We identified three modules that were mostly impacted by ADA therapy and included genes involved in mitogen activated protein (MAP) kinase, wingless related integration site (Wnt), fibroblast growth factor (FGF) receptor, and Toll-like receptor (TCR) signaling. A separate analysis showed that a higher percentage of DEGs was modified by ADA in responders (44%) compared to non-responders (12%). Moreover, only in the responder group, TNF, Wnt, TLRs and type I interferon signaling were corrected by the treatment. We hypothesize that these pathways are strongly associated to AS pathogenesis and that they might be considered as possible targets of new drugs in the treatment of AS.

1. Introduction

Ankylosing spondylitis (AS) is a progressive and debilitating seronegative spondiloarthritis, involving primarily the sacro-iliac joints and the spine and frequently the peripheral joints. Extra-articular tissues involvement, such as skin, tendons or eyes is often present [1]. AS has a strong genetic background being associated with the major histocompatibility complex (MHC) class I allele HLA-B27 in more than 90% of the patients [2].
The disease prevalence ranges the 0.02%–0.35% depending on the race, with a higher prevalence in males than in females [1].
According to the Assessment of SpondyloArthritis International Society/European League Against Rheumatism (ASAS/EULAR) and American College of Rheumatology/ Spondylitis Association of America/ Spondyloarthritis Research and Treatment Network (ACR/SAA/SPARTAN), there is a recommendation for patients with a predominantly active axial manifestation of AS that they should be treated for at least three months with nonsteroidal anti-inflammatory drugs (NSAIDs) followed by a tumor necrosis factor (TNF)-alpha blocker in case of non response or of NSAIDs-related side effects, while patients with both axial and peripheral involvement need treatment with TNF-blockers and eventually with disease-modifying antirheumatic drugs (DMARDS) in case of intolerance or controindication to anti-TNF-alpha treatment [3,4].
Treatment with the TNF blockers, infliximab, etanercept, adalimumab, golimumab and certolizumab, leads to a good improvement in clinical symptoms, in C-reactive protein (CRP) levels and in magnetic resonance imaging (MRI)-detectable inflammation of the sacroiliac joints [5].
In particular, Adalimumab (ADA) is a humanized monoclonal antibody against TNF-alpha, able to block both monomeric and trimeric soluble forms of TNF-alpha and cell-surface TNF-alpha, inducing cell apoptosis.
In this work, we have analyzed the transcriptome of Peripheral Blood Cells (PBCs) from patients with AS in order to identify possible mechanisms involved in the pathogenesis of the disease.
Previous studies on gene expression analyses in PBCs have identified gene signatures specifically associated to several diseases including Rheumatoid Arthritis (RA) and Systemic Lupus Erythematosus (SLE) [6,7]. Moreover, in a previous work on microarray analysis in Psoriatic Arthritis (PsA), we analyzed Differentially expressed genes (DEGs) in PBCs and in cells derived from synovial biopsies, and found that gene expression profiles of the cells obtained from the inflamed synovium are similar to those of PBCs, indicating that PBCs can be a good substitute of the target tissues to analyze disease-associated gene expression [8].
High-throughput methodologies, including microarray, have increased our understanding of many diseases. However, while several studies on gene array analyses revealed transcriptional profiles of many single genes differentially expressed in AS compared to healthy subjects, such studies have not analyzed gene product interactions and molecular pathways possibly related to the disease onset. A careful evaluation of such networks can provide a deeper insight in the understanding of disease pathogenesis. In this study, we implemented the gene-array study with networks and modules analyses to uncover possible molecular pathways associated to AS and to a good response to ADA therapy.
This is indeed a novel approach since other studies used a conventional gene expression analysis to study, at gene level, the response to TNF inhibitors in rheumatoid arthritis [9,10] and to our knowledge, there are no such studies of ankylosing spondylitis.
In AS we found deregulated genes that are involved in important pathways; moreover, such genes are differently modulated in patients that show a good response to treatment compared to non-responders. Interestingly, in patients with a good response to treatment, we also observed that ADA normalized the altered expression of genes involved in AS-associated pathways.

2. Materials and Methods

2.1. Patients

We studied a cohort of ten patients (seven males and three females, mean age: 51.8 years) affected by Ankylosing spondylitis (AS), attending the Unit of Autoimmune Diseases, at the University Hospital of Verona, Italy. A written informed consent was obtained from all the partecipants to the study. The study was approved by the local Ethical Committee and all clinical investigations have been conducted according to the principles expressed in the Helsinki declaration.
All patients fulfilled the modified New York criteria for the diagnosis of AS which included radiological and clinical criteria represented by (1) radiological evidence of sacroileitis; (2) low back pain and stiffness standing for at least three months, improved by exercise and not relieved by rest; (3) decrease of lumbar spine motility in both sagittal and frontal planes; and (4) limitation of chest expansion [11,12].
The patients underwent clinical examination and laboratory evaluation, which included inflammatory markers, such as erytrocyte sedimentation rate (ESR) and C-reactive protein (CRP), and genetic screening for the association with the allele HLA-B27. All patients underwent conventional radiography, magnetic resonance imaging (MRI) for the axial and peripheric involvement of the arthropathy. All patients were treated with the same anti-TNF agent Adalimumab, and samples for the gene array analysis were collected before and seven days after the anti-TNF injection. Adalimumab was administrated every two weeks without any side effects. The clinical features of the patients are reported in Supplementary Materials Table S1.
The evaluation of responder and non-responder patients to the treatment was carried out according to the Bath Ankylosing Spondylitis Disease Activity Index (BASDAI score), defining remission when the score is less than 3.8 [13].
Ten healthy age and sex matched healthy subjects were used as controls.

2.2. Gene Array

Blood samples were collected using PAXgene Blood RNA tubes (PreAnalytiX, Hombrechtikon, Switzerland) and total RNA was extracted following the manufacturer instructions. cRNA preparation, samples hybridization and scanning were performed following the Affymetrix (Affymetrix, Santa Clara, CA, USA) provided protocols, by Cogentech Affymetrix microarray unit (Campus IFOM IEO, Milan, Italy). Human Genome U133A 2.0 (HG-U133A 2.0) Gene Chip (Affymetrix) were used. The HG-U133A 2.0 Gene Chip covers more than 22,000 probe sets corresponding up to 14,500 well-characterized human genes. The microarray analysis was carried out using the Gene Spring software, version 12.5 (Agilent Technologies, SantaClara, CA, USA) selecting the Robust Multi-Array Average algorithm (RMA) to background-adjust, normalize, and log-transform signals intensity. As the log2 scale was used, a signal log2 ratio of 1.0 corresponds to a transcript level increase of two-fold change (2 FC) and −1.0 a lowering of two-fold change (−2 FC). A signal log2 ratio of zero indicates no change. Relative gene expression levels of each transcript were validated applying the unpaired t-test (p ≤ 0.01) and the Bonferroni multiple testing correction. Genes that displayed an expression level at least 1.5 fold different in the test sample versus control sample (p ≤ 0.01) were submitted both to functional classification, using the Gene Ontology (GO) annotations, and to Pathway analysis, employing the Panther expression analysis tools (http://pantherdb.org/) [14]. The enrichment of all pathways and functional classes associated to the differentially expressed genes compared to the distribution of genes included on the Affymetrix HG-U133A microarray was analyzed and p values ≤ 0.05, calculated by the binomial statistical test were considered as significant enrichment.

2.3. Protein-Protein Interaction (PPI) Network Construction and Network Clustering

The Search Tool for the Retrieval of Interacting Genes (STRING version 1.0; http://string-db.org/) is a web-based database which comprises experimental as well as predicted interaction informations and covers >1100 completely sequenced organisms [15]. DEGs were mapped to the STRING database to detect protein-protein interactions (PPI) pairs that were validated by experimental studies or retrieved by text mining and homology analysis [16]. A score of ≥0.7 for each PPI pair was selected to design the PPI network.
The graph-based Markov Clustering algorithm (MCL) allows to visualize high-flow areas (the clusters) [17]. In order to detect highly connected regions, the MCL algorithm was applied.
Cytoscape software [18] was used to define the topology of the builded networks.

2.4. Real Time RT-PCR

Total RNA was isolated from PBC using TRIzol reagent (Invitrogen, Carlsbad, CA, USA), following manufacturer’s instructions. First-strand cDNA was generated using the SuperScript III First-Strand Synthesis System for RT-PCR Kit (Invitrogen), with random hexamers, according to the manufacturer’s protocol. PCR was performed in a total volume of 25 μL containing 1× Taqman Universal PCR Master mix, no AmpErase UNG and 2.5 μL of cDNA; pre-designed, Gene-specific primers and probe sets for each gene (IL6ST, TNFRSF25, TNFSF8, and STAT1) were obtained from Assay-on-Demand Gene Expression Products (Applied Biosystems, Foster, CA, USA). As described in detail previously [19,20,21], Real Time PCR reactions were carried out in a two-tube system and in singleplex. The Real Time amplifications included 10 min at 95 °C (AmpliTaq Gold activation, Thermo Fisher Scientific, Waltham, MA, USA), followed by 40 cycles at 95 °C for 15 s and at 60 °C for one minute. Thermocycling and signal detection were performed with 7500 Sequence Detector (Applied Biosystems). Signals were detected according to the manufacturer’s instructions. This technique allows the identification of the cycling point where PCR product is detectable by means of fluorescence emission (Threshold cycle or Ct value). As previously reported, the Ct value correlates to the quantity of target mRNA [22]. Relative expression levels were calculated for each sample after normalization against the housekeeping genes GAPDH, beta-actin and 18 s ribosomal RNA (rRNA), using the ΔΔCt method for comparing relative fold expression differences [19,23]. The data are expressed as fold change. Ct values for each reaction were determined using TaqMan SDS analysis software. For each amount of RNA tested triplicate Ct values were averaged. Because Ct values vary linearly with the logarithm of the amount of RNA, this average represents a geometric mean.

3. Results

In order to identify gene expression profiles associated with AS, we compared the gene expression profiles of PBC samples obtained from 10 AS patients before treatment with ADA with 10 PBC samples obtained from healthy age and sex matched donors.
We found that 740 modulated transcripts satisfied the Bonferroni–corrected p value criterion (p ≤ 0.01) and the fold change criterion (FC ≥ |1.5|), showing robust and statistically significant variation between AS and healthy controls samples. In particular, 615 and 125 transcripts resulted to be over- and underexpressed respectively. The complete list of modulated genes can be found in Supplementary Materials Table S2.
The Gene Ontology analysis showed that a large number of the modulated transcripts can be ascribed to biological processes that may play a role in AS, including: cell proliferation, extracellular matrix organization, angiogenesis, immune response, inflammatory response, interleukin-6 production, ossification, bone remodeling and signal transduction. Among these processes we noticed that signal transduction and immune response were the most represented biological processes. We also observed that immune response encompassed several Th-17-related genes including CD28 molecule, CD3 molecule epsilon (CD3E) and gamma (CD3G) subunits, CD4 molecule, transforming growth factor beta 1 (TGFB1), interleukin 6 receptor (IL6R), interleukin 6 signal transducer (IL6ST).
The signal transduction functional class included genes that may be ascribed to different subcategories including: inflammation mediated by chemokine and cytokine signaling pathway, Jak-Stat signaling pathway, Wnt signaling pathway, mirogen-activated protein kinase (MAPK) cascade, tumor necrosis factor-mediated signaling pathway, TLR signaling pathway, cytokine-mediated signaling pathway, Type I interferon signaling pathway, fibroblast growth factor receptor signaling pathway, T-cell receptor signaling pathway, small GTPase mediated signal transduction, transforming growth factor (TGFB) signaling, Notch signaling and phosphatidylinositol-mediated signaling.
Table 1 and Table 2 show a detailed selection of DEGs within the above-mentioned processes. The tables also include GeneBank accession numbers and fold changes.
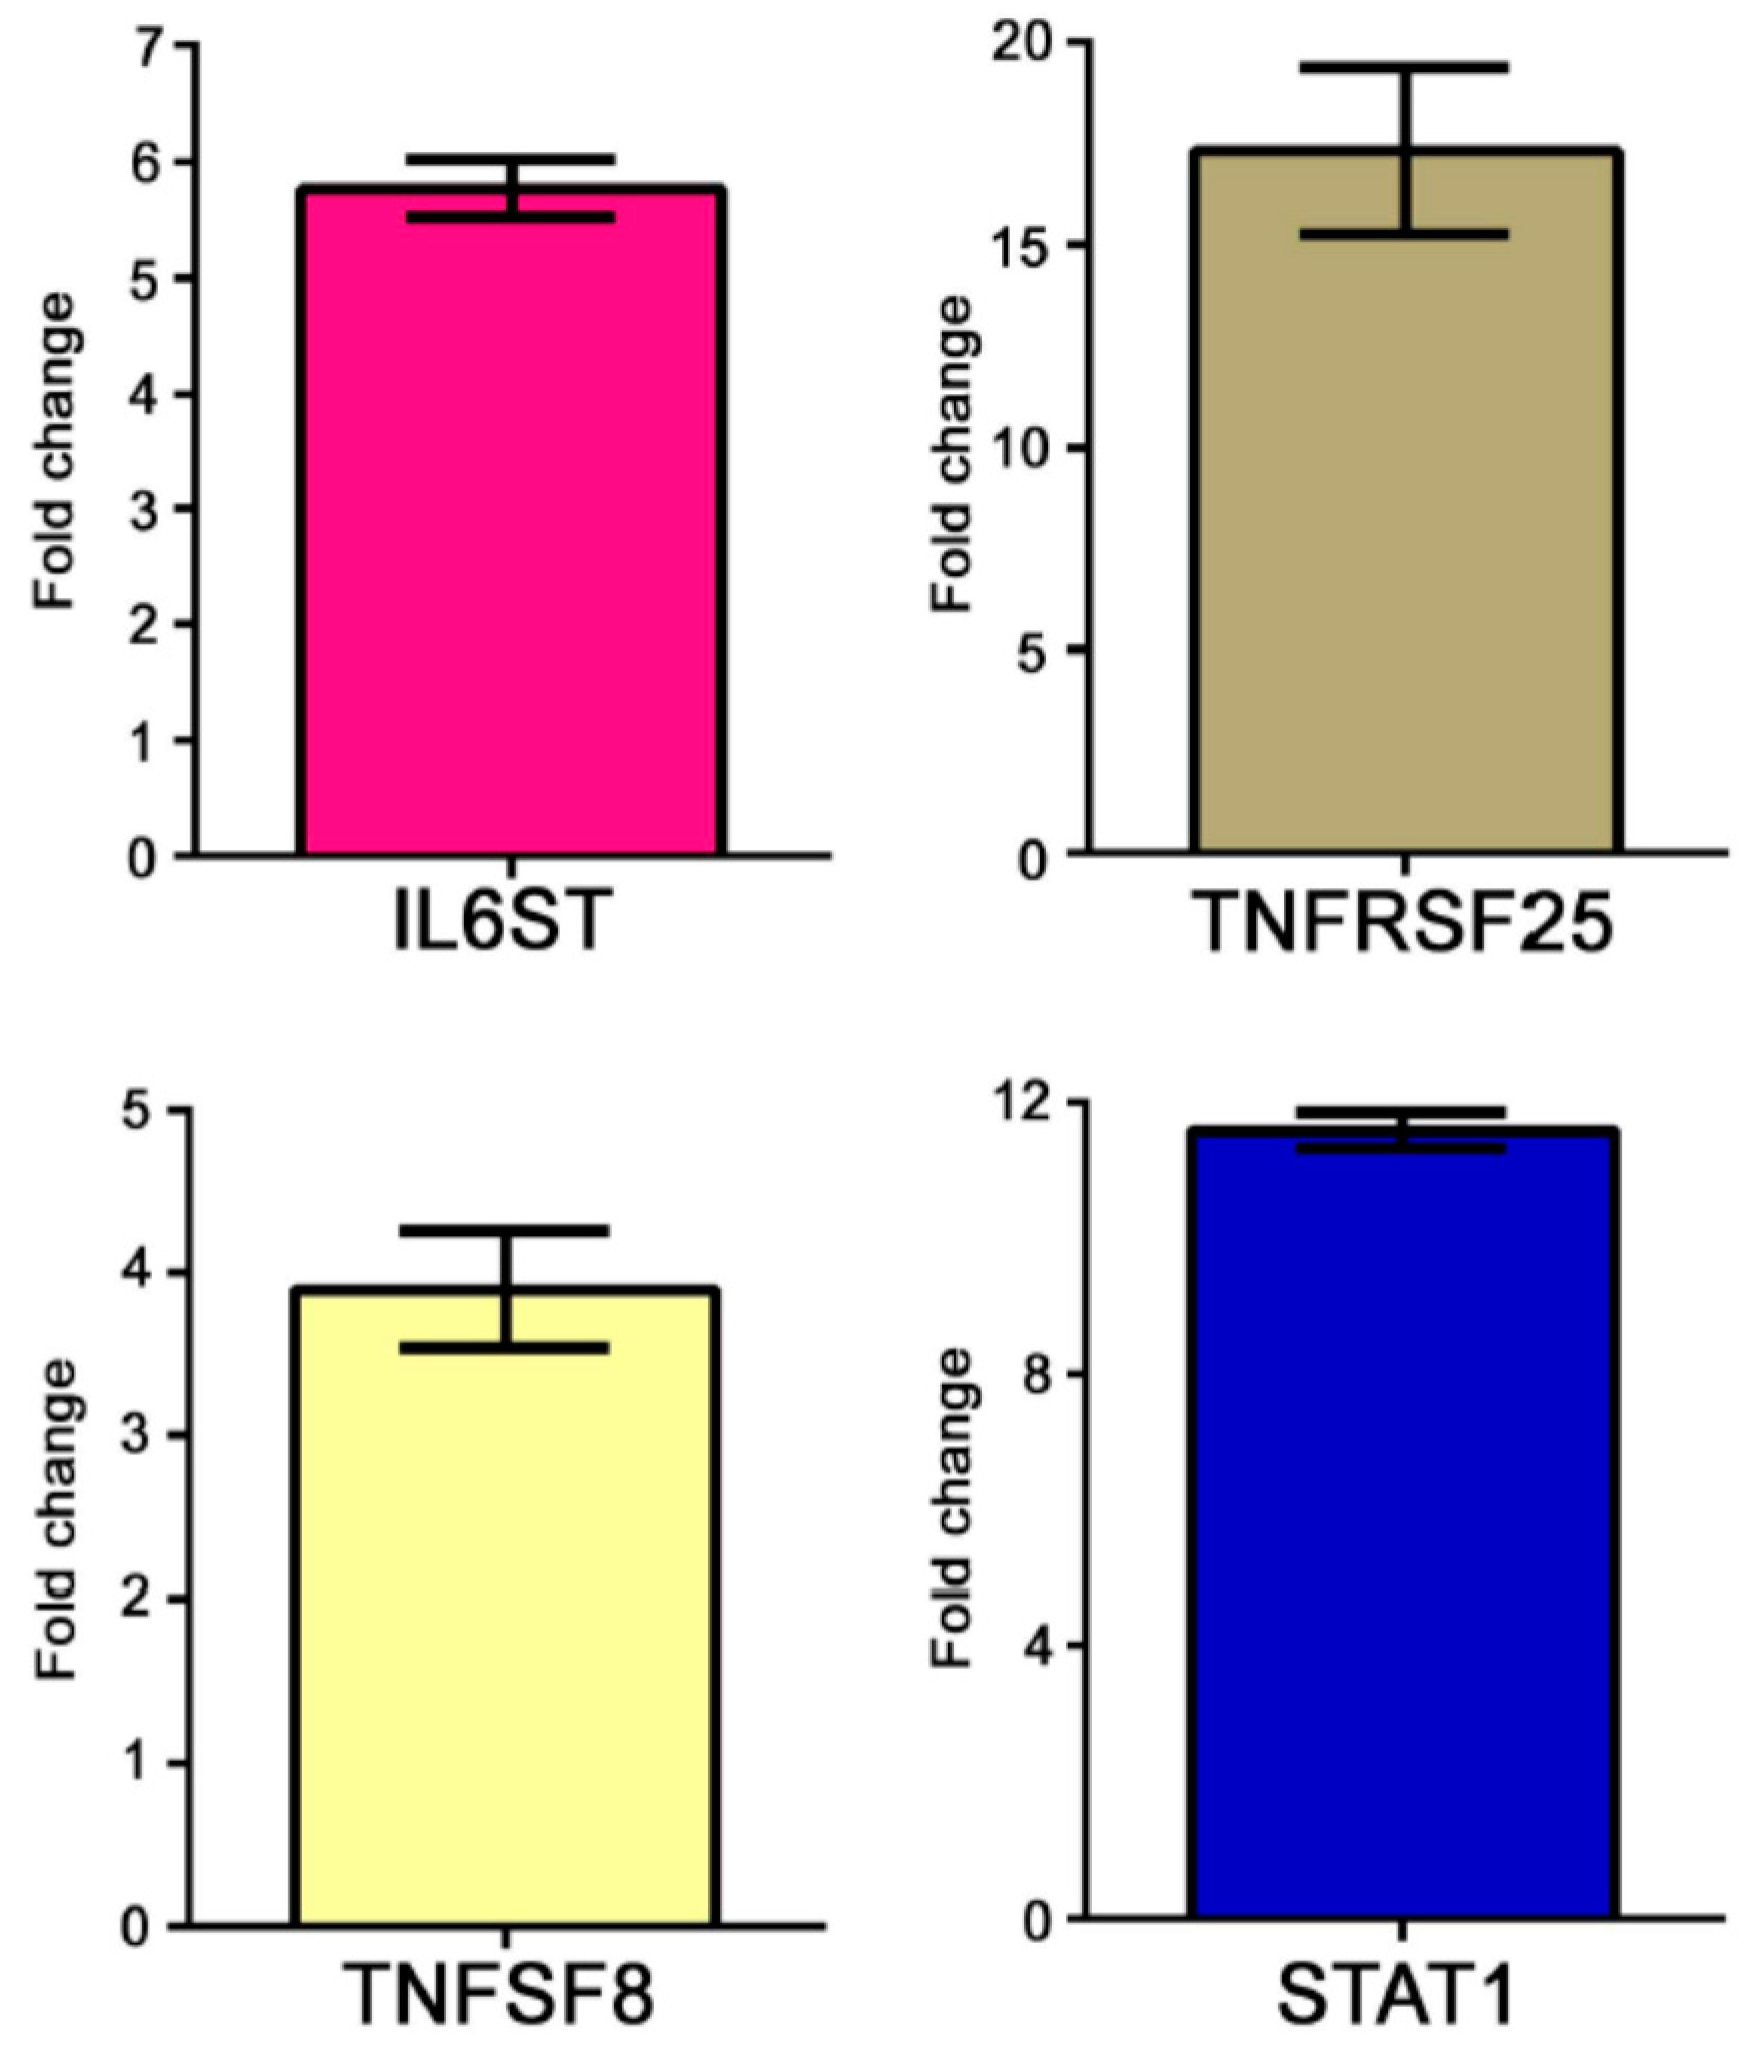
The modulation of some genes observed by gene array analysis was validated by Q-PCR (Figure 1).
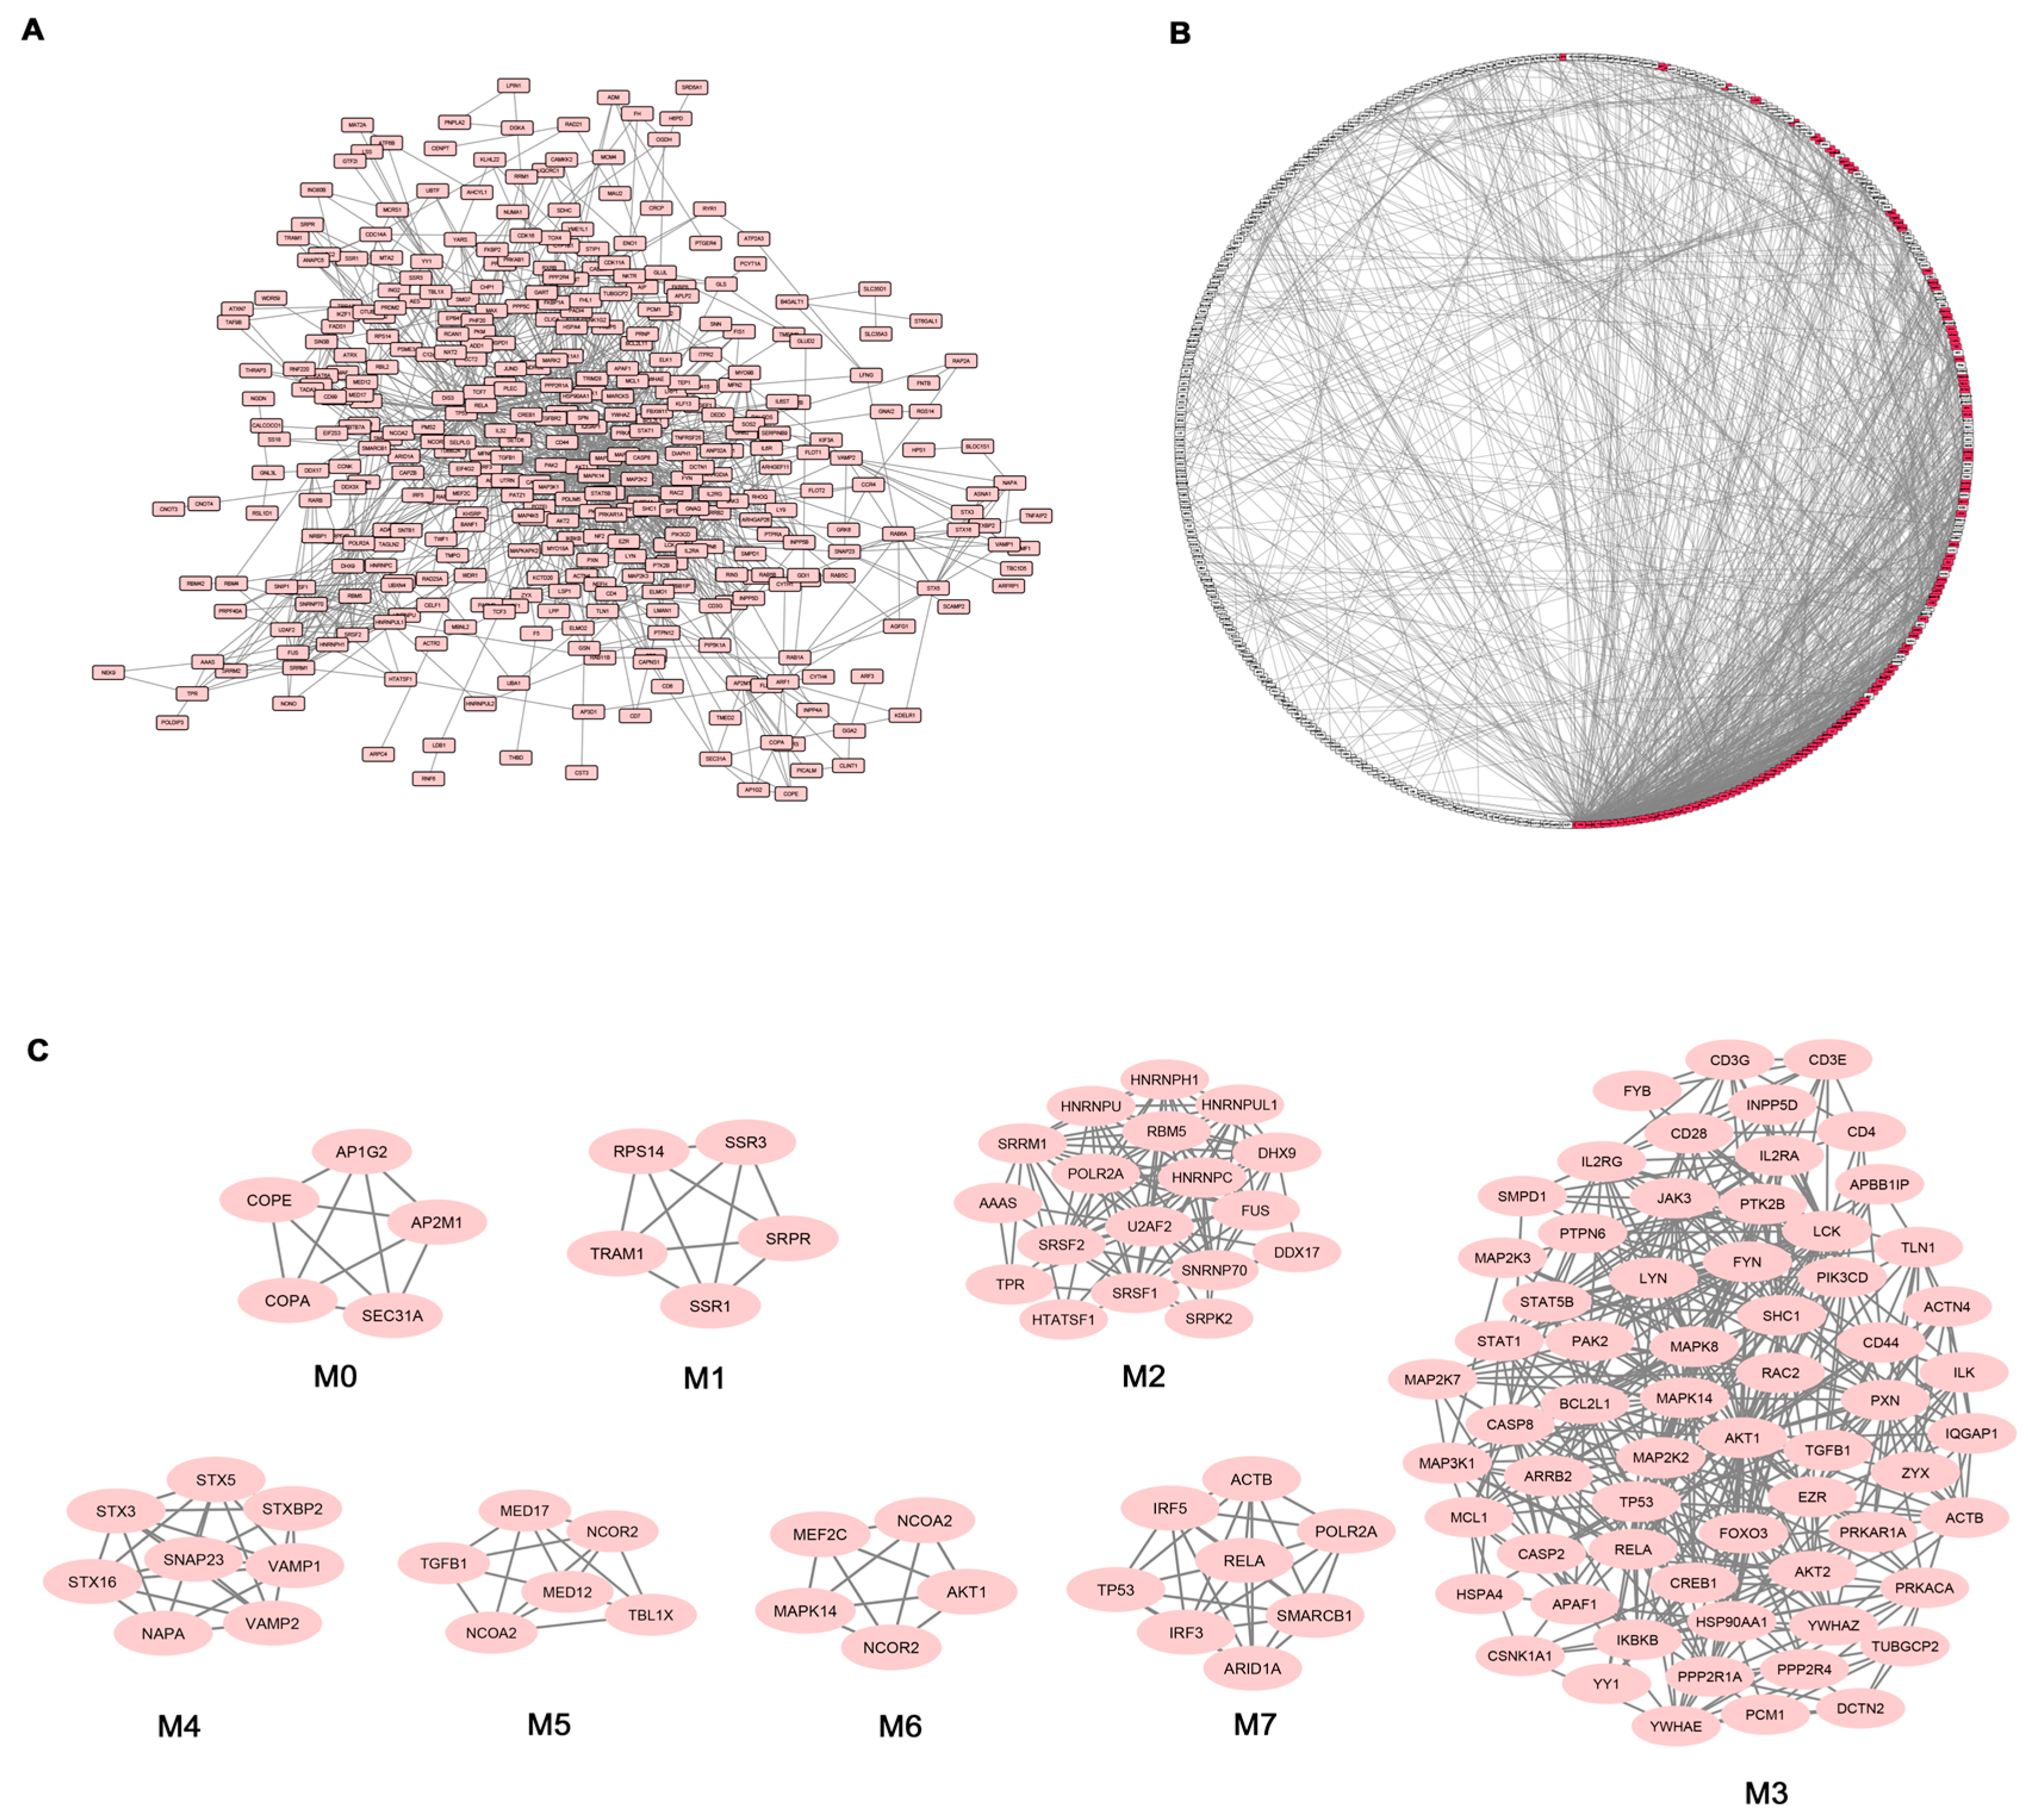
Given the high number of DEGs and the corresponding functional classes, to make our study more informative, we decided to complement the gene expression profiling of AS PBC with the study of functional interactions between the protein products of modulated genes. To this aim, a protein-protein interaction (PPI) network comprising 401 genes (nodes) and 1345 pairs of interactions (edges) was obtained (Figure 2A). In Figure 2B the interconnected genes are represented in a circular graph and are ordered based on their degree of connectivity, so genes with a similar degree of connectivity are placed close to each other. We then submitted the PPI network to a modular analysis to find set of densely interconnected nodes (modules) that are expected to participate in multiple biological activities in a coordinated manner. We identified eight modules (k = 5) that are graphically represented in Figure 2C. Figure 2B shows that the genes belonging to the eight modules (highlighted in red) are distributed (concentrated) over an area in which the highest degrees of connectivity are present, thus confirming that they are highly connected genes.
We next performed functional enrichment analysis to identify association of genes, in each module, with different “GO terms” and pathways. All the significantly enriched categories for each module are shown in Supplementary Materials Table S3 and included pathogenetically relevant processes such as: T-cell receptor signaling (module M3), TLRs signaling (modules M3 and M7), small GTPase signaling (module M3) Wnt signaling (module M7), p38 MAP kinase cascade (modules M3 and M6) Jak-stat signaling (module M3) fibroblast growth factor receptor signaling (module M3) inflammation mediated by chemokine and cytokine signaling pathway (modules M3 and M7) VEGF signaling (modules M3 and M6) angiogenesis (module M3).
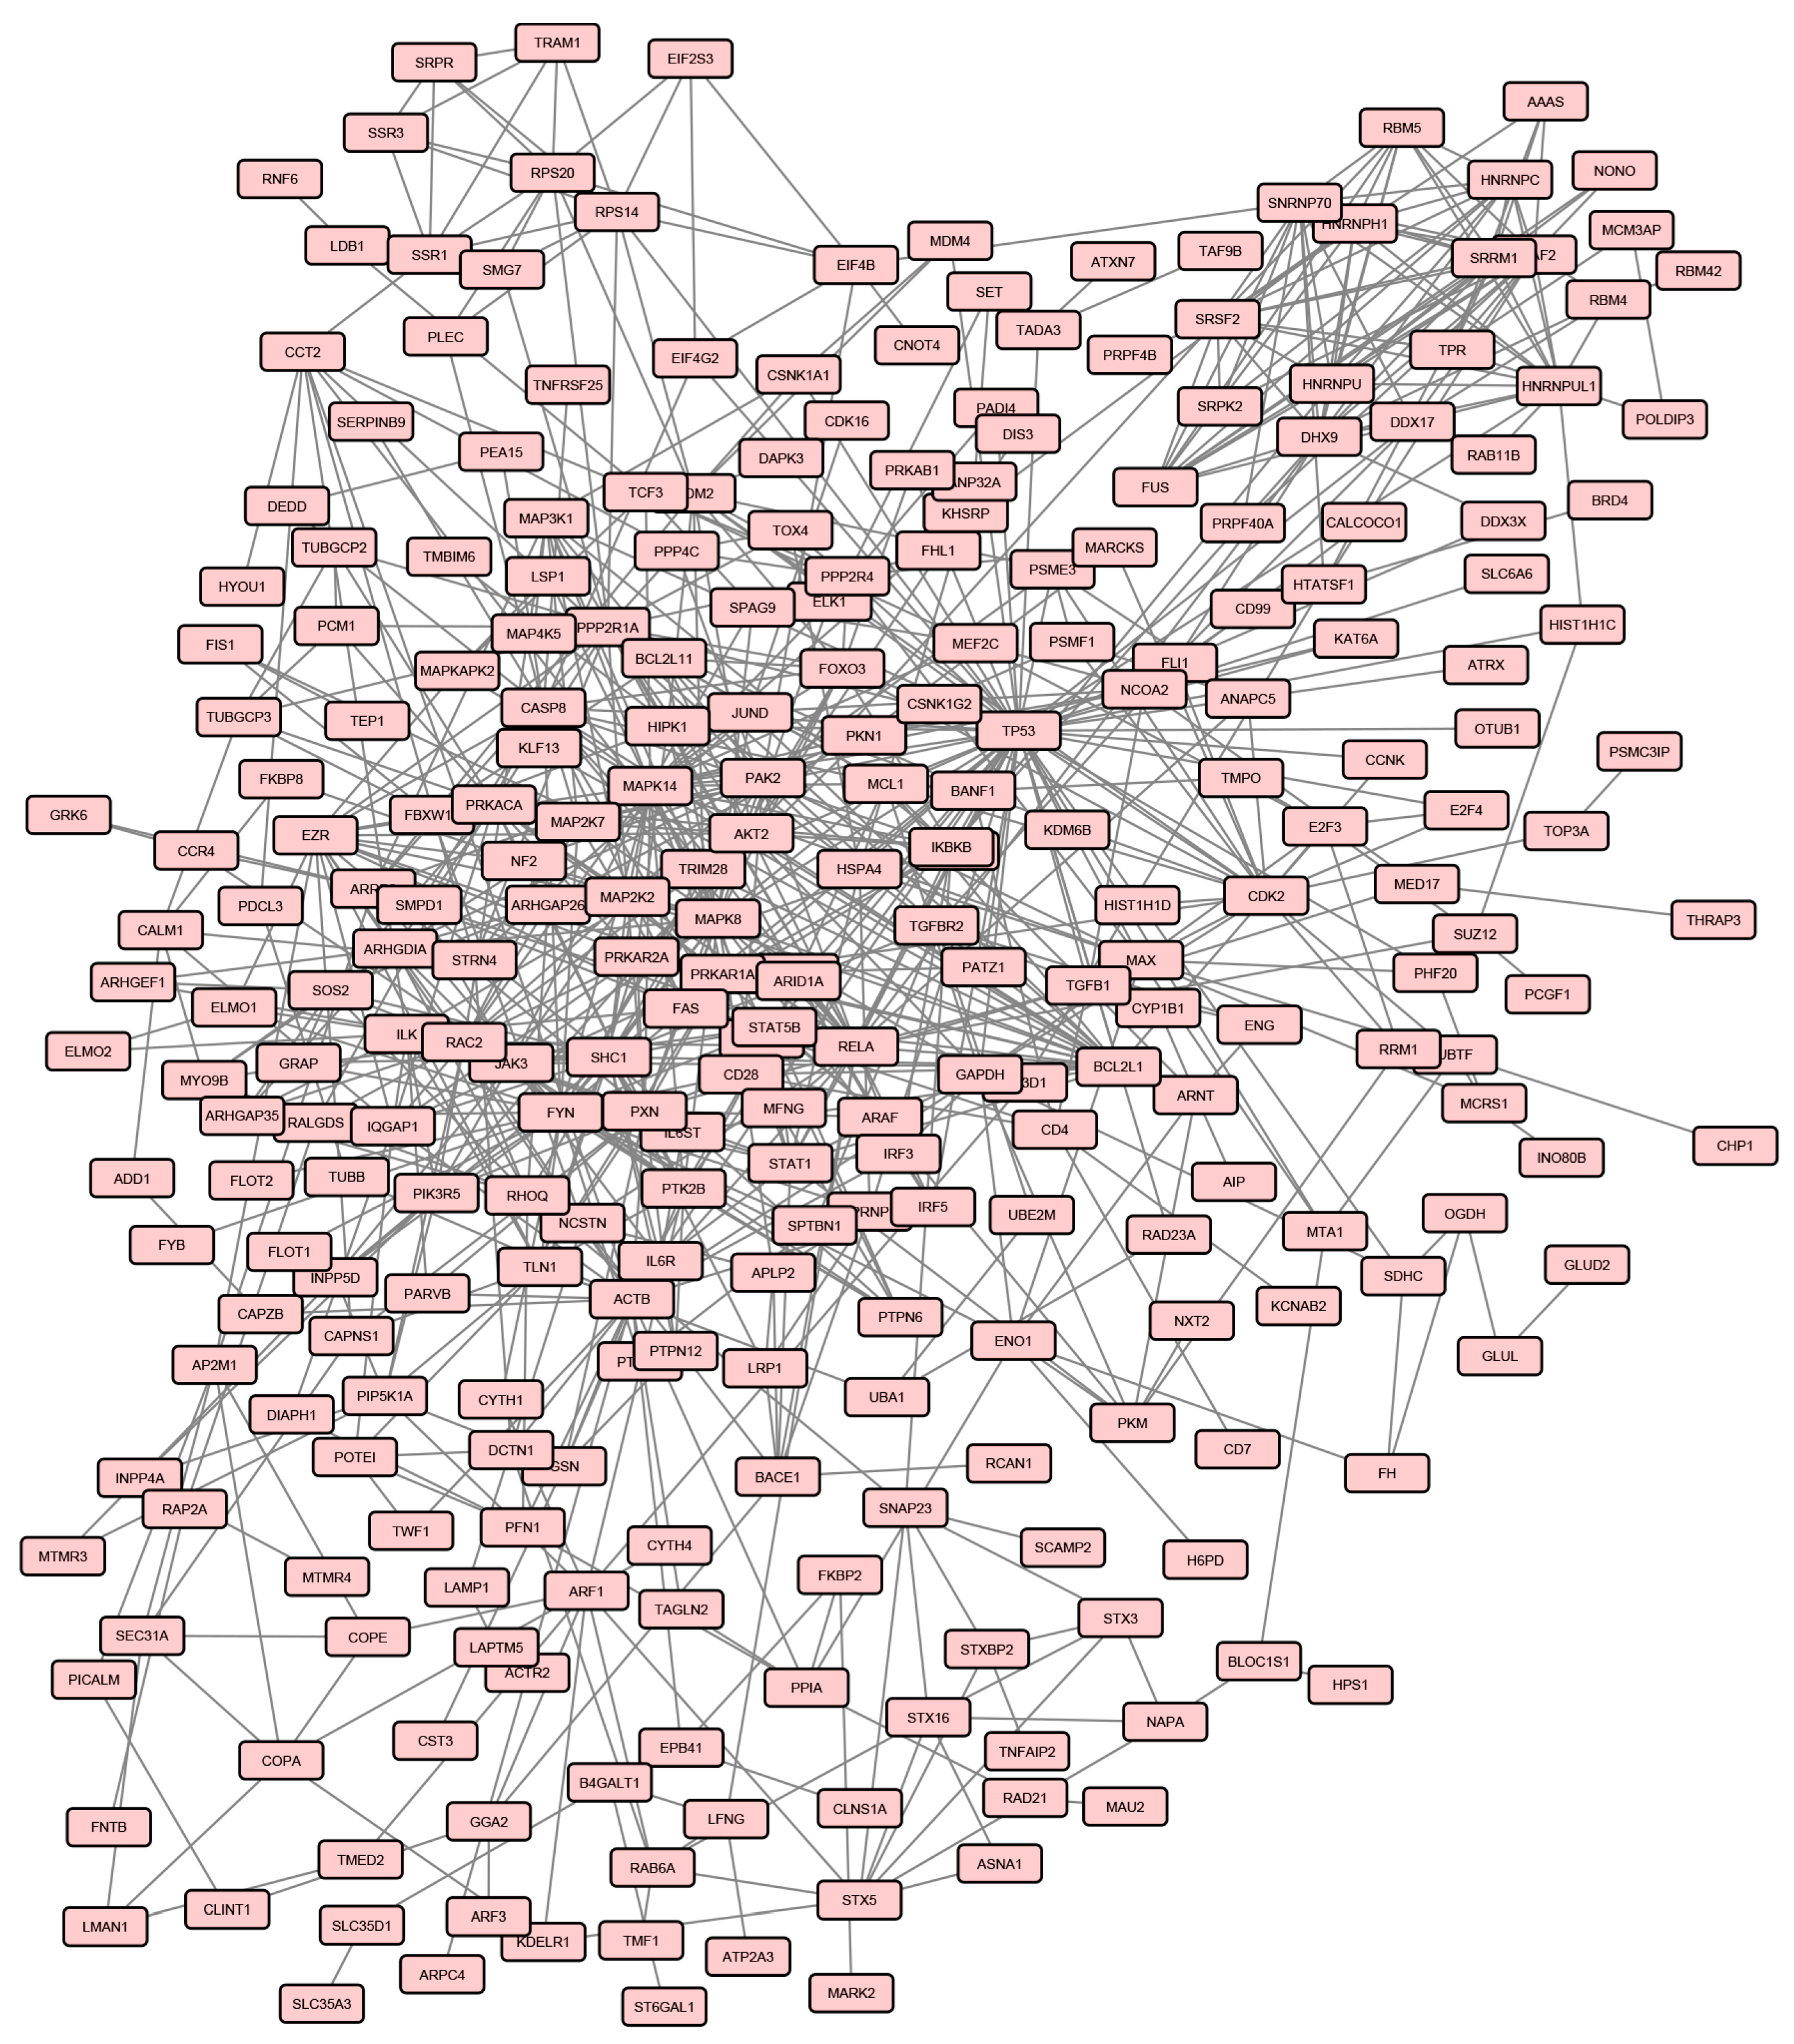
In order to evaluate the effect of treatment on gene expression in AS patients, we analysed the transcriptional profiles obtained from the same AS patients seven days after ADA administration.
When the same Bonferroni-corrected p value and fold change criteria were applied, 571 genes were differentially expressed in AS patients after treatment compared to healthy controls, in particular 492 and 79 transcripts resulted to be up- and down-regulated respectively (Supplementary Materials Table S4). The protein products of 297 DEGs, among the above mentioned genes, were connected in a PPI network involving 819 pairs of interactions (Figure 3), from which 7 modules can be extracted.
We next performed GO biological process and pathways enrichment analysis of genes included in the seven modules. Modules and the resulting enriched functional categories are listed in Supplementary Materials Table S5.
Afterwards, we compared the lists of processes enriched in modules from the two analysis (samples before treatment versus healthy controls and samples after treatment versus healthy controls) and we found that several pathways and biological processes were enriched only in the pre-treatment associated modules (Table 3).
In particular, we found that after treatment the enrichment in p38 MAPK (p value = 0.007), P53 pathway feedback loops 1 (p value = 0.005), PI3 kinase pathway (p value = 0.015) and Wnt signaling pathways (p value < 0.001) disappeared. In addition, we observed that all pathways that showed an enrichment only in the pre-treatment condition were associated to the pre-treatment associated modules M3, M6 and M7.
Many biological processes were also influenced by the therapy, since they were no longer enriched after treatment. These processes were associated to the pre-treatment module M3 and included: fibroblast growth factor receptor signaling (p value < 0.001), small GTPase mediated signal transduction (p value = 0.040), immune effector process (p value = 0.007), leukocyte migration (p value = 0.032), positive regulation of T-cell proliferation (p value = 0.035), response to interleukin-2 (p value = 0.001), T-cell costimulation (p value < 0.001), T-cell differentiation (p value = 0.015), T-cell receptor signaling (p value < 0.001), and phosphatidylinositol-mediated signaling pathway (p value = 0.002).
Although the patients enrolled in the study were homogeneous as far as clinical features and stage of the disease concern, we could identify two groups who showed a different response to treatment.
The first group (group 1) consisted of 6 patients who had a very good response to the treatment with disease remission and the second group (group 2) of four patients who showed a poor response to the treatment.
We then performed a gene array analysis by dividing patients in two groups, according to their response to the treatment, and comparing the expression profiles of two groups, before and after treatment, to those of the healthy control samples.
Before treatment we observed that in the first group of patients 689 genes, and in the second group 987 genes were modulated (Supplementary Materials Tables S6 and S7). After treatment, a modulation of 846 transcripts in the first group of patients and of 1077 genes in the second group was observed compared to the control group (Supplementary Materials Tables S8 and S9). When we compared genes modulated pre- and post-treatment in the two groups, we observed that 306 genes in the first group and 119 genes in the second group, returned to baseline expression levels after treatment, showing an expression level comparable to that of healthy controls.
To finely dissect the effect of ADA treatment on gene expression profiles in the two patients groups, we decided to functionally analyze these genes and we found that ADA had an impact on genes involved in signaling events that may be related to the pathogenesis of the disease. In particular, we compared the two lists of biological signaling in which DEGs, that were corrected by the treatment, were involved (Table 4).
We found that some of these categories were shared by the two groups of patients, (i.e., immune response, inflammatory response, angiogenesis, MAP kinase, Jak-Stat small GTPase, T-cell receptor, Notch and TGF-beta signaling) while others were only associated to group 1 (i.e., interleukin 6 production, cytokine mediated, NIK/NF-Kappa B, Toll-like receptor, Tumor necrosis factor, Type 1 interferon, and Wnt signaling) or to group 2 (i.e., EGF receptor, Ephrin receptor, Fc-gamma receptor signaling and positive regulation of BMP and VEGF signaling).
A selection of the above-mentioned genes, which were corrected by the treatment in the two groups of patients, referred to as “genes modulated only before treatment is reported in Table 5 and Table 6, where transcripts are grouped according to the Gene Ontology classification criteria. These tables also show the fold changes resulting from the comparison of pre- or post-treatment condition versus healthy controls.
Then we also performed a functional enrichment analysis to detect biological processes that were significantly enriched in genes corrected by the treatment.
Some of the enriched biological classes were related to the immune response and, in particular, to the activation of B and T-cell response, as indicated by the enrichment in T-cell activation (p value = 0.005), positive regulation of B-cell activation (p value = 0.041) and B-cell cytokine production (p value = 0.024) categories in the first group, and by the enrichment in T-cell activation (p value = 0.038) and positive regulation of B-cell activation (p value = 0.015) classes in the second group (Table 7). Genes involved in inflammation were also well represented in the two datasets modulated only before treatment and the two classes “inflammatory response” (p value = 0.026) and “NLRP3 inflammasome complex assembly” (p value = 0.006) were enriched in the first and in the second group, respectively.
In addition, we also identified functional classes that were enriched only in one of the two groups of patients. These classes were: positive regulation of cytokine production (p value = 0.012) positive regulation of type I interferon production (p value = 0.017) Toll-like receptor signaling pathway (p value = 0.039) positive regulation of interleukin-2 production (p value = 0.001) cellular response to unfolded protein (p value = 0.001) in the first group and, angiogenesis (p value = 0.002) response to transforming growth factor beta (p value = 0.010) and G-protein coupled receptor signaling pathway (p value = 0.031) in the second group.

4. Discussion

In this work, we first compared the gene expression profiles of 10 AS patients before treatment with 10 healthy controls. Secondly, we analysed the gene expression before and after ADA therapy, in order to identify biological processes that may be modulated by the drug. Finally, we compared gene profiles of patients characterized by a different response to the treatment.
Our results showed that AS has a profound impact on gene expression, since a large number of genes are modulated in AS samples. Moreover, DEGs have a role in biological processes that may be pathogenetically relevant to both the disease onset and progression.
The pathological features of AS are supposed to originate from several events that may interact, including biomechanical insult, genetic background, infections, inflammation and immune response, even though the precise mechanisms of the immune activation are still a matter of discussion [24].
We here identified a large number (40) of genes that have well-documented roles in the immune response, including for example TNFSF8/CD30L, interleukin-32 and several Th17-lymphocytes-related genes. TNFSF8 is a TNF-family member expressed on activated peripheral blood T-cells, B-cells, neutrophils, mast cells, monocytes, and macrophages and it is the ligand for CD30, a molecule that is present at high levels in AS patients compared to healthy controls [25]. The CD30/CD30L signaling system has been implicated in the pathogenesis of several autoimmune and inflammatory diseases and it has been recently associated to the pathogenesis of rheumatoid arthritis synovitis [26].
Interleukin-32 is a proinflammatory cytokine produced by T lymphocytes, natural killer cells, blood monocytes and fibroblast-like synoviocytes in the joints. It is present in the synovial fluid of AS patients at higher levels compared with RA or osteoarthritis patients and induces osteoblast differentiation leading to pathological bone growth [27].
Th17 cells have been associated to several autoimmune disorders including SLE, RA and psoriasis where they play a role in the pathogenesis of the disease [28,29,30]. Recent studies have demonstrated that Th17 cells are involved also in the pathogenesis of AS [31].
It is well known that the pathogenesis of AS is characterized by three phases: inflammation, erosion and abnormal bone outgrowth [32]. In this regard our data seem to recapitulate all these pathogenetic stages, showing deregulation of genes involved in the inflammatory process as well of transcripts that play a role in bone remodeling (i.e., bone growth and bone erosion).
Although the precise events that prime inflammation in spondyloarthritis is still unclear, recent findings provided evidence of the involvement of immune pathways, including the lately described IL-17/IL-23 pathway, NF-κB activation and antigen presentation [33] reintroducing the issue of autoimmune versus autoinflammatory disease. To date, however, no immunological pathway has emerged as the master regulator that may finely orchestrate the disease pathogenesis.
Interestingly, we found a remarkable number of DEGs included genes acting in commonly known immunological signalings such as TNF, MAP kinase cascade, Wnt, Toll-like receptor, TGF beta, T-cell receptor, Type I interferon, and Jak-stat signaling.
TNF-alpha is one of the main actors in the inflammatory scenario during the disease progression. Interestingly, here we show up-regulation of several genes involved in the TNF-alpha signaling including TNFRSF25. This molecule is a tumor necrosis factor receptor mainly expressed on T-cells [34] that has been associated with autoimmune diseases such as RA. Moreover, it has been reported that the absence of TNFRSF25 protects from the development of severe bone disorders in experimental antigen-induced arthritis (AIA) [35]. Along with the upregulation of TNF-related genes we also found overexpression of genes involved in interleukin-6 production and signal transduction (including IL6R and IL6ST) together with overexpression of transcripts of the MAP kinases cascade, two well-documented down-stream events of the biologic response to TNF [36]. In particular, it has been shown that high serum levels of IL-6 may associate with the development of AS [36]. The triggering of mitogen-activated kinase (MAPK) signaling cascade leads to activation of downstream JUN N-terminal kinase (JNK) and p38/MAPK14 [37], which is involved in the proinflammatory activity of interleukin 1 (IL-1) and TNF-alpha [38]. The transcript for this kinase was 1.8 fold increased in AS samples. Interestingly, it has been shown that inhibition of p38 can restore chondrocyte proliferation in inflammatory bone diseases such as spondyloarthritis [38].
The Wnt signaling components are critically involved in normal bone homeostasis, and in particular in new bone formation [32]. Moreover, it has been recently suggested that Wnt signaling may take part to the process of ankylosis in spondyloarthritis [32].
Deregulation of TLR signaling has been already described in AS [39] and there is emerging evidence of a potential role of TLRs in AS [40].
The up-regulation of genes involved in TGF-beta signaling is not surprising, since TGF-beta is important for bone formation and has been detected in biopsy specimens from sacroiliac joints of patient with AS where it may play a role in articular cartilage fibrosis and ossification [41]. Moreover, this cytokine is also involved in adaptive immune responses by regulating effector and regulatory CD4+ T-cell responses [42]. The importance of T-cell response is highlighted in our AS samples by the up-regulation of several T-cell related genes involved in T-cell receptor signaling including CD3g molecule, gamma (CD3G) and T-cell receptor alpha constant (TRAC). In particular, the association of this signaling pathway with AS has been already suggested by Chen et al. in a previous whole-blood gene expression study [43]. Among the modulated genes, we also found overexpression of transcripts for members of type I IFN signaling, a network typically associated with autoimmune diseases such as SLE, RA, Crohn’s disease and Sjogren syndrome [44,45,46,47,48,49,50].
In this regard, the co-presence of type I IFN signaling and Th-17 related genes may be suggestive for an autoimmune origin of AS, since the co-activity of IFN and Th17 pathways is typical of autoimmunity and has been described both in human diseases and in animal models [51,52,53].
Another signaling pathway relevant to autoimmunity is the Jak-stat pathway [54] that is represented in our dataset by the upregulation of STAT1 and STAT5b. It has been described that STAT1 gain-of-function mutations are associated to autoimmune response [54] and that this molecule is differentially expressed in AS patients by transcriptome network analysis [55]. In addition we also found modulation of genes involved in fibroblast growth factor receptor, small GTPase and Notch signalings. It is worthwhile mentioning that the first favours the formation of new bone in AS patients [56], the second triggers proliferation of rheumatoid synovial fibroblasts [57] and the Notch signaling is involved in ligament ossification of hip joints in AS [58].
In the next step of our data analysis we found that DEG products were connected in a wide PPI network from which we obtained eight functional modules, containing the most functionally interconnected genes. These modules were significantly enriched in several of the above mentioned pathologically relevant processes and pathways including: T-cell receptor signaling, TLRs signaling, small GTPase signaling, Wnt signaling, p38 MAP kinase cascade and Jak-stat signaling.
Moreover, this analysis was paralleled by the comparison of post-treatment samples to healthy controls and, in this case, the resulted PPI network included seven modules.
Interestingly, by comparing pathways and biological processes enrichments of modules derived from the pre- and the post-treatment conditions, we identified three pre-treatment-associated modules (M3, M6, and M7) towards which the drug seemed to direct its activity. Indeed several crucial processes and pathways, enriched in these modules, were no longer enriched after treatment, including p38 MAP kinase, Wnt, FGF receptor, small GTPase, T-cell receptor and PI3 kinase signaling.
To more finely dissect the impact of treatment on expression profiles of AS samples, we separately analyzed the two groups of patients that were characterized by a different response to the treatment.
The two analyses showed that a quite different number of genes were modulated before treatment in the two datasets. In particular, after comparing genes modulated before and after treatment in the two groups of patients, we found a different number of genes that returned to a normal expression level after treatment.
Focusing our analysis on these genes, we realized that globally, in both groups of patients, the treatment had an impact on many pathologically relevant biological processes, including immune response, inflammatory response, angiogenesis and on several signaling pathways (i.e., Jak-Stat signaling, MAP kinase cascade and Small GTPase signaling). However we also observed that only in the responders group (group 1), genes involved in Toll-like receptor signaling, tumor necrosis factor signaling, Type I interferon signaling and Wnt signaling returned to normal.
Moreover, when we specifically analyzed the categories enriched in genes corrected by the treatment in the two groups of patients, we observed, in both data sets, an enrichment in the inflammatory response and in the lymphocytes activation processes, but we also observed that several categories were enriched only in the group 1, including regulation of interleukin-2 production, cellular response to unfolded protein, positive regulation of type I interferon production and toll-like receptor signaling.
These results suggest that the differences emerged from the separated analysis of the two groups of patients, may be partially related to the different response to treatment. In particular, we have identified altered processes and signaling that may be more strongly associated to AS pathogenesis since they are corrected by the treatment in patients with a good response.
We suggest that these biological processes may be the target of novel therapies if our results are confirmed in further experiments and in a larger number of patients.

5. Conclusions

The etiology of AS is still unknown and the identification of the involved molecular pathogenetic pathways is a crucial issue in medicine. ADA in an humanized anti-TNF-alpha monoclonal antibody, used in the treatment of AS. Our study aimed at analyzing gene transcriptional profiles in patients with AS before and after treatment with ADA. A sophisticated analysis (i.e., PPI network clustering analysis) was used to study DEGs in AS patients before and after treatment.
By PPI network analysis it was possible to identify clusters of genes specifically associated to AS. Within these clusters DEGs belong to well known molecular pathways which play a prominent role in disease pathogenesis. Some of these pathways are strongly modified by ADA in patients with a good response to the treatment. These potentially pathogenetic pathways are not significantly modified in non responder subjects. Clustering network analysis is therefore a promising tool in gene expression studies and may help to identify new potential therapeutical targets in AS.

Supplementary Materials

The following are available online at www.mdpi.com/2073-4425/8/4/127/s1. Table S1: Clinical features of the patients enrolled in the study, Table S2: Genes modulated in AS patients before treatment versus healthy controls, Table S3: Enriched biological processes and pathways related to the eight pre-treatment modules, Table S4: Genes modulated in AS patients after treatment versus healthy controls, Table S5: Enriched biological processes and pathways related to the seven after -treatment modules, Table S6: Genes modulated in AS patients, group 1 before treatment versus healthy controls, Table S7: Genes modulated in AS patients, group 2 before treatment versus healthy controls, Table S8: Genes modulated in AS patients, group 1 after treatment versus healthy controls, Table S9: Genes modulated in AS patients, group 2 after treatment versus healthy controls.

Acknowledgments

This work was supported by a grant from the Ministry for Universities and Scientific and Technological Research (MURST) (Grant recipients Antonio Puccetti and Claudio Lunardi).

Author Contributions

Marzia Dolcino, Antonio Puccetti and Claudio Lunardi conceived and designed the experiments; Marzia Dolcino and Andrea Pelosi performed the experiments and analyzed the data; Elisa Tinazzi, Giuseppe Patuzzo and Francesca Moretta studied the patients and provided the clinical samples; Marzia Dolcino, Antonio Puccetti and Claudio Lunardi wrote the paper.

Conflicts of Interest

The authors declare no conflict of interest.

References

  1. Stolwijk, C.; Essers, I.; van Tubergen, A.; Boonen, A.; Bazelier, M.T.; de Bruin, M.L.; de Vries, F. The epidemiology of extra-articular manifestations in ankylosing spondylitis: A population-based matched cohort study. Ann. Rheum. Dis. 2015, 74, 1373–1378. [Google Scholar] [CrossRef] [PubMed]
  2. Reveille, J.D. An update on the contribution of the MHC to as susceptibility. Clin. Rheumatol. 2014, 33, 749–757. [Google Scholar] [CrossRef] [PubMed]
  3. Braun, J.; van den Berg, R.; Baraliakos, X.; Boehm, H.; Burgos-Vargas, R.; Collantes-Estevez, E.; Dagfinrud, H.; Dijkmans, B.; Dougados, M.; Emery, P.; et al. 2010 update of the ASAS/EULAR recommendations for the management of ankylosing spondylitis. Ann. Rheum. Dis. 2011, 70, 896–904. [Google Scholar] [CrossRef] [PubMed]
  4. Ward, M.M.; Deodhar, A.; Akl, E.A.; Lui, A.; Ermann, J.; Gensler, L.S.; Smith, J.A.; Borenstein, D.; Hiratzka, J.; Weiss, P.F.; et al. American college of rheumatology/spondylitis association of america/spondyloarthritis research and treatment network 2015 recommendations for the treatment of ankylosing spondylitis and nonradiographic axial spondyloarthritis. Arthritis Rheumatol. 2016, 68, 282–298. [Google Scholar] [CrossRef] [PubMed]
  5. Sieper, J.; oddubnyy, D. New evidence on the management of spondyloarthritis. Nat. Rev. Rheumatol. 2016, 12, 282–295. [Google Scholar] [CrossRef] [PubMed]
  6. Batliwalla, F.M.; Baechler, E.C.; Xiao, X.; Li, W.; Balasubramanian, S.; Khalili, H.; Damle, A.; Ortmann, W.A.; Perrone, A.; Kantor, A.B.; et al. Peripheral blood gene expression profiling in rheumatoid arthritis. Genes Immun. 2005, 6, 388–397. [Google Scholar] [CrossRef] [PubMed]
  7. Baechler, E.C.; Batliwalla, F.M.; Karypis, G.; Gaffney, P.M.; Ortmann, W.A.; Espe, K.J.; Shark, K.B.; Grande, W.J.; Hughes, K.M.; Kapur, V.; et al. Interferon-inducible gene expression signature in peripheral blood cells of patients with severe lupus. Proc. Natl. Acad. Sci. USA 2003, 100, 2610–2615. [Google Scholar] [CrossRef] [PubMed]
  8. Dolcino, M.; Ottria, A.; Barbieri, A.; Patuzzo, G.; Tinazzi, E.; Argentino, G.; Beri, R.; Lunardi, C.; Puccetti, A. Gene expression profiling in peripheral blood cells and synovial membranes of patients with psoriatic arthritis. PLoS ONE 2015, 10, e0128262. [Google Scholar] [CrossRef] [PubMed]
  9. Oliveira, R.D.; Fontana, V.; Junta, C.M.; Marques, M.M.; Macedo, C.; Rassi, D.M.; Passos, G.A.; Donadi, E.A.; Louzada-Junior, P. Differential gene expression profiles may differentiate responder and nonresponder patients with rheumatoid arthritis for methotrexate (MTX) monotherapy and MTX plus tumor necrosis factor inhibitor combined therapy. J. Rheumatol. 2012, 39, 1524–1532. [Google Scholar] [CrossRef] [PubMed]
  10. Kim, T.H.; Choi, S.J.; Lee, Y.H.; Song, G.G.; Ji, J.D. Gene expression profile predicting the response to anti-TNF treatment in patients with rheumatoid arthritis; analysis of GEO datasets. Joint Bone Spine 2014, 81, 325–330. [Google Scholar] [CrossRef] [PubMed]
  11. Van der Linden, S.; Valkenburg, H.A.; Cats, A. Evaluation of diagnostic criteria for ankylosing spondylitis. A proposal for modification of the New York criteria. Arthritis Rheum. 1984, 27, 361–368. [Google Scholar] [CrossRef] [PubMed]
  12. Raychaudhuri, S.P.; Deodhar, A. The classification and diagnostic criteria of ankylosing spondylitis. J. Autoimmun. 2014, 48–49, 128–133. [Google Scholar] [CrossRef] [PubMed]
  13. Godfrin-Valnet, M.; Prati, C.; Puyraveau, M.; Toussirot, E.; Letho-Gyselink, H.; Wendling, D. Evaluation of spondylarthritis activity by patients and physicians: ASDAS, BASDAI, PASS, and flares in 200 patients. Joint Bone Spine 2013, 80, 393–398. [Google Scholar] [CrossRef] [PubMed]
  14. Mi, H.; Thomas, P. Panther pathway: An ontology-based pathway database coupled with data analysis tools. Methods Mol. Biol. 2009, 563, 123–140. [Google Scholar] [PubMed]
  15. Franceschini, A.; Szklarczyk, D.; Frankild, S.; Kuhn, M.; Simonovic, M.; Roth, A.; Lin, J.; Minguez, P.; Bork, P.; von Mering, C.; et al. STRING v9.1: Protein-protein interaction networks, with increased coverage and integration. Nucleic Acids Res. 2013, 41, D808–D815. [Google Scholar] [CrossRef] [PubMed]
  16. Jensen, L.J.; Kuhn, M.; Stark, M.; Chaffron, S.; Creevey, C.; Muller, J.; Doerks, T.; Julien, P.; Roth, A.; Simonovic, M.; et al. STRING 8—A global view on proteins and their functional interactions in 630 organisms. Nucleic Acids Res. 2009, 37, D412–D416. [Google Scholar] [CrossRef] [PubMed]
  17. Bader, G.D.; Hogue, C.W. An automated method for finding molecular complexes in large protein interaction networks. BMC Bioinform. 2003, 4, 2. [Google Scholar] [CrossRef]
  18. Cline, M.S.; Smoot, M.; Cerami, E.; Kuchinsky, A.; Landys, N.; Workman, C.; Christmas, R.; Avila-Campilo, I.; Creech, M.; Gross, B.; et al. Integration of biological networks and gene expression data using Cytoscape. Nat. Protoc. 2007, 2, 2366–2382. [Google Scholar] [CrossRef] [PubMed]
  19. Dolcino, M.; Cozzani, E.; Riva, S.; Parodi, A.; Tinazzi, E.; Lunardi, C.; Puccetti, A. Gene expression profiling in dermatitis herpetiformis skin lesions. Clin. Dev. Immunol. 2012, 2012, 198956. [Google Scholar] [CrossRef] [PubMed]
  20. Tinazzi, E.; Dolcino, M.; Puccetti, A.; Rigo, A.; Beri, R.; Valenti, M.T.; Corrocher, R.; Lunardi, C. Gene expression profiling in circulating endothelial cells from systemic sclerosis patients shows an altered control of apoptosis and angiogenesis that is modified by Iloprost infusion. Arthritis Res. Ther. 2010, 12, R131. [Google Scholar] [CrossRef] [PubMed]
  21. Dolcino, M.; Patuzzo, G.; Barbieri, A.; Tinazzi, E.; Rizzi, M.; Beri, R.; Argentino, G.; Ottria, A.; Lunardi, C.; Puccetti, A. Gene expression profiling in peripheral blood mononuclear cells of patients with common variable immunodeficiency: Modulation of adaptive immune response following intravenous immunoglobulin therapy. PLoS ONE 2014, 9, e97571. [Google Scholar] [CrossRef] [PubMed]
  22. Heid, C.A.; Stevens, J.; Livak, K.J.; Williams, P.M. Real time quantitative PCR. Genome Res. 1996, 6, 986–994. [Google Scholar] [CrossRef] [PubMed]
  23. Livak, K.J.; Schmittgen, T.D. Analysis of relative gene expression data using real-time quantitative PCR and the 2−ΔΔCT method. Methods 2001, 25, 402–408. [Google Scholar] [CrossRef] [PubMed]
  24. Mahmoudi, M.; Aslani, S.; Nicknam, M.H.; Karami, J.; Jamshidi, A.R. New insights toward the pathogenesis of ankylosing spondylitis; genetic variations and epigenetic modifications. Mod. Rheumatol. 2016, 27, 198–209. [Google Scholar] [CrossRef] [PubMed]
  25. Gao, R.; Sun, W.; Chen, Y.; Su, Y.; Wang, C.; Dong, L. Elevated serum levels of soluble CD30 in ankylosing spondylitis patients and its association with disease severity-related parameters. BioMed Res. Int. 2015, 2015, 617282. [Google Scholar] [CrossRef] [PubMed]
  26. Barbieri, A.; Dolcino, M.; Tinazzi, E.; Rigo, A.; Argentino, G.; Patuzzo, G.; Ottria, A.; Beri, R.; Puccetti, A.; Lunardi, C. Characterization of CD30/CD30L(+) cells in peripheral blood and synovial fluid of patients with rheumatoid arthritis. J. Immunol. Res. 2015, 2015, 729654. [Google Scholar] [CrossRef] [PubMed]
  27. Lee, E.J.; Lee, E.J.; Chung, Y.H.; Song, D.H.; Hong, S.; Lee, C.K.; Yoo, B.; Kim, T.H.; Park, Y.S.; Kim, S.H.; et al. High level of interleukin-32 gamma in the joint of ankylosing spondylitis is associated with osteoblast differentiation. Arthritis Res. Ther. 2015, 17, 350. [Google Scholar] [CrossRef] [PubMed]
  28. Rother, N.; van der Vlag, J. Disturbed T-cell signaling and altered Th17 and regulatory T-cell subsets in the pathogenesis of systemic lupus erythematosus. Front. Immunol. 2015, 6, 610. [Google Scholar] [CrossRef] [PubMed]
  29. Lubberts, E. The IL-23-IL-17 axis in inflammatory arthritis. Nat. Rev. Rheumatol. 2015, 11, 415–429. [Google Scholar] [CrossRef] [PubMed]
  30. Diani, M.; Altomare, G.; Reali, E. T helper cell subsets in clinical manifestations of psoriasis. J. Immunol. Res. 2016, 2016, 7692024. [Google Scholar] [CrossRef] [PubMed]
  31. Gracey, E.; Qaiyum, Z.; Almaghlouth, I.; Lawson, D.; Karki, S.; Avvaru, N.; Zhang, Z.; Yao, Y.; Ranganathan, V.; Baglaenko, Y.; et al. IL-7 primes IL-17 in mucosal-associated invariant T (mait) cells, which contribute to the Th17-axis in ankylosing spondylitis. Ann. Rheum. Dis. 2016, 75, 2124–2432. [Google Scholar] [CrossRef] [PubMed]
  32. Xie, W.; Zhou, L.; Li, S.; Hui, T.; Chen, D. Wnt/beta-catenin signaling plays a key role in the development of spondyloarthritis. Ann. N. Y. Acad. Sci. 2016, 1364, 25–31. [Google Scholar] [CrossRef] [PubMed]
  33. Smith, J.A. Update on ankylosing spondylitis: Current concepts in pathogenesis. Curr. Allergy Asthma Rep. 2015, 15, 489. [Google Scholar] [CrossRef] [PubMed]
  34. Meylan, F.; Davidson, T.S.; Kahle, E.; Kinder, M.; Acharya, K.; Jankovic, D.; Bundoc, V.; Hodges, M.; Shevach, E.M.; Keane-Myers, A.; et al. The TNF-family receptor DR3 is essential for diverse T-cell-mediated inflammatory diseases. Immunity 2008, 29, 79–89. [Google Scholar] [CrossRef] [PubMed]
  35. Bull, M.J.; Williams, A.S.; Mecklenburgh, Z.; Calder, C.J.; Twohig, J.P.; Elford, C.; Evans, B.A.; Rowley, T.F.; Slebioda, T.J.; Taraban, V.Y.; et al. The death receptor 3-TNF-like protein 1a pathway drives adverse bone pathology in inflammatory arthritis. J. Exp. Med. 2008, 205, 2457–2464. [Google Scholar] [CrossRef] [PubMed]
  36. Liu, W.; Wu, Y.H.; Zhang, L.; Liu, X.Y.; Xue, B.; Wang, Y.; Liu, B.; Jiang, Q.; Kwang, H.W.; Wu, D.J. Elevated serum levels of IL-6 and IL-17 may associate with the development of ankylosing spondylitis. Int. J. Clin. Exp. Med. 2015, 8, 17362–17376. [Google Scholar] [PubMed]
  37. Braem, K.; Luyten, F.P.; Lories, R.J. Blocking p38 signaling inhibits chondrogenesis in vitro but not ankylosis in a model of ankylosing spondylitis in vivo. Ann. Rheum. Dis. 2012, 71, 722–728. [Google Scholar] [CrossRef] [PubMed]
  38. Studer, R.K.; Bergman, R.; Stubbs, T.; Decker, K. Chondrocyte response to growth factors is modulated by p38 mitogen-activated protein kinase inhibition. Arthritis Res. Ther. 2004, 6, R56–R64. [Google Scholar] [CrossRef] [PubMed]
  39. Assassi, S.; Reveille, J.D.; Arnett, F.C.; Weisman, M.H.; Ward, M.M.; Agarwal, S.K.; Gourh, P.; Bhula, J.; Sharif, R.; Sampat, K.; et al. Whole-blood gene expression profiling in ankylosing spondylitis shows upregulation of Toll-like receptor 4 and 5. J. Rheumatol. 2011, 38, 87–98. [Google Scholar] [CrossRef] [PubMed]
  40. Tan, F.K.; Farheen, K. The potential importance of Toll-like receptors in ankylosing spondylitis. Int. J. Clin. Rheumtol. 2011, 6, 649–654. [Google Scholar] [CrossRef] [PubMed]
  41. Krug, H.E. Fibroblasts from mice with progessive ankylosis proliferate excessively in response to transforming growth factor-beta 1. J. Investig. Med. 1998, 46, 134–139. [Google Scholar] [PubMed]
  42. Travis, M.A.; Sheppard, D. Tgf-beta activation and function in immunity. Annu. Rev. Immunol. 2014, 32, 51–82. [Google Scholar] [CrossRef] [PubMed]
  43. Chen, K.; Wei, X.Z.; Zhu, X.D.; Bai, Y.S.; Chen, Y.; Wang, C.F.; Chen, Z.Q.; Li, M. Whole-blood gene expression profiling in ankylosing spondylitis identifies novel candidate genes that may contribute to the inflammatory and tissue-destructive disease aspects. Cell. Immunol. 2013, 286, 59–64. [Google Scholar] [CrossRef] [PubMed]
  44. Gordon, R.A.; Grigoriev, G.; Lee, A.; Kalliolias, G.D.; Ivashkiv, L.B. The interferon signature and stat1 expression in rheumatoid arthritis synovial fluid macrophages are induced by tumor necrosis factor alpha and counter-regulated by the synovial fluid microenvironment. Arthritis Rheum. 2012, 64, 3119–3128. [Google Scholar] [CrossRef] [PubMed]
  45. Nzeusseu Toukap, A.; Galant, C.; Theate, I.; Maudoux, A.L.; Lories, R.J.; Houssiau, F.A.; Lauwerys, B.R. Identification of distinct gene expression profiles in the synovium of patients with systemic lupus erythematosus. Arthritis Rheum. 2007, 56, 1579–1588. [Google Scholar] [CrossRef] [PubMed]
  46. Thurlings, R.M.; Boumans, M.; Tekstra, J.; van Roon, J.A.; Vos, K.; van Westing, D.M.; van Baarsen, L.G.; Bos, C.; Kirou, K.A.; Gerlag, D.M.; et al. Relationship between the type I Interferon signature and the response to rituximab in rheumatoid arthritis patients. Arthritis Rheum. 2010, 62, 3607–3614. [Google Scholar] [CrossRef] [PubMed]
  47. Raterman, H.G.; Vosslamber, S.; de Ridder, S.; Nurmohamed, M.T.; Lems, W.F.; Boers, M.; van de Wiel, M.; Dijkmans, B.A.; Verweij, C.L.; Voskuyl, A.E. The Interferon type I signature towards prediction of non-response to rituximab in rheumatoid arthritis patients. Arthritis Res. Ther. 2012, 14, R95. [Google Scholar] [CrossRef] [PubMed]
  48. Moschella, F.; Torelli, G.F.; Valentini, M.; Urbani, F.; Buccione, C.; Petrucci, M.T.; Natalino, F.; Belardelli, F.; Foa, R.; Proietti, E. Cyclophosphamide induces a type I Interferon-associated sterile inflammatory response signature in cancer patients’ blood cells: Implications for cancer chemoimmunotherapy. Clin. Cancer Res. 2013, 19, 4249–4261. [Google Scholar] [CrossRef] [PubMed]
  49. Maria, N.I.; Brkic, Z.; Waris, M.; van Helden-Meeuwsen, C.G.; Heezen, K.; van de Merwe, J.P.; van Daele, P.L.; Dalm, V.A.; Drexhage, H.A.; Versnel, M.A. Mxa as a clinically applicable biomarker for identifying systemic Interferon type I in primary sjogren’s syndrome. Ann. Rheum. Dis. 2014, 73, 1052–1059. [Google Scholar] [CrossRef] [PubMed]
  50. Caignard, G.; Lucas-Hourani, M.; Dhondt, K.P.; Labernardiere, J.L.; Petit, T.; Jacob, Y.; Horvat, B.; Tangy, F.; Vidalain, P.O. The v protein of tioman virus is incapable of blocking type I Interferon signaling in human cells. PLoS ONE 2013, 8, e53881. [Google Scholar] [CrossRef] [PubMed]
  51. Ambrosi, A.; Espinosa, A.; Wahren-Herlenius, M. Il-17: A new actor in IFN-driven systemic autoimmune diseases. Eur. J. Immunol. 2012, 42, 2274–2284. [Google Scholar] [CrossRef] [PubMed]
  52. Axtell, R.C.; de Jong, B.A.; Boniface, K.; van der Voort, L.F.; Bhat, R.; De Sarno, P.; Naves, R.; Han, M.; Zhong, F.; Castellanos, J.G.; et al. T helper type 1 and 17 cells determine efficacy of Interferon-beta in multiple sclerosis and experimental encephalomyelitis. Nat. Med. 2010, 16, 406–412. [Google Scholar] [CrossRef] [PubMed]
  53. Brkic, Z.; Corneth, O.B.; van Helden-Meeuwsen, C.G.; Dolhain, R.J.; Maria, N.I.; Paulissen, S.M.; Davelaar, N.; van Hamburg, J.P.; van Daele, P.L.; Dalm, V.A.; et al. T-helper 17 cell cytokines and Interferon type I: Partners in crime in systemic lupus erythematosus? Arthritis Res. Ther. 2014, 16, R62. [Google Scholar] [CrossRef] [PubMed]
  54. O’Shea, J.J.; Plenge, R. Jak and STAT signaling molecules in immunoregulation and immune-mediated disease. Immunity 2012, 36, 542–550. [Google Scholar] [CrossRef] [PubMed]
  55. Zhu, Z.Q.; Tang, J.S.; Cao, X.J. Transcriptome network analysis reveals potential candidate genes for ankylosing spondylitis. Eur. Rev. Med. Pharmacol. Sci. 2013, 17, 3178–3185. [Google Scholar] [PubMed]
  56. Beyer, C.; Schett, G. Pharmacotherapy: Concepts of pathogenesis and emerging treatments. Novel targets in bone and cartilage. Best Pract. Res. Clin. Rheumatol. 2010, 24, 489–496. [Google Scholar] [CrossRef] [PubMed]
  57. Nakayamada, S.; Kurose, H.; Saito, K.; Mogami, A.; Tanaka, Y. Small GTP-binding protein Rho-mediated signaling promotes proliferation of rheumatoid synovial fibroblasts. Arthritis Res. Ther. 2005, 7, R476–R484. [Google Scholar] [CrossRef] [PubMed]
  58. Xu, W.; Liang, C.G.; Li, Y.F.; Ji, Y.H.; Qiu, W.J.; Tang, X.Z. Involvement of Notch1/Hes signaling pathway in ankylosing spondylitis. Int. J. Clin. Exp. Pathol. 2015, 8, 2737–2745. [Google Scholar] [PubMed]
Figure 1. Real time (RT)-PCR of some modulated genes in AS patients. Genes selected for validation were IL6ST, TNFRSF25, TNFSF8 and STAT1. The transcripts of the selected genes were increased in AS samples when compared to healthy donors. Relative expression levels were calculated for each sample after normalization against the housekeeping gene GAPDH. Experiments have been conducted in triplicates. Similar results were obtained using the housekeeping genes18s rRNA and beta-actin.
Genes 08 00127 g001
Figure 2. Network analysis of differentially expressed genes (DEGs) in AS patients. (A) Protein-protein interaction (PPI) network of DEGs; (B) Degree Sorted Circle Layout of the PPI network. Nodes are ordered around a circle based on their degree of connectivity (number of edges). Nodes belonging to modules are highlighted in red; (C) Modules originated from the interaction network.
Genes 08 00127 g002
Figure 3. Protein-protein interaction (PPI) network of DEGs in AS patients after treatment.
Genes 08 00127 g003
Table 1. Genes modulated in Ankylosing spondylitis (AS) patients before treatment versus healthy controls.
Probe Set IDp ValueFold ChangeGene SymbolGene TitleRepresentative Public ID
Cell proliferation
201367_s_at0.00113.9ZFP36L2ZFP36 ring finger protein-like 2NM_006887
203055_s_at0.0062.1ARHGEF1Rho guanine nucleotide exchange factor (GEF) 1NM_004706
210541_s_at0.0141.7TRIM27tripartite motif containing 27AF230394
217202_s_at0.0112.4GLULglutamate-ammonia ligaseNM_002065
201234_at0.0012.0ILKintegrin-linked kinaseNM_004517
210440_s_at0.0131.6CDC14Acell division cycle 14AAF064102
Extracellular matrix organization
202524_s_at0.0131.6SPOCK2sparc/osteonectin, cwcv and kazal-like domains proteoglycan (testican) 2NM_001134434
205179_s_at0.0022.3ADAM8ADAM metallopeptidase domain 8NM_001109
216971_s_at0.0012.5PLECplectinZ54367
216627_s_at0.0042.6B4GALT1UDP-Gal:betaGlcNAc beta 1,4-galactosyltransferase, polypeptide 1U10473
200001_at0.0131.9CAPNS1calpain, small subunit 1NM_001749
Angiogenesis
202509_s_at<0.0011.6TNFAIP2tumor necrosis factor, alpha-induced protein 2XM_006720243
201559_s_at0.0131.8CLIC4chloride intracellular channel 4CR533501
214931_s_at0.0021.6SRPK2SRSF protein kinase 2NM_001278273
202434_s_at0.0031.8CYP1B1cytochrome P450, family 1, subfamily B, polypeptide 1NM_000104
205179_s_at0.0022.3ADAM8ADAM metallopeptidase domain 8NM_001109
Immune response
207216_at0.0031.7TNFSF8tumor necrosis factor (ligand) superfamily, member 8NM_001244
214971_s_at0.0004.3ST6GAL1ST6 beta-galactosamide alpha-2,6-sialyltranferase 1NM_173216
216901_s_at0.00013.6IKZF1IKAROS family zinc finger 1 (Ikaros)NM_006060
211861_x_at0.0023.5CD28CD28 moleculeAF222343
205456_at0.0113.0CD3ECD3e molecule, epsilon (CD3-TCR complex)NM_000733
214551_s_at0.0093.5CD7CD7 moleculeNM_006137
205831_at0.0121.9CD2CD2 moleculeNM_001767
207872_s_at0.0022.0LILRA1leukocyte immunoglobulin-like receptor, subfamily A, member 1NM_006863
208594_x_at0.0151.8LILRA6leukocyte immunoglobulin-like receptor, subfamily A, member 6NM_024318
205819_at0.003−1.8MARCOmacrophage receptor with collagenous structureNM_006770
215339_at0.0071.9NKTRnatural killer-tumor recognition sequenceNM_005385
208829_at0.0081.5TAPBPTAP binding protein (tapasin)AF029750
209754_s_at<0.0013.4TMPOthymopoietinNM_003276
206804_at0.0051.8CD3GCD3g molecule, gamma (CD3-TCR complex)NM_000073
203547_at0.0082.4CD4CD4 moleculeNM_000616
205468_s_at0.0022.4IRF5interferon regulatory factor 5NM_001098627
203227_s_at0.011−1.5TSPAN31tetraspanin 31NM_005981
202621_at0.0022.2IRF3interferon regulatory factor 3NM_001571
210370_s_at0.0051.7LY9lymphocyte antigen 9AF244129
214931_s_at0.0021.6SRPK2SRSF protein kinase 2NM_001278273
216208_s_at0.0041.8ATF6Bactivating transcription factor 6 betaNM_004381
211574_s_at<0.0012.5CD46CD46 molecule, complement regulatory proteinD84105
211192_s_at0.0012.8CD84CD84 moleculeAF054818
210850_s_at0.0061.6ELK1ELK1, member of ETS oncogene familyAF000672
210313_at0.012−1.7LILRA4leukocyte immunoglobulin-like receptor, subfamily A, member 4NM_012276
200887_s_at<0.0014.6STAT1signal transducer and activator of transcription 1GU211347
204770_at0.0091.8TAP2transporter 2, ATP-binding cassetteNM_000544
206409_at0.0071.8TIAM1T-cell lymphoma invasion and metastasis 1NM_003253
208602_x_at<0.0013.8CD6CD6 moleculeNM_006725
220132_s_at0.0042.8CLEC2DC-type lectin domain family 2, member DNM_013269
201835_s_at<0.0011.8PRKAB1protein kinase, AMP-activated, beta 1NM_006253
204312_x_at0.0091.6CREB1cAMP responsive element binding protein 1NM_004379
221602_s_at0.0062.8FAIMFas apoptotic inhibitory moleculeNM_001033030
201234_at0.0012.0ILKintegrin-linked kinaseNM_004517
210796_x_at0.0101.6SIGLEC6sialic acid binding Ig-like lectin 6D86359
205026_at0.0011.8STAT5Bsignal transducer and activator of transcription 5BNM_012448
210298_x_at0.0101.8FHL1four and a half LIM domains 1AF098518
204864_s_at0.0033.2IL6STinterleukin 6 signal transducerNM_002184
201246_s_at0.0041.8OTUB1OTU domain, ubiquitin aldehyde binding 1NM_017670
203828_s_at0.0013.2IL32interleukin 32NM_004221
Inflammatory response
208540_x_at0.0112.0S100A11P1S100 calcium binding protein A11 pseudogene 1NG_008400
211968_s_at0.0041.6HSP90AA1heat shock protein 90kDa alpha (cytosolic), class A member 1NM_001017963
211016_x_at0.0002.8HSPA4heat shock 70kDa protein 4BC002526
200806_s_at0.0012.2HSPD1heat shock 60kDa protein 1 (chaperonin)KU178141
202626_s_at0.004−1.9LYNv-yes-1 Yamaguchi sarcoma viral related oncogene homologNM_002350
203085_s_at0.0052.5TGFB1transforming growth factor, beta 1NM_000660
203899_s_at0.0011.6CRCPCGRP receptor componentNM_014478
205179_s_at0.0022.3ADAM8ADAM metallopeptidase domain 8NM_001109
207163_s_at0.0071.6AKT1v-akt murine thymoma viral oncogene homolog 1XM_017021075
210916_s_at0.0131.9CD44CD44 molecule (Indian blood group)AF098641
206341_at0.0121.6IL2RAinterleukin 2 receptor, alphaNM_000417
208376_at0.0041.6CCR4chemokine (C-C motif) receptor 4NM_005508
211027_s_at0.0013.4IKBKBinhibitor of kappa light polypeptide gene enhancer in B-cells, kinase betaNM_001190720
217489_s_at0.0022.6IL6Rinterleukin 6 receptorS72848
Interleukin-6 production
200806_s_at0.0012.2HSPD1heat shock 60kDa protein 1 (chaperonin)KU178141
203331_s_at0.0051.6INPP5Dinositol polyphosphate-5-phosphatase, 145kDaU53470
217489_s_at0.0022.6IL6Rinterleukin 6 receptorS72848
201461_s_at0.0022.4MAPKAPK2mitogen-activated protein kinase-activated protein kinase 2NM_004759
203388_at0.0112.3ARRB2arrestin, beta 2NM_004313
Bone remodeling
(a) bone growth
203085_s_at0.0052.52TGFB1transforming growth factor, beta 1BC000125
205485_at0.0131.53RYR1ryanodine receptor 1 (skeletal)NM_000540
206788_s_at0.0031.72CBFBcore-binding factor, beta subunitAF294326
207163_s_at0.0071.55AKT1v-akt murine thymoma viral oncogene homolog 1XM_017021075
210671_x_at0.0061.70MAPK8mitogen-activated protein kinase 8NM_001278548
214326_x_at0.0073.88JUNDjun D proto-oncogeneNM_005354
212105_s_at0.0004.8DHX9DEAH (Asp-Glu-Ala-His) box helicase 9NM_001357
207968_s_at0.0032.12MEF2Cmyocyte enhancer factor 2CNM_002397
206788_s_at0.0031.72CBFBcore-binding factor, beta subunitAF294326
216234_s_at0.0041.79PRKACAprotein kinase, cAMP-dependent, catalytic, alphaM80335
(b) bone erosion
214196_s_at<0.0012.41TPP1tripeptidyl peptidase INM_000391
203331_s_at0.0051.57INPP5Dinositol polyphosphate-5-phosphatase, 145 kDaU53470
205179_s_at0.0022.31ADAM8ADAM metallopeptidase domain 8NM_001109
203395_s_at0.002−1.97HES1hairy and enhancer of split 1NM_005524
Table 2. Genes modulated in AS patients before treatment versus healthy controls grouped in signaling pathways.
Probe Set IDp ValueFold ChangeGene SymbolGene TitleRepresentative Public ID
Jak-Stat signaling pathway
200887_s_at<0.0014.61STAT1signal transducer and activator of transcription 1, 91 kDaGU211347
205026_at0.0011.82STAT5Bsignal transducer and activator of transcription 5BNM_012448
Wnt signaling pathway
214279_s_at0.0111.89NDRG2NDRG family member 2NM_201535
217729_s_at0.0042.29AESamino-terminal enhancer of splitNM_001130
209456_s_at0.0032.03FBXW11F-box and WD repeat domain containing 11AB033281
209002_s_at0.0041.94CALCOCO1calcium binding and coiled-coil domain 1NM_020898
206562_s_at0.0031.53CSNK1A1casein kinase 1, alpha 1NM_001892
205254_x_at0.0072.57TCF7transcription factor 7 (T-cell specific, HMG-box)NM_003202
MAPK cascade
210671_x_at0.0061.70MAPK8mitogen-activated protein kinase 8NM_001278548
209952_s_at0.0011.70MAP2K7mitogen-activated protein kinase kinase 7AF006689
214786_at0.0011.96MAP3K1mitogen-activated protein kinase kinase kinase 1NM_005921
211081_s_at0.0042.44MAP4K5mitogen-activated protein kinase kinase kinase kinase 5Z25426
201461_s_at0.0022.38MAPKAPK2mitogen-activated protein kinase-activated protein kinase 2NM_004759
210449_x_at0.0051.79MAPK14mitogen-activated protein kinase 14NM_001315
201979_s_at0.0091.64PPP5Cprotein phosphatase 5, catalytic subunitNM_006247
213490_s_at0.0012.49MAP2K2mitogen-activated protein kinase kinase 2NM_030662
207968_s_at0.0032.12MEF2Cmyocyte enhancer factor 2CNM_002397
215220_s_at0.0035.73TPRtranslocated promoter region, nuclear basket proteinNM_003292
Tumor necrosis factor-mediated signaling
211282_x_at0.0142.20TNFRSF25tumor necrosis factor receptor superfamily, member 25AY254324
209852_x_at0.0031.69PSME3proteasome (prosome, macropain) activator subunit 3BC001423
200887_s_at0.0004.61STAT1signal transducer and activator of transcription 1, 91 kDaGU211347
211027_s_at0.0013.41IKBKBinhibitor of kappa light polypeptide gene enhancer in B-cellsNM_001190720
TLR signaling pathway
210449_x_at0.0051.79MAPK14mitogen-activated protein kinase 14NM_001315
211027_s_at0.0013.41IKBKBinhibitor of kappa light polypeptide gene enhancer in B-cellsNM_001190720
215499_at0.001−1.55MAP2K3mitogen-activated protein kinase kinase 3GQ225578
210671_x_at0.0061.70MAPK8mitogen-activated protein kinase 8NM_001278548
209878_s_at0.0021.56RELAv-rel reticuloendotheliosis viral oncogene homolog AM62399
Type I interferon signaling pathway
205468_s_at0.0022.41IRF5interferon regulatory factor 5NM_001098627
202621_at0.0022.15IRF3interferon regulatory factor 3NM_001571
200887_s_at<0.0014.61STAT1signal transducer and activator of transcription 1, 91 kDaGU211347
211209_x_at0.0041.60SH2D1ASH2 domain containing 1AAF100540
Fibroblast growth factor receptor signaling
213490_s_at0.0012.49MAP2K2mitogen-activated protein kinase kinase 2NM_030662
210655_s_at0.0011.78FOXO3forkhead box O3AF041336
216234_s_at0.0041.79PRKACAprotein kinase, cAMP-dependent, catalytic, alphaM80335
213472_at0.0005.14HNRNPH1heterogeneous nuclear ribonucleoprotein H1 (H)NM_001257293
T-cell receptor signaling
207485_x_at0.0041.65BTN3A1butyrophilin, subfamily 3, member A1NM_007048
205285_s_at0.0013.30FYBFYN binding proteinNM_001465
204890_s_at0.0101.69LCKlymphocyte-specific protein tyrosine kinaseU07236
206804_at0.0051.83CD3GCD3g molecule, gamma (CD3-TCR complex)NM_000073
209671_x_at0.0122.31TRACT-cell receptor alpha constantM12423
Small GTPase mediated signal transduction
201469_s_at0.0021.82SHC1Src homology 2 domain containing transforming protein 1X68148
213490_s_at0.0012.49MAP2K2mitogen-activated protein kinase kinase 2NM_030662
207419_s_at<0.0012.45RAC2ras-related C3 botulinum toxin substrate 2NM_002872
208876_s_at0.0011.81PAK2p21 protein (Cdc42/Rac)-activated kinase 2AF092132
206341_at0.0121.58IL2RAinterleukin 2 receptor, alphaNM_000417
204116_at0.0042.49IL2RGinterleukin 2 receptor, gammaNM_000206
210317_s_at0.0012.71YWHAEtyrosine 3-monooxygenaseU28936
X00351_5_at0.0032.65ACTBactin, betaNM_001101
211108_s_at0.0091.86JAK3Janus kinase 3U31601
200641_s_at<0.0011.83YWHAZtyrosine 3-monooxygenaseNM_003406
216033_s_at0.0011.87FYNFYN oncogene related to SRC, FGR, YESNM_002037
Transforming growth factor beta signaling
203085_s_at0.0052.52TGFB1transforming growth factor, beta 1NM_000660
207334_s_at0.0002.69TGFBR2transforming growth factor, beta receptor II (70/80 kDa)NM_003242
219543_at0.012−1.75PBLDphenazine biosynthesis-like protein domain containingNM_022129
211553_x_at0.0131.70APAF1apoptotic peptidase activating factor 1AF149794
200808_s_at0.0042.60ZYXzyxinNM_003461
204312_x_at0.0091.62CREB1cAMP responsive element binding protein 1NM_004379
Phosphatidylinositol-mediated signaling
217234_s_at0.0032.51EZRezrinNM_003379
211230_s_at0.0051.60PIK3CDphosphatidylinositol-4,5-bisphosphate 3-kinaseU57843
204890_s_at0.0101.69LCKlymphocyte-specific protein tyrosine kinaseU07236
Notch signaling
215270_at0.0071.85LFNGLFNG O-fucosylpeptide 3-beta-N-acetylglucosaminyltransferaseU94354
204152_s_at0.0051.94MFNGMFNG O-fucosylpeptide 3-beta-N-acetylglucosaminyltransferaseNM_002405.3
206341_at0.0121.58IL2RAinterleukin 2 receptor, alphaNM_000417
Table 3. Pathways and biological processes that were enriched only pre- or post treatment.
Enriched Pathways
Pre-Treatment vs. Healthy Controlsp ValuePost-Treatment vs. Healthy Controlsp Value
Insulin/IGF pathway-protein kinase B signaling cascade 0.005FAS signaling pathway 0.007
Oxidative stress response 0.001Histamine H2 receptor mediated signaling pathway 0.003
p38 MAPK pathway 0.007p53 pathway feedback loops 2 0.022
p53 pathway 0.008Transcription regulation by bZIP transcription factor 0.042
p53 pathway by glucose deprivation 0.014Heterotrimeric G-protein signaling pathway 0.005
P53 pathway feedback loops 1 0.005
PI3 kinase pathway 0.015
Wnt signaling pathway <0.001
Enriched Biological Processes
Pre-Treatment vs. Healthy Controlsp ValuePost-Treatment vs. Healthy Controlsp Value
ATP-dependent chromatin remodeling 0.025activation of protein kinase A activity <0.001
cytoskeleton organization 0.002cellular response to oxidative stress 0.010
fibroblast growth factor receptor signaling pathway <0.001extrinsic apoptotic signaling pathway in absence of ligand 0.007
immune effector process 0.007hematopoietic or lymphoid organ development 0.037
intrinsic apoptotic signaling pathway <0.001negative regulation of extrinsic apoptotic signaling pathway <0.001
leukocyte migration 0.032peptidyl-serine phosphorylation 0.001
negative regulation of protein phosphorylation 0.048peptidyl-tyrosine phosphorylation <0.001
phosphatidylinositol-mediated signaling 0.002protein autophosphorylation 0.010
positive regulation of cell differentiation 0.004Ras protein signal transduction 0.001
positive regulation of gene expression 0.019regulation of lymphocyte activation 0.026
positive regulation of interleukin-2 biosynthetic process 0.003regulation of mitochondrial membrane permeability 0.039
positive regulation of T-cell proliferation 0.035regulation of myeloid cell differentiation 0.004
regulation of execution phase of apoptosis 0.045
regulation of leukocyte mediated immunity 0.005
regulation of lymphocyte differentiation 0.017
response to interleukin-2 0.001
response to mechanical stimulus 0.004
small GTPase mediated signal transduction 0.040
T-cell costimulation <0.001
T-cell differentiation 0.015
T-cell homeostasis 0.004
T-cell receptor signaling pathway <0.001
Table 4. Molecular signalings in which are involved genes modulated only before treatment.
Patients Group 1Patients Group 2
Immune responseImmune response
AngiogenesisAngiogenesis
InflammationInflammation
G-protein coupled receptor signalingG-protein coupled receptor signaling
Jak-Stat signalingJak-Stat signaling
MAP kinase cascadeMAP kinase cascade
Notch signalingNotch signaling
PDGF receptor signalingPDGF receptor signaling
Small GTPase signalingSmall GTPase signaling
T-cell receptor signalingT-cell receptor signaling
TGF beta signalingTGF beta signaling
Intreleukin 6 productionEGF receptor signaling
Adenylate cyclase-modulating G-protein coupled receptor signalingEphrin receptor signaling
Chemokine mediated signalingFc-gamma receptor signaling
Cytokine mediated signalingIntegrin-mediated signaling pathway
Endothelin signalingInterleukin signaling
Heterotrimeric G-protein signalingPositive regulation of BMP signaling
Intrinsic apoptotic signaling in response to DNA damage signalingPositive regulation of VEGF signaling
NIK/NF-Kappa B signaling
Protein kinase B signaling
Stimulatory c-type lectin receptor signaling
Toll-like receptor signaling
Tumor necrosis factor signaling
Type 1 interferon signaling
Wnt signaling
Table 5. Genes modulated only before treatment in AS patients group 1. n.c.: not changed.
Probe Set IDp ValueFC PreFC PostGene SymbolGene TitleRepresentative Public ID
Immune response
207794_at0.0155.05n.c.CCR2chemokine (C-C motif) receptor 2NM_000648
216033_s_at0.0131.70n.c.FYNFYN proto-oncogene, Src family tyrosine kinaseS74774
208965_s_at0.0032.87n.c.IFI16interferon, gamma-inducible protein 16BG256677
200806_s_at0.0042.62n.c.HSPD1heat shock 60kDa protein 1 (chaperonin)BE256479
211210_x_at0.0151.53n.c.SH2D1ASH2 domain containing 1AAF100539
210541_s_at<0.0012.21n.c.TRIM27tripartite motif containing 27AF230394
221092_at0.0074.53n.c.IKZF3IKAROS family zinc finger 3 (Aiolos)NM_012481
202643_s_at0.003−4.55n.c.TNFAIP3tumor necrosis factor, alpha-induced protein 3AI738896
219994_at0.0091.72n.c.APBB1IPamyloid beta precursor protein-binding, B, 1 interacting proteinNM_019043
220363_s_at0.0121.79n.c.ELMO2engulfment and cell motility 2NM_022086
204506_at0.0091.50n.c.PPP3R1protein phosphatase 3, regulatory subunit B, alphaAL544951
Inflammatory response
201883_s_at0.001−2.05n.c.B4GALT1beta 1,4- galactosyltransferase, polypeptide 1D29805
207794_at0.0155.05n.c.CCR2chemokine (C-C motif) receptor 2NM_000648
214370_at0.0071.91n.c.S100A8S100 calcium binding protein A8AW238654
200808_s_at0.0022.02n.c.ZYXzyxinNM_003461
210218_s_at0.0022.50n.c.SP100SP100 nuclear antigenU36501
205760_s_at0.0111.62n.c.OGG18-oxoguanine DNA glycosylaseNM_016821
209545_s_at0.011−1.95n.c.RIPK2receptor-interacting serine-threonine kinase 2AF027706
202742_s_at0.0111.91n.c.PRKACBprotein kinase, cAMP-dependent, catalytic, betaNM_002731
204280_at0.0051.53n.c.RGS14regulator of G-protein signaling 14NM_006480
203927_at0.003−1.83n.c.NFKBIEnuclear factor of k light polypeptide gene enhancer in B-cells inhibitor, epsilonNM_004556
205727_at0.015−1.68n.c.TEP1telomerase-associated protein 1NM_007110
Angiogenesis
212723_at0.012−2.14n.c.JMJD6jumonji domain containing 6AK021780
213844_at0.014−2.13n.c.HOXA5homeobox A5NM_019102
211561_x_at0.0061.91n.c.MAPK14mitogen-activated protein kinase 14L35253
201883_s_at0.001−2.05n.c.B4GALT1beta 1,4- galactosyltransferase, polypeptide 1D29805
TNF signaling pathway
207794_at0.0155.05n.c.CCR2chemokine (C-C motif) receptor 2NM_000648
222142_at0.011−1.82n.c.CYLDcylindromatosis (turban tumor syndrome)AK024212
202643_s_at0.003−4.55n.c.TNFAIP3tumor necrosis factor, alpha-induced protein 3AI738896
Type 1 interferon signaling
210218_s_at0.0022.50n.c.SP100SP100 nuclear antigenU36501
208965_s_at0.0032.87n.c.IFI16interferon, gamma-inducible protein 16BG256677
200806_s_at0.0042.62n.c.HSPD1heat shock 60kDa protein 1 (chaperonin)BE256479
222142_at0.011−1.82n.c.CYLDcylindromatosis (turban tumor syndrome)AK024212
202643_s_at0.003−4.55n.c.TNFAIP3tumor necrosis factor, alpha-induced protein 3AI738896
221287_at0.0101.50 RNASELribonuclease L (2′,5′-oligoisoadenylate synthetase-dependent)NM_021133
IL6 production
207794_at0.0155.05n.c.CCR2chemokine (C-C motif) receptor 2NM_000648
200806_s_at0.0042.62n.c.HSPD1heat shock 60kDa protein 1 (chaperonin)BE256479
Toll like receptor signaling pathway
200598_s_at0.0111.54n.c.HSP90B1heat shock protein 90kDa beta (Grp94), member 1AI582238
200806_s_at0.0042.62n.c.HSPD1heat shock 60kDa protein 1 (chaperonin)BE256479
211561_x_at0.0061.91n.c.MAPK14mitogen-activated protein kinase 14L35253
Jak-Stat signaling pathway
205026_at0.0051.85n.c.STAT5Bsignal transducer and activator of transcription 5BNM_012448
211561_x_at0.0061.91n.c.MAPK14mitogen-activated protein kinase 14L35253
Wnt signaling pathway
208074_s_at0.0081.50n.c.AP2S1adaptor-related protein complex 2, sigma 1 subunitNM_021575
204506_at0.0091.50n.c.PPP3R1protein phosphatase 3, regulatory subunit B, alphaAL544951
201868_s_at0.0122.29n.c.TBL1Xtransducin (beta)-like 1X-linkedNM_005647
203506_s_at0.0141.80n.c.MED12mediator complex subunit 12NM_005120
209383_at0.006−2.32n.c.DDIT3DNA-damage-inducible transcript 3BC003637
213710_s_at0.0141.59n.c.CALM1calmodulin 1 (phosphorylase kinase, delta)AL523275
206409_at0.0091.99n.c.TIAM1T-cell lymphoma invasion and metastasis 1NM_003253
213579_s_at0.008−1.51n.c.EP300E1A binding protein p300AI459462
210649_s_at0.0042.81n.c.ARID1AAT rich interactive domain 1A (SWI-like)AF231056
211300_s_at0.0093.08n.c.TP53tumor protein p53K03199
MAPK cascade
210622_x_at0.0121.63n.c.CDK10cyclin-dependent kinase 10AF153430
213710_s_at0.0141.59n.c.CALM1calmodulin 1 (phosphorylase kinase, delta)AL523275
209457_at0.013−2.95n.c.DUSP5dual specificity phosphatase 5U16996
211561_x_at0.0061.91n.c.MAPK14mitogen-activated protein kinase 14L35253
216033_s_at0.0131.70n.c.FYNFYN proto-oncogene, Src family tyrosine kinaseS74774
Small Gtpase mediated signal transduction
205461_at<0.0012.98n.c.RAB35RAB35, member RAS oncogene familyNM_006861
219842_at0.0111.50n.c.ARL15ADP-ribosylation factor-like 15NM_019087
209051_s_at0.0011.58n.c.RALGDSral guanine nucleotide dissociation stimulatorAF295773
211622_s_at0.0011.80n.c.ARF3ADP-ribosylation factor 3M33384
Table 6. Genes modulated only before treatment in AS patients-group 2. n.c.: not changed.
Probe Set IDp ValueFC PreFC PostGene SymbolGene TitleRepresentative Public ID
Immune response
214450_at0.0112.52n.c.CTSWcathepsin WNM_001335
206082_at0.0071.60n.c.HCP5HLA complex P5 (non-protein coding)NR_040662
216542_x_at0.0071.50n.c.IGHA1immunoglobulin heavy constant alpha 1AJ275355
208071_s_at0.0111.50n.c.LAIR1leukocyte-associated immunoglobulin-like receptor 1NM_002287
217513_at0.005−1.65n.c.MILR1mast cell immunoglobulin-like receptor 1NM_001085423
208759_at0.0111.50n.c.NCSTNnicastrinAF240468
206804_at0.0111.91n.c.CD3GCD3g molecule, gamma (CD3-TCR complex)NM_000073
211373_s_at0.012−1.51n.c.PSEN2presenilin 2NM_000447
210479_s_at0.0081.79n.c.RORARAR-related orphan receptor ANM_134261
209151_x_at0.0051.54n.c.TCF3transcription factor 3NM_003200
Inflammatory response
217119_s_at0.0031.50n.c.CXCR3chemokine (C-X-C motif) receptor 3NM_001504
201348_at0.0051.63n.c.GPX3glutathione peroxidase 3 (plasma)NM_002084
207075_at0.012−1.80n.c.NLRP3NLR family, pyrin domain containing 3NM_004895
Angiogenesis
216689_x_at0.0051.60n.c.ARHGAP1Rho GTPase activating protein 1NM_004308
208937_s_at0.013−1.87n.c.ID1inhibitor of DNA binding 1D13889
204626_s_at0.0061.62n.c.ITGB3integrin, beta 3 (platelet glycoprotein IIIa, antigen CD61)NM_000212
MAPK cascade
210787_s_at0.0141.87n.c.CAMKK2calcium/calmodulin-dependent protein kinase kinase 2, betaAF140507
214786_at0.0031.77n.c.MAP3K1mitogen-activated protein kinase kinase kinase 1NM_005921
Jak-stat signaling pathway
217199_s_at0.0151.54n.c.STAT2signal transducer and activator of transcription 2, 113kDaS81491
210995_s_at0.0111.55n.c.TRIM23tripartite motif containing 23AF230399
Small GTPase signal transduction
216689_x_at0.0051.60n.c.ARHGAP1Rho GTPase activating protein 1NM_004308
218884_s_at0.0021.51n.c.GUF1GUF1 GTPase homolog (S. cerevisiae)NM_021927
209051_s_at0.0031.65n.c.RALGDSral guanine nucleotide dissociation stimulatorAF295773
TCR signaling pathway
206804_at0.0111.91n.c.CD3GCD3g molecule, gamma (CD3-TCR complex)NM_000073
211373_s_at0.012−1.51n.c.PSEN2presenilin 2NM_000447
219724_s_at0.0122.07n.c.TESPA1thymocyte expressed, positive selection associated 1NM_014796
211902_x_at0.0102.06n.c.YME1L1YME1-like 1 ATPaseNM_139312
TGFB signaling pathway
221235_s_at0.004−1.50n.c.TGFBRAP1transforming growth factor, beta receptor associated protein 1NM_004257
205187_at0.0061.60n.c.SMAD5SMAD family member 5AF010601
214786_at0.0031.77n.c.MAP3K1mitogen-activated protein kinase kinase kinase 1NM_005921
203988_s_at0.0081.64n.c.FUT8fucosyltransferase 8 (alpha (1,6) fucosyltransferase)NM_004480
Notch signaling pathway
203988_s_at0.0081.64n.c.FUT8fucosyltransferase 8 (alpha (1,6) fucosyltransferase)NM_004480
208759_at0.0111.50n.c.NCSTNnicastrinAF240468
Table 7. Biological processes that were significantly enriched in genes corrected by the treatment.
AS Patients-Group 1AS Patients-Group 2
Biological Processp ValueBiological Processp Value
activation of immune response 0.014leukocyte activation 0.034
positive regulation of immune system process 0.002lymphocyte activation 0.050
positive regulation of leukocyte activation 0.005T-cell activation 0.038
positive regulation of lymphocyte activation 0.002positive regulation of B-cell activation 0.015
positive regulation of lymphocyte proliferation 0.023NLRP3 inflammasome complex assembly 0.006
lymphocyte activation involved in immune response 0.046angiogenesis 0.002
T-cell activation0.005response to transforming growth factor beta 0.010
positive regulation of T-cell activation 0.005G-protein coupled receptor signaling pathway 0.031
cellular response to unfolded protein0.001
positive regulation of B-cell activation0.041
B-cell cytokine production 0.024
inflammatory response 0.026
response to oxidative stress 0.022
positive regulation of cytokine production 0.012
positive regulation of type I interferon production 0.017
toll-like receptor signaling pathway 0.039
positive regulation of interleukin-2 production 0.001
regulation of adaptive immune response based on somatic recombination of immune receptors 0.013

