Abstract
The etiology of Ankylosing spondylitis (AS) is still unknown and the identification of the involved molecular pathogenetic pathways is a current challenge in the study of the disease. Adalimumab (ADA), an anti-tumor necrosis factor (TNF)-alpha agent, is used in the treatment of AS. We aimed at identifying pathogenetic pathways modified by ADA in patients with a good response to the treatment. Gene expression analysis of Peripheral Blood Cells (PBC) from six responders and four not responder patients was performed before and after treatment. Differentially expressed genes (DEGs) were submitted to functional enrichment analysis and network analysis, followed by modules selection. Most of the DEGs were involved in signaling pathways and in immune response. We identified three modules that were mostly impacted by ADA therapy and included genes involved in mitogen activated protein (MAP) kinase, wingless related integration site (Wnt), fibroblast growth factor (FGF) receptor, and Toll-like receptor (TCR) signaling. A separate analysis showed that a higher percentage of DEGs was modified by ADA in responders (44%) compared to non-responders (12%). Moreover, only in the responder group, TNF, Wnt, TLRs and type I interferon signaling were corrected by the treatment. We hypothesize that these pathways are strongly associated to AS pathogenesis and that they might be considered as possible targets of new drugs in the treatment of AS.
1. Introduction
Ankylosing spondylitis (AS) is a progressive and debilitating seronegative spondiloarthritis, involving primarily the sacro-iliac joints and the spine and frequently the peripheral joints. Extra-articular tissues involvement, such as skin, tendons or eyes is often present [1]. AS has a strong genetic background being associated with the major histocompatibility complex (MHC) class I allele HLA-B27 in more than 90% of the patients [2].
The disease prevalence ranges the 0.02%–0.35% depending on the race, with a higher prevalence in males than in females [1].
According to the Assessment of SpondyloArthritis International Society/European League Against Rheumatism (ASAS/EULAR) and American College of Rheumatology/ Spondylitis Association of America/ Spondyloarthritis Research and Treatment Network (ACR/SAA/SPARTAN), there is a recommendation for patients with a predominantly active axial manifestation of AS that they should be treated for at least three months with nonsteroidal anti-inflammatory drugs (NSAIDs) followed by a tumor necrosis factor (TNF)-alpha blocker in case of non response or of NSAIDs-related side effects, while patients with both axial and peripheral involvement need treatment with TNF-blockers and eventually with disease-modifying antirheumatic drugs (DMARDS) in case of intolerance or controindication to anti-TNF-alpha treatment [3,4].
Treatment with the TNF blockers, infliximab, etanercept, adalimumab, golimumab and certolizumab, leads to a good improvement in clinical symptoms, in C-reactive protein (CRP) levels and in magnetic resonance imaging (MRI)-detectable inflammation of the sacroiliac joints [5].
In particular, Adalimumab (ADA) is a humanized monoclonal antibody against TNF-alpha, able to block both monomeric and trimeric soluble forms of TNF-alpha and cell-surface TNF-alpha, inducing cell apoptosis.
In this work, we have analyzed the transcriptome of Peripheral Blood Cells (PBCs) from patients with AS in order to identify possible mechanisms involved in the pathogenesis of the disease.
Previous studies on gene expression analyses in PBCs have identified gene signatures specifically associated to several diseases including Rheumatoid Arthritis (RA) and Systemic Lupus Erythematosus (SLE) [6,7]. Moreover, in a previous work on microarray analysis in Psoriatic Arthritis (PsA), we analyzed Differentially expressed genes (DEGs) in PBCs and in cells derived from synovial biopsies, and found that gene expression profiles of the cells obtained from the inflamed synovium are similar to those of PBCs, indicating that PBCs can be a good substitute of the target tissues to analyze disease-associated gene expression [8].
High-throughput methodologies, including microarray, have increased our understanding of many diseases. However, while several studies on gene array analyses revealed transcriptional profiles of many single genes differentially expressed in AS compared to healthy subjects, such studies have not analyzed gene product interactions and molecular pathways possibly related to the disease onset. A careful evaluation of such networks can provide a deeper insight in the understanding of disease pathogenesis. In this study, we implemented the gene-array study with networks and modules analyses to uncover possible molecular pathways associated to AS and to a good response to ADA therapy.
This is indeed a novel approach since other studies used a conventional gene expression analysis to study, at gene level, the response to TNF inhibitors in rheumatoid arthritis [9,10] and to our knowledge, there are no such studies of ankylosing spondylitis.
In AS we found deregulated genes that are involved in important pathways; moreover, such genes are differently modulated in patients that show a good response to treatment compared to non-responders. Interestingly, in patients with a good response to treatment, we also observed that ADA normalized the altered expression of genes involved in AS-associated pathways.
2. Materials and Methods
2.1. Patients
We studied a cohort of ten patients (seven males and three females, mean age: 51.8 years) affected by Ankylosing spondylitis (AS), attending the Unit of Autoimmune Diseases, at the University Hospital of Verona, Italy. A written informed consent was obtained from all the partecipants to the study. The study was approved by the local Ethical Committee and all clinical investigations have been conducted according to the principles expressed in the Helsinki declaration.
All patients fulfilled the modified New York criteria for the diagnosis of AS which included radiological and clinical criteria represented by (1) radiological evidence of sacroileitis; (2) low back pain and stiffness standing for at least three months, improved by exercise and not relieved by rest; (3) decrease of lumbar spine motility in both sagittal and frontal planes; and (4) limitation of chest expansion [11,12].
The patients underwent clinical examination and laboratory evaluation, which included inflammatory markers, such as erytrocyte sedimentation rate (ESR) and C-reactive protein (CRP), and genetic screening for the association with the allele HLA-B27. All patients underwent conventional radiography, magnetic resonance imaging (MRI) for the axial and peripheric involvement of the arthropathy. All patients were treated with the same anti-TNF agent Adalimumab, and samples for the gene array analysis were collected before and seven days after the anti-TNF injection. Adalimumab was administrated every two weeks without any side effects. The clinical features of the patients are reported in Supplementary Materials Table S1.
The evaluation of responder and non-responder patients to the treatment was carried out according to the Bath Ankylosing Spondylitis Disease Activity Index (BASDAI score), defining remission when the score is less than 3.8 [13].
Ten healthy age and sex matched healthy subjects were used as controls.
2.2. Gene Array
Blood samples were collected using PAXgene Blood RNA tubes (PreAnalytiX, Hombrechtikon, Switzerland) and total RNA was extracted following the manufacturer instructions. cRNA preparation, samples hybridization and scanning were performed following the Affymetrix (Affymetrix, Santa Clara, CA, USA) provided protocols, by Cogentech Affymetrix microarray unit (Campus IFOM IEO, Milan, Italy). Human Genome U133A 2.0 (HG-U133A 2.0) Gene Chip (Affymetrix) were used. The HG-U133A 2.0 Gene Chip covers more than 22,000 probe sets corresponding up to 14,500 well-characterized human genes. The microarray analysis was carried out using the Gene Spring software, version 12.5 (Agilent Technologies, SantaClara, CA, USA) selecting the Robust Multi-Array Average algorithm (RMA) to background-adjust, normalize, and log-transform signals intensity. As the log2 scale was used, a signal log2 ratio of 1.0 corresponds to a transcript level increase of two-fold change (2 FC) and −1.0 a lowering of two-fold change (−2 FC). A signal log2 ratio of zero indicates no change. Relative gene expression levels of each transcript were validated applying the unpaired t-test (p ≤ 0.01) and the Bonferroni multiple testing correction. Genes that displayed an expression level at least 1.5 fold different in the test sample versus control sample (p ≤ 0.01) were submitted both to functional classification, using the Gene Ontology (GO) annotations, and to Pathway analysis, employing the Panther expression analysis tools (http://pantherdb.org/) [14]. The enrichment of all pathways and functional classes associated to the differentially expressed genes compared to the distribution of genes included on the Affymetrix HG-U133A microarray was analyzed and p values ≤ 0.05, calculated by the binomial statistical test were considered as significant enrichment.
2.3. Protein-Protein Interaction (PPI) Network Construction and Network Clustering
The Search Tool for the Retrieval of Interacting Genes (STRING version 1.0; http://string-db.org/) is a web-based database which comprises experimental as well as predicted interaction informations and covers >1100 completely sequenced organisms [15]. DEGs were mapped to the STRING database to detect protein-protein interactions (PPI) pairs that were validated by experimental studies or retrieved by text mining and homology analysis [16]. A score of ≥0.7 for each PPI pair was selected to design the PPI network.
The graph-based Markov Clustering algorithm (MCL) allows to visualize high-flow areas (the clusters) [17]. In order to detect highly connected regions, the MCL algorithm was applied.
Cytoscape software [18] was used to define the topology of the builded networks.
2.4. Real Time RT-PCR
Total RNA was isolated from PBC using TRIzol reagent (Invitrogen, Carlsbad, CA, USA), following manufacturer’s instructions. First-strand cDNA was generated using the SuperScript III First-Strand Synthesis System for RT-PCR Kit (Invitrogen), with random hexamers, according to the manufacturer’s protocol. PCR was performed in a total volume of 25 μL containing 1× Taqman Universal PCR Master mix, no AmpErase UNG and 2.5 μL of cDNA; pre-designed, Gene-specific primers and probe sets for each gene (IL6ST, TNFRSF25, TNFSF8, and STAT1) were obtained from Assay-on-Demand Gene Expression Products (Applied Biosystems, Foster, CA, USA). As described in detail previously [19,20,21], Real Time PCR reactions were carried out in a two-tube system and in singleplex. The Real Time amplifications included 10 min at 95 °C (AmpliTaq Gold activation, Thermo Fisher Scientific, Waltham, MA, USA), followed by 40 cycles at 95 °C for 15 s and at 60 °C for one minute. Thermocycling and signal detection were performed with 7500 Sequence Detector (Applied Biosystems). Signals were detected according to the manufacturer’s instructions. This technique allows the identification of the cycling point where PCR product is detectable by means of fluorescence emission (Threshold cycle or Ct value). As previously reported, the Ct value correlates to the quantity of target mRNA [22]. Relative expression levels were calculated for each sample after normalization against the housekeeping genes GAPDH, beta-actin and 18 s ribosomal RNA (rRNA), using the ΔΔCt method for comparing relative fold expression differences [19,23]. The data are expressed as fold change. Ct values for each reaction were determined using TaqMan SDS analysis software. For each amount of RNA tested triplicate Ct values were averaged. Because Ct values vary linearly with the logarithm of the amount of RNA, this average represents a geometric mean.
3. Results
In order to identify gene expression profiles associated with AS, we compared the gene expression profiles of PBC samples obtained from 10 AS patients before treatment with ADA with 10 PBC samples obtained from healthy age and sex matched donors.
We found that 740 modulated transcripts satisfied the Bonferroni–corrected p value criterion (p ≤ 0.01) and the fold change criterion (FC ≥ |1.5|), showing robust and statistically significant variation between AS and healthy controls samples. In particular, 615 and 125 transcripts resulted to be over- and underexpressed respectively. The complete list of modulated genes can be found in Supplementary Materials Table S2.
The Gene Ontology analysis showed that a large number of the modulated transcripts can be ascribed to biological processes that may play a role in AS, including: cell proliferation, extracellular matrix organization, angiogenesis, immune response, inflammatory response, interleukin-6 production, ossification, bone remodeling and signal transduction. Among these processes we noticed that signal transduction and immune response were the most represented biological processes. We also observed that immune response encompassed several Th-17-related genes including CD28 molecule, CD3 molecule epsilon (CD3E) and gamma (CD3G) subunits, CD4 molecule, transforming growth factor beta 1 (TGFB1), interleukin 6 receptor (IL6R), interleukin 6 signal transducer (IL6ST).
The signal transduction functional class included genes that may be ascribed to different subcategories including: inflammation mediated by chemokine and cytokine signaling pathway, Jak-Stat signaling pathway, Wnt signaling pathway, mirogen-activated protein kinase (MAPK) cascade, tumor necrosis factor-mediated signaling pathway, TLR signaling pathway, cytokine-mediated signaling pathway, Type I interferon signaling pathway, fibroblast growth factor receptor signaling pathway, T-cell receptor signaling pathway, small GTPase mediated signal transduction, transforming growth factor (TGFB) signaling, Notch signaling and phosphatidylinositol-mediated signaling.
Table 1 and Table 2 show a detailed selection of DEGs within the above-mentioned processes. The tables also include GeneBank accession numbers and fold changes.

Table 1.
Genes modulated in Ankylosing spondylitis (AS) patients before treatment versus healthy controls.
Table 2.
Genes modulated in AS patients before treatment versus healthy controls grouped in signaling pathways.
The modulation of some genes observed by gene array analysis was validated by Q-PCR (Figure 1).
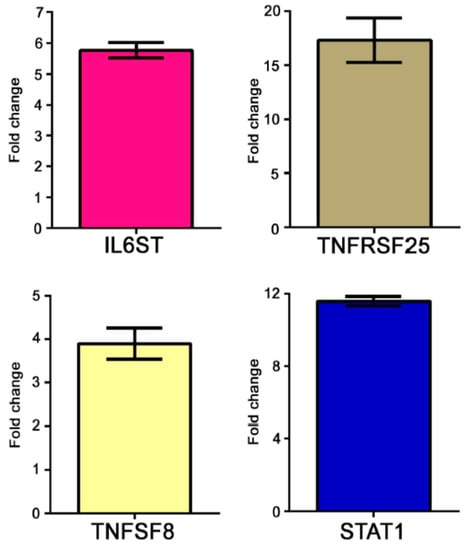
Figure 1.
Real time (RT)-PCR of some modulated genes in AS patients. Genes selected for validation were IL6ST, TNFRSF25, TNFSF8 and STAT1. The transcripts of the selected genes were increased in AS samples when compared to healthy donors. Relative expression levels were calculated for each sample after normalization against the housekeeping gene GAPDH. Experiments have been conducted in triplicates. Similar results were obtained using the housekeeping genes18s rRNA and beta-actin.
Given the high number of DEGs and the corresponding functional classes, to make our study more informative, we decided to complement the gene expression profiling of AS PBC with the study of functional interactions between the protein products of modulated genes. To this aim, a protein-protein interaction (PPI) network comprising 401 genes (nodes) and 1345 pairs of interactions (edges) was obtained (Figure 2A). In Figure 2B the interconnected genes are represented in a circular graph and are ordered based on their degree of connectivity, so genes with a similar degree of connectivity are placed close to each other. We then submitted the PPI network to a modular analysis to find set of densely interconnected nodes (modules) that are expected to participate in multiple biological activities in a coordinated manner. We identified eight modules (k = 5) that are graphically represented in Figure 2C. Figure 2B shows that the genes belonging to the eight modules (highlighted in red) are distributed (concentrated) over an area in which the highest degrees of connectivity are present, thus confirming that they are highly connected genes.
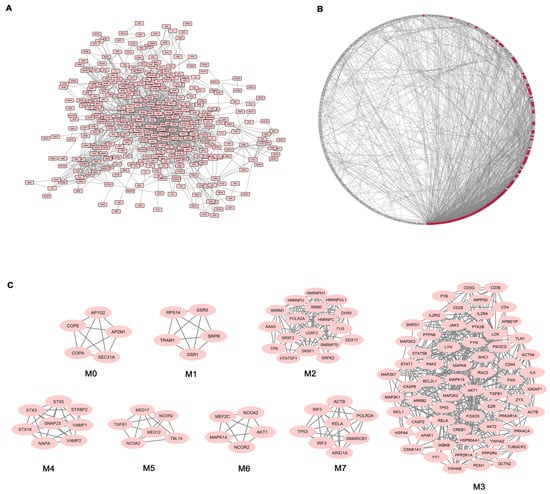
Figure 2.
Network analysis of differentially expressed genes (DEGs) in AS patients. (A) Protein-protein interaction (PPI) network of DEGs; (B) Degree Sorted Circle Layout of the PPI network. Nodes are ordered around a circle based on their degree of connectivity (number of edges). Nodes belonging to modules are highlighted in red; (C) Modules originated from the interaction network.
We next performed functional enrichment analysis to identify association of genes, in each module, with different “GO terms” and pathways. All the significantly enriched categories for each module are shown in Supplementary Materials Table S3 and included pathogenetically relevant processes such as: T-cell receptor signaling (module M3), TLRs signaling (modules M3 and M7), small GTPase signaling (module M3) Wnt signaling (module M7), p38 MAP kinase cascade (modules M3 and M6) Jak-stat signaling (module M3) fibroblast growth factor receptor signaling (module M3) inflammation mediated by chemokine and cytokine signaling pathway (modules M3 and M7) VEGF signaling (modules M3 and M6) angiogenesis (module M3).
In order to evaluate the effect of treatment on gene expression in AS patients, we analysed the transcriptional profiles obtained from the same AS patients seven days after ADA administration.
When the same Bonferroni-corrected p value and fold change criteria were applied, 571 genes were differentially expressed in AS patients after treatment compared to healthy controls, in particular 492 and 79 transcripts resulted to be up- and down-regulated respectively (Supplementary Materials Table S4). The protein products of 297 DEGs, among the above mentioned genes, were connected in a PPI network involving 819 pairs of interactions (Figure 3), from which 7 modules can be extracted.
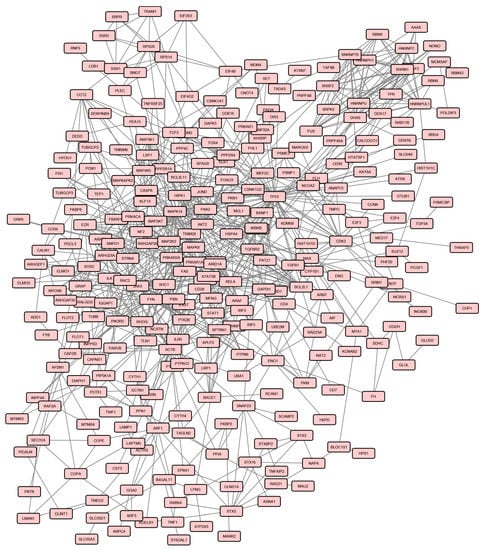
Figure 3.
Protein-protein interaction (PPI) network of DEGs in AS patients after treatment.
We next performed GO biological process and pathways enrichment analysis of genes included in the seven modules. Modules and the resulting enriched functional categories are listed in Supplementary Materials Table S5.
Afterwards, we compared the lists of processes enriched in modules from the two analysis (samples before treatment versus healthy controls and samples after treatment versus healthy controls) and we found that several pathways and biological processes were enriched only in the pre-treatment associated modules (Table 3).
Table 3.
Pathways and biological processes that were enriched only pre- or post treatment.
In particular, we found that after treatment the enrichment in p38 MAPK (p value = 0.007), P53 pathway feedback loops 1 (p value = 0.005), PI3 kinase pathway (p value = 0.015) and Wnt signaling pathways (p value < 0.001) disappeared. In addition, we observed that all pathways that showed an enrichment only in the pre-treatment condition were associated to the pre-treatment associated modules M3, M6 and M7.
Many biological processes were also influenced by the therapy, since they were no longer enriched after treatment. These processes were associated to the pre-treatment module M3 and included: fibroblast growth factor receptor signaling (p value < 0.001), small GTPase mediated signal transduction (p value = 0.040), immune effector process (p value = 0.007), leukocyte migration (p value = 0.032), positive regulation of T-cell proliferation (p value = 0.035), response to interleukin-2 (p value = 0.001), T-cell costimulation (p value < 0.001), T-cell differentiation (p value = 0.015), T-cell receptor signaling (p value < 0.001), and phosphatidylinositol-mediated signaling pathway (p value = 0.002).
Although the patients enrolled in the study were homogeneous as far as clinical features and stage of the disease concern, we could identify two groups who showed a different response to treatment.
The first group (group 1) consisted of 6 patients who had a very good response to the treatment with disease remission and the second group (group 2) of four patients who showed a poor response to the treatment.
We then performed a gene array analysis by dividing patients in two groups, according to their response to the treatment, and comparing the expression profiles of two groups, before and after treatment, to those of the healthy control samples.
Before treatment we observed that in the first group of patients 689 genes, and in the second group 987 genes were modulated (Supplementary Materials Tables S6 and S7). After treatment, a modulation of 846 transcripts in the first group of patients and of 1077 genes in the second group was observed compared to the control group (Supplementary Materials Tables S8 and S9). When we compared genes modulated pre- and post-treatment in the two groups, we observed that 306 genes in the first group and 119 genes in the second group, returned to baseline expression levels after treatment, showing an expression level comparable to that of healthy controls.
To finely dissect the effect of ADA treatment on gene expression profiles in the two patients groups, we decided to functionally analyze these genes and we found that ADA had an impact on genes involved in signaling events that may be related to the pathogenesis of the disease. In particular, we compared the two lists of biological signaling in which DEGs, that were corrected by the treatment, were involved (Table 4).
Table 4.
Molecular signalings in which are involved genes modulated only before treatment.
We found that some of these categories were shared by the two groups of patients, (i.e., immune response, inflammatory response, angiogenesis, MAP kinase, Jak-Stat small GTPase, T-cell receptor, Notch and TGF-beta signaling) while others were only associated to group 1 (i.e., interleukin 6 production, cytokine mediated, NIK/NF-Kappa B, Toll-like receptor, Tumor necrosis factor, Type 1 interferon, and Wnt signaling) or to group 2 (i.e., EGF receptor, Ephrin receptor, Fc-gamma receptor signaling and positive regulation of BMP and VEGF signaling).
A selection of the above-mentioned genes, which were corrected by the treatment in the two groups of patients, referred to as “genes modulated only before treatment is reported in Table 5 and Table 6, where transcripts are grouped according to the Gene Ontology classification criteria. These tables also show the fold changes resulting from the comparison of pre- or post-treatment condition versus healthy controls.
Table 5.
Genes modulated only before treatment in AS patients group 1. n.c.: not changed.
Table 6.
Genes modulated only before treatment in AS patients-group 2. n.c.: not changed.
Then we also performed a functional enrichment analysis to detect biological processes that were significantly enriched in genes corrected by the treatment.
Some of the enriched biological classes were related to the immune response and, in particular, to the activation of B and T-cell response, as indicated by the enrichment in T-cell activation (p value = 0.005), positive regulation of B-cell activation (p value = 0.041) and B-cell cytokine production (p value = 0.024) categories in the first group, and by the enrichment in T-cell activation (p value = 0.038) and positive regulation of B-cell activation (p value = 0.015) classes in the second group (Table 7). Genes involved in inflammation were also well represented in the two datasets modulated only before treatment and the two classes “inflammatory response” (p value = 0.026) and “NLRP3 inflammasome complex assembly” (p value = 0.006) were enriched in the first and in the second group, respectively.
Table 7.
Biological processes that were significantly enriched in genes corrected by the treatment.
In addition, we also identified functional classes that were enriched only in one of the two groups of patients. These classes were: positive regulation of cytokine production (p value = 0.012) positive regulation of type I interferon production (p value = 0.017) Toll-like receptor signaling pathway (p value = 0.039) positive regulation of interleukin-2 production (p value = 0.001) cellular response to unfolded protein (p value = 0.001) in the first group and, angiogenesis (p value = 0.002) response to transforming growth factor beta (p value = 0.010) and G-protein coupled receptor signaling pathway (p value = 0.031) in the second group.
4. Discussion
In this work, we first compared the gene expression profiles of 10 AS patients before treatment with 10 healthy controls. Secondly, we analysed the gene expression before and after ADA therapy, in order to identify biological processes that may be modulated by the drug. Finally, we compared gene profiles of patients characterized by a different response to the treatment.
Our results showed that AS has a profound impact on gene expression, since a large number of genes are modulated in AS samples. Moreover, DEGs have a role in biological processes that may be pathogenetically relevant to both the disease onset and progression.
The pathological features of AS are supposed to originate from several events that may interact, including biomechanical insult, genetic background, infections, inflammation and immune response, even though the precise mechanisms of the immune activation are still a matter of discussion [24].
We here identified a large number (40) of genes that have well-documented roles in the immune response, including for example TNFSF8/CD30L, interleukin-32 and several Th17-lymphocytes-related genes. TNFSF8 is a TNF-family member expressed on activated peripheral blood T-cells, B-cells, neutrophils, mast cells, monocytes, and macrophages and it is the ligand for CD30, a molecule that is present at high levels in AS patients compared to healthy controls [25]. The CD30/CD30L signaling system has been implicated in the pathogenesis of several autoimmune and inflammatory diseases and it has been recently associated to the pathogenesis of rheumatoid arthritis synovitis [26].
Interleukin-32 is a proinflammatory cytokine produced by T lymphocytes, natural killer cells, blood monocytes and fibroblast-like synoviocytes in the joints. It is present in the synovial fluid of AS patients at higher levels compared with RA or osteoarthritis patients and induces osteoblast differentiation leading to pathological bone growth [27].
Th17 cells have been associated to several autoimmune disorders including SLE, RA and psoriasis where they play a role in the pathogenesis of the disease [28,29,30]. Recent studies have demonstrated that Th17 cells are involved also in the pathogenesis of AS [31].
It is well known that the pathogenesis of AS is characterized by three phases: inflammation, erosion and abnormal bone outgrowth [32]. In this regard our data seem to recapitulate all these pathogenetic stages, showing deregulation of genes involved in the inflammatory process as well of transcripts that play a role in bone remodeling (i.e., bone growth and bone erosion).
Although the precise events that prime inflammation in spondyloarthritis is still unclear, recent findings provided evidence of the involvement of immune pathways, including the lately described IL-17/IL-23 pathway, NF-κB activation and antigen presentation [33] reintroducing the issue of autoimmune versus autoinflammatory disease. To date, however, no immunological pathway has emerged as the master regulator that may finely orchestrate the disease pathogenesis.
Interestingly, we found a remarkable number of DEGs included genes acting in commonly known immunological signalings such as TNF, MAP kinase cascade, Wnt, Toll-like receptor, TGF beta, T-cell receptor, Type I interferon, and Jak-stat signaling.
TNF-alpha is one of the main actors in the inflammatory scenario during the disease progression. Interestingly, here we show up-regulation of several genes involved in the TNF-alpha signaling including TNFRSF25. This molecule is a tumor necrosis factor receptor mainly expressed on T-cells [34] that has been associated with autoimmune diseases such as RA. Moreover, it has been reported that the absence of TNFRSF25 protects from the development of severe bone disorders in experimental antigen-induced arthritis (AIA) [35]. Along with the upregulation of TNF-related genes we also found overexpression of genes involved in interleukin-6 production and signal transduction (including IL6R and IL6ST) together with overexpression of transcripts of the MAP kinases cascade, two well-documented down-stream events of the biologic response to TNF [36]. In particular, it has been shown that high serum levels of IL-6 may associate with the development of AS [36]. The triggering of mitogen-activated kinase (MAPK) signaling cascade leads to activation of downstream JUN N-terminal kinase (JNK) and p38/MAPK14 [37], which is involved in the proinflammatory activity of interleukin 1 (IL-1) and TNF-alpha [38]. The transcript for this kinase was 1.8 fold increased in AS samples. Interestingly, it has been shown that inhibition of p38 can restore chondrocyte proliferation in inflammatory bone diseases such as spondyloarthritis [38].
The Wnt signaling components are critically involved in normal bone homeostasis, and in particular in new bone formation [32]. Moreover, it has been recently suggested that Wnt signaling may take part to the process of ankylosis in spondyloarthritis [32].
Deregulation of TLR signaling has been already described in AS [39] and there is emerging evidence of a potential role of TLRs in AS [40].
The up-regulation of genes involved in TGF-beta signaling is not surprising, since TGF-beta is important for bone formation and has been detected in biopsy specimens from sacroiliac joints of patient with AS where it may play a role in articular cartilage fibrosis and ossification [41]. Moreover, this cytokine is also involved in adaptive immune responses by regulating effector and regulatory CD4+ T-cell responses [42]. The importance of T-cell response is highlighted in our AS samples by the up-regulation of several T-cell related genes involved in T-cell receptor signaling including CD3g molecule, gamma (CD3G) and T-cell receptor alpha constant (TRAC). In particular, the association of this signaling pathway with AS has been already suggested by Chen et al. in a previous whole-blood gene expression study [43]. Among the modulated genes, we also found overexpression of transcripts for members of type I IFN signaling, a network typically associated with autoimmune diseases such as SLE, RA, Crohn’s disease and Sjogren syndrome [44,45,46,47,48,49,50].
In this regard, the co-presence of type I IFN signaling and Th-17 related genes may be suggestive for an autoimmune origin of AS, since the co-activity of IFN and Th17 pathways is typical of autoimmunity and has been described both in human diseases and in animal models [51,52,53].
Another signaling pathway relevant to autoimmunity is the Jak-stat pathway [54] that is represented in our dataset by the upregulation of STAT1 and STAT5b. It has been described that STAT1 gain-of-function mutations are associated to autoimmune response [54] and that this molecule is differentially expressed in AS patients by transcriptome network analysis [55]. In addition we also found modulation of genes involved in fibroblast growth factor receptor, small GTPase and Notch signalings. It is worthwhile mentioning that the first favours the formation of new bone in AS patients [56], the second triggers proliferation of rheumatoid synovial fibroblasts [57] and the Notch signaling is involved in ligament ossification of hip joints in AS [58].
In the next step of our data analysis we found that DEG products were connected in a wide PPI network from which we obtained eight functional modules, containing the most functionally interconnected genes. These modules were significantly enriched in several of the above mentioned pathologically relevant processes and pathways including: T-cell receptor signaling, TLRs signaling, small GTPase signaling, Wnt signaling, p38 MAP kinase cascade and Jak-stat signaling.
Moreover, this analysis was paralleled by the comparison of post-treatment samples to healthy controls and, in this case, the resulted PPI network included seven modules.
Interestingly, by comparing pathways and biological processes enrichments of modules derived from the pre- and the post-treatment conditions, we identified three pre-treatment-associated modules (M3, M6, and M7) towards which the drug seemed to direct its activity. Indeed several crucial processes and pathways, enriched in these modules, were no longer enriched after treatment, including p38 MAP kinase, Wnt, FGF receptor, small GTPase, T-cell receptor and PI3 kinase signaling.
To more finely dissect the impact of treatment on expression profiles of AS samples, we separately analyzed the two groups of patients that were characterized by a different response to the treatment.
The two analyses showed that a quite different number of genes were modulated before treatment in the two datasets. In particular, after comparing genes modulated before and after treatment in the two groups of patients, we found a different number of genes that returned to a normal expression level after treatment.
Focusing our analysis on these genes, we realized that globally, in both groups of patients, the treatment had an impact on many pathologically relevant biological processes, including immune response, inflammatory response, angiogenesis and on several signaling pathways (i.e., Jak-Stat signaling, MAP kinase cascade and Small GTPase signaling). However we also observed that only in the responders group (group 1), genes involved in Toll-like receptor signaling, tumor necrosis factor signaling, Type I interferon signaling and Wnt signaling returned to normal.
Moreover, when we specifically analyzed the categories enriched in genes corrected by the treatment in the two groups of patients, we observed, in both data sets, an enrichment in the inflammatory response and in the lymphocytes activation processes, but we also observed that several categories were enriched only in the group 1, including regulation of interleukin-2 production, cellular response to unfolded protein, positive regulation of type I interferon production and toll-like receptor signaling.
These results suggest that the differences emerged from the separated analysis of the two groups of patients, may be partially related to the different response to treatment. In particular, we have identified altered processes and signaling that may be more strongly associated to AS pathogenesis since they are corrected by the treatment in patients with a good response.
We suggest that these biological processes may be the target of novel therapies if our results are confirmed in further experiments and in a larger number of patients.
5. Conclusions
The etiology of AS is still unknown and the identification of the involved molecular pathogenetic pathways is a crucial issue in medicine. ADA in an humanized anti-TNF-alpha monoclonal antibody, used in the treatment of AS. Our study aimed at analyzing gene transcriptional profiles in patients with AS before and after treatment with ADA. A sophisticated analysis (i.e., PPI network clustering analysis) was used to study DEGs in AS patients before and after treatment.
By PPI network analysis it was possible to identify clusters of genes specifically associated to AS. Within these clusters DEGs belong to well known molecular pathways which play a prominent role in disease pathogenesis. Some of these pathways are strongly modified by ADA in patients with a good response to the treatment. These potentially pathogenetic pathways are not significantly modified in non responder subjects. Clustering network analysis is therefore a promising tool in gene expression studies and may help to identify new potential therapeutical targets in AS.
Supplementary Materials
The following are available online at www.mdpi.com/2073-4425/8/4/127/s1. Table S1: Clinical features of the patients enrolled in the study, Table S2: Genes modulated in AS patients before treatment versus healthy controls, Table S3: Enriched biological processes and pathways related to the eight pre-treatment modules, Table S4: Genes modulated in AS patients after treatment versus healthy controls, Table S5: Enriched biological processes and pathways related to the seven after -treatment modules, Table S6: Genes modulated in AS patients, group 1 before treatment versus healthy controls, Table S7: Genes modulated in AS patients, group 2 before treatment versus healthy controls, Table S8: Genes modulated in AS patients, group 1 after treatment versus healthy controls, Table S9: Genes modulated in AS patients, group 2 after treatment versus healthy controls.
Acknowledgments
This work was supported by a grant from the Ministry for Universities and Scientific and Technological Research (MURST) (Grant recipients Antonio Puccetti and Claudio Lunardi).
Author Contributions
Marzia Dolcino, Antonio Puccetti and Claudio Lunardi conceived and designed the experiments; Marzia Dolcino and Andrea Pelosi performed the experiments and analyzed the data; Elisa Tinazzi, Giuseppe Patuzzo and Francesca Moretta studied the patients and provided the clinical samples; Marzia Dolcino, Antonio Puccetti and Claudio Lunardi wrote the paper.
Conflicts of Interest
The authors declare no conflict of interest.
References
- Stolwijk, C.; Essers, I.; van Tubergen, A.; Boonen, A.; Bazelier, M.T.; de Bruin, M.L.; de Vries, F. The epidemiology of extra-articular manifestations in ankylosing spondylitis: A population-based matched cohort study. Ann. Rheum. Dis. 2015, 74, 1373–1378. [Google Scholar] [CrossRef] [PubMed]
- Reveille, J.D. An update on the contribution of the MHC to as susceptibility. Clin. Rheumatol. 2014, 33, 749–757. [Google Scholar] [CrossRef] [PubMed]
- Braun, J.; van den Berg, R.; Baraliakos, X.; Boehm, H.; Burgos-Vargas, R.; Collantes-Estevez, E.; Dagfinrud, H.; Dijkmans, B.; Dougados, M.; Emery, P.; et al. 2010 update of the ASAS/EULAR recommendations for the management of ankylosing spondylitis. Ann. Rheum. Dis. 2011, 70, 896–904. [Google Scholar] [CrossRef] [PubMed]
- Ward, M.M.; Deodhar, A.; Akl, E.A.; Lui, A.; Ermann, J.; Gensler, L.S.; Smith, J.A.; Borenstein, D.; Hiratzka, J.; Weiss, P.F.; et al. American college of rheumatology/spondylitis association of america/spondyloarthritis research and treatment network 2015 recommendations for the treatment of ankylosing spondylitis and nonradiographic axial spondyloarthritis. Arthritis Rheumatol. 2016, 68, 282–298. [Google Scholar] [CrossRef] [PubMed]
- Sieper, J.; oddubnyy, D. New evidence on the management of spondyloarthritis. Nat. Rev. Rheumatol. 2016, 12, 282–295. [Google Scholar] [CrossRef] [PubMed]
- Batliwalla, F.M.; Baechler, E.C.; Xiao, X.; Li, W.; Balasubramanian, S.; Khalili, H.; Damle, A.; Ortmann, W.A.; Perrone, A.; Kantor, A.B.; et al. Peripheral blood gene expression profiling in rheumatoid arthritis. Genes Immun. 2005, 6, 388–397. [Google Scholar] [CrossRef] [PubMed]
- Baechler, E.C.; Batliwalla, F.M.; Karypis, G.; Gaffney, P.M.; Ortmann, W.A.; Espe, K.J.; Shark, K.B.; Grande, W.J.; Hughes, K.M.; Kapur, V.; et al. Interferon-inducible gene expression signature in peripheral blood cells of patients with severe lupus. Proc. Natl. Acad. Sci. USA 2003, 100, 2610–2615. [Google Scholar] [CrossRef] [PubMed]
- Dolcino, M.; Ottria, A.; Barbieri, A.; Patuzzo, G.; Tinazzi, E.; Argentino, G.; Beri, R.; Lunardi, C.; Puccetti, A. Gene expression profiling in peripheral blood cells and synovial membranes of patients with psoriatic arthritis. PLoS ONE 2015, 10, e0128262. [Google Scholar] [CrossRef] [PubMed]
- Oliveira, R.D.; Fontana, V.; Junta, C.M.; Marques, M.M.; Macedo, C.; Rassi, D.M.; Passos, G.A.; Donadi, E.A.; Louzada-Junior, P. Differential gene expression profiles may differentiate responder and nonresponder patients with rheumatoid arthritis for methotrexate (MTX) monotherapy and MTX plus tumor necrosis factor inhibitor combined therapy. J. Rheumatol. 2012, 39, 1524–1532. [Google Scholar] [CrossRef] [PubMed]
- Kim, T.H.; Choi, S.J.; Lee, Y.H.; Song, G.G.; Ji, J.D. Gene expression profile predicting the response to anti-TNF treatment in patients with rheumatoid arthritis; analysis of GEO datasets. Joint Bone Spine 2014, 81, 325–330. [Google Scholar] [CrossRef] [PubMed]
- Van der Linden, S.; Valkenburg, H.A.; Cats, A. Evaluation of diagnostic criteria for ankylosing spondylitis. A proposal for modification of the New York criteria. Arthritis Rheum. 1984, 27, 361–368. [Google Scholar] [CrossRef] [PubMed]
- Raychaudhuri, S.P.; Deodhar, A. The classification and diagnostic criteria of ankylosing spondylitis. J. Autoimmun. 2014, 48–49, 128–133. [Google Scholar] [CrossRef] [PubMed]
- Godfrin-Valnet, M.; Prati, C.; Puyraveau, M.; Toussirot, E.; Letho-Gyselink, H.; Wendling, D. Evaluation of spondylarthritis activity by patients and physicians: ASDAS, BASDAI, PASS, and flares in 200 patients. Joint Bone Spine 2013, 80, 393–398. [Google Scholar] [CrossRef] [PubMed]
- Mi, H.; Thomas, P. Panther pathway: An ontology-based pathway database coupled with data analysis tools. Methods Mol. Biol. 2009, 563, 123–140. [Google Scholar] [PubMed]
- Franceschini, A.; Szklarczyk, D.; Frankild, S.; Kuhn, M.; Simonovic, M.; Roth, A.; Lin, J.; Minguez, P.; Bork, P.; von Mering, C.; et al. STRING v9.1: Protein-protein interaction networks, with increased coverage and integration. Nucleic Acids Res. 2013, 41, D808–D815. [Google Scholar] [CrossRef] [PubMed]
- Jensen, L.J.; Kuhn, M.; Stark, M.; Chaffron, S.; Creevey, C.; Muller, J.; Doerks, T.; Julien, P.; Roth, A.; Simonovic, M.; et al. STRING 8—A global view on proteins and their functional interactions in 630 organisms. Nucleic Acids Res. 2009, 37, D412–D416. [Google Scholar] [CrossRef] [PubMed]
- Bader, G.D.; Hogue, C.W. An automated method for finding molecular complexes in large protein interaction networks. BMC Bioinform. 2003, 4, 2. [Google Scholar] [CrossRef]
- Cline, M.S.; Smoot, M.; Cerami, E.; Kuchinsky, A.; Landys, N.; Workman, C.; Christmas, R.; Avila-Campilo, I.; Creech, M.; Gross, B.; et al. Integration of biological networks and gene expression data using Cytoscape. Nat. Protoc. 2007, 2, 2366–2382. [Google Scholar] [CrossRef] [PubMed]
- Dolcino, M.; Cozzani, E.; Riva, S.; Parodi, A.; Tinazzi, E.; Lunardi, C.; Puccetti, A. Gene expression profiling in dermatitis herpetiformis skin lesions. Clin. Dev. Immunol. 2012, 2012, 198956. [Google Scholar] [CrossRef] [PubMed]
- Tinazzi, E.; Dolcino, M.; Puccetti, A.; Rigo, A.; Beri, R.; Valenti, M.T.; Corrocher, R.; Lunardi, C. Gene expression profiling in circulating endothelial cells from systemic sclerosis patients shows an altered control of apoptosis and angiogenesis that is modified by Iloprost infusion. Arthritis Res. Ther. 2010, 12, R131. [Google Scholar] [CrossRef] [PubMed]
- Dolcino, M.; Patuzzo, G.; Barbieri, A.; Tinazzi, E.; Rizzi, M.; Beri, R.; Argentino, G.; Ottria, A.; Lunardi, C.; Puccetti, A. Gene expression profiling in peripheral blood mononuclear cells of patients with common variable immunodeficiency: Modulation of adaptive immune response following intravenous immunoglobulin therapy. PLoS ONE 2014, 9, e97571. [Google Scholar] [CrossRef] [PubMed]
- Heid, C.A.; Stevens, J.; Livak, K.J.; Williams, P.M. Real time quantitative PCR. Genome Res. 1996, 6, 986–994. [Google Scholar] [CrossRef] [PubMed]
- Livak, K.J.; Schmittgen, T.D. Analysis of relative gene expression data using real-time quantitative PCR and the 2−ΔΔCT method. Methods 2001, 25, 402–408. [Google Scholar] [CrossRef] [PubMed]
- Mahmoudi, M.; Aslani, S.; Nicknam, M.H.; Karami, J.; Jamshidi, A.R. New insights toward the pathogenesis of ankylosing spondylitis; genetic variations and epigenetic modifications. Mod. Rheumatol. 2016, 27, 198–209. [Google Scholar] [CrossRef] [PubMed]
- Gao, R.; Sun, W.; Chen, Y.; Su, Y.; Wang, C.; Dong, L. Elevated serum levels of soluble CD30 in ankylosing spondylitis patients and its association with disease severity-related parameters. BioMed Res. Int. 2015, 2015, 617282. [Google Scholar] [CrossRef] [PubMed]
- Barbieri, A.; Dolcino, M.; Tinazzi, E.; Rigo, A.; Argentino, G.; Patuzzo, G.; Ottria, A.; Beri, R.; Puccetti, A.; Lunardi, C. Characterization of CD30/CD30L(+) cells in peripheral blood and synovial fluid of patients with rheumatoid arthritis. J. Immunol. Res. 2015, 2015, 729654. [Google Scholar] [CrossRef] [PubMed]
- Lee, E.J.; Lee, E.J.; Chung, Y.H.; Song, D.H.; Hong, S.; Lee, C.K.; Yoo, B.; Kim, T.H.; Park, Y.S.; Kim, S.H.; et al. High level of interleukin-32 gamma in the joint of ankylosing spondylitis is associated with osteoblast differentiation. Arthritis Res. Ther. 2015, 17, 350. [Google Scholar] [CrossRef] [PubMed]
- Rother, N.; van der Vlag, J. Disturbed T-cell signaling and altered Th17 and regulatory T-cell subsets in the pathogenesis of systemic lupus erythematosus. Front. Immunol. 2015, 6, 610. [Google Scholar] [CrossRef] [PubMed]
- Lubberts, E. The IL-23-IL-17 axis in inflammatory arthritis. Nat. Rev. Rheumatol. 2015, 11, 415–429. [Google Scholar] [CrossRef] [PubMed]
- Diani, M.; Altomare, G.; Reali, E. T helper cell subsets in clinical manifestations of psoriasis. J. Immunol. Res. 2016, 2016, 7692024. [Google Scholar] [CrossRef] [PubMed]
- Gracey, E.; Qaiyum, Z.; Almaghlouth, I.; Lawson, D.; Karki, S.; Avvaru, N.; Zhang, Z.; Yao, Y.; Ranganathan, V.; Baglaenko, Y.; et al. IL-7 primes IL-17 in mucosal-associated invariant T (mait) cells, which contribute to the Th17-axis in ankylosing spondylitis. Ann. Rheum. Dis. 2016, 75, 2124–2432. [Google Scholar] [CrossRef] [PubMed]
- Xie, W.; Zhou, L.; Li, S.; Hui, T.; Chen, D. Wnt/beta-catenin signaling plays a key role in the development of spondyloarthritis. Ann. N. Y. Acad. Sci. 2016, 1364, 25–31. [Google Scholar] [CrossRef] [PubMed]
- Smith, J.A. Update on ankylosing spondylitis: Current concepts in pathogenesis. Curr. Allergy Asthma Rep. 2015, 15, 489. [Google Scholar] [CrossRef] [PubMed]
- Meylan, F.; Davidson, T.S.; Kahle, E.; Kinder, M.; Acharya, K.; Jankovic, D.; Bundoc, V.; Hodges, M.; Shevach, E.M.; Keane-Myers, A.; et al. The TNF-family receptor DR3 is essential for diverse T-cell-mediated inflammatory diseases. Immunity 2008, 29, 79–89. [Google Scholar] [CrossRef] [PubMed]
- Bull, M.J.; Williams, A.S.; Mecklenburgh, Z.; Calder, C.J.; Twohig, J.P.; Elford, C.; Evans, B.A.; Rowley, T.F.; Slebioda, T.J.; Taraban, V.Y.; et al. The death receptor 3-TNF-like protein 1a pathway drives adverse bone pathology in inflammatory arthritis. J. Exp. Med. 2008, 205, 2457–2464. [Google Scholar] [CrossRef] [PubMed]
- Liu, W.; Wu, Y.H.; Zhang, L.; Liu, X.Y.; Xue, B.; Wang, Y.; Liu, B.; Jiang, Q.; Kwang, H.W.; Wu, D.J. Elevated serum levels of IL-6 and IL-17 may associate with the development of ankylosing spondylitis. Int. J. Clin. Exp. Med. 2015, 8, 17362–17376. [Google Scholar] [PubMed]
- Braem, K.; Luyten, F.P.; Lories, R.J. Blocking p38 signaling inhibits chondrogenesis in vitro but not ankylosis in a model of ankylosing spondylitis in vivo. Ann. Rheum. Dis. 2012, 71, 722–728. [Google Scholar] [CrossRef] [PubMed]
- Studer, R.K.; Bergman, R.; Stubbs, T.; Decker, K. Chondrocyte response to growth factors is modulated by p38 mitogen-activated protein kinase inhibition. Arthritis Res. Ther. 2004, 6, R56–R64. [Google Scholar] [CrossRef] [PubMed]
- Assassi, S.; Reveille, J.D.; Arnett, F.C.; Weisman, M.H.; Ward, M.M.; Agarwal, S.K.; Gourh, P.; Bhula, J.; Sharif, R.; Sampat, K.; et al. Whole-blood gene expression profiling in ankylosing spondylitis shows upregulation of Toll-like receptor 4 and 5. J. Rheumatol. 2011, 38, 87–98. [Google Scholar] [CrossRef] [PubMed]
- Tan, F.K.; Farheen, K. The potential importance of Toll-like receptors in ankylosing spondylitis. Int. J. Clin. Rheumtol. 2011, 6, 649–654. [Google Scholar] [CrossRef] [PubMed]
- Krug, H.E. Fibroblasts from mice with progessive ankylosis proliferate excessively in response to transforming growth factor-beta 1. J. Investig. Med. 1998, 46, 134–139. [Google Scholar] [PubMed]
- Travis, M.A.; Sheppard, D. Tgf-beta activation and function in immunity. Annu. Rev. Immunol. 2014, 32, 51–82. [Google Scholar] [CrossRef] [PubMed]
- Chen, K.; Wei, X.Z.; Zhu, X.D.; Bai, Y.S.; Chen, Y.; Wang, C.F.; Chen, Z.Q.; Li, M. Whole-blood gene expression profiling in ankylosing spondylitis identifies novel candidate genes that may contribute to the inflammatory and tissue-destructive disease aspects. Cell. Immunol. 2013, 286, 59–64. [Google Scholar] [CrossRef] [PubMed]
- Gordon, R.A.; Grigoriev, G.; Lee, A.; Kalliolias, G.D.; Ivashkiv, L.B. The interferon signature and stat1 expression in rheumatoid arthritis synovial fluid macrophages are induced by tumor necrosis factor alpha and counter-regulated by the synovial fluid microenvironment. Arthritis Rheum. 2012, 64, 3119–3128. [Google Scholar] [CrossRef] [PubMed]
- Nzeusseu Toukap, A.; Galant, C.; Theate, I.; Maudoux, A.L.; Lories, R.J.; Houssiau, F.A.; Lauwerys, B.R. Identification of distinct gene expression profiles in the synovium of patients with systemic lupus erythematosus. Arthritis Rheum. 2007, 56, 1579–1588. [Google Scholar] [CrossRef] [PubMed]
- Thurlings, R.M.; Boumans, M.; Tekstra, J.; van Roon, J.A.; Vos, K.; van Westing, D.M.; van Baarsen, L.G.; Bos, C.; Kirou, K.A.; Gerlag, D.M.; et al. Relationship between the type I Interferon signature and the response to rituximab in rheumatoid arthritis patients. Arthritis Rheum. 2010, 62, 3607–3614. [Google Scholar] [CrossRef] [PubMed]
- Raterman, H.G.; Vosslamber, S.; de Ridder, S.; Nurmohamed, M.T.; Lems, W.F.; Boers, M.; van de Wiel, M.; Dijkmans, B.A.; Verweij, C.L.; Voskuyl, A.E. The Interferon type I signature towards prediction of non-response to rituximab in rheumatoid arthritis patients. Arthritis Res. Ther. 2012, 14, R95. [Google Scholar] [CrossRef] [PubMed]
- Moschella, F.; Torelli, G.F.; Valentini, M.; Urbani, F.; Buccione, C.; Petrucci, M.T.; Natalino, F.; Belardelli, F.; Foa, R.; Proietti, E. Cyclophosphamide induces a type I Interferon-associated sterile inflammatory response signature in cancer patients’ blood cells: Implications for cancer chemoimmunotherapy. Clin. Cancer Res. 2013, 19, 4249–4261. [Google Scholar] [CrossRef] [PubMed]
- Maria, N.I.; Brkic, Z.; Waris, M.; van Helden-Meeuwsen, C.G.; Heezen, K.; van de Merwe, J.P.; van Daele, P.L.; Dalm, V.A.; Drexhage, H.A.; Versnel, M.A. Mxa as a clinically applicable biomarker for identifying systemic Interferon type I in primary sjogren’s syndrome. Ann. Rheum. Dis. 2014, 73, 1052–1059. [Google Scholar] [CrossRef] [PubMed]
- Caignard, G.; Lucas-Hourani, M.; Dhondt, K.P.; Labernardiere, J.L.; Petit, T.; Jacob, Y.; Horvat, B.; Tangy, F.; Vidalain, P.O. The v protein of tioman virus is incapable of blocking type I Interferon signaling in human cells. PLoS ONE 2013, 8, e53881. [Google Scholar] [CrossRef] [PubMed]
- Ambrosi, A.; Espinosa, A.; Wahren-Herlenius, M. Il-17: A new actor in IFN-driven systemic autoimmune diseases. Eur. J. Immunol. 2012, 42, 2274–2284. [Google Scholar] [CrossRef] [PubMed]
- Axtell, R.C.; de Jong, B.A.; Boniface, K.; van der Voort, L.F.; Bhat, R.; De Sarno, P.; Naves, R.; Han, M.; Zhong, F.; Castellanos, J.G.; et al. T helper type 1 and 17 cells determine efficacy of Interferon-beta in multiple sclerosis and experimental encephalomyelitis. Nat. Med. 2010, 16, 406–412. [Google Scholar] [CrossRef] [PubMed]
- Brkic, Z.; Corneth, O.B.; van Helden-Meeuwsen, C.G.; Dolhain, R.J.; Maria, N.I.; Paulissen, S.M.; Davelaar, N.; van Hamburg, J.P.; van Daele, P.L.; Dalm, V.A.; et al. T-helper 17 cell cytokines and Interferon type I: Partners in crime in systemic lupus erythematosus? Arthritis Res. Ther. 2014, 16, R62. [Google Scholar] [CrossRef] [PubMed]
- O’Shea, J.J.; Plenge, R. Jak and STAT signaling molecules in immunoregulation and immune-mediated disease. Immunity 2012, 36, 542–550. [Google Scholar] [CrossRef] [PubMed]
- Zhu, Z.Q.; Tang, J.S.; Cao, X.J. Transcriptome network analysis reveals potential candidate genes for ankylosing spondylitis. Eur. Rev. Med. Pharmacol. Sci. 2013, 17, 3178–3185. [Google Scholar] [PubMed]
- Beyer, C.; Schett, G. Pharmacotherapy: Concepts of pathogenesis and emerging treatments. Novel targets in bone and cartilage. Best Pract. Res. Clin. Rheumatol. 2010, 24, 489–496. [Google Scholar] [CrossRef] [PubMed]
- Nakayamada, S.; Kurose, H.; Saito, K.; Mogami, A.; Tanaka, Y. Small GTP-binding protein Rho-mediated signaling promotes proliferation of rheumatoid synovial fibroblasts. Arthritis Res. Ther. 2005, 7, R476–R484. [Google Scholar] [CrossRef] [PubMed]
- Xu, W.; Liang, C.G.; Li, Y.F.; Ji, Y.H.; Qiu, W.J.; Tang, X.Z. Involvement of Notch1/Hes signaling pathway in ankylosing spondylitis. Int. J. Clin. Exp. Pathol. 2015, 8, 2737–2745. [Google Scholar] [PubMed]
© 2017 by the authors. Licensee MDPI, Basel, Switzerland. This article is an open access article distributed under the terms and conditions of the Creative Commons Attribution (CC BY) license (http://creativecommons.org/licenses/by/4.0/).