Clustering Rfam 10.1: Clans, Families, and Classes


Abstract
:1. Introduction
2. Results and Discussion
2.1. Clusters and RNA Classes
2.2. Clusters and Rfam Clans
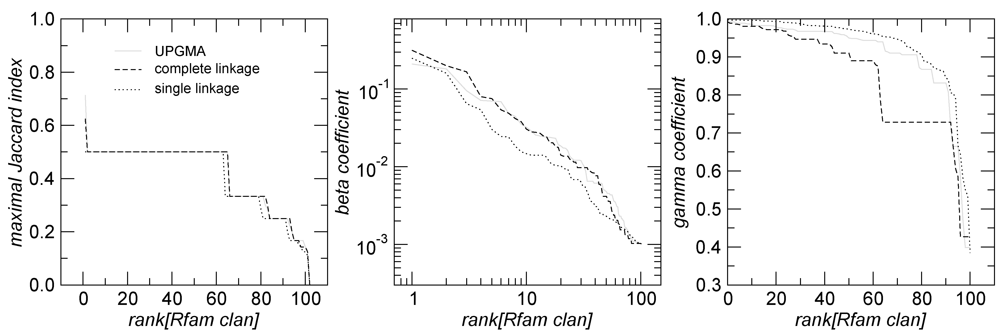
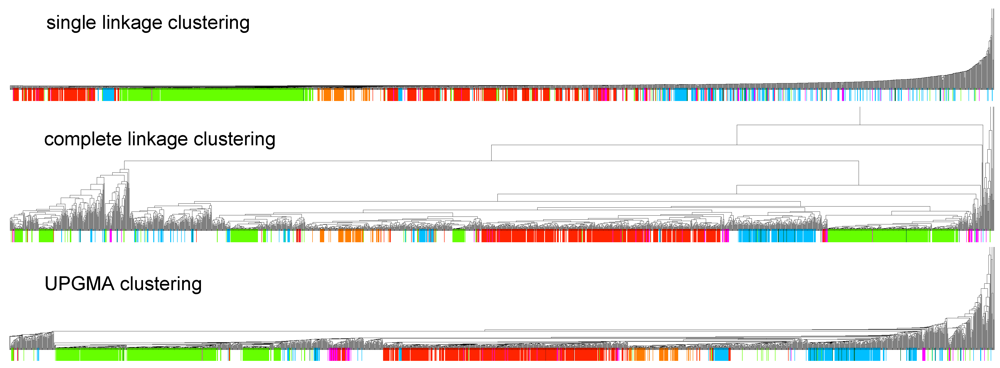
 in Figure 2 mostly consists of size two clans, which are not recovered as cherries in the clustering tree. The CRISPR-2 clan is among the few larger clans that cluster together with most of its families. Using the dispersion coefficient β as a measure, clans CRISPR-2 and CRISPR-1 are well clustered. In addition a few microRNA and snoRNA clans with only two members received relatively large β values. A visual inspection of the UPGMA tree (Figure 1) reveals that differences in structural complexity can be directly inferred from the tree: larger and more complex RNAs, in particular rRNAs, appear isolated in this tree’s leftmost. In the other extreme, simple structural elements such as microRNA’s precursor hairpins and snoRNAs’ simple structures were clearly clustered together.
2.3. Significant Structure-Based Clusters
3. Experimental Section
 of two ordered forests
  and
and  can in general be computed efficiently by means of a dynamic programming algorithm [42]. Here we used an implementation available in the RNAdistance program, a component of the Vienna RNA Package (version 1.8.4). One disadvantage of using this distance measure is that two secondary structures of very distinct lengths always become very distant, even if they possess similar motifs. In addition, one of the most time consuming steps was running RNAdistance, since almost 2 million structure comparisons had to be completed. Nevertheless, this procedure took only a few hours.
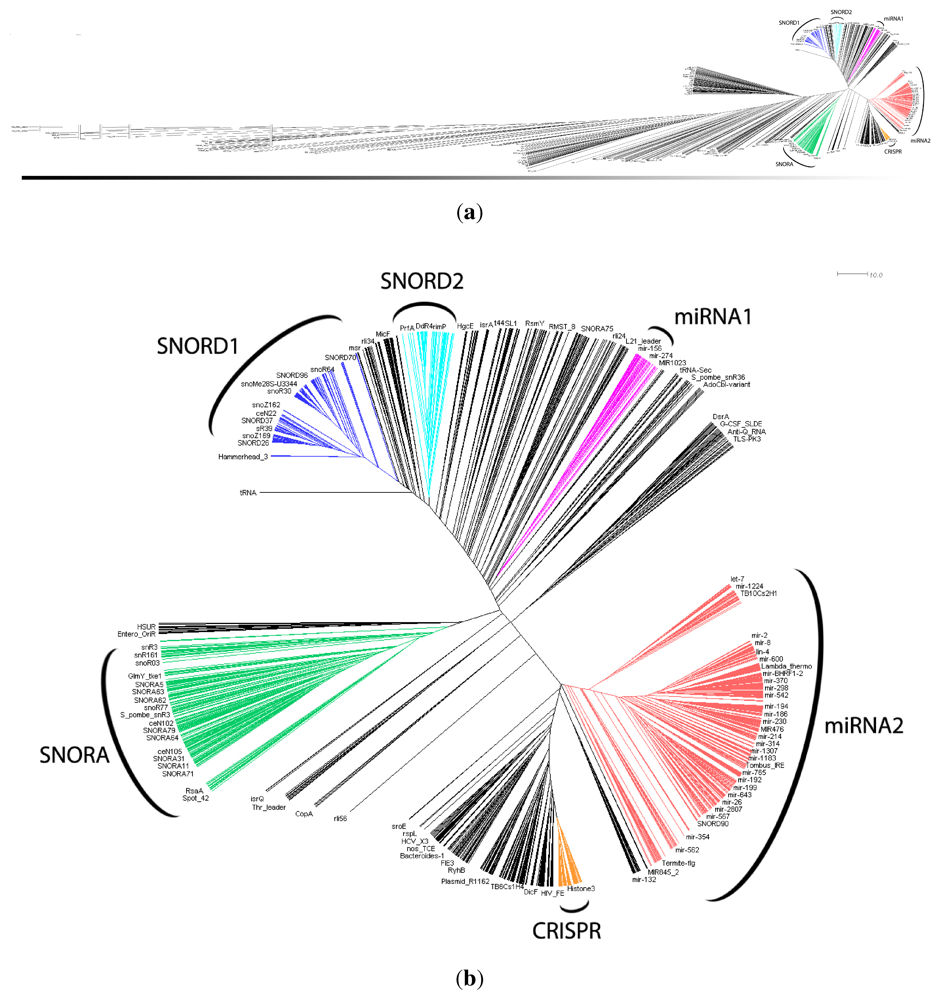

| Cluster | Number of Rfam families included | Percentage of Rfam families of the expected ncRNA | Clans (name and identification) with all families included in Cluster |
|---|---|---|---|
| SNORD1 | 334 | 94.9% | SNORD52 (CL00063), U54 (CL00008), SNORD26 (CL00050), |
| SNORD44 (CL00060), SNORD58 (CL00064), SNORD101 (CL00074), | |||
| SNORD105 (CL00075), SNORND104 (CL00077) | |||
| SNORD61 (CL00067), SNORD39 (CL00057), SNORD18 (CL00047), | |||
| SNORD34 (CL00055), SNORD96 (CL00072), SNORD110 (CL00076), | |||
| SNORD30 (CL00052), SNORD19 (CL00048), SNORD100 (CL00073) | |||
| SNORD2 | 86 | 81.4% | SNORD15 (CL00045) |
| SNORA | 158 | 81.0% | SNORA7 (CL00025), SNORA28 (CL00033), SNORA44 (CL00036), |
| SNORA17 (CL00029), SNORA35 (CL00034), SNORA5 (CL00024), | |||
| SCARNA4 (CL00019) | |||
| miRNA1 | 45 | 86.6% | MIR171 (CL00099) |
| miRNA2 | 472 | 85.6% | mir-34 (CL00087), mir-216 (CL00094), mir-279 (CL00095), |
| mir-36 (CL00088), mir-81 (CL00091), mir-182 (CL00093), | |||
| mir-3 (CL00084), mir-50 (CL00089), mir-BART (CL00097), | |||
| mir-137 (CL00092), mir-73 (CL00090) | |||
| CRISPR | 100 | 59.0% | CRISPR-1 (CL00014), CRISPR-2 (CL00015) |
 between clusters. In each step, the two closest clusters,
  and
and  , are united to a single cluster
  . The distance of . to all clusters
  is then obtained recursively starting from
  for clusters consisting of individual points. The form of the recursion determines the particular clustering method [43]. For UPGMA
  , for single linkage
  , and for complete linkage
  . The resulting hierarchy of clusters is conveniently represented as a dendrogram
  , in which leafs are the individual points. Each cluster is uniquely identified by a node
  as the set of leafs of subtree rooted at . Dendrograms are drawn with a custom-made tool that allows to highlight sets of leaves using regular expressions that match against the extracted Rfam metadata. by an externally defined group, and let be a cluster of . Then we define
  (1)
(1) is the height of a given subtree as calculated by the cluster distance
  , i.e., zero for a leaf , or
  for a subtree having children
  and
and  . The maximal Jaccard index
  compromises between coverage and contamination.
  measures how dispersed is in by computing the fraction of members of which compose the smallest cluster
  that entirely contains . This measure is quite sensitive to individual outliers. On the other hand,
  , which is also a measure of dispersion, takes the dendrogram cluster heights avoiding to assign bad scores to groups of very similar families. If the pre-defined group appears as a cluster in ,
  .
.4. Conclusions
Acknowledgments
References
- Griffiths-Jones, S.; Bateman, A.; Marshall, M.; Khanna, A.; Eddy, S.R. Rfam: An RNA family database. Nucleic Acids Res. 2003, 31, 439–441. [Google Scholar] [CrossRef]
- Griffiths-Jones, S.; Moxon, S.; Marshall, M.; Khanna, A.; Eddy, S.R.; Bateman, A. Rfam: Annotating non-coding RNAs in complete genomes. Nucleic Acids Res. 2005, 33, 121–124. [Google Scholar]
- Gardner, P.P.; Daub, J.; Tate, J.; Moore, B.L.; Osuch, I.H.; Griffiths-Jones, S.; Finn, R.D.; Nawrocki, E.P.; Kolbe, D.L.; Eddy, S.R.; Bateman, A. Rfam: Wikipedia, clans and the “decimal” release. Nucleic Acids Res. 2011, 39, D141–D145. [Google Scholar]
- Backofen, R.; Flamm, C.; Fried, C.; Fritzsch, G.; Hackermüller, J.; Hertel, J.; Hofacker, I.L.; Missal, K.; Mosig, A.; Prohaska, S.J.; Rose, D.; et al. The Athanasius F. Bompfünewerer RNA Consortium. RNAs everywhere: Genome-wide annotation of structured RNAs. J. Exp. Zool. B: Mol. Dev. Evol. 2007, 308B, 1–25. [Google Scholar] [CrossRef]
- Eigen, M.; Lindemann, B.F.; Tietze, M.; Winkler-Oswatitsch, R.; Dress, A.W.M.; von Haeseler, A. How old is the genetic code? Statistical geometry of tRNA provides an answer. Science 1989, 244, 673–679. [Google Scholar]
- Rodin, A.S.; Szathmáry, E.; Rodin, S.N. One ancestor for two codes viewed from the perspective of two complementary modes of tRNA aminoacylation. Biol. Direct 2009, 4. [Google Scholar] [CrossRef]
- Wilusz, J.E.; Freier, S.M.; L., S.D. 3’ End Processing of a Long Nuclear-Retained Noncoding RNA Yields a tRNA-like Cytoplasmic RNA. Cell 2008, 135, 919–932. [Google Scholar] [CrossRef]
- Sunwoo, H.; Dinger, M.E.; Wilusz, J.E.; Amaral, P.P.; Mattick, J.S.; Spector, D.L. MEN ε/β nuclear-retained non-coding RNAs are up-regulated upon muscle differentiation and are essential components of paraspeckles. Genome Res. 2009, 19, 347–359. [Google Scholar]
- Rozhdestvensky, T.S.; Kopylov, A.M.; Brosius, J.; Hüttenhofer, A. Neuronal BC1 RNA structure: Evolutionary conversion of a tRNA(Ala) domain into an extended stem-loop structure. RNA 2001, 7, 722–730. [Google Scholar] [CrossRef]
- Hertel, J.; Lindemeyer, M.; Missal, K.; Fried, C.; Tanzer, A.; Flamm, C.; Hofacker, I.L.; Stadler, P.F. The students of bioinformatics computer labs 2004 and 2005. The expansion of the metazoan microRNA repertoire. BMC Genomics 2006, 7, 1–15. [Google Scholar]
- Sempere, L.F.; Cole, C.N.; McPeek, M.A.; Peterson, K.J. The phylogenetic distribution of metazoan microRNAs: Insights into evolutionary complexity and constraint. J. Exp. Zool. B. Mol. Dev. Evol. 2006, 306, 575–588. [Google Scholar]
- Niwa, R.; Slack, F.J. The evolution of animal microRNA function. Curr. Opin. Genet. Dev. 2007, 17, 145–150. [Google Scholar] [CrossRef]
- Heimberg, A.M.; Cowper-Sal·lari, R.; Sémon, M.; Donoghue, P.C.; Peterson, K.J. MicroRNAs reveal the interrelationships of hagfish, lampreys, and gnathostomes and the nature of the ancestral vertebrate. Proc. Natl. Acad. Sci. USA 2010, 107, 19379–19383. [Google Scholar]
- Tanzer, A.; Stadler, P.F. Molecular evolution of a microRNA cluster. J. Mol. Biol. 2004, 339, 327–335. [Google Scholar] [CrossRef]
- Chen, K.; Rajewsky, N. The evolution of gene regulation by transcription factors and microRNAs. Nat. Rev. Genet. 2007, 8, 93–103. [Google Scholar]
- Berezikov, E. Evolution of microRNA diversity and regulation in animals. Nat. Rev. Genetics 2011, 12, 846–860. [Google Scholar] [CrossRef]
- Marz, M.; Gruber, A.R.; Höner zu Siederdissen, C.; Amman, F.; Badelt, S.; Bartschat, S.; Bernhart, S.H.; Beyer, W.; Kehr, S.; Lorenz, R.; et al. Animal snoRNAs and scaRNAs with Exceptional Structures. RNA Biol. 2011, 8, 938–946. [Google Scholar] [CrossRef]
- Dalloul, R.A.; Long, J.A.; Zimin, A.V.; Aslam, L.; Beal, K.; Blomberg, L.A.; Bouffard, P.; Burt, D.W.; Crasta, O.; Crooijmans, R.P.M.A.C.; et al. Multi-platform next-generation sequencing of the domestic turkey (Meleagris gallopavo): Genome assembly and analysis. PLoS Biol. 2010, 8. [Google Scholar] [CrossRef]
- Will, S.; Missal, K.; Hofacker, I.L.; Stadler, P.F.; Backofen, R. Inferring non-coding RNA families and classes by means of genome-scale structure-based clustering. PLoS Comp. Biol. 2007, 3. [Google Scholar] [CrossRef]
- Liu, Q.; Olman, V.; Liu, H.; Ye, X.; Qiu, S.; Xu, Y. RNACluster: An integrated tool for RNA secondary structure comparison and clustering. J. Comput. Chem. 2008, 29, 1517–1526. [Google Scholar] [CrossRef]
- Torarinsson, E.; Havgaard, J.H.; Gorodkin, J. Multiple structural alignment and clustering of RNA sequences. Bioinformatics 2007, 23, 926–932. [Google Scholar] [CrossRef]
- Höchsmann, M.; Töller, T.; Giegerich, R.; Kurtz, S. Local similarity in RNA secondary structures. Proc. IEEE Comput. Soc. Bioinform. Conf. 2003, 2, 159–168. [Google Scholar]
- Shapiro, B.A.; Zhang, K.Z. Comparing multiple RNA secondary structures using tree comparisons. Comput. Appl. Biosci. 1990, 6, 309–318. [Google Scholar]
- Jiang, T.; Lin, G.; Ma, B.; Zhang, K. A general edit distance between RNA structures. J. Comput. Biol. 2002, 9, 371–388. [Google Scholar] [CrossRef]
- Hofacker, I.L.; Fekete, M.; Stadler, P.F. Secondary structure prediction for aligned RNA sequences. J. Mol. Biol. 2002, 319, 1059–1066. [Google Scholar] [CrossRef]
- Sankoff, D. Simultaneous solution of the RNA folding, alignment, and proto-sequence problems. SIAM J. Appl. Math. 1985, 45, 810–825. [Google Scholar] [CrossRef]
- Sokal, R.R.; Michener, C.D. A statistical method for evaluating systematic relationships. Univ. Kansas Sci. Bull. 1958, 28, 1409–1438. [Google Scholar]
- Sibson, R. SLINK: An optimally efficient algorithm for the single-link cluster method. Comput. J. (BCS) 1973, 16, 30–34. [Google Scholar] [CrossRef]
- Sorensen, T. A method of establishing groups of equal amplitude in plant sociology based on similarity of species and its application to analyses of the vegetation on Danish commons. Biologiske Skrifter 1948, 5, 1–34. [Google Scholar]
- Axtell, M.J.; Westholm, J.O.; Lai, E.C. Vive la différence: Biogenesis and evolution of microRNAs in plants and animals. Genome Biol. 2011, 12. [Google Scholar] [CrossRef]
- Li, S.C.; Shiau, C.K.; Lin, W.C. Vir-Mir db: Prediction of viral microRNA candidate hairpins. Nucleic Acids Res. 2008, 36, D184–D189. [Google Scholar]
- Cullen, B.R. Viruses and microRNAs: RISCy interactions with serious consequences. Genes Dev. 2011, 25, 1881–1894. [Google Scholar] [CrossRef]
- Sharkady, S.M.; Williams, K.P. A third lineage with two-piece tmRNA. Nucleic Acids Res. 2004, 32, 4531–4538. [Google Scholar] [CrossRef]
- Mao, C.; Bhardwaj, K.; Sharkady, S.M.; Fish, R.I.; Driscoll, T.; Wower, J.; Zwieb, C.; Sobral, B.W.; Williams, K.P. Variations on the tmRNA gene. RNA Biol. 2009, 6, 355–361. [Google Scholar] [CrossRef]
- Rosenblad, M.A.; Larsen, N.; Samuelsson, T.; Zwieb, C. Kinship in the SRP RNA family. RNA Biol. 2009, 6, 508–516. [Google Scholar] [CrossRef]
- Piccinelli, P.; Rosenblad, M.A.; Samuelsson, T. Identification and analysis of ribonuclease P and MRP RNA in a broad range of eukaryotes. Nucleic Acids Res. 2005, 33, 4485–4495. [Google Scholar] [CrossRef]
- Walker, S.C.; Engelke, D.R. Ribonuclease P: The evolution of an ancient RNA enzyme. Crit. Rev. Biochem. Mol. Biol. 2006, 41, 77–102. [Google Scholar] [CrossRef]
- Schmitt, M.E.; Bennett, J.L.; Dairaghi, D.J.; Clayton, D.A. Secondary structure of RNase MRP RNA as predicted by phylogenetic comparison. FASEB J. 1993, 7, 208–213. [Google Scholar]
- Woodhams, M.D.; Stadler, P.F.; Penny, D.; Collins, L.J. RNAse MRP and the RNA processing cascade in the eukaryotic ancestor. BMC Evol. Biol. 2007, 7. [Google Scholar] [CrossRef]
- Pisarev, A.V.; Shirokikh, N.E.; Hellen, C.U. Translation initiation by factor-independent binding of eukaryotic ribosomes to internal ribosomal entry sites. C R Biologie 2005, 328, 589–605. [Google Scholar] [CrossRef]
- Hofacker, I.L.; Fontana, W.; Stadler, P.F.; Bonhoeffer, L.S.; Tacker, M.; Schuster, P. Fast folding and comparison of RNA secondary structures. Monatsh. Chem. 1994, 125, 167–188. [Google Scholar] [CrossRef]
- Zhang, K.; Shasha, D. Simple fast algorithms for the editing distance between trees and related problems. SIAM J. Comput. 1989, 18, 1245–1262. [Google Scholar] [CrossRef]
- Lance, G.N.; Williams, W.T. A general theory of classifactory sorting strategies I. Hierarchical systems. Comp. J. 1967, 9, 373–380. [Google Scholar]
Supplementary Files
© 2012 by the authors; licensee MDPI, Basel, Switzerland. This article is an open access article distributed under the terms and conditions of the Creative Commons Attribution license (http://creativecommons.org/licenses/by/3.0/).
Share and Cite
Lessa, F.A.; Raiol, T.; Brigido, M.M.; Martins Neto, D.S.B.; Walter, M.E.M.T.; Stadler, P.F. Clustering Rfam 10.1: Clans, Families, and Classes. Genes 2012, 3, 378-390. https://doi.org/10.3390/genes3030378
Lessa FA, Raiol T, Brigido MM, Martins Neto DSB, Walter MEMT, Stadler PF. Clustering Rfam 10.1: Clans, Families, and Classes. Genes. 2012; 3(3):378-390. https://doi.org/10.3390/genes3030378
Chicago/Turabian StyleLessa, Felipe A., Tainá Raiol, Marcelo M. Brigido, Daniele S. B. Martins Neto, Maria Emília M. T. Walter, and Peter F. Stadler. 2012. "Clustering Rfam 10.1: Clans, Families, and Classes" Genes 3, no. 3: 378-390. https://doi.org/10.3390/genes3030378
APA StyleLessa, F. A., Raiol, T., Brigido, M. M., Martins Neto, D. S. B., Walter, M. E. M. T., & Stadler, P. F. (2012). Clustering Rfam 10.1: Clans, Families, and Classes. Genes, 3(3), 378-390. https://doi.org/10.3390/genes3030378