Transcriptomic Signatures of Mitochondrial Dysfunction in Autism: Integrated mRNA and microRNA Profiling
Abstract
1. Introduction
2. Materials and Methods
2.1. Lyphobalstopid Cell Lines
2.2. Sequening and Bioinformatics
2.3. Target Prediction and Enrichment Analysis
2.4. Relationship to Genes Previous Identifed Differentiating AD-A and AD-N
3. Results
3.1. Identification of Differentially Expressed Genes (DEGs)
3.2. Identification of Differentially Expressed miRNAs (DEMs)
3.2.1. Enrichment Analysis
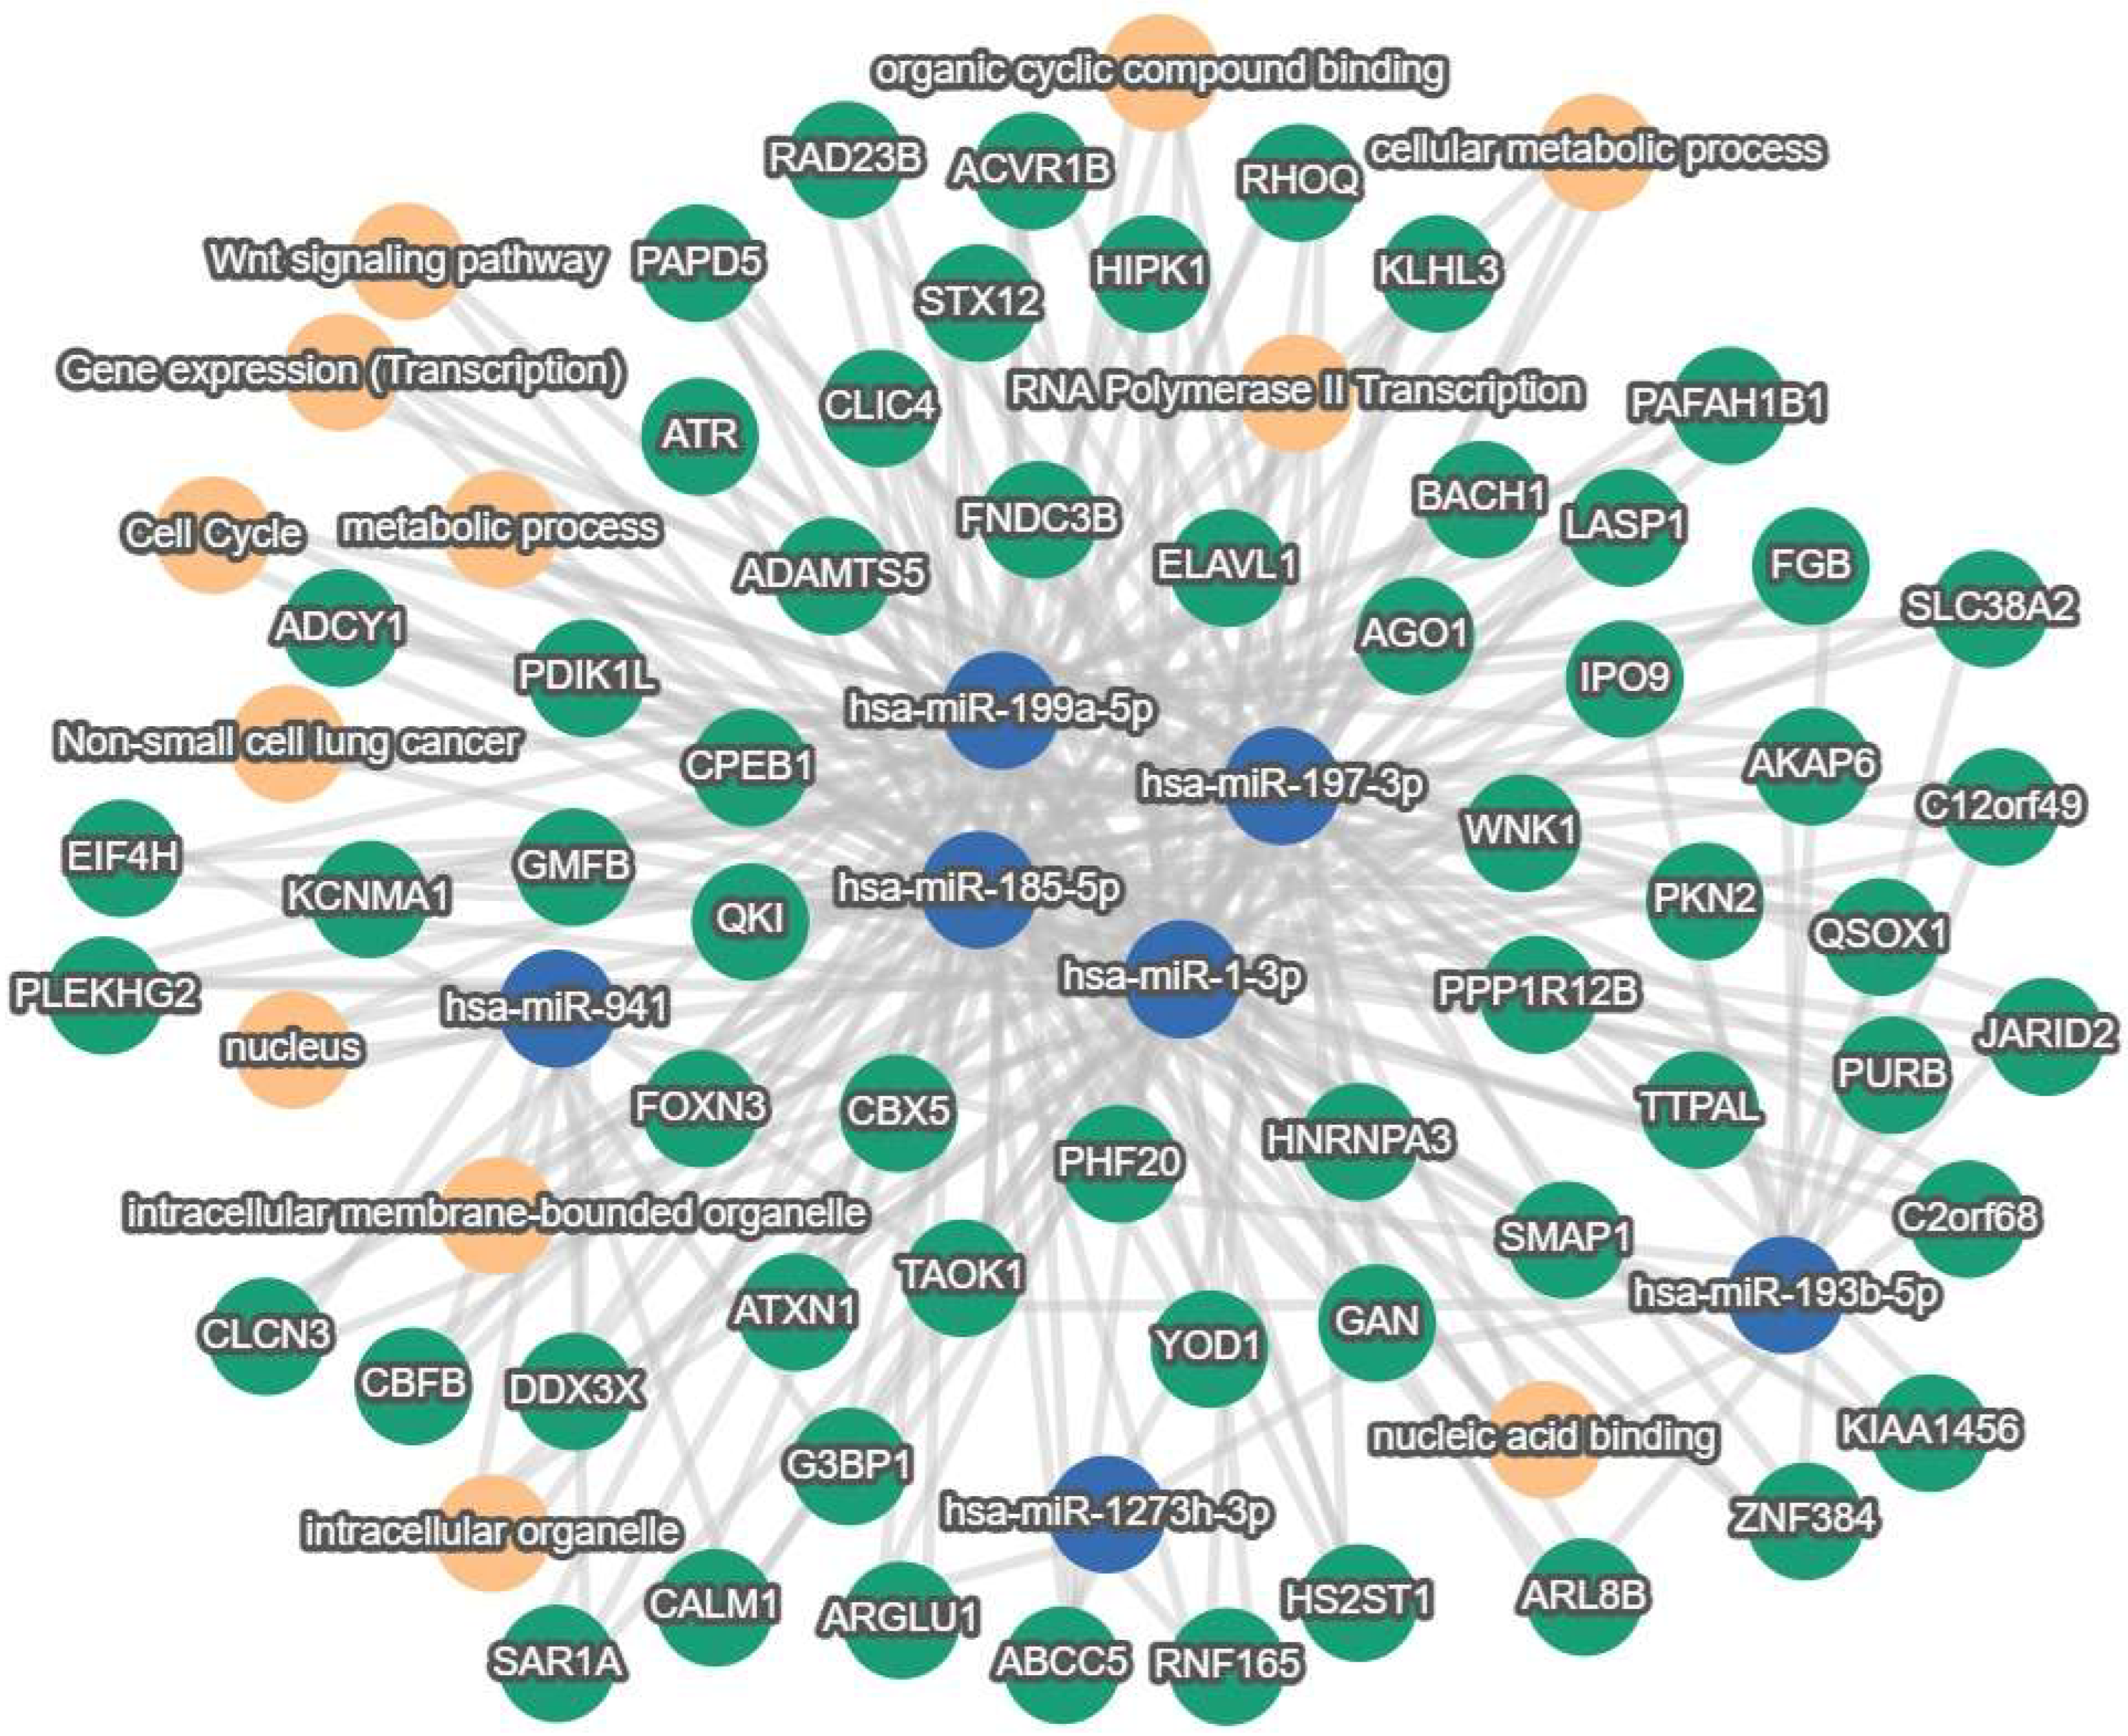
3.2.2. Pathway Visualization
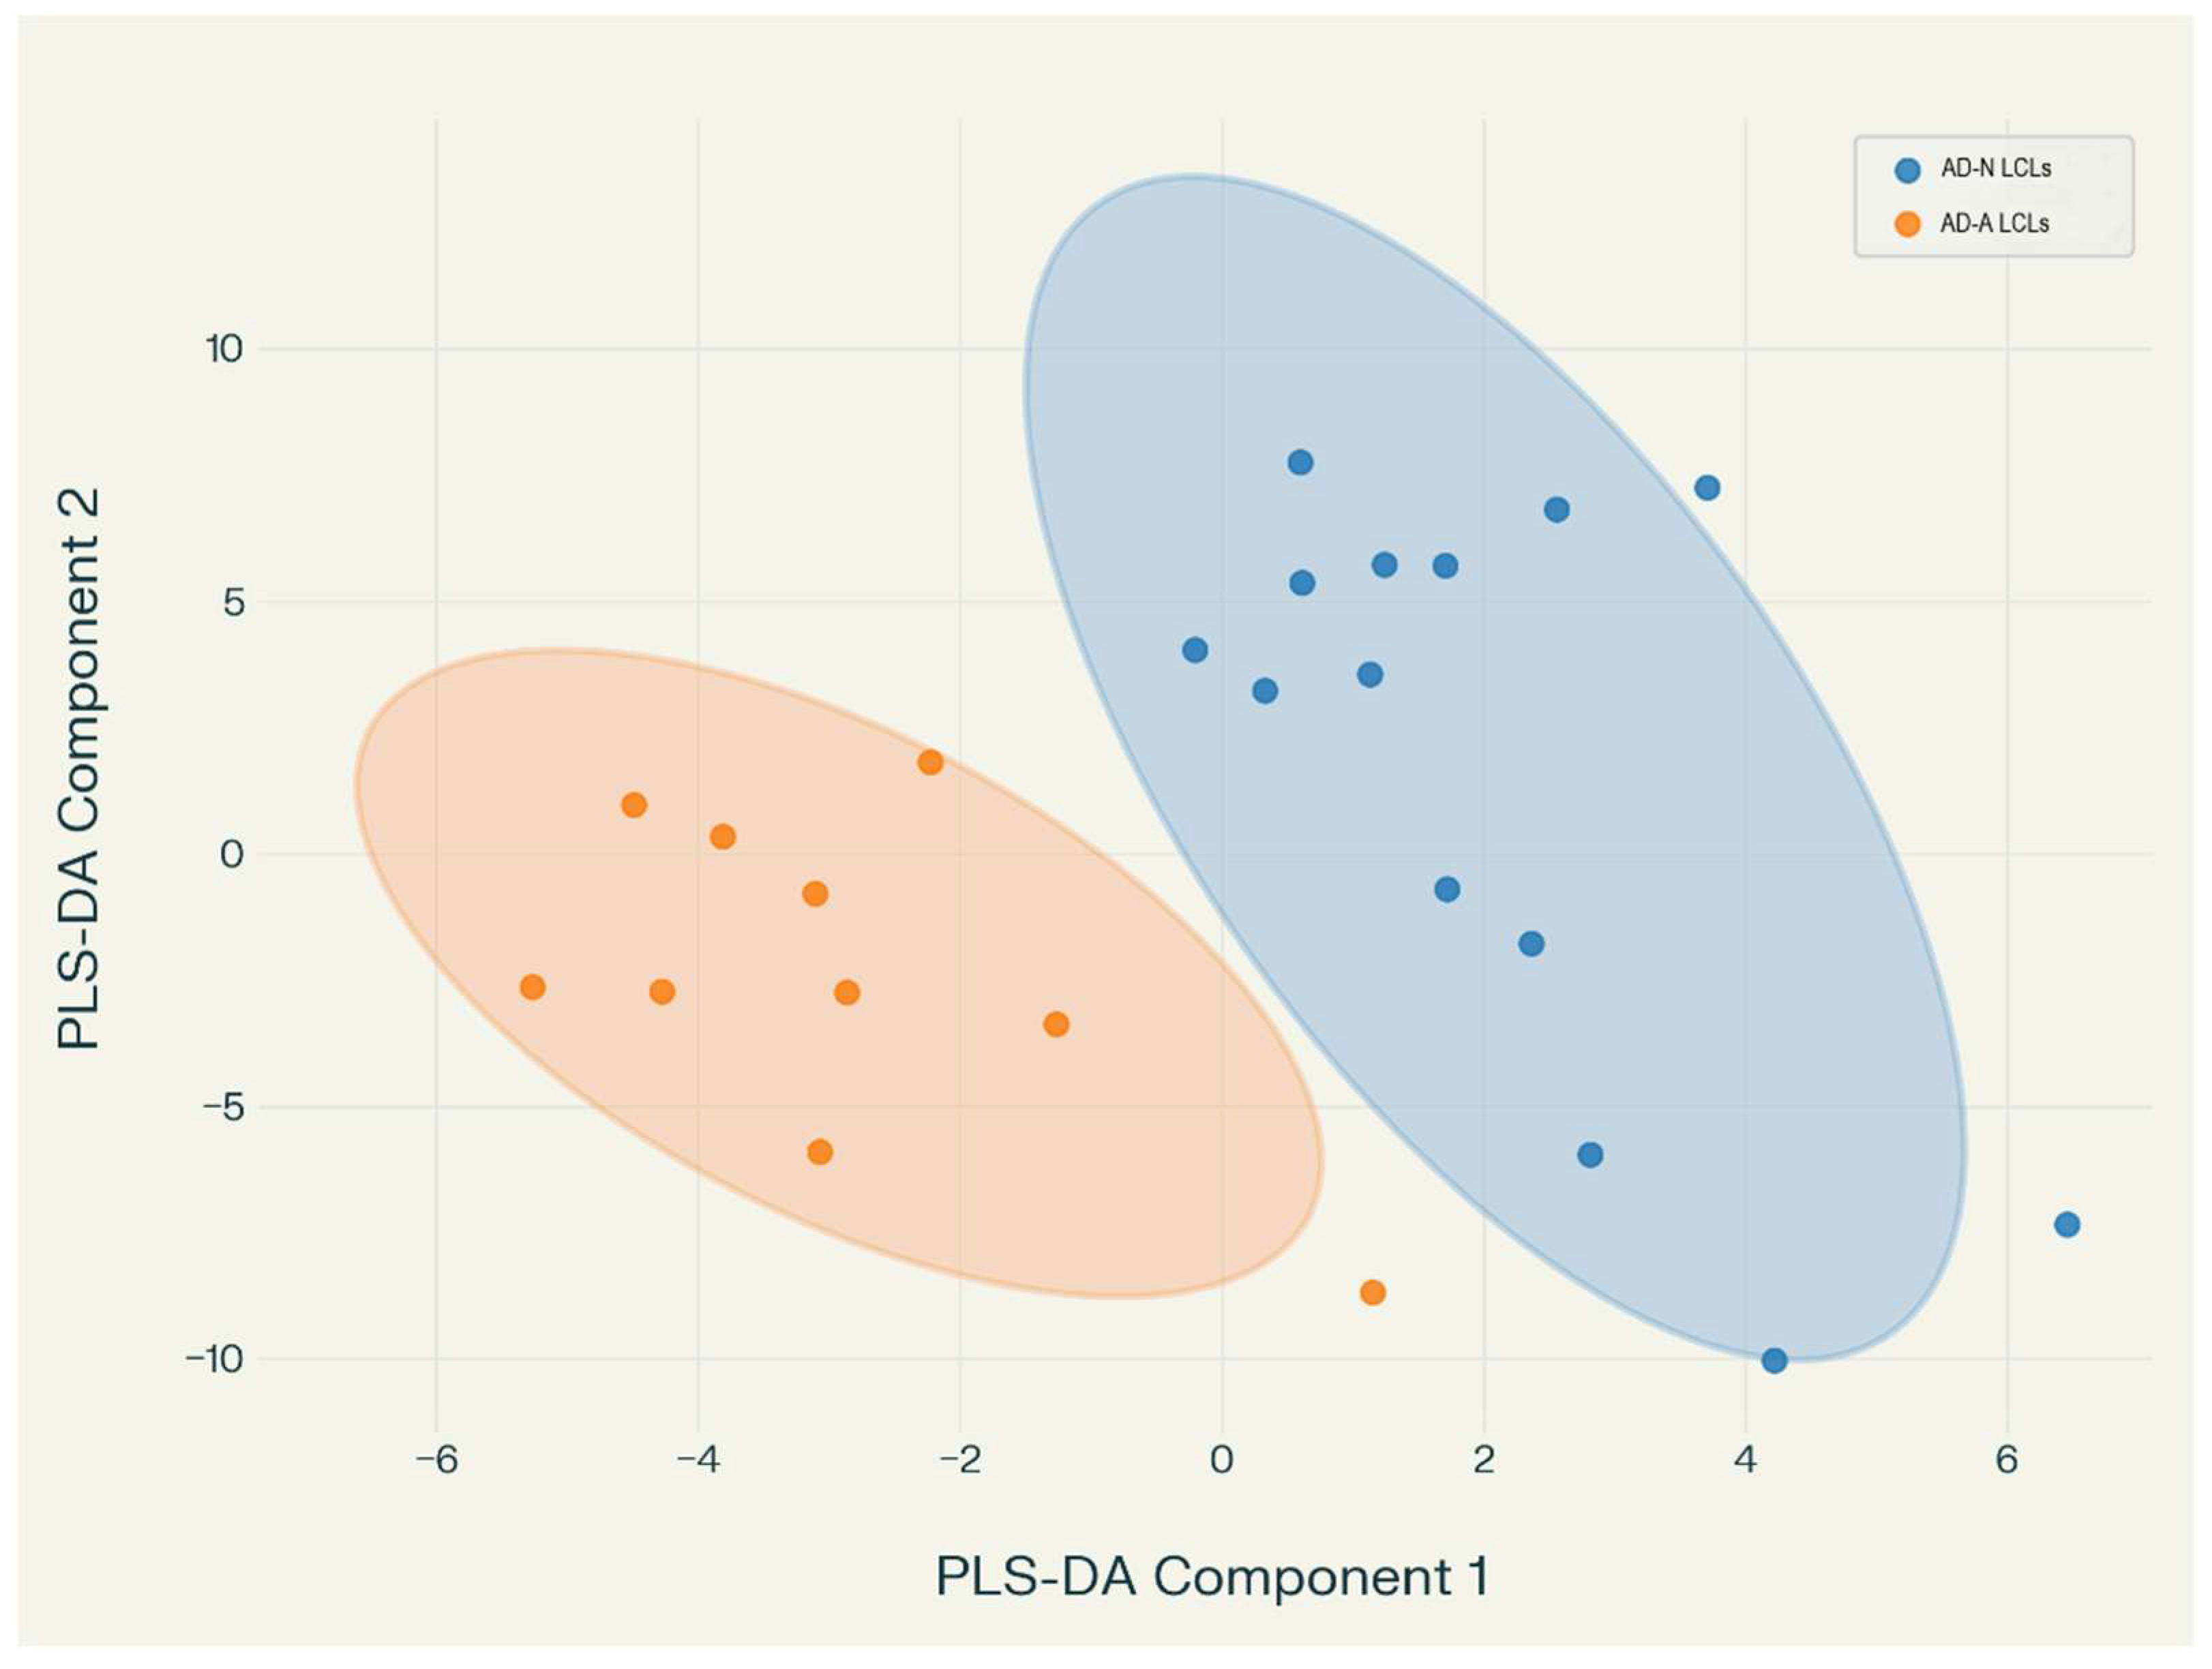
3.2.3. Discriminant Analysis
4. Discussion
5. Conclusions
Supplementary Materials
Author Contributions
Funding
Institutional Review Board Statement
Informed Consent Statement
Data Availability Statement
Conflicts of Interest
References
- APA. Diagnostic and Statistical Manual of Mental Disorders, 5th ed.; American Psychiatric Association: Washington, DC, USA, 2013. [Google Scholar]
- Shaw, K.A.; Williams, S.; Patrick, M.E.; Valencia-Prado, M.; Durkin, M.S.; Howerton, E.M.; Ladd-Acosta, C.M.; Pas, E.T.; Bakian, A.V.; Bartholomew, P.; et al. Prevalence and Early Identification of Autism Spectrum Disorder Among Children Aged 4 and 8 Years—Autism and Developmental Disabilities Monitoring Network, 16 Sites, United States, 2022. MMWR Surveill. Summ. 2025, 74, 1–22. [Google Scholar] [CrossRef]
- Frye, R.E. A Personalized Multidisciplinary Approach to Evaluating and Treating Autism Spectrum Disorder. J. Pers. Med. 2022, 12, 464. [Google Scholar] [CrossRef]
- Rose, S.; Niyazov, D.M.; Rossignol, D.A.; Goldenthal, M.; Kahler, S.G.; Frye, R.E. Clinical and Molecular Characteristics of Mitochondrial Dysfunction in Autism Spectrum Disorder. Mol. Diagn. Ther. 2018, 22, 571–593. [Google Scholar] [CrossRef]
- Niyazov, D.M.; Kahler, S.G.; Frye, R.E. Primary Mitochondrial Disease and Secondary Mitochondrial Dysfunction: Importance of Distinction for Diagnosis and Treatment. Mol. Syndromol. 2016, 7, 122–137. [Google Scholar] [CrossRef]
- Rossignol, D.A.; Frye, R.E. A review of research trends in physiological abnormalities in autism spectrum disorders: Immune dysregulation, inflammation, oxidative stress, mitochondrial dysfunction and environmental toxicant exposures. Mol. Psychiatry 2012, 17, 389–401. [Google Scholar] [CrossRef] [PubMed]
- Jensen, A.R.; Lane, A.L.; Werner, B.A.; McLees, S.E.; Fletcher, T.S.; Frye, R.E. Modern Biomarkers for Autism Spectrum Disorder: Future Directions. Mol. Diagn. Ther. 2022, 26, 483–495. [Google Scholar] [CrossRef] [PubMed]
- Frye, R.E.; Rincon, N.; McCarty, P.J.; Brister, D.; Scheck, A.C.; Rossignol, D.A. Biomarkers of mitochondrial dysfunction in autism spectrum disorder: A systematic review and meta-analysis. Neurobiol. Dis. 2024, 197, 106520. [Google Scholar] [CrossRef] [PubMed]
- Napoli, E.; Wong, S.; Hertz-Picciotto, I.; Giulivi, C. Deficits in bioenergetics and impaired immune response in granulocytes from children with autism. Pediatrics 2014, 133, e1405–e1410. [Google Scholar] [CrossRef]
- Giulivi, C.; Zhang, Y.F.; Omanska-Klusek, A.; Ross-Inta, C.; Wong, S.; Hertz-Picciotto, I.; Tassone, F.; Pessah, I.N. Mitochondrial dysfunction in autism. JAMA J. Am. Med. Assoc. 2010, 304, 2389–2396. [Google Scholar] [CrossRef]
- Rossignol, D.A.; Frye, R.E. Mitochondrial dysfunction in autism spectrum disorders: A systematic review and meta-analysis. Mol. Psychiatry 2012, 17, 290–314. [Google Scholar] [CrossRef]
- Bennuri, S.C.; Rose, S.; Frye, R.E. Mitochondrial Dysfunction Is Inducible in Lymphoblastoid Cell Lines from Children with Autism and May Involve the TORC1 Pathway. Front. Psychiatry 2019, 10, 269. [Google Scholar] [CrossRef]
- Gill, P.S.; Dweep, H.; Rose, S.; Wickramasinghe, P.J.; Vyas, K.K.; McCullough, S.; Porter-Gill, P.A.; Frye, R.E. Integrated microRNA-mRNA Expression Profiling Identifies Novel Targets and Networks Associated with Autism. J. Pers. Med. 2022, 12, 920. [Google Scholar] [CrossRef]
- Rose, S.; Bennuri, S.C.; Wynne, R.; Melnyk, S.; James, S.J.; Frye, R.E. Mitochondrial and redox abnormalities in autism lymphoblastoid cells: A sibling control study. FASEB J. 2017, 31, 904–909. [Google Scholar] [CrossRef]
- Dweep, H.; Gretz, N. miRWalk2.0: A comprehensive atlas of microRNA-target interactions. Nat. Methods 2015, 12, 697. [Google Scholar] [CrossRef] [PubMed]
- Dweep, H.; Gretz, N.; Felekkis, K. A schematic workflow for collecting information about the interaction between copy number variants and microRNAs using existing resources. Methods Mol. Biol. 2014, 1182, 307–320. [Google Scholar] [CrossRef] [PubMed]
- Papagregoriou, G.; Erguler, K.; Dweep, H.; Voskarides, K.; Koupepidou, P.; Athanasiou, Y.; Pierides, A.; Gretz, N.; Felekkis, K.N.; Deltas, C. A miR-1207-5p binding site polymorphism abolishes regulation of HBEGF and is associated with disease severity in CFHR5 nephropathy. PLoS ONE 2012, 7, e31021. [Google Scholar] [CrossRef] [PubMed][Green Version]
- Kern, F.; Aparicio-Puerta, E.; Li, Y.; Fehlmann, T.; Kehl, T.; Wagner, V.; Ray, K.; Ludwig, N.; Lenhof, H.-P.; Meese, E.; et al. miRTargetLink 2.0—Interactive miRNA target gene and target pathway networks. Nucleic Acids Res. 2021, 49, W409–W416. [Google Scholar] [CrossRef] [PubMed]
- Rishik, S.; Hirsch, P.; Grandke, F.; Fehlmann, T.; Keller, A. miRNATissueAtlas 2025: An update to the uniformly processed and annotated human and mouse non-coding RNA tissue atlas. Nucleic Acids Res. 2025, 53, D129–D137. [Google Scholar] [CrossRef]
- Oliveira, M.S.; Rheinheimer, J.; Moehlecke, M.; Rodrigues, M.; Assmann, T.S.; Leitão, C.B.; Trindade, M.R.M.; Crispim, D.; de Souza, B.M. UCP2, IL18, and miR-133a-3p are dysregulated in subcutaneous adipose tissue of patients with obesity. Mol. Cell. Endocrinol. 2020, 509, 110805. [Google Scholar] [CrossRef]
- Hua, Y.T.; Xu, W.X.; Li, H.; Xia, M. Emerging roles of MiR-133a in human cancers. J. Cancer 2021, 12, 198–206. [Google Scholar] [CrossRef]
- Liang, Z.; Liu, Z.; Cheng, C.; Wang, H.; Deng, X.; Liu, J.; Liu, C.; Li, Y.; Fang, W. VPS33B interacts with NESG1 to modulate EGFR/PI3K/AKT/c-Myc/P53/miR-133a-3p signaling and induce 5-fluorouracil sensitivity in nasopharyngeal carcinoma. Cell Death Dis. 2019, 10, 305. [Google Scholar] [CrossRef]
- Tang, Y.; Pan, J.; Huang, S.; Peng, X.; Zou, X.; Luo, Y.; Ren, D.; Zhang, X.; Li, R.; He, P.; et al. Downregulation of miR-133a-3p promotes prostate cancer bone metastasis via activating PI3K/AKT signaling. J. Exp. Clin. Cancer Res. 2018, 37, 160. [Google Scholar] [CrossRef]
- Pala, E.; Denkçeken, T. Differentially expressed circulating miRNAs in postmenopausal osteoporosis: A meta-analysis. Biosci. Rep. 2019, 39, BSR20190667. [Google Scholar] [CrossRef] [PubMed]
- Li, Y.; Cai, X.; Guan, Y.; Wang, L.; Wang, S.; Li, Y.; Fu, Y.; Gao, X.; Su, G. Adiponectin Upregulates MiR-133a in Cardiac Hypertrophy through AMPK Activation and Reduced ERK1/2 Phosphorylation. PLoS ONE 2016, 11, e0148482. [Google Scholar] [CrossRef] [PubMed]
- Duca, R.B.; Massillo, C.; Farré, P.L.; Graña, K.D.; Moro, J.; Gardner, K.; Lacunza, E.; De Siervi, A. Hsa-miR-133a-3p, miR-1-3p, GOLPH3 and JUP combination results in a good biomarker to distinguish between prostate cancer and non-prostate cancer patients. Front. Oncol. 2022, 12, 997457. [Google Scholar] [CrossRef]
- Wang, D.-Y.; Gendoo, D.M.A.; Ben-David, Y.; Woodgett, J.R.; Zacksenhaus, E. A subgroup of microRNAs defines PTEN-deficient, triple-negative breast cancer patients with poorest prognosis and alterations in RB1, MYC, and Wnt signaling. Breast Cancer Res. 2019, 21, 18. [Google Scholar] [CrossRef]
- Zhang, L.F.; Xu, K.; Tang, B.W.; Zhang, W.; Yuan, W.; Yue, C.; Shi, L.; Mi, Y.Y.; Zuo, L.; Zhu, L.J. Association between SOD2 V16A variant and urological cancer risk. Aging 2020, 12, 825–843. [Google Scholar] [CrossRef] [PubMed]
- Marceca, G.P.; Nigita, G.; Calore, F.; Croce, C.M. MicroRNAs in Skeletal Muscle and Hints on Their Potential Role in Muscle Wasting During Cancer Cachexia. Front. Oncol. 2020, 10, 607196. [Google Scholar] [CrossRef]
- Maria, B.; Sophia, V.; Mikhail, L.; Maria, V.; Todosenko, N.; Larisa, L. miRNA Dysregulation of AGE/RAGE Pathway in Metabolic Syndrome: A Novel Analysis Strategy Utilizing miRNA-profiling Data. Gene Expr. 2025, 24, 191–208. [Google Scholar] [CrossRef]
- Ichikawa, R.; Kawasaki, R.; Iwata, A.; Otani, S.; Nishio, E.; Nomura, H.; Fujii, T. MicroRNA-126-3p suppresses HeLa cell proliferation, migration and invasion, and increases apoptosis via the PI3K/PDK1/AKT pathway. Oncol. Rep. 2020, 43, 1300–1308. [Google Scholar] [CrossRef]
- Pulito, C.; Vaccarella, S.; Palcau, A.C.; Ganci, F.; Brandi, R.; Frascolla, C.; Sacconi, A.; Canu, V.; Benedetti, A.; De Pascale, V.; et al. MicroRNA-mediated PTEN downregulation as a novel non-genetic mechanism of acquired resistance to PI3Kα inhibitors of head & neck squamous cell carcinoma. Drug Resist. Updates 2025, 81, 101251. [Google Scholar] [CrossRef]
- Cao, D.; Mikosz, A.M.; Ringsby, A.J.; Anderson, K.C.; Beatman, E.L.; Koike, K.; Petrache, I. MicroRNA-126-3p Inhibits Angiogenic Function of Human Lung Microvascular Endothelial Cells via LAT1 (L-Type Amino Acid Transporter 1)-Mediated mTOR (Mammalian Target of Rapamycin) Signaling. Arterioscler. Thromb. Vasc. Biol. 2020, 40, 1195–1206. [Google Scholar] [CrossRef]
- Zeng, N.; Huang, Y.Q.; Yan, Y.M.; Hu, Z.Q.; Zhang, Z.; Feng, J.X.; Guo, J.S.; Zhu, J.N.; Fu, Y.H.; Wang, X.P.; et al. Diverging targets mediate the pathological roleof miR-199a-5p and miR-199a-3p by promoting cardiac hypertrophy and fibrosis. Mol. Ther. Nucleic Acids 2021, 26, 1035–1050. [Google Scholar] [CrossRef] [PubMed]
- Wang, Y.; Dai, Y.X.; Wang, S.Q.; Qiu, M.K.; Quan, Z.W.; Liu, Y.B.; Ou, J.M. miR-199a-5p inhibits proliferation and induces apoptosis in hemangioma cells through targeting HIF1A. Int. J. Immunopathol. Pharmacol. 2018, 31, 394632017749357. [Google Scholar] [CrossRef] [PubMed]
- Fornari, F.; Milazzo, M.; Chieco, P.; Negrini, M.; Calin, G.A.; Grazi, G.L.; Pollutri, D.; Croce, C.M.; Bolondi, L.; Gramantieri, L. MiR-199a-3p Regulates mTOR and c-Met to Influence the Doxorubicin Sensitivity of Human Hepatocarcinoma Cells. Cancer Res. 2010, 70, 5184–5193. [Google Scholar] [CrossRef] [PubMed]
- Liang, C.Y.; Li, Z.Y.; Gan, T.Q.; Fang, Y.Y.; Gan, B.L.; Chen, W.J.; Dang, Y.W.; Shi, K.; Feng, Z.B.; Chen, G. Downregulation of hsa-microRNA-204-5p and identification of its potential regulatory network in non-small cell lung cancer: RT-qPCR, bioinformatic- and meta-analyses. Respir. Res. 2020, 21, 60. [Google Scholar] [CrossRef]
- Su, Y.; Lu, Y.; An, H.; Liu, J.; Ye, F.; Shen, J.; Ni, Z.; Huang, B.; Lin, J. MicroRNA-204-5p Inhibits Hepatocellular Carcinoma by Targeting the Regulator of G Protein Signaling 20. ACS Pharmacol. Transl. Sci. 2023, 6, 1817–1828. [Google Scholar] [CrossRef]
- Chen, X.; Yan, Z.; Liu, W.; Guo, L.; Xu, J.; Shi, L.; Yao, Y. Polymorphisms in miRNA Genes Targeting the AMPK Signaling Pathway are Associated with Cervical Cancer Susceptibility in a Han Chinese Population. Int. J. Gen. Med. 2024, 17, 4171–4188. [Google Scholar] [CrossRef]
- Zhang, Q.; Zhong, C.; Yan, Q.; Zeng, L.-h.; Gao, W.; Duan, S. miR-874: An Important Regulator in Human Diseases. Front. Cell Dev. Biol. 2022, 10, 784968. [Google Scholar] [CrossRef]
- Megiorni, F.; Colaiacovo, M.; Cialfi, S.; McDowell, H.P.; Guffanti, A.; Camero, S.; Felsani, A.; Losty, P.D.; Pizer, B.; Shukla, R.; et al. A sketch of known and novel MYCN-associated miRNA networks in neuroblastoma. Oncol. Rep. 2017, 38, 3–20. [Google Scholar] [CrossRef]
- Ahn, S.H.; Ahn, J.H.; Ryu, D.R.; Lee, J.; Cho, M.S.; Choi, Y.H. Effect of Necrosis on the miRNA-mRNA Regulatory Network in CRT-MG Human Astroglioma Cells. Cancer Res. Treat. 2018, 50, 382–397. [Google Scholar] [CrossRef]
- Battaglia, C.; Venturin, M.; Sojic, A.; Jesuthasan, N.; Orro, A.; Spinelli, R.; Musicco, M.; De Bellis, G.; Adorni, F. Candidate Genes and MiRNAs Linked to the Inverse Relationship Between Cancer and Alzheimer’s Disease: Insights from Data Mining and Enrichment Analysis. Front. Genet. 2019, 10, 846. [Google Scholar] [CrossRef]
- Dubois-Deruy, E.; Cuvelliez, M.; Fiedler, J.; Charrier, H.; Mulder, P.; Hebbar, E.; Pfanne, A.; Beseme, O.; Chwastyniak, M.; Amouyel, P.; et al. MicroRNAs regulating superoxide dismutase 2 are new circulating biomarkers of heart failure. Sci. Rep. 2017, 7, 14747. [Google Scholar] [CrossRef]
- Li, C.; Hu, Z.; Lu, Z.; Wen, X. Cooperative Intersection with Misperception in Partially Connected and Automated Traffic. Sensors 2021, 21, 5003. [Google Scholar] [CrossRef]
- Ye, Y.; Li, S.L.; Wang, J.J. miR-100-5p Downregulates mTOR to Suppress the Proliferation, Migration, and Invasion of Prostate Cancer Cells. Front. Oncol. 2020, 10, 578948. [Google Scholar] [CrossRef]
- Cao, X.; Zhang, X.; Chen, J.; Sun, Q.; Sun, Y.; Lin, N.; Liu, X. miR-100-5p activation of the autophagy response through inhibiting the mTOR pathway and suppression of cerebral infarction progression in mice. Aging 2023, 15, 8315–8324. [Google Scholar] [CrossRef] [PubMed]
- Ye, Q.; Lee, C.; Shin, E.; Lee, S.-J. Influence of Redox Imbalances on the Transposition of Insertion Sequences in Deinococcus geothermalis. Antioxidants 2021, 10, 1623. [Google Scholar] [CrossRef] [PubMed]
- Shen, Z.L.; Wang, B.; Jiang, K.W.; Ye, C.X.; Cheng, C.; Yan, Y.C.; Zhang, J.Z.; Yang, Y.; Gao, Z.D.; Ye, Y.J.; et al. Downregulation of miR-199b is associated with distant metastasis in colorectal cancer via activation of SIRT1 and inhibition of CREB/KISS1 signaling. Oncotarget 2016, 7, 35092–35105. [Google Scholar] [CrossRef] [PubMed]
- Zhao, N.; Xiong, Q.; Li, P.; Chen, G.; Xiao, H.; Wu, C. TSC complex decrease the expression of mTOR by regulated miR-199b-3p. Sci. Rep. 2025, 15, 1892. [Google Scholar] [CrossRef]
- Ma, L.N.; Wu, L.N.; Liu, S.W.; Zhang, X.; Luo, X.; Nawaz, S.; Ma, Z.M.; Ding, X.C. miR-199a/b-3p inhibits HCC cell proliferation and invasion through a novel compensatory signaling pathway DJ-1\Ras\PI3K/AKT. Sci. Rep. 2024, 14, 224. [Google Scholar] [CrossRef]
- Vlachos, I.S.; Zagganas, K.; Paraskevopoulou, M.D.; Georgakilas, G.; Karagkouni, D.; Vergoulis, T.; Dalamagas, T.; Hatzigeorgiou, A.G. DIANA-miRPath v3.0: Deciphering microRNA function with experimental support. Nucleic Acids Res. 2015, 43, W460–W466. [Google Scholar] [CrossRef]
- Wang, H.; Ferguson, G.D.; Pineda, V.V.; Cundiff, P.E.; Storm, D.R. Overexpression of type-1 adenylyl cyclase in mouse forebrain enhances recognition memory and LTP. Nat. Neurosci. 2004, 7, 635–642. [Google Scholar] [CrossRef]
- Liu, X.; Bennison, S.A.; Robinson, L.; Toyo-Oka, K. Responsible Genes for Neuronal Migration in the Chromosome 17p13.3: Beyond Pafah1b1(Lis1), Crk and Ywhae(14-3-3ε). Brain Sci. 2021, 12, 56. [Google Scholar] [CrossRef]
- Fan, J.; Fong, T.; Chen, X.; Chen, C.; Luo, P.; Xie, H. Glia maturation factor-β: A potential therapeutic target in neurodegeneration and neuroinflammation. Neuropsychiatr. Dis. Treat. 2018, 14, 495–504. [Google Scholar] [CrossRef] [PubMed]
- Meredith, A.L. BK Channelopathies and KCNMA1-Linked Disease Models. Annu. Rev. Physiol. 2024, 86, 277–300. [Google Scholar] [CrossRef]
- Tanaka, E.; Fukuda, H.; Nakashima, K.; Tsuchiya, N.; Seimiya, H.; Nakagama, H. HnRNP A3 binds to and protects mammalian telomeric repeats in vitro. Biochem. Biophys. Res. Commun. 2007, 358, 608–614. [Google Scholar] [CrossRef] [PubMed]
- Cianfrocco, M.A.; DeSantis, M.E.; Leschziner, A.E.; Reck-Peterson, S.L. Mechanism and regulation of cytoplasmic dynein. Annu. Rev. Cell Dev. Biol. 2015, 31, 83–108. [Google Scholar] [CrossRef] [PubMed]
- Polyanskaya, S.A.; Moreno, R.Y.; Lu, B.; Feng, R.; Yao, Y.; Irani, S.; Klingbeil, O.; Yang, Z.; Wei, Y.; Demerdash, O.E.; et al. SCP4-STK35/PDIK1L complex is a dual phospho-catalytic signaling dependency in acute myeloid leukemia. Cell Rep. 2022, 38, 110233. [Google Scholar] [CrossRef]
- Rammelt, C.; Bilen, B.; Zavolan, M.; Keller, W. PAPD5, a noncanonical poly(A) polymerase with an unusual RNA-binding motif. RNA 2011, 17, 1737–1746. [Google Scholar] [CrossRef]
- Lu, Y.; Wang, X.; Gu, Q.; Wang, J.; Sui, Y.; Wu, J.; Feng, J. Heterogeneous nuclear ribonucleoprotein A/B: An emerging group of cancer biomarkers and therapeutic targets. Cell Death Discov. 2022, 8, 337. [Google Scholar] [CrossRef]
- Neumann, D.P.; Goodall, G.J.; Gregory, P.A. The Quaking RNA-binding proteins as regulators of cell differentiation. Wiley Interdiscip. Rev. RNA 2022, 13, e1724. [Google Scholar] [CrossRef]
- Wutikeli, H.; Xie, T.; Xiong, W.; Shen, Y. ELAV/Hu RNA-binding protein family: Key regulators in neurological disorders, cancer, and other diseases. RNA Biol. 2025, 22, 1–11. [Google Scholar] [CrossRef]
- Jiang, J.; Tang, Q.; Gong, J.; Jiang, W.; Chen, Y.; Zhou, Q.; Aldeen, A.; Wang, S.; Li, C.; Lv, W.; et al. Radiosensitizer EXO-miR-197-3p Inhibits Nasopharyngeal Carcinoma Progression and Radioresistance by Regulating the AKT/mTOR Axis and HSPA5-mediated Autophagy. Int. J. Biol. Sci. 2022, 18, 1878–1895. [Google Scholar] [CrossRef]
- Akkaya-Ulum, Y.Z.; Akbaba, T.H.; Tavukcuoglu, Z.; Chae, J.J.; Yilmaz, E.; Ozen, S.; Balci-Peynircioglu, B. Familial Mediterranean fever-related miR-197-3p targets IL1R1 gene and modulates inflammation in monocytes and synovial fibroblasts. Sci. Rep. 2021, 11, 685. [Google Scholar] [CrossRef]
- Babaeenezhad, E.; Naghibalhossaini, F.; Rajabibazl, M.; Jangravi, Z.; Hadipour Moradi, F.; Fattahi, M.D.; Hoheisel, J.D.; Sarabi, M.M.; Shahryarhesami, S. The Roles of microRNA miR-185 in Digestive Tract Cancers. Non-Coding RNA 2022, 8, 67. [Google Scholar] [CrossRef]
- Jiang, L.; He, C.; Zhang, X.; Chen, Y.; Li, G. MiR-193b-5p inhibits proliferation and enhances radio-sensitivity by downregulating the AKT/mTOR signaling pathway in tongue cancer. Transl. Cancer Res. 2020, 9, 1851–1860. [Google Scholar] [CrossRef] [PubMed]
- Tang, W.; Rao, Y.; Pi, L.; Li, J. A review on the role of MiR-193a-5p in oncogenesis and tumor progression. Front. Oncol. 2025, 15, 1543215. [Google Scholar] [CrossRef] [PubMed]
- Yu, X.; Wang, X.; Xu, F.; Zhang, X.; Wang, M.; Zhou, R.; Sun, Z.; Pan, X.; Feng, L.; Zhang, W.; et al. Mir-615-3p promotes osteosarcoma progression via the SESN2/AMPK/mTOR pathway. Cancer Cell Int. 2024, 24, 411. [Google Scholar] [CrossRef]
- Yan, T.; Ooi, W.F.; Qamra, A.; Cheung, A.; Ma, D.; Sundaram, G.M.; Xu, C.; Xing, M.; Poon, L.; Wang, J.; et al. HoxC5 and miR-615-3p target newly evolved genomic regions to repress hTERT and inhibit tumorigenesis. Nat. Commun. 2018, 9, 100. [Google Scholar] [CrossRef] [PubMed]
- Fingar, D.C.; Richardson, C.J.; Tee, A.R.; Cheatham, L.; Tsou, C.; Blenis, J. mTOR controls cell cycle progression through its cell growth effectors S6K1 and 4E-BP1/eukaryotic translation initiation factor 4E. Mol. Cell. Biol. 2004, 24, 200–216. [Google Scholar] [CrossRef]
- de la Cruz López, K.G.; Toledo Guzmán, M.E.; Sánchez, E.O.; García Carrancá, A. mTORC1 as a Regulator of Mitochondrial Functions and a Therapeutic Target in Cancer. Front. Oncol. 2019, 9, 1373. [Google Scholar] [CrossRef]
- Saxton, R.A.; Sabatini, D.M. mTOR Signaling in Growth, Metabolism, and Disease. Cell 2017, 168, 960–976. [Google Scholar] [CrossRef] [PubMed]
- Hell, J.W. CaMKII: Claiming center stage in postsynaptic function and organization. Neuron 2014, 81, 249–265. [Google Scholar] [CrossRef] [PubMed]
- Fan, X.; Jin, W.Y.; Wang, Y.T. The NMDA receptor complex: A multifunctional machine at the glutamatergic synapse. Front. Cell. Neurosci. 2014, 8, 160. [Google Scholar] [CrossRef]
- Zhang, Y.; Matt, L.; Patriarchi, T.; Malik, Z.A.; Chowdhury, D.; Park, D.K.; Renieri, A.; Ames, J.B.; Hell, J.W. Capping of the N-terminus of PSD-95 by calmodulin triggers its postsynaptic release. EMBO J. 2014, 33, 1341–1353. [Google Scholar] [CrossRef] [PubMed]
- Marsili, L.; Suppa, A.; Di Stasio, F.; Belvisi, D.; Upadhyay, N.; Berardelli, I.; Pasquini, M.; Petrucci, S.; Ginevrino, M.; Fabbrini, G.; et al. BDNF and LTP-/LTD-like plasticity of the primary motor cortex in Gilles de la Tourette syndrome. Exp. Brain Res. 2017, 235, 841–850. [Google Scholar] [CrossRef] [PubMed]
- Laoutidis, Z.G.; Lekka, G.E.; Kioulos, K.T. Glutamatergic Agents as Add-On Medication for the Treatment of Obsessive-Compulsive Disorder: A Systematic Review and Meta-Analysis. J. Clin. Psychiatry 2016, 77, e1576–e1583. [Google Scholar] [CrossRef]
- Kury, S.; van Woerden, G.M.; Besnard, T.; Proietti Onori, M.; Latypova, X.; Towne, M.C.; Cho, M.T.; Prescott, T.E.; Ploeg, M.A.; Sanders, S.; et al. De Novo Mutations in Protein Kinase Genes CAMK2A and CAMK2B Cause Intellectual Disability. Am. J. Hum. Genet. 2017, 101, 768–788. [Google Scholar] [CrossRef]
- Stephenson, J.R.; Wang, X.; Perfitt, T.L.; Parrish, W.P.; Shonesy, B.C.; Marks, C.R.; Mortlock, D.P.; Nakagawa, T.; Sutcliffe, J.S.; Colbran, R.J. A Novel Human CAMK2A Mutation Disrupts Dendritic Morphology and Synaptic Transmission, and Causes ASD-Related Behaviors. J. Neurosci. Off. J. Soc. Neurosci. 2017, 37, 2216–2233. [Google Scholar] [CrossRef]
- Ludwig, N.; Leidinger, P.; Becker, K.; Backes, C.; Fehlmann, T.; Pallasch, C.; Rheinheimer, S.; Meder, B.; Stahler, C.; Meese, E.; et al. Distribution of miRNA expression across human tissues. Nucleic Acids Res. 2016, 44, 3865–3877. [Google Scholar] [CrossRef]
- Abu-Elneel, K.; Liu, T.; Gazzaniga, F.S.; Nishimura, Y.; Wall, D.P.; Geschwind, D.H.; Lao, K.; Kosik, K.S. Heterogeneous dysregulation of microRNAs across the autism spectrum. Neurogenetics 2008, 9, 153–161. [Google Scholar] [CrossRef]
- Mundalil Vasu, M.; Anitha, A.; Thanseem, I.; Suzuki, K.; Yamada, K.; Takahashi, T.; Wakuda, T.; Iwata, K.; Tsujii, M.; Sugiyama, T.; et al. Serum microRNA profiles in children with autism. Mol. Autism 2014, 5, 40. [Google Scholar] [CrossRef] [PubMed]
- Talebizadeh, Z.; Butler, M.G.; Theodoro, M.F. Feasibility and relevance of examining lymphoblastoid cell lines to study role of microRNAs in autism. Autism Res. 2008, 1, 240–250. [Google Scholar] [CrossRef]
- Hou, Y.; Fu, L.; Li, J.; Li, J.; Zhao, Y.; Luan, Y.; Liu, A.; Liu, H.; Li, X.; Zhao, S.; et al. Transcriptome Analysis of Potential miRNA Involved in Adipogenic Differentiation of C2C12 Myoblasts. Lipids 2018, 53, 375–386. [Google Scholar] [CrossRef]
- Zhu, J.; Wang, F.L.; Wang, H.B.; Dong, N.; Zhu, X.M.; Wu, Y.; Wang, Y.T.; Yao, Y.M. TNF-alpha mRNA is negatively regulated by microRNA-181a-5p in maturation of dendritic cells induced by high mobility group box-1 protein. Sci. Rep. 2017, 7, 12239. [Google Scholar] [CrossRef]
- Khandelwal, A.; Sharma, U.; Barwal, T.S.; Seam, R.K.; Gupta, M.; Rana, M.K.; Vasquez, K.M.; Jain, A. Circulating miR-320a Acts as a Tumor Suppressor and Prognostic Factor in Non-small Cell Lung Cancer. Front. Oncol. 2021, 11, 645475. [Google Scholar] [CrossRef] [PubMed]
- Sharma, A.; Mehan, S. Targeting PI3K-AKT/mTOR signaling in the prevention of autism. Neurochem. Int. 2021, 147, 105067. [Google Scholar] [CrossRef]
- Li, H.Y.; He, H.C.; Song, J.F.; Du, Y.F.; Guan, M.; Wu, C.Y. Bone marrow-derived mesenchymal stem cells repair severe acute pancreatitis by secreting miR-181a-5p to target PTEN/Akt/TGF-beta1 signaling. Cell. Signal. 2020, 66, 109436. [Google Scholar] [CrossRef]
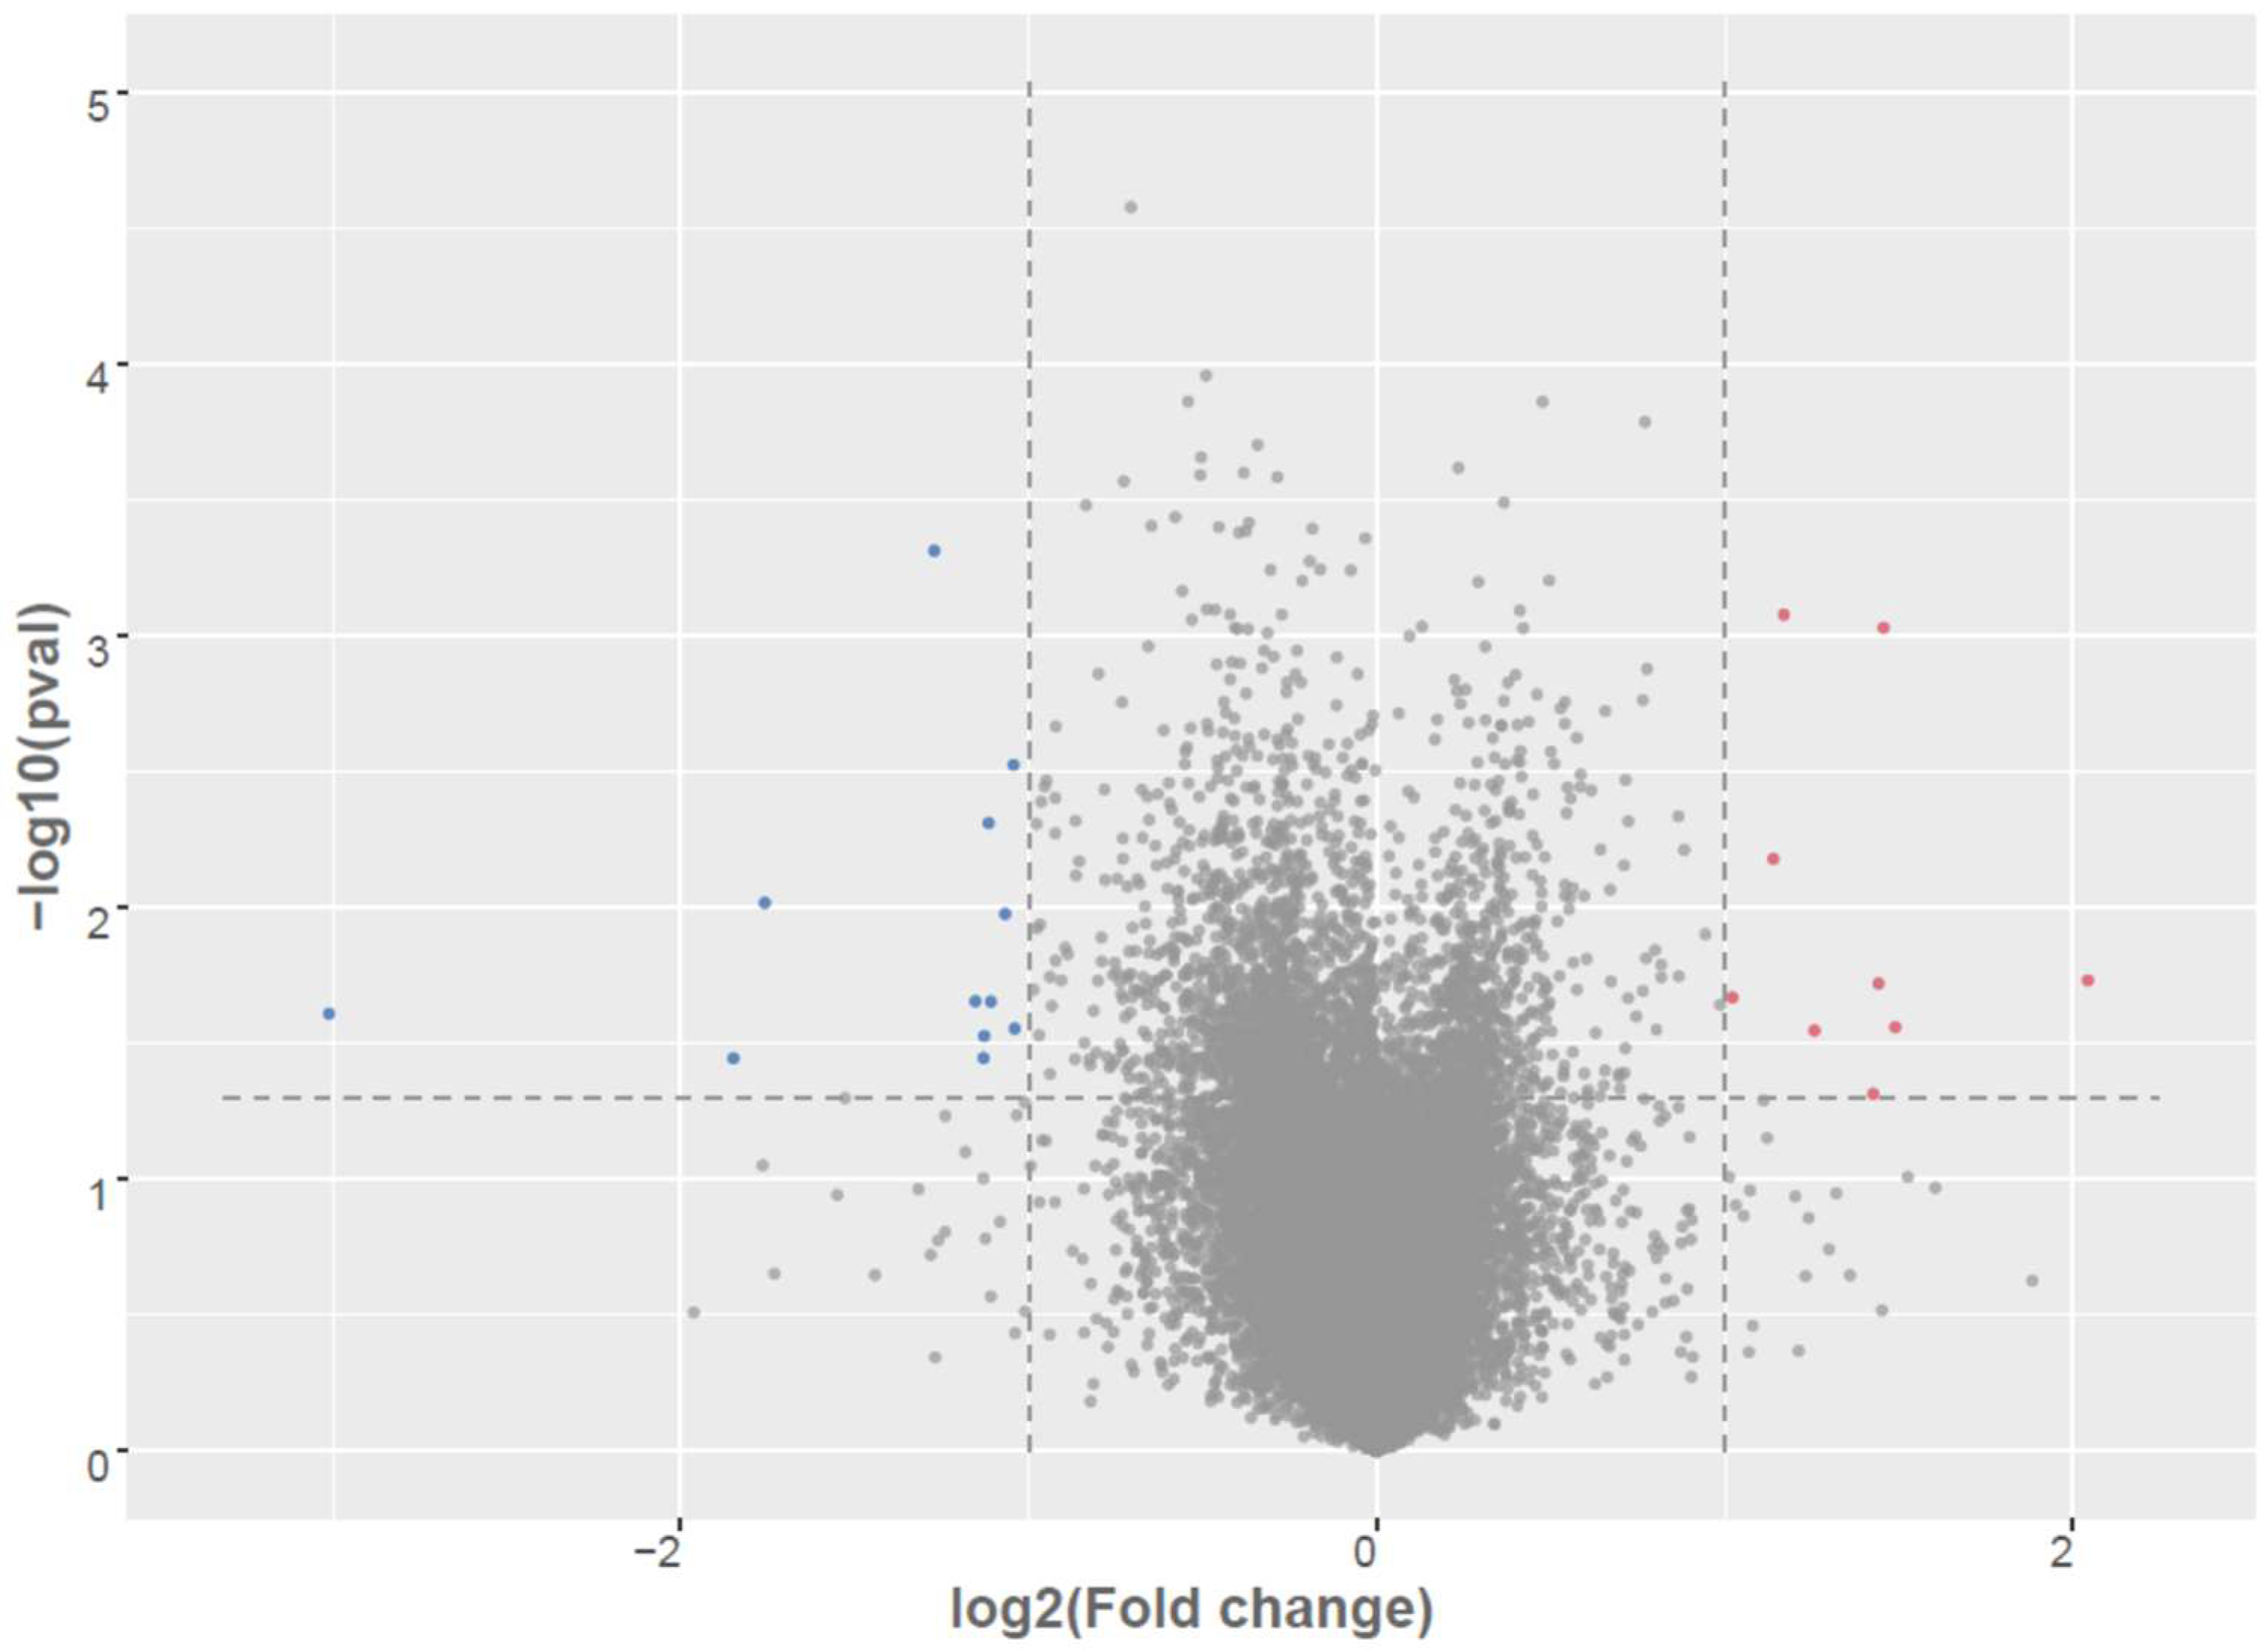
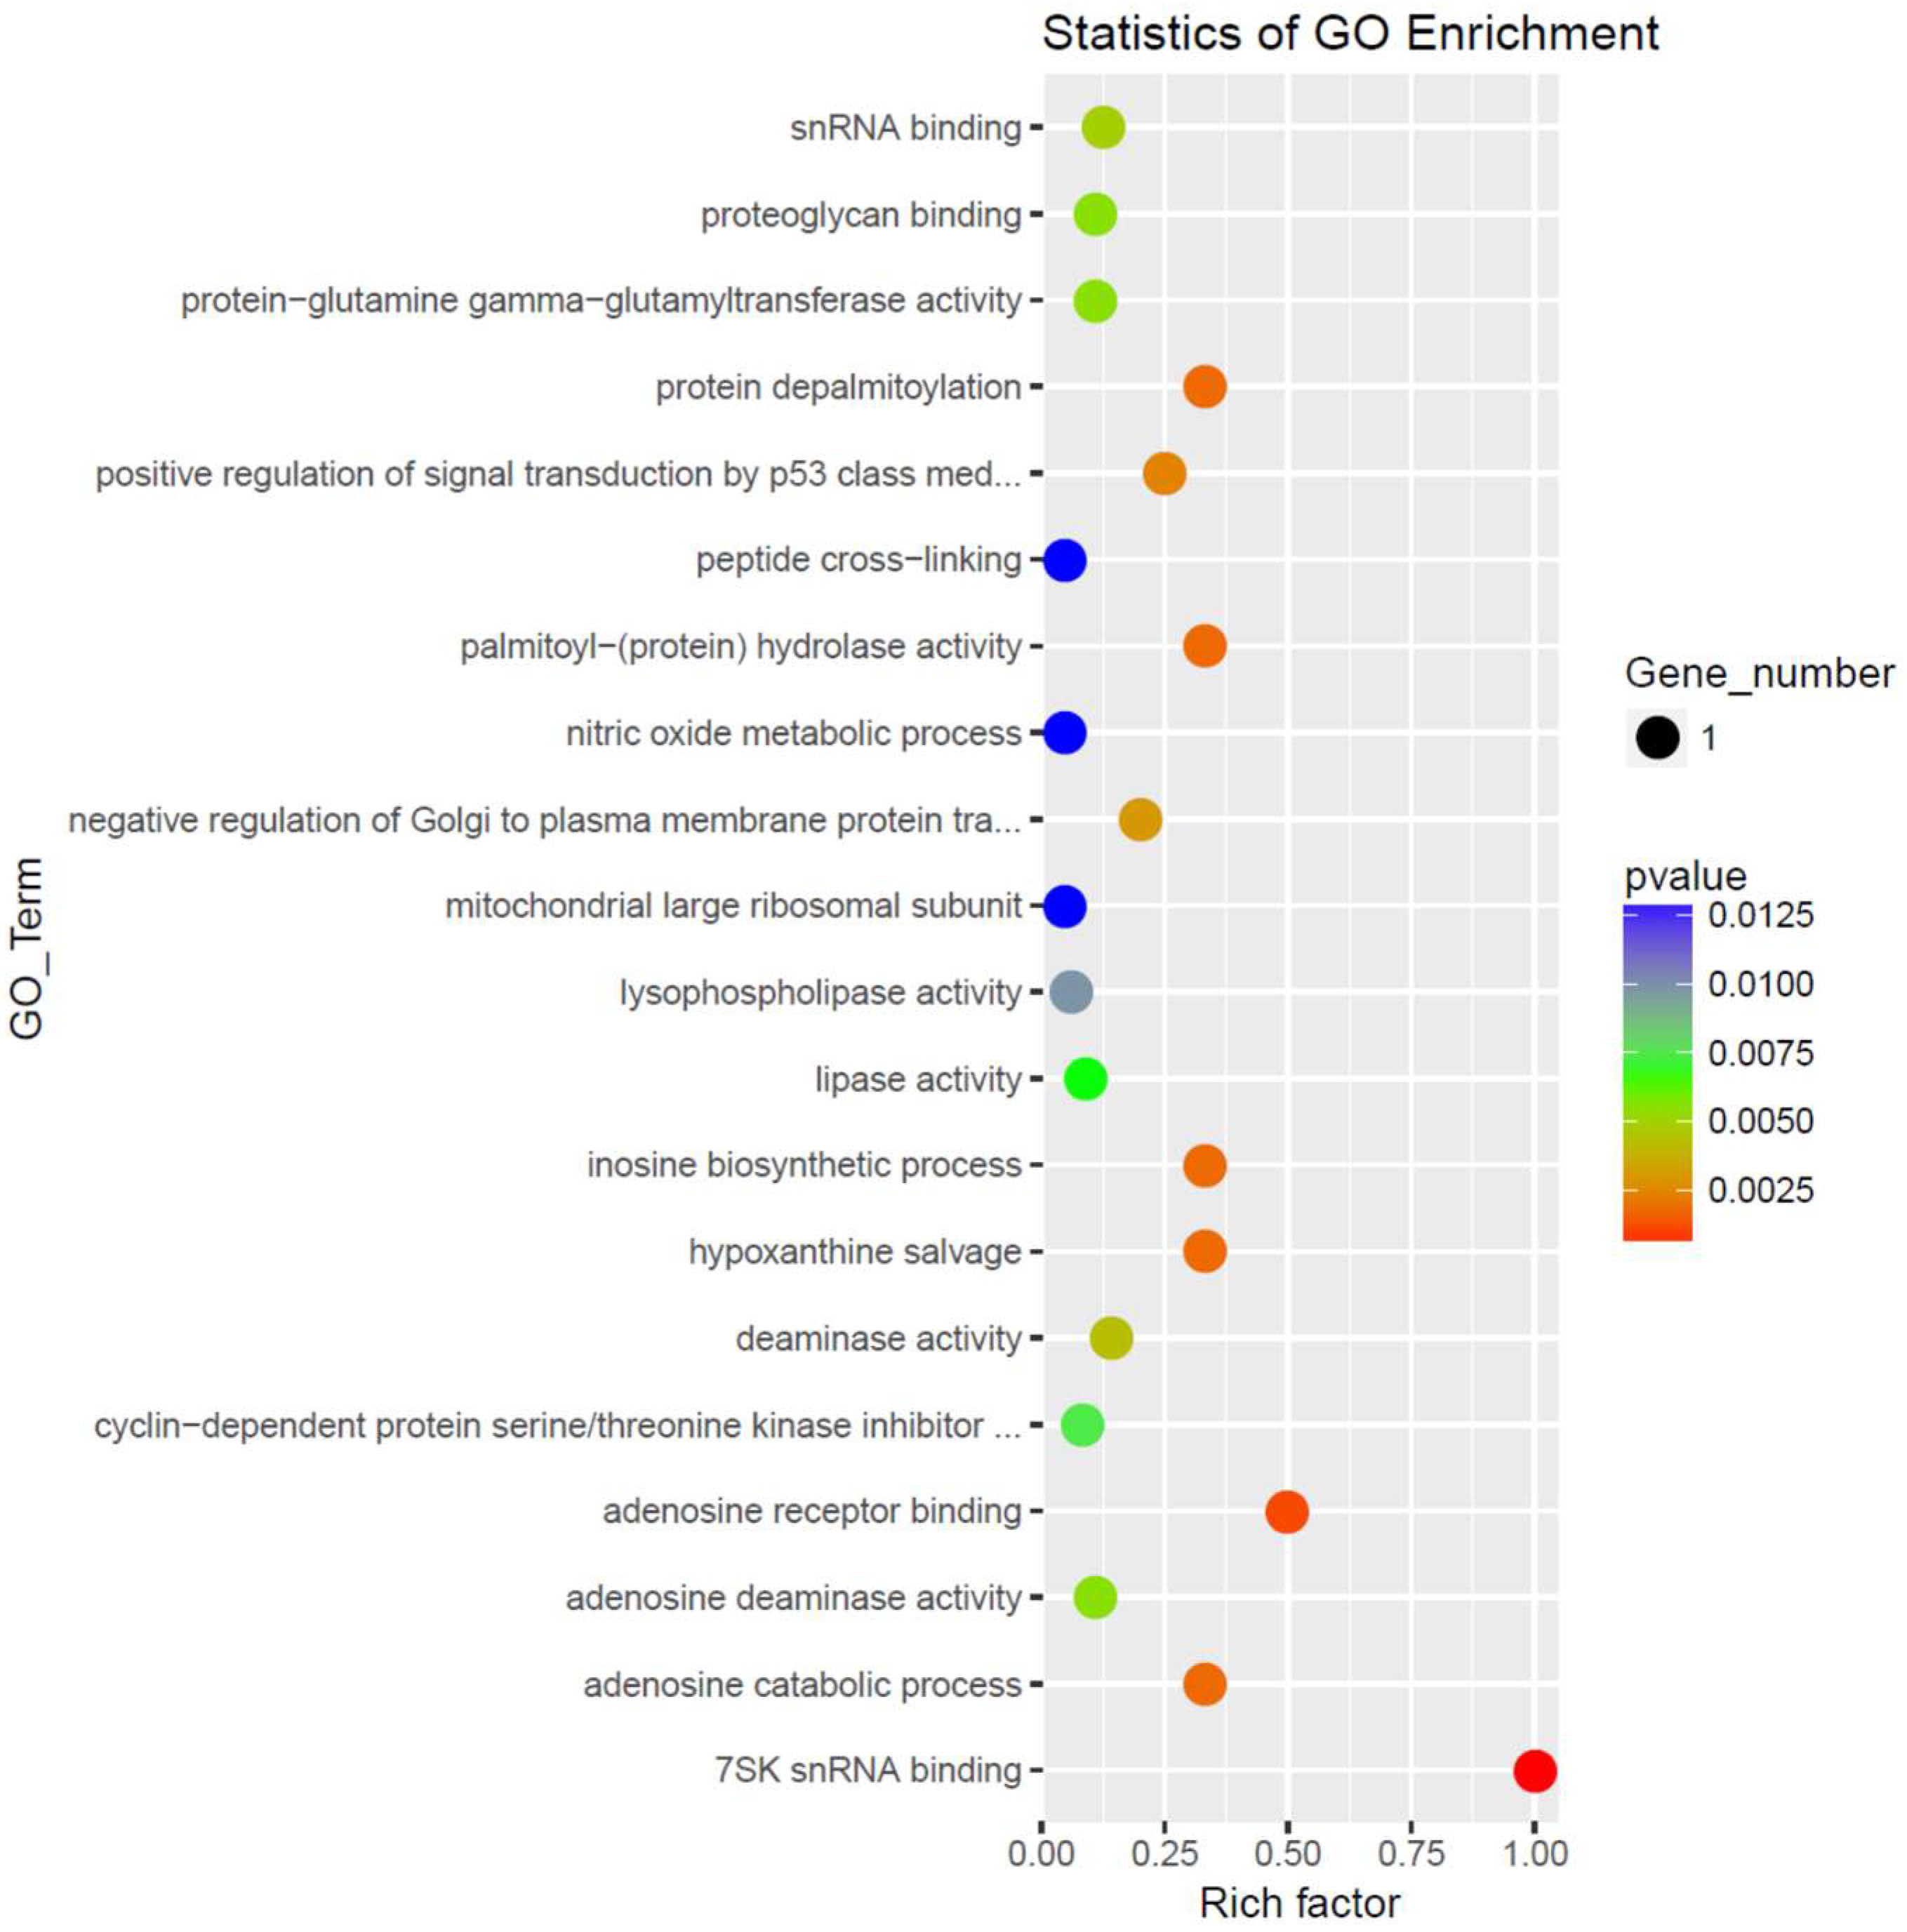
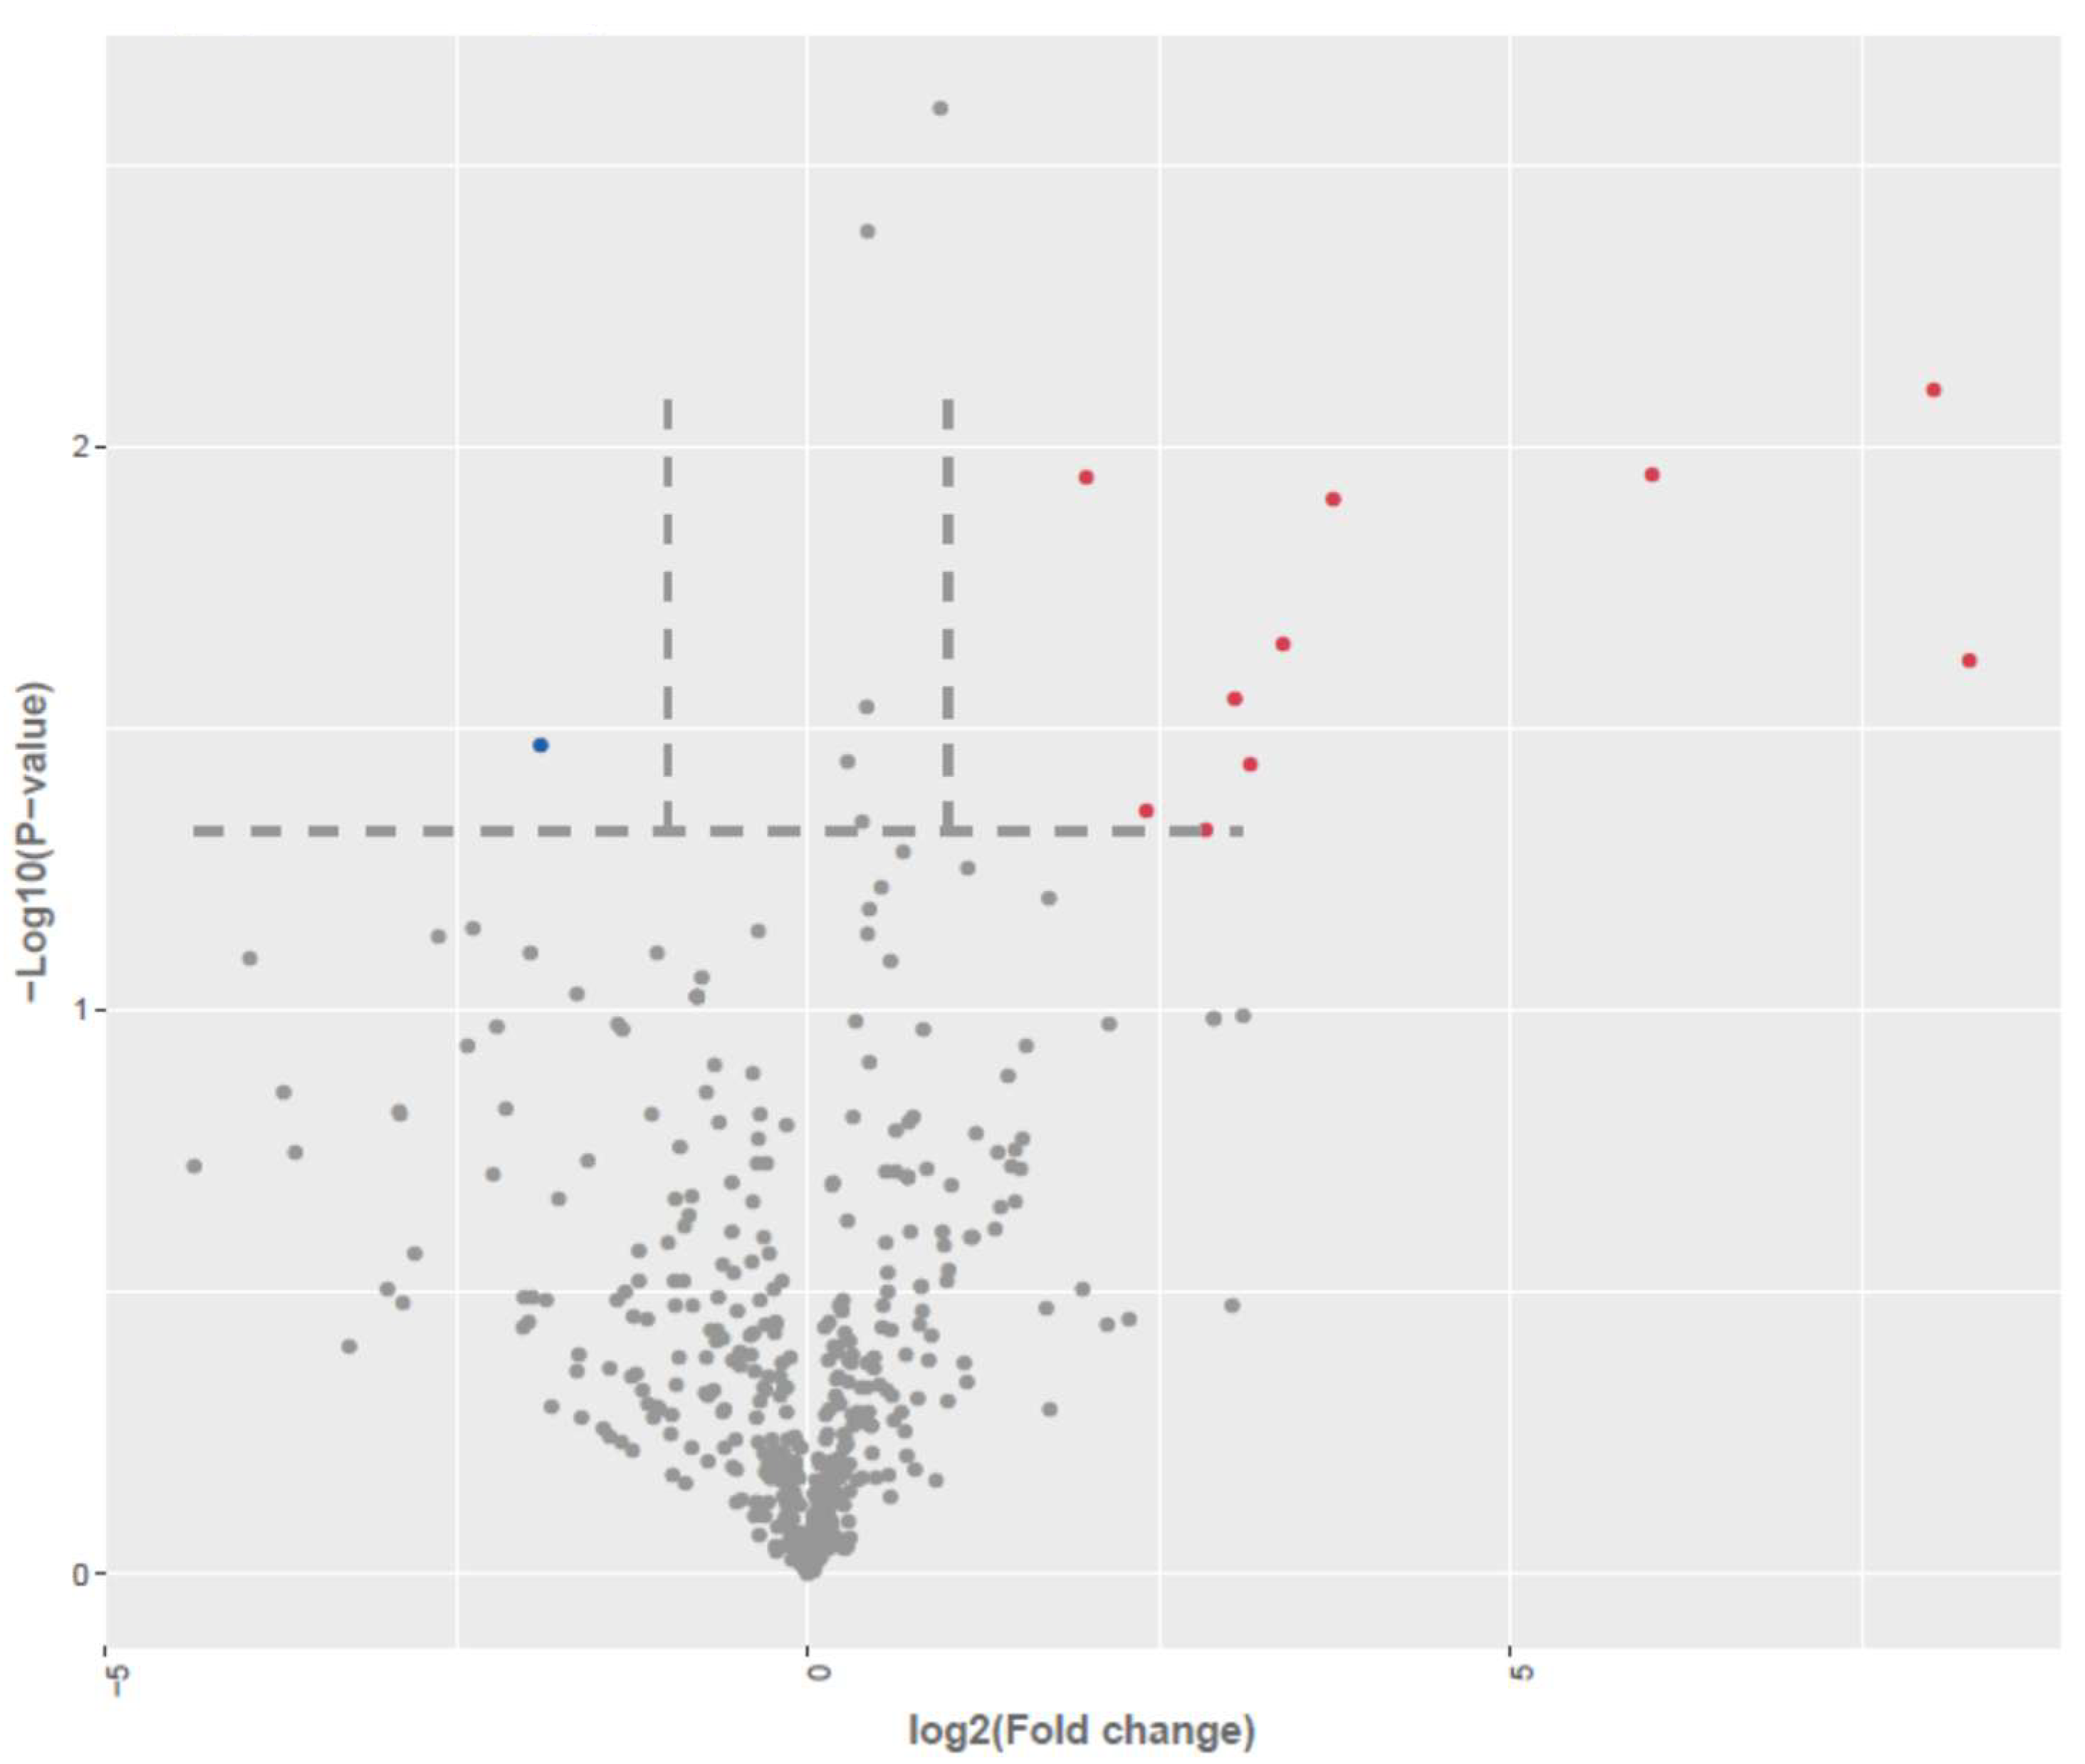
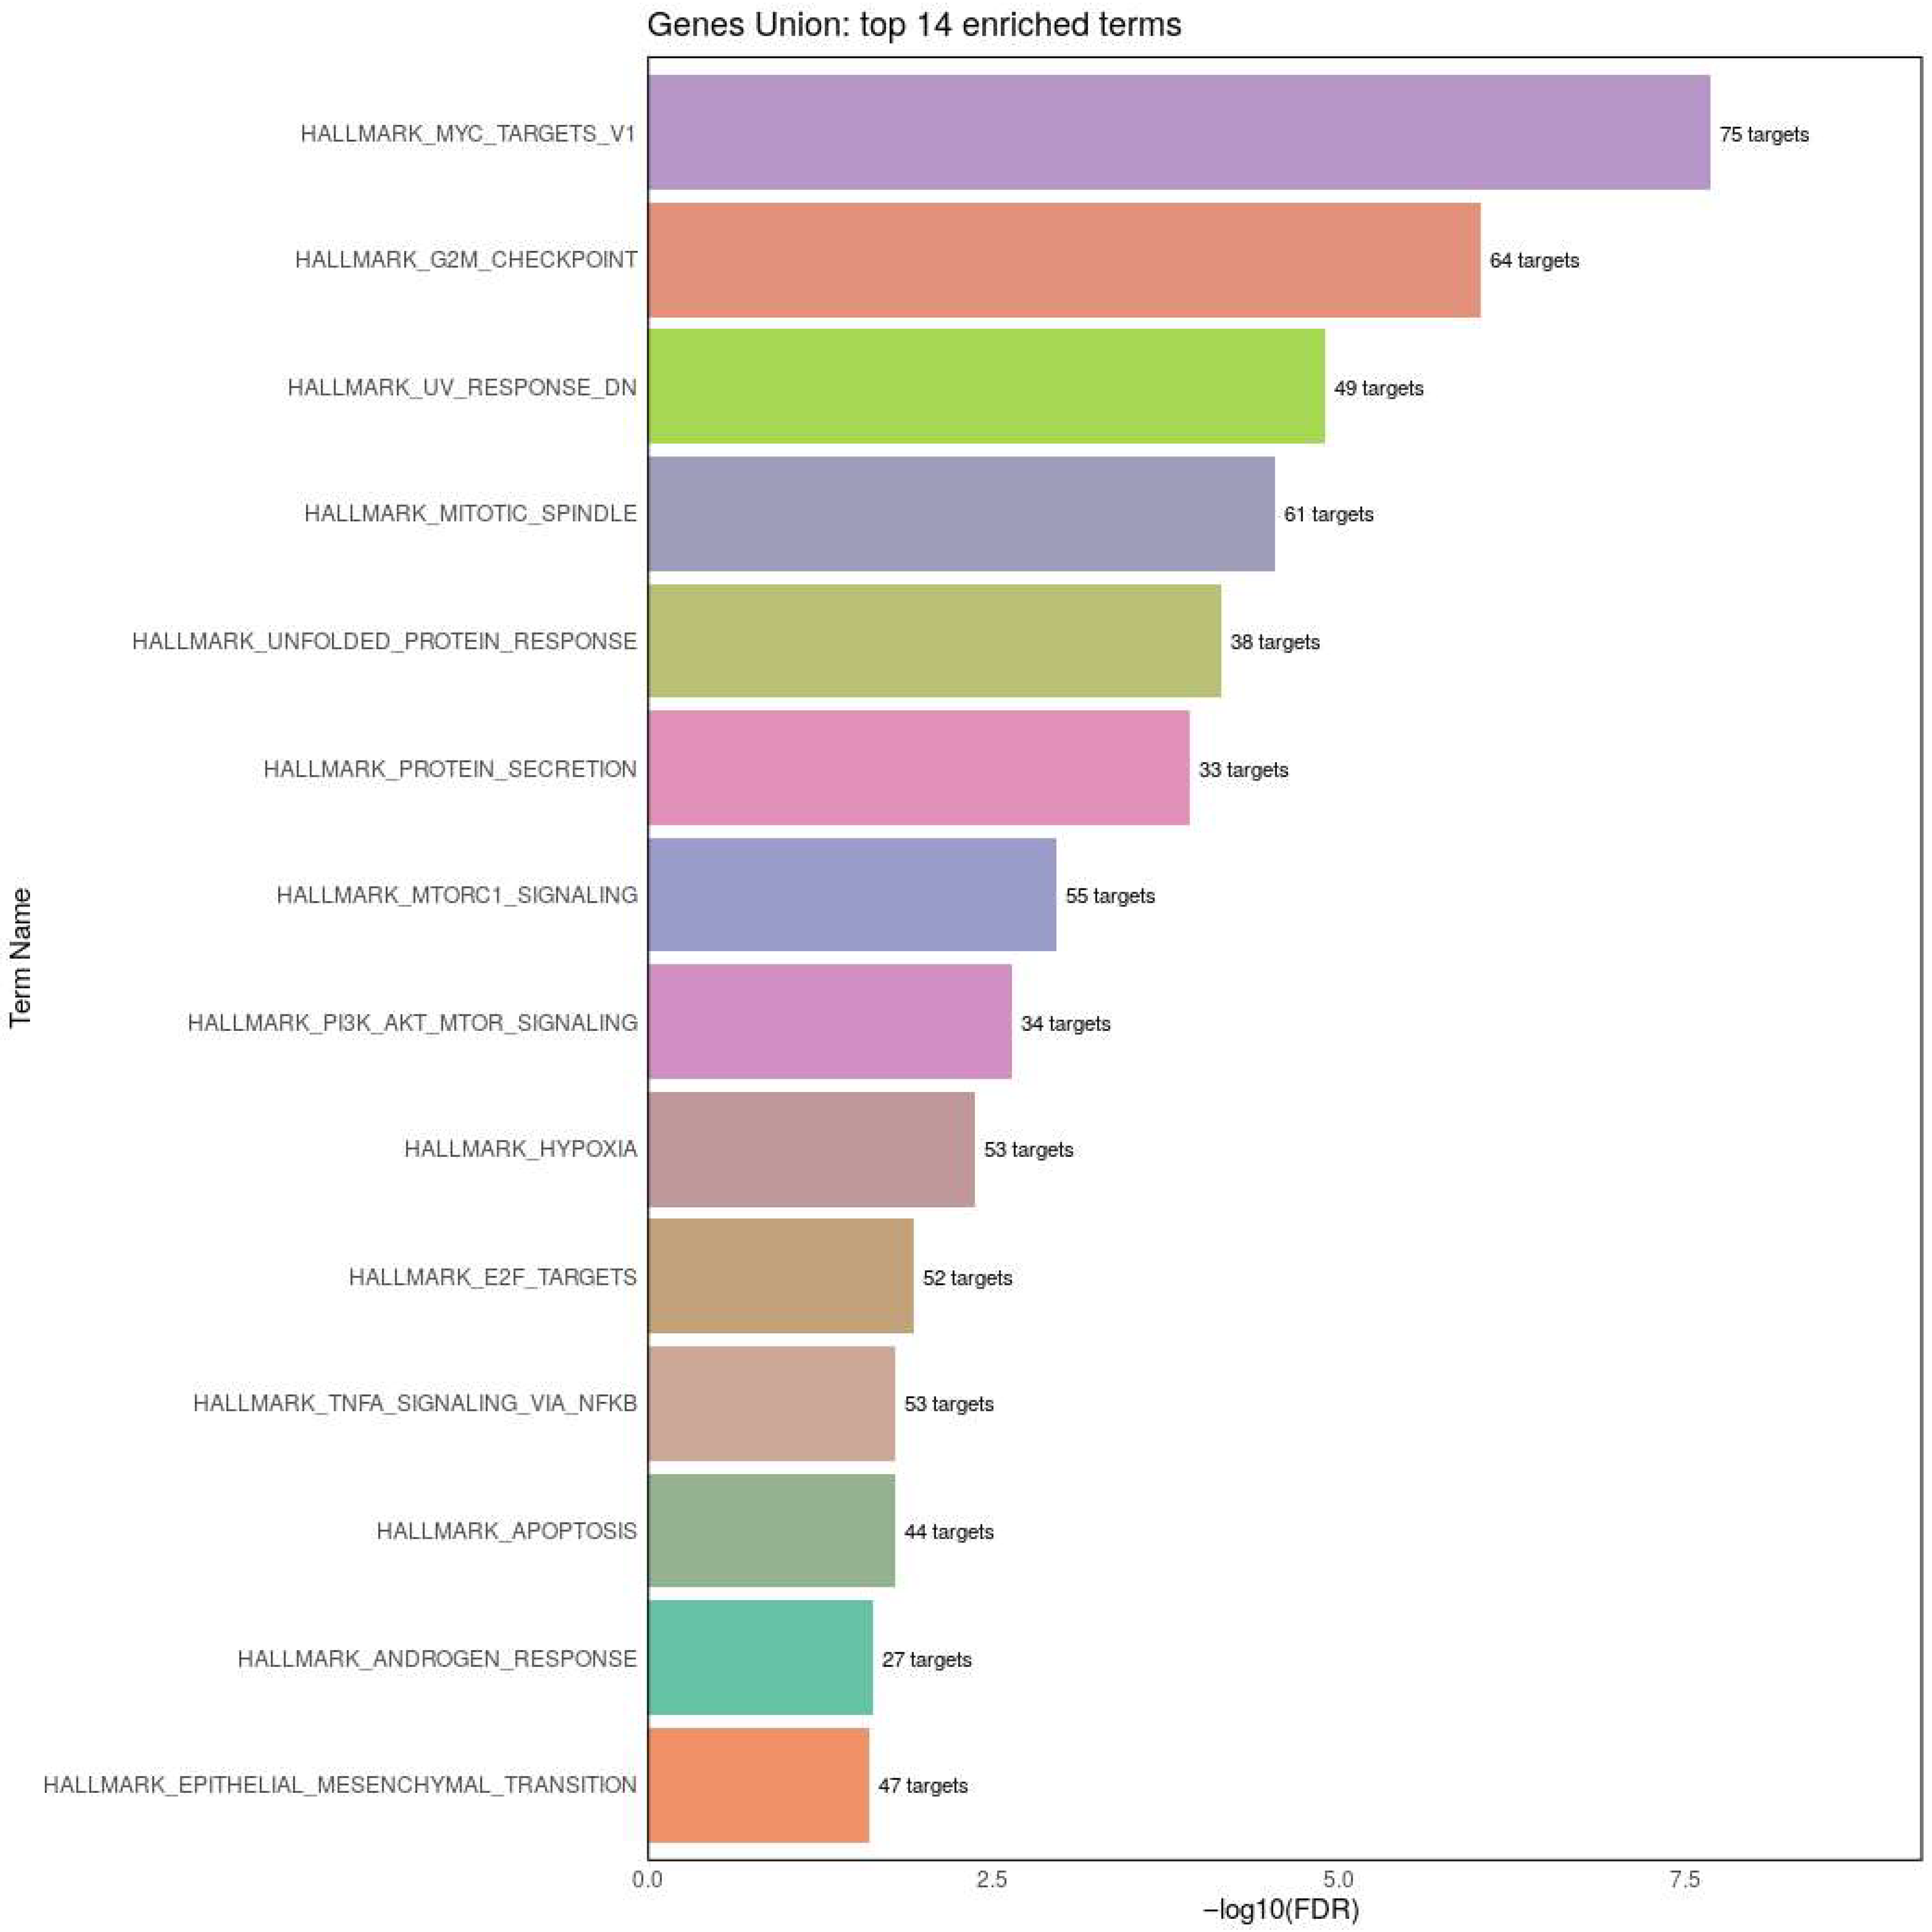

| Up Regulated in AD-N (LCLs from Children with Autism with Normal Mitochondrial Function). | |||
| mRNA | log2(FC) | −log10(p) | Gene Name |
| MRPL41 | 2.04 | 1.73 | Mitochondrial ribosomal protein l41 |
| HLA-DQA2 | 1.49 | 1.56 | Major histocompatibility complex, class ii, dq alpha-2 |
| GAPDHP1 | 1.46 | 3.03 | Glyceraldehyde-3-phosphate dehydrogenase pseudogene 1 |
| RPP25L | 1.44 | 1.72 | Ribonuclease P/MRP Subunit p25 |
| SNRPFP2 | 1.43 | 1.31 | Small nuclear ribonucleoprotein polypeptide F pseudogene 2 |
| HEXIM1 | 1.26 | 1.55 | Hexamethylene bis acetamide-inducible protein 1 |
| FRAT2 | 1.17 | 3.08 | Frequently rearranged in advanced t-cell lymphomas 2 |
| FAM110A | 1.14 | 2.18 | Family with sequence similarity 110 |
| PNMA1 | 1.11 | 1.29 | Paraneoplastic antigen ma1 |
| HMGA1 | 1.02 | 1.67 | High mobility group at-hook 1 |
| Down Regulated in AD-N (LCLs from Children with Autism with Normal Mitochondrial Function) | |||
| mRNAID | log2(FC) | −log10(p) | Gene Name |
| CTD-2287O16.1 | −3.01 | 1.61 | Pseudogene |
| CAB39 | −1.85 | 1.45 | Calcium-binding protein 39 |
| RP11-603J24.17 | −1.76 | 2.02 | Antisense gene |
| IFIT3 | −1.53 | 1.30 | Interferon-induced protein with tetratricopeptide repeats 3 |
| CECR1 | −1.27 | 3.31 | Adenosine deaminase 2 |
| DEPTOR | −1.15 | 1.65 | Dep domain-containing protein 6 |
| F13A1 | −1.13 | 1.45 | Factor xiii, a1 subunit |
| TCEAL8 | −1.13 | 1.53 | Transcription elongation factor a like 8 |
| LYPLA1 | −1.12 | 2.31 | Lysophospholipase i |
| IQUB | −1.11 | 1.65 | Iq motif- and ubiquitin domain-containing protein |
| FAM103A2P | −1.07 | 1.98 | RNA guanine-7 methyltransferase activating subunit like |
| DDX21 | −1.04 | 2.52 | Dexd-BOX HELICASE 21 |
| CHD3 | −1.04 | 1.55 | Chromodomain helicase dna-binding protein 3 |
| HIST2H2BE | −1.01 | 1.28 | Histone gene cluster 2, h2b histone family, member e |
| Gene | p-Value | GO Functional Process |
|---|---|---|
| Upregulated Pathways in ASD LCL with Normal Mitochondrial Function | ||
| Biological Process | ||
| Hexamethylene bis acetamide-inducible protein 1 | 0.002 | Positive regulation of signal transduction by p53 class mediator |
| 0.01 | Negative regulation of cyclin-dependent protein serine/threonine kinase activity | |
| Molecular function | ||
| 0.01 | Snrna binding | |
| 0.01 | Cyclin-dependent protein serine/threonine kinase inhibitor activity | |
| Biological Process | ||
| Mitochondrial ribosomal protein l41 | 0.05 | Mitochondrial translational termination |
| 0.05 | Mitochondrial translational elongation | |
| 0.05 | Mitochondrial translational initiation | |
| Cellular component | ||
| 0.01 | Mitochondrial large ribosomal subunit | |
| Mixed Regulation | ||
| 0.03 | Biological Process | |
| Frequently rearranged in advanced t-cell lymphomas 2 (up) | Multicellular organismal development | |
| Adenosine deaminase 2 (down) | ||
| Molecular Function | ||
| Dexd-BOX HELICASE 21 (down) | 0.03 | Poly(A) RNA binding |
| Mitochondrial ribosomal protein l41 (up) | ||
| Ribonuclease P/MRP Subunit p25 (up) | ||
| Down Regulated in ASD LCL with Normal Mitochondrial Function | ||
| Biological Process | ||
| Adenosine deaminase 2 | 0.001 | adenosine catabolic process |
| 0.001 | hypoxanthine salvage | |
| 0.001 | inosine biosynthetic process | |
| Molecular Function | ||
| 0.001 | Adenosine receptor binding | |
| 0.01 | Deaminase activity | |
| 0.01 | Proteoglycan binding | |
| 0.01 | Adenosine deaminase activity | |
| Biological Process | ||
| Dexd-BOX HELICASE 21 | 0.02 | Response to exogenous dsrna |
| 0.03 | RNA secondary structure unwinding | |
| Molecular Function | ||
| 0.00 | 7SK snrna binding | |
| 0.01 | Snorna binding | |
| 0.02 | rRNA binding | |
| 0.03 | Double-stranded RNA binding | |
| 0.04 | ATP-dependent RNA helicase activity | |
| 0.05 | Helicase activity | |
| Biological Process | ||
| Factor xiii, a1 subunit | 0.01 | Peptide cross-linking |
| 0.05 | Platelet degranulation | |
| 0.05 | Wound healing | |
| Cellular component | ||
| 0.03 | Platelet alpha granule lumen | |
| Molecular Function | ||
| 0.01 | Protein-glutamine γ-glutamyltransferase activity | |
| Biological Process | ||
| Lysophospholipase I | 0.00 | Protein depalmitoylation |
| 0.00 | Negative regulation of Golgi to plasma membrane protein transport | |
| 0.01 | Nitric oxide metabolic process | |
| 0.01 | Regulation of nitric-oxide synthase activity | |
| 0.04 | Fatty acid metabolic process | |
| Molecular Function | ||
| 0.00 | Palmitoyl-(protein) hydrolase activity | |
| 0.01 | Lipase activity | |
| 0.01 | Lysophospholipase activity | |
| Up Regulated in AD-N (LCLs from Children with Autism with Normal Mitochondrial Function) | ||||
|---|---|---|---|---|
| miRNA ID | log2(FC) | −log10(p) | Predicted | mTOR Pathway |
| hsa-miR-133a-3p | 8.27 | 1.62 | UCP2 [20,21], AKT1 [21,22,23], PTEN [21] | mTOR [21] AMPK [24,25] |
| hsa-miR-1-3p | 8.02 | 2.10 | UCP2 [20,26], PTEN [27], MFN2 [27], AKT1 [26], SOD2 [28], SIRT1 [29], PPARGC1A [29] | |
| hsa-miR-126-3p | 6.01 | 1.95 | HIF1A, PPARGC1A, SIRT1, SOD2 [30], AKT1 [31], PTEN [32] | mTOR [33] |
| hsa-miR-199a-5p | 3.74 | 1.91 | PTEN [27], SOD2 [34], HIF1A [35], MFN2, DNM1L, AUTS2, FMR1, IL27, CAMK2A, CAMKK2 | mTOR [36], TSC1, RHEB, AKT3, PIK3R3 |
| hsa-miR-204-5p | 3.38 | 1.65 | PTEN [37,38], DNM1L, SIRT3, HIF1A, CAMK2A | AKT1 [38] AKT3, PIK3R3 [39] |
| hsa-miR-874-5p | 3.15 | 1.43 | PTEN [40], CAMK2B, MFN2, AKT1S1, DNM1L, HIF1A, CREB1, PPARGC1A, | mTOR [41], TSC1/2, AKT2, PIK3CD [42] |
| hsa-miR-100-5p | 3.04 | 1.55 | PTEN [43], SOD2 [44], HIF1A [44,45], CREB1, | mTOR [46], PIK3CA [47] PIK3CB [47] |
| hsa-miR-941 | 1.34 | 1.54 | SOD2, PPARGC1A, HIF1A [48], PTEN [48] | TSC1, AKT2/3, PIK3R3, PIK3CA,B [48] |
| hsa-miR-769-5p | 1.22 | 1.44 | HIF1A, AUTS2 | AKT3 |
| hsa-miR-199b-3p | 2.83 | 1.32 | SIRT1 [49], HIF1A [49] | mTOR [50], AKT1 [51] |
Disclaimer/Publisher’s Note: The statements, opinions and data contained in all publications are solely those of the individual author(s) and contributor(s) and not of MDPI and/or the editor(s). MDPI and/or the editor(s) disclaim responsibility for any injury to people or property resulting from any ideas, methods, instructions or products referred to in the content. |
© 2025 by the authors. Licensee MDPI, Basel, Switzerland. This article is an open access article distributed under the terms and conditions of the Creative Commons Attribution (CC BY) license (https://creativecommons.org/licenses/by/4.0/).
Share and Cite
Frye, R.E.; Hill, Z.; Rose, S.; McCullough, S.; Porter-Gill, P.A.; Gill, P.S. Transcriptomic Signatures of Mitochondrial Dysfunction in Autism: Integrated mRNA and microRNA Profiling. Genes 2025, 16, 1065. https://doi.org/10.3390/genes16091065
Frye RE, Hill Z, Rose S, McCullough S, Porter-Gill PA, Gill PS. Transcriptomic Signatures of Mitochondrial Dysfunction in Autism: Integrated mRNA and microRNA Profiling. Genes. 2025; 16(9):1065. https://doi.org/10.3390/genes16091065
Chicago/Turabian StyleFrye, Richard E., Zoe Hill, Shannon Rose, Sandra McCullough, Patricia A. Porter-Gill, and Pritmohinder S. Gill. 2025. "Transcriptomic Signatures of Mitochondrial Dysfunction in Autism: Integrated mRNA and microRNA Profiling" Genes 16, no. 9: 1065. https://doi.org/10.3390/genes16091065
APA StyleFrye, R. E., Hill, Z., Rose, S., McCullough, S., Porter-Gill, P. A., & Gill, P. S. (2025). Transcriptomic Signatures of Mitochondrial Dysfunction in Autism: Integrated mRNA and microRNA Profiling. Genes, 16(9), 1065. https://doi.org/10.3390/genes16091065


