Abstract
Background: Siphonaria is a genus of false limpets belonging to the Gastropoda class. Only two species of this genus have been described with mitochondrial genomes. Moreover, the codon usage patterns and factors influencing them have not been studied. This study aims to expand the mitochondrial genome data of this genus and clarify the codon usage patterns. Methods: The complete mitochondrial genome of Siphonaria japonica was sequenced using next-generation sequencing. The gene arrangement and phylogenetic status were compared with Siphonaria gigas and Siphonaria pectinata. The codon usage bias of the three mitochondrial genomes was analyzed based on the relative synonymous codon usage (RSCU), the effective number of codons (ENC) plot, the parity rule 2 (PR2)-bias plot, and neutrality plot analyses. Results: The gene arrangement and maximum-likelihood phylogenetic tree support a close relationship between S. japonica and S. pectinata. The codon usage bias analysis indicated that the codon usage bias of mitochondrial PCGs in the three species was primarily influenced by natural selection. Conclusions: This study offers significant evolutionary insights into the phylogenetic relationships and molecular adaptation strategies among Siphonaria species.
1. Introduction
The false limpets of the genus Siphonaria G. B. Sowerby I, 1823 are a group of pulmonates living on intertidal rocks, exhibiting remarkable adaptations to the harsh and dynamic coastal environment. To date, 116 Siphonaria species have been described worldwide, showcasing their wide distribution across tropical and temperate marine ecosystems. However, only five species have been recorded in China, i.e., S. japonica, Siphonaria atra, Siphonaria sirius, Siphonaria petasus, and Siphonaria floslamellosa [1]. Early monographs described Siphonaria primarily based on shell morphology, which was considered a key diagnostic feature for species identification. However, significant variations in Siphonaria shell morphology have been observed at the species level [2], complicating traditional taxonomic classification. Furthermore, molecular phylogenetic studies have revealed that the characteristics of the reduced shell, often influenced by environmental factors, are insufficient for accurate species delimitation [3]. This highlights the limitations of relying solely on morphological traits in taxonomy. Integrative taxonomy, combining shell morphology and molecular data, could play a more crucial role in the precise delimitation of Siphonaria species [4,5].
Maternally inherited mitochondria possess a small genome and exhibit a rapid nucleotide substitution rate, which makes them particularly valuable as genetic markers for evolutionary and taxonomic studies [6]. Mitochondrial DNA (mtDNA) has become a cornerstone in molecular phylogenetics, enabling researchers to trace maternal lineages and assess species divergence with high resolution. Despite their utility, only two species from Siphonaria have been described with mitochondrial genomes, i.e., S. gigas [7] and S. pectinata [8]. These genomes have provided critical insights into the genetic relationships within Gastropoda. Phylogenetic studies on Siphonaria species have largely relied on partial sequences of mitochondrial genes such as COI, 12S rRNA, and 16S rRNA; however, the topology of some nodes was not well supported [1,2,3,4,9]. Comparative genomic analyses incorporating the mitochondrial genome have been widely applied to elucidate evolutionary divergence patterns in aquatic organisms [10]. With the development of high-throughput sequencing technology, the generation of additional Siphonaria mitochondrial genomes could significantly enhance the phylogenetic resolution, enabling more robust species delimitation and a deeper understanding of their evolutionary history.
Codon usage bias is a phenomenon wherein some synonymous codons are preferentially utilized over others during protein synthesis [11]. Significant variations in the use of synonymous codons have been observed among different organisms [10,12]. Codon usage bias plays a crucial regulatory role in various cellular processes, such as transcription efficiency, mRNA stability, and translation efficiency [13,14]. For instance, highly expressed genes often favor codons that match the most abundant tRNAs, optimizing the translational speed and reducing errors. The bias is influenced by multiple interacting factors, such as the nucleotide composition, mutation pressure, and natural selection [15,16]. Additionally, environmental stressors such as temperature and nutrient availability can further modulate the codon usage patterns. Therefore, investigating organismal codon usage bias provides valuable data for understanding genome architecture, deciphering species evolutionary relationships, and uncovering molecular mechanisms of environmental adaptation [17].
In this study, we newly sequenced and annotated the complete mitochondrial genome of S. japonica, aiming to enrich the mitochondrial data within this genus. Through bioinformatic analyses, we characterized key genomic features including the genome size, nucleotide composition, and the types of start/stop codons across protein-coding genes. Additionally, by integrating mitochondrial genomes from S. gigas and S. pectinata, the gene arrangement, phylogenetic relationship, and codon usage bias among the three species were analyzed. These multi-dimensional analyses not only expand our understanding of mitochondrial genome evolution in Siphonaria but also provide valuable genomic resources for future studies on marine gastropod biodiversity, phylogenetics, and molecular ecology.
2. Materials and Methods
2.1. Materials Studied
S. japonica was collected during low tide from the intertidal zone of Dachen Island, Taizhou City, Zhejiang Province, China (121°54′29.412″ E, 28°27′3.017″ N), in May 2024. Immediately after collection, live specimens were preserved in 75% ethanol and transported to the laboratory under dry ice conditions to maintain DNA integrity. One specimen showing the typical morphological characteristics of S. japonica was used for DNA extraction and mitochondrial genome sequencing. The mitochondrial genomes of S. gigas and S. pectinate were downloaded from GenBank of NCBI under accession numbers NC_016188 and NC_012383. The three mitochondrial genomes were used for phylogenetic and codon usage bias analyses.
2.2. Mitochondrial Genome Sequencing
Genomic DNA was extracted from the muscle of S. japonica using a DNeasy Blood & Tissue Kit (Qiagen, Hilden, Germany) following the manufacturer’s instructions. The purified DNA was then fragmented by sonication to an optimal size of approximately 250 bp. The fragmented DNA was subsequently sequenced on the DNBSEQ-T7 platform with the PE150 sequencing strategy, generating paired-end reads of 150 bp in length. After sequencing, the raw data were processed to remove low-quality reads and adapters using fastp v0.20.0 [18], resulting in a total of 5.48 Gb of high-quality clean data. To assemble the mitochondrial genome, a partial COI sequence (GenBank accession number PQ422951) was utilized as a seed sequence. The NOVOPlasty v4.3.1 assembler [19] was employed, leveraging the seed sequence to generate a contiguous and circular mitochondrial genome assembly. Samtools v1.7 [20] was utilized to calculate the sequencing depth per base, providing insights into the coverage uniformity across the assembled genome. The circular mitochondrial sequence was then annotated using MITOS2 v2.1.9 [21], which identified and annotated all protein-coding genes (PCGs), rRNA genes, and tRNA genes. To gain further insights into the base composition, the GC content and GC skew were calculated using a sliding window of 500 bp. Finally, the mitochondrial genome map, encompassing the genes, GC content, GC skew, and sequencing depth, was visualized using Proksee, available at https://proksee.ca (accessed on 30 April 2025). The complete mitochondrial genome sequence was submitted to the GenBank database of NCBI.
2.3. Phylogenetic Analysis
To clarify the phylogenetic status of the three Siphonaria species, a maximum-likelihood phylogenetic tree was reconstructed based on a concatenated alignment of mitochondrial PCGs using IQ-TREE v2.4.0 [22]. Prior to tree reconstruction, the 13 PCGs were individually aligned using the MUSCLE method implemented in MEGA X and then concatenated into a single dataset using SequenceMatrix v1.7.8 [23]. The resultant dataset was subsequently submitted to IQ-TREE for phylogenetic analysis. The optimal nucleotide substitution model was automatically selected using Bayesian Information Criterion (BIC). Branch support was assessed through 1000 bootstrap replicates. To root the tree and provide a reference for evolutionary comparisons, Thuridilla gracilis (GenBank accession number DQ991939) was selected as the outgroup species, based on its phylogenetic proximity and well-established taxonomic position within the Gastropoda.
2.4. Codon Usage Bias Analysis
The relative synonymous codon usage (RSCU), effective number of codons (ENC) plot, parity rule 2 (PR2)-bias plot, and neutrality plot were analyzed to evaluate the codon usage bias of mitochondrial PCGs. The RSCU analysis, which reflects the relative frequency of codon usage when all synonymous codons for an amino acid are equally used [24], was conducted for all PCGs. The RSCU values were calculated using MEGA X [25], with values > 1 indicating preferred codons in the translation process. For the ENC plot analysis, the GC content of the third synonymous position (GC3s) and ENC were calculated using CodonW v1.4.2. The ENC values, ranging theoretically from 20 (extreme bias) to 61 (no bias), were then plotted against the expected curve defined by the formula ENC = 2 + GC3s + 29/[GC3s2 + (1 − GC3s)2] [26]. Significant deviations below this theoretical curve suggest the presence of selection pressure acting on these mitochondrial genes. The nucleotide composition bias at the third codon position was further examined through PR2-bias plot analysis. A3, T3, C3, and G3 indicate the nucleotide proportions of A, T, C, and G, respectively, at the third codon position in each gene. Their values were calculated using CodonW v1.4.2. In PR2-bias plot maps, G3/(G3 + C3) and A3/(A3 + T3) were set as the x axis and y axis, respectively [27]. The central point (0.5, 0.5) indicates no bias at the third codon position, indicating no significant selection pressure operates at this site. To further distinguish between the mutation and selection pressure in shaping codon usage patterns, we conducted neutrality plot analysis. The GC content of the first, second, third, and all bases of codons (GC1, GC2, GC3, and GCall) for each gene was calculated in Python (v3.9.7). Then, a linear regression of GC12 and GC3 was performed in R, where GC12 represents the average of GC1 and GC2 [28]. A strong linear relationship (slope close to 1) suggests mutation pressure dominates codon usage bias, as GC3 varies proportionally with GC12. To explore potential relationships between different codon usage parameters, Pearson correlation analyses among GC1, GC2, GC3, GCall, and ENC were conducted using the “corrplot” package in R.
3. Results
3.1. Mitochondrial Genome of S. japonica
The assembled mitochondrial genome of S. japonica was a circular molecule and 13,966 bp in length. Its average sequencing depth was 1848×, and the lowest depth per site was 1319×. The nucleotide composition (28.7% A, 36.8% T, 16.0% C, 18.6% G) presented an A + T bias (65.5%), a negative AT skew (−0.124), and a positive GC skew (0.075). The genome contained 37 genes, comprising 13 PCGs, 22 transfer RNA genes (tRNAs), and two ribosomal RNA genes (rRNAs) (Figure 1A). The PCG region was 10,782 bp and comprised 77.2% of the genome. Nine genes, i.e., cox1, cox2, cob, nad1, nad2, nad4, nad4l, nad5, and nad6, were located on the heavy chain. Four genes, i.e., cox3, atp6, atp8, and nad3, were located on the light chain. The gene arrangement was identical to that of S. pectinata (Figure 1B). ATG was used as the start codon by cox2, cox3, atp6, atp8, nad2, and nad4l. TTG was used as the start codon by cox1, cob, nad1, and nad4. ATT was used as the start codon by nad3, nad5, and nad6. TAG was used as the stop codon by atp8, nad2, nad4, and nad5, and other genes used TAA as the stop codon. Among them, the TAA stop codon was completed by the addition of 3′ A residues to the mRNA in atp6, nad1, nad3, and nad4l.

Figure 1.
Mitochondrial genome of S. japonica. (A) Circular map of S. japonica mitochondrial genome. (B) Gene arrangement of mitochondrial PCGs of Siphonaria species. (C) Maximum-likelihood phylogenetic tree inferred from Siphonaria mitochondrial PCGs. T. gracilis was used as the outgroup.
3.2. Phylogeny of Siphonaria Species
Phylogenetic relationships among three species of Siphonaria were reconstructed based on the mitochondrial PCGs. The recovered topology showed two lineages within Siphonaria: one included S. gigas, and the other included S. japonica and S. pectinata. S. gigas was the most basal ingroup lineage. S. japonica was recovered as the sister group of S. pectinata (Figure 1C).
3.3. Codon Usage Bias of Siphonaria Mitochondrial PCGs
The RSCU values of all codons corresponding to amino acids in the mitochondrial PCGs from the three Siphonaria species were analyzed. The statistical analysis identified 17 high-frequency codons (RSCR > 1) shared among the three species (Figure 2). Of these, 12 ended in U, and 5 ended in A, indicating a bias for high-frequency codons ending in U/A. Notably, nine high-frequency codons were uniquely identified in S. japonica and S. pectinata, and they all ended in A/U, whereas six high-frequency codons were uniquely identified in S. gigas, and they all ended in G. UUA (Leu), UCU (Ser), CGA (Arg), CCU (Pro), and GCU (Ala) were the most frequent codons with the highest RSCU values in both S. japonica and S. pectinata, and the most frequent codons in S. gigas were UCU (Ser), GCU (Ala), ACU (Thr), and GUU (Val).
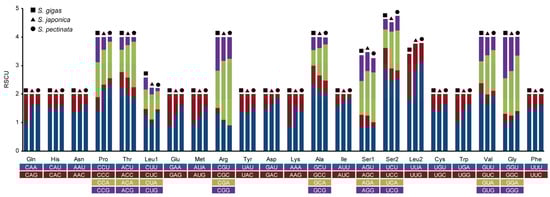
Figure 2.
Relative synonymous codon usage (RSCU) of mitochondrial PCGs in Siphonaria species.
The ENC values of mitochondrial PCGs were calculated to investigate the diversity of codon usage bias in the Siphonaria species. The mean ENC ± standard error values were as follows: S. gigas 45.9 ± 1.2, S. japonica 44.8 ± 1.0, S. pectinata 40.3 ± 1.5. Because the ENC values of all species were >35, the overall trend of the PCGs showed weak codon usage bias. This weak bias may stem from balanced evolutionary pressures, where translational efficiency, tRNA abundance, and gene expression levels collectively mitigate strong preference for specific codons. Additionally, mutations accumulate more freely in genomes experiencing weak purifying selection. The ENC values were not significantly correlated to the GC content at any codon base in S. gigas and S. japonica. However, the ENC values were significantly correlated to GC3 in S. pectinata (Table 1), indicating that mutational bias at the third codon position contributed to codon preference in this species. The ENC plot showed that all the PCGs of S. gigas exhibited ENC values lower than the theoretical values, below the standard curve (Figure 3A), implying that PCGs’ codon usage bias was primarily affected by purifying selection. Purifying selection likely optimizes the translation efficiency via preferred codons matching high-abundance tRNAs. Some PCGs of S. japonica and S. pectinata were found scattered along the standard curve, and others were below it, indicating diverse codon preference across genes. This suggested that both purifying selection and mutation pressure influenced the PCGs’ codon usage bias. Additionally, factors such as the gene length, protein structure, and epigenetic modifications (e.g., DNA methylation) could further modulate the codon choice.

Table 1.
Correlation analysis of codon parameters across mitochondrial PCGs across Siphonaria.
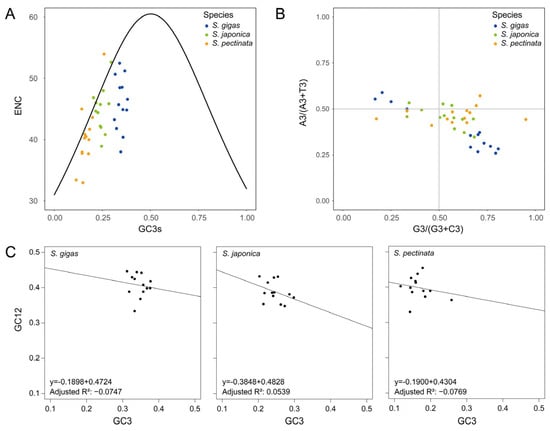
Figure 3.
Codon usage bias analyses of mitochondrial PCGs in Siphonaria species. (A) ENC plot analysis. (B) PR2-bias plot analysis. (C) Neutrality plot analysis.
The impact of mutation and selection pressure on gene codon usage bias was further examined through PR2-bias plot analysis. The analysis revealed that the PCGs of S. gigas exhibited a more uneven distribution than those of S. japonica and S. pectinata (Figure 3B). This asymmetry suggests stronger directional selection in S. gigas, potentially driven by adaptation to specific ecological niches or metabolic demands, which preferentially fix G/T-ending codons. The nucleobases G and T were more favored over C and A at the third codon base in most S. gigas PCGs. This bias could arise from mutational biases (e.g., oxidative damage favoring G/T) or selection for translational efficiency, as G/T-rich codons may correlate with abundant tRNAs. This trend was also observed in the PCGs of S. japonica and S. pectinata, while their plots were closer to the center than those of S. gigas. The intermediate distribution in these species implies a balance between mutation pressure and weaker purifying selection compared to S. gigas. The results suggest that natural selection may be the main factor affecting the codon usage, particularly the third codon base, and S. gigas was more influenced than the other two species.
A neutrality plot was used to examine the relationship between GC12 and GC3 to assess the impact of mutation and natural selection on the codon usage bias. The neutrality plot could distinguish between mutational bias (which would show a strong GC12-GC3 correlation) and selective forces (which would disrupt this correlation). The analysis revealed a weak negative correlation between GC12 and GC3, with regression coefficients ranging from −0.3848 to −0.1898 and adjusted R2 values ranging from −0.0769 to 0.0539 (Figure 3C). This weak correlation suggests that codon usage bias in Siphonaria is primarily shaped by purifying selection rather than mutation pressure, as mutation-driven bias would typically produce a stronger GC12-GC3 relationship. Statistical analysis indicated that there was no significant correlation between GC3 and GC1/GC2 (p > 0.05). GC1 and GC2 were both significantly correlated with GCall in all species except S. japonica, whose GC2 was not significantly correlated with GCall (Table 1). This observation suggests that while mutational pressures may uniformly influence the GC content at the first and second codon positions, the third position appears to be under distinct selective constraints, likely due to its role in translational efficiency through tRNA abundance. These results indicated that natural selection was the major factor influencing codon usage bias in Siphonaria. Selective pressures such as translational efficiency, protein folding kinetics, or ecological adaptations likely drive these biases, overriding neutral mutational effects.
4. Discussion
We sequenced the complete mitochondrial genome of S. japonica. The genome size was 13,966 bp, slightly smaller than those of S. gigas and S. pectinata. The PCGs of S. japonica and S. pectinata presented the same gene order, while they differed from that of S. gigas. Gene rearrangements are prevalent across Gastropoda mitochondrial genomes [7]. The same gene order between S. japonica and S. pectinata indicates their close relationship. The phylogenetic analysis based on mitochondrial PCGs also supported the close relationship between S. japonica and S. pectinata. The topology of the reconstructed phylogenetic tree among the three species (S. gigas + (S. japonica + S. pectinata)) aligned with that based on the concatenated COI, 12S, and 16S sequences [4], while it differed from that based on the 16S sequences [3]. The trees based on one or three makers did not present high bootstrap support values or MCMC posterior probabilities to support their topologies. The continuous supplementation of mitochondrial genome data is expected to provide the molecular foundation for the phylogenetic analysis of Siphonaria.
According to the RSCU analysis, S. japonica and S. pectinata presented similar codon usage bias patterns. This consistency likely reflects shared evolutionary constraints imposed by their tRNA pool composition and translational optimization pressures. The third base of their high-frequency codons was all U/A. Several high-frequency codons of S. gigas ended with G. High-expression genes in fast-growing cells particularly benefit from U/A-ending codons by minimizing tRNA competition during rapid protein synthesis. The G-ending preference in S. gigas may indicate specialized tRNA modification systems or a unique translational regulation mechanism. The distinct codon ending preference in S. gigas also suggests potential evolutionary divergence compared to its counterparts. The preference for high-frequency codons ending in U/A is also observed in plants [29], insects [30], and fungi [31]. This phenomenon suggests that the U/A-ending codon preference might represent an evolutionarily conserved feature across diverse taxonomic groups, potentially linked to translational efficiency or tRNA abundance [32,33]. The divergence in S. gigas’ codon usage could serve as a molecular marker for studying species-specific adaptation, warranting further investigation through comparative proteomics.
The ENC plot, PR2-bias plot, and neutrality plot analyses all indicated that the codons of the three Siphonaria species were predominantly shaped by natural selection, aligning with findings for Rhingia [30], Candida [31], and Ganoderma [34]. The mean ENC value of mitochondrial PCGs varied across different species, implying different codon preferences. This variation may reflect distinct evolutionary trajectories and selective pressures acting on mitochondrial gene expression efficiency. The mitochondrial PCGs of Siphonaria species had an average ENC value over 35, demonstrating a weak codon usage bias. Such weak bias suggests relaxed selection or compensatory mechanisms in translational regulation. Higher ENC values were observed in viruses [35], nematodes, flatworms [36], and humans [37]. Lower ENC values were observed in hookworms [38], fungi [31], and nonbiting midges [17]. The ENC plot, PR2-bias plot, and neutrality plot analyses provided evidence that natural selection plays a role in the codon usage bias of Siphonaria, which is consistent with the result from the mitochondrial genomes of other species [10,39]. Future comparative studies integrating tRNA gene copy number and expression data could further elucidate the mechanistic basis of these biases.
5. Conclusions
We sequenced the complete mitochondrial genome of S. japonica and conducted phylogenetic and codon usage bias analyses with S. gigas and S. pectinata. The results of the gene arrangement, reconstructed phylogenetic tree, and codon usage bias indicated that S. japonica had a closer relationship with S. pectinata. The codon usage bias analysis also revealed that natural selection predominantly shaped the codon preference of the mitochondrial PCGs of the three species. This study provides crucial evolutionary insights into the phylogenetic relationships and molecular adaptation mechanisms among false limpet species.
Author Contributions
Conceptualization, T.L. and X.Q.; methodology, J.G.; software, Y.W. and H.J.; validation, X.Z. and T.L.; formal analysis, J.G. and X.Z.; investigation, C.S. and Y.W.; resources, J.G. and X.Z.; data curation, C.S. and X.Q.; writing—original draft preparation, J.G.; writing—review and editing, X.Z., C.S., Y.W., H.J., T.L. and X.Q.; visualization, J.G.; supervision, T.L. and X.Q.; project administration, X.Q.; funding acquisition, X.Q. All authors have read and agreed to the published version of the manuscript.
Funding
This research was funded by the National Natural Science Foundation of China, grant number 32070481, and the Zhejiang Provincial Natural Science Foundation of China, grant number LY22C040003.
Institutional Review Board Statement
Not applicable.
Informed Consent Statement
Not applicable.
Data Availability Statement
The data supporting the findings of this study are openly available in GenBank of NCBI (https://www.ncbi.nlm.nih.gov/genbank/, accessed on 20 May 2025). The complete mitochondrial genome of S. japonica has been released under accession number PV560261.
Conflicts of Interest
The authors declare no conflicts of interest.
References
- Zang, G.; Wang, J.; Ma, P.; Li, C.; Chen, Y.; Tang, Z.; Wang, H. Identifications of common species and descriptions of two new species of Siphonaria (Mollusca: Gastropoda) in China. Biology 2025, 14, 103. [Google Scholar] [CrossRef] [PubMed]
- Kim, Y.; Park, J.; Hwang, U.W.; Park, J.K. Taxonomic review of Korean Siphonaria species (Mollusca, Gastropoda, Siphonariidae). Biodivers. Data J. 2025, 13, e139388. [Google Scholar] [CrossRef] [PubMed]
- Ossenbrügger, H.; Neiber, M.T.; Hausdorf, B. Diversity of Siphonaria Sowerby I, 1823 (Gastropoda, Siphonariidae) in the Seychelles Bank and beyond. Zool. Scr. 2022, 52, 31–45. [Google Scholar] [CrossRef]
- Dayrat, B.; Goulding, T.C.; White, T.R. Diversity of Indo-West Pacific Siphonaria (Mollusca: Gastropoda: Euthyneura). Zootaxa 2014, 3779, 246–276. [Google Scholar] [CrossRef]
- Giribet, G.; Kawauchi, G.Y. How many species of Siphonaria pectinata (Gastropoda: Heterobranchia) are there? J. Molluscan Stud. 2016, 82, 137–143. [Google Scholar] [CrossRef][Green Version]
- Wang, H.; Geng, S.; Liu, S.; Li, Z.; Cameron, S.; Lei, T.; Xu, W.; Liu, Q.; Zuo, S.; Omongo, C.A.; et al. Unraveling the cryptic Bemisia tabaci species complex: Global phylogenomic analysis reveals evolutionary relationships and biogeographic patterns. Insect Sci. 2025. [Google Scholar] [CrossRef]
- White, T.R.; Conrad, M.M.; Tseng, R.; Balayan, S.; Golding, R.; de Frias Martins, A.M.; Dayrat, B.A. Ten new complete mitochondrial genomes of pulmonates (Mollusca: Gastropoda) and their impact on phylogenetic relationships. BMC Ecol. Evol. 2011, 11, 295. [Google Scholar] [CrossRef]
- Grande, C.; Templado, J.; Cervera, J.L.; Zardoya, R. Phylogenetic relationships among Opisthobranchia (Mollusca: Gastropoda) based on mitochondrial cox 1, trnV, and rrnL genes. Mol. Phylogenet. Evol. 2004, 33, 378–388. [Google Scholar] [CrossRef]
- Güller, M.; Zelaya, D.G.; Ituarte, C. How many Siphonaria species (Gastropoda: Euthyneura) live in southern South America? J. Molluscan Stud. 2016, 82, 80–96. [Google Scholar] [CrossRef]
- Lei, T.; Zheng, X.; Song, C.; Jin, H.; Chen, L.; Qi, X. Limited variation in codon usage across mitochondrial genomes of non-biting midges (Diptera: Chironomidae). Insects 2024, 15, 752. [Google Scholar] [CrossRef]
- Biro, J.C. Does codon bias have an evolutionary origin? Theor. Biol. Med. Model. 2008, 5, 16. [Google Scholar] [CrossRef] [PubMed]
- Lei, T.; Luo, N.; Song, C.; Yu, J.; Zhou, Y.; Qi, X.; Liu, Y. Comparative genomics reveals three genetic groups of the whitefly obligate endosymbiont Candidatus Portiera aleyrodidarum. Insects 2023, 14, 888. [Google Scholar] [CrossRef]
- Liu, Y. A code within the genetic code: Codon usage regulates co-translational protein folding. Cell Commun. Signal. 2020, 18, 145. [Google Scholar] [CrossRef]
- Quax, T.E.F.; Claassens, N.J.; Söll, D.; van der Oost, J. Codon bias as a means to fine-tune gene expression. Mol. Cell 2015, 59, 149–161. [Google Scholar] [CrossRef]
- Behura, S.K.; Severson, D.W. Codon usage bias: Causative factors, quantification methods and genome-wide patterns: With emphasis on insect genomes. Biol. Rev. 2012, 88, 49–61. [Google Scholar] [CrossRef]
- Das, S.; Paul, S.; Dutta, C. Synonymous codon usage in adenoviruses: Influence of mutation, selection and protein hydropathy. Virus Res. 2006, 117, 227–236. [Google Scholar] [CrossRef]
- Cao, J.K.; Lei, T.; Gu, J.J.; Song, C.; Qi, X. Codon bias analysis of the mitochondrial genome reveals natural selection in the nonbiting midge Microtendipes umbrosus Freeman, 1955 (Diptera: Chironomidae). Pan-Pac. Entomol. 2023, 99, 217–225. [Google Scholar] [CrossRef]
- Chen, S. Ultrafast one-pass FASTQ data preprocessing, quality control, and deduplication using fastp. iMeta 2023, 2, e107. [Google Scholar] [CrossRef]
- Dierckxsens, N.; Mardulyn, P.; Smits, G. NOVOPlasty: De novo assembly of organelle genomes from whole genome data. Nucleic Acids Res. 2016, 45, e18. [Google Scholar] [CrossRef]
- Danecek, P.; Bonfield, J.K.; Liddle, J.; Marshall, J.; Ohan, V.; Pollard, M.O.; Whitwham, A.; Keane, T.; McCarthy, S.A.; Davies, R.M.; et al. Twelve years of SAMtools and BCFtools. GigaScience 2021, 10, giab008. [Google Scholar] [CrossRef]
- Donath, A.; Jühling, F.; Al-Arab, M.; Bernhart, S.H.; Reinhardt, F.; Stadler, P.F.; Middendorf, M.; Bernt, M. Improved annotation of protein-coding genes boundaries in metazoan mitochondrial genomes. Nucleic Acids Res. 2019, 47, 10543–10552. [Google Scholar] [CrossRef] [PubMed]
- Minh, B.Q.; Schmidt, H.A.; Chernomor, O.; Schrempf, D.; Woodhams, M.D.; von Haeseler, A.; Lanfear, R. Corrigendum to: IQ-TREE 2: New models and efficient methods for phylogenetic inference in the genomic era. Mol. Biol. Evol. 2020, 37, 2461. [Google Scholar] [CrossRef] [PubMed]
- Vaidya, G.; Lohman, D.J.; Meier, R. SequenceMatrix: Concatenation software for the fast assembly of multi-gene datasets with character set and codon information. Cladistics 2011, 27, 171–180. [Google Scholar] [CrossRef] [PubMed]
- Sharp, P.M.; Li, W.H. An evolutionary perspective on synonymous codon usage in unicellular organisms. J. Mol. Evol. 1986, 24, 28–38. [Google Scholar] [CrossRef]
- Kumar, S.; Stecher, G.; Li, M.; Knyaz, C.; Tamura, K. MEGA X: Molecular evolutionary genetics analysis across computing platforms. Mol. Biol. Evol. 2018, 35, 1547–1549. [Google Scholar] [CrossRef]
- Wright, F. The ‘effective number of codons’ used in a gene. Gene 1990, 87, 23–29. [Google Scholar] [CrossRef]
- Sueoka, N. Intrastrand parity rules of DNA base composition and usage biases of synonymous codons. J. Mol. Evol. 1995, 40, 318–325. [Google Scholar] [CrossRef]
- Sueoka, N. Directional mutation pressure and neutral molecular evolution. Proc. Natl. Acad. Sci. USA 1988, 85, 2653–2657. [Google Scholar] [CrossRef]
- Ling, L.; Zhang, S.; Yang, T. Analysis of codon usage bias in chloroplast genomes of Dryas octopetala var. asiatica (Rosaceae). Genes 2024, 15, 899. [Google Scholar] [CrossRef]
- Zhao, R.; Li, H.; Wu, G.; Wang, Y.F. Codon usage bias analysis in the mitochondrial genomes of five Rhingia Scopoli (Diptera, Syrphidae, Eristalinae) species. Gene 2024, 917, 148466. [Google Scholar] [CrossRef]
- Wang, F.; Zhang, N.; Zhao, C.; Song, Z.; Xin, C. Codon usage bias analysis of mitochondrial protein-coding genes in 12 species of Candida. J. Genet. 2023, 102, 36. [Google Scholar] [CrossRef] [PubMed]
- Novoa, E.M.; Ribas de Pouplana, L. Speeding with control: Codon usage, tRNAs, and ribosomes. Trends Genet. 2012, 28, 574–581. [Google Scholar] [CrossRef] [PubMed]
- Drummond, A.; Shah, P.; Gilchrist, M.A. Effect of correlated tRNA abundances on translation errors and evolution of codon usage bias. PLoS Genet. 2010, 6, e1001128. [Google Scholar] [CrossRef]
- Wu, P.; Xiao, W.; Luo, Y.; Xiong, Z.; Chen, X.; He, J.; Sha, A.; Gui, M.; Li, Q. Comprehensive analysis of codon bias in 13 Ganoderma mitochondrial genomes. Front. Microbiol. 2023, 14, 1170790. [Google Scholar] [CrossRef]
- Shi, S.L.; Jiang, Y.R.; Yang, R.S.; Wang, Y.; Qin, L. Codon usage in Alphabaculovirus and Betabaculovirus hosted by the same insect species is weak, selection dominated and exhibits no more similar patterns than expected. Infect. Genet. Evol. 2016, 44, 412–417. [Google Scholar] [CrossRef]
- Mazumder, G.A.; Uddin, A.; Chakraborty, S. Expression levels and codon usage patterns in nuclear genes of the filarial nematode Wucheraria bancrofti and the blood fluke Schistosoma haematobium. J. Helminthol. 2016, 91, 72–79. [Google Scholar] [CrossRef]
- Chakraborty, S.; Uddin, A.; Mazumder, T.H.; Choudhury, M.N.; Malakar, A.K.; Paul, P.; Halder, B.; Deka, H.; Mazumder, G.A.; Barbhuiya, R.A.; et al. Codon usage and expression level of human mitochondrial 13 protein coding genes across six continents. Mitochondrion 2018, 42, 64–76. [Google Scholar] [CrossRef]
- Deb, B.; Uddin, A.; Mazumder, G.A.; Chakraborty, S. Analysis of codon usage pattern of mitochondrial protein-coding genes in different hookworms. Mol. Biochem. Parasitol. 2018, 219, 24–32. [Google Scholar] [CrossRef]
- Zhou, M.; Li, X. Analysis of synonymous codon usage patterns in different plant mitochondrial genomes. Mol. Biol. Rep. 2008, 36, 2039–2046. [Google Scholar] [CrossRef]
Disclaimer/Publisher’s Note: The statements, opinions and data contained in all publications are solely those of the individual author(s) and contributor(s) and not of MDPI and/or the editor(s). MDPI and/or the editor(s) disclaim responsibility for any injury to people or property resulting from any ideas, methods, instructions or products referred to in the content. |
© 2025 by the authors. Licensee MDPI, Basel, Switzerland. This article is an open access article distributed under the terms and conditions of the Creative Commons Attribution (CC BY) license (https://creativecommons.org/licenses/by/4.0/).