Article

Genome-Wide Identification of the Polygalacturonase Gene Family and Its Potential Association with Abscission Zone in Capsicum annuum L.

1
Pepper Research Institute, Guizhou Academy of Agricultural Sciences, Guiyang 550025, China
2
Guizhou Key Laboratory of Molecular Breeding for Characteristic Horticultural Crops, Guiyang 550025, China
3
College of Horticulture, Hunan Agricultural University, Changsha 410125, China
*
Author to whom correspondence should be addressed.
Genes 2025, 16(5), 579; https://doi.org/10.3390/genes16050579
Submission received: 30 April 2025 / Revised: 11 May 2025 / Accepted: 12 May 2025 / Published: 14 May 2025
(This article belongs to the Special Issue Molecular Adaptation and Evolutionary Genetics in Plants)

Abstract

:
Background: Polygalacturonase (PG) genes regulate plant organ abscission by degrading pectin in the cell wall. However, their association with pedicel abscission susceptibility in pepper remains poorly understood. Methods: 47 CaPG genes were identified were identified in the ‘Zunla1’ genome and characterized by structural, evolutionary, and comparative genomic analyses. Their expression profiles across various tissues and fruit development stages were examined using transcriptome data. Ethephon treatment and qRT-PCR were employed to assess gene responses during ethylene-induced pedicel abscission. Results: The 47 CaPG genes were distributed across 12 chromosomes, with CaPG1 to CaPG5 unanchored. Most proteins were hydrophilic, nuclear-localized, and had promoters enriched in light-responsive elements. Collinearity analysis revealed limited segmental duplication, and Ka/Ks values indicated strong purifying selection. Phylogenetic and collinearity analyses showed that CaPG genes are more closely related to those in tomato than in Arabidopsis or maize. Expression profiling revealed tissue- and stage-specific patterns, with 21 CaPG genes associated with pedicel abscission susceptibility. Ethephon treatment enhanced abscission and upregulated several CaPG genes. Conclusions: This study offers insights into the CaPG gene family’s structure, evolution, and function. Specific CaPG genes likely contribute to ethylene-mediated pedicel abscission, providing potential targets for improving fruit-retention traits in pepper.

1. Introduction

Pepper (Capsicum annuum L.) is a globally important horticultural crop valued for its nutritional, economic, and processing attributes [1,2]. A key agronomic trait is pedicel abscission susceptibility, which affects both harvesting efficiency and post-harvest processing by determining how easily the fruit detaches from the plant and the pedicel from the fruit. Similar traits are studied in other crops, such as sweet cherry, where stem–fruit abscission is crucial for mechanical harvesting and regulated by ethylene, and in bananas, where ripening affects fruit stalk detachment and processing quality [3,4].
Pedicel abscission is influenced by hormonal signals, transcription factors, and environmental conditions. Ethylene promotes abscission by activating gene expression in the abscission zone, often after auxin levels drop, as seen in tomatoes [5]. Jasmonic acid also promotes abscission, while auxin inhibits it. The transcription factor SlHB15A regulates this interaction by controlling JA-Ile biosynthesis [6]. Other transcription factors like PsJOINTLESS in pea and LcERF2 in litchi activate genes for cell wall remodeling, aiding abscission [7,8]. Environmental stresses, such as cold in apples and carbohydrate shortage in longan, increase abscission by disrupting hormones and triggering ROS, which enhance cell wall-degrading enzyme expression [9,10].
Polygalacturonases (PGs), a class of cell wall-modifying enzymes that degrade pectin, have been primarily associated with fruit softening [11,12,13,14]. However, recent studies have revealed their role in organ abscission. Since abscission requires significant cell wall changes, PGs are seen as crucial regulators [15,16]. In citrus, PGs like CitPG2, CitPG29, and CitPG34 are prominently expressed during fruit abscission and are influenced by ethylene and auxin [17]. Similarly, in tomatoes, PG activity increases in the abscission zones of flowers and leaves, indicating a conserved function across species [18].
Despite the growing recognition of PG genes in organ abscission, their functional roles in pepper pedicel abscission remain largely unexplored. Prior research in Capsicum has primarily focused on PG involvement in fruit ripening and softening. PG activity and expression patterns vary across developmental stages in sweet pepper, and a single gene linked to fruit abscission has been identified [19,20,21,22]. To address this knowledge gap, we conducted a comprehensive genome-wide identification and analysis of the PG gene family in Capsicum annuum. We performed a genome-wide identification and characterization of the PG gene family in Capsicum annuum and conducted gene expression profiling across various tissues and developmental stages, with particular attention to pedicel tissues exhibiting different levels of abscission sensitivity. Furthermore, we examined the ethylene responsiveness of selected CaPG genes using quantitative real-time PCR. This study aims to elucidate the regulatory roles of PG genes in pepper pedicel abscission and to identify candidate genes for improving fruit detachment traits, thereby supporting breeding strategies for enhanced mechanical harvesting and post-harvest processing efficiency. We hypothesize that specific CaPG genes play key regulatory roles in pedicel abscission and that their expression is modulated by ethylene signaling pathways.

2. Results

2.1. Identification and Characteristics of CaPGs

A total of 47 CaPG genes were identified from the Capsicum annuum ‘Zunla 1’ genome. These genes were labeled CaPG1 to CaPG47 based on their chromosomal positions. The proteins encoded by these genes range in size from 261 to 598 amino acids. Their molecular weights range from 28,032.14 Da to 63,472.85 Da. The isoelectric points of the proteins span from 4.95 to 9.80. The instability indices vary from 25.29 to 55.72, with 14 proteins classified as unstable. Hydrophilicity analysis revealed that 42 proteins are hydrophilic, while 5 are hydrophobic. Subcellular localization predictions indicate that the CaPG proteins are distributed across various cellular compartments, with a predominant localization in the nucleus (Table 1 and Table S1).

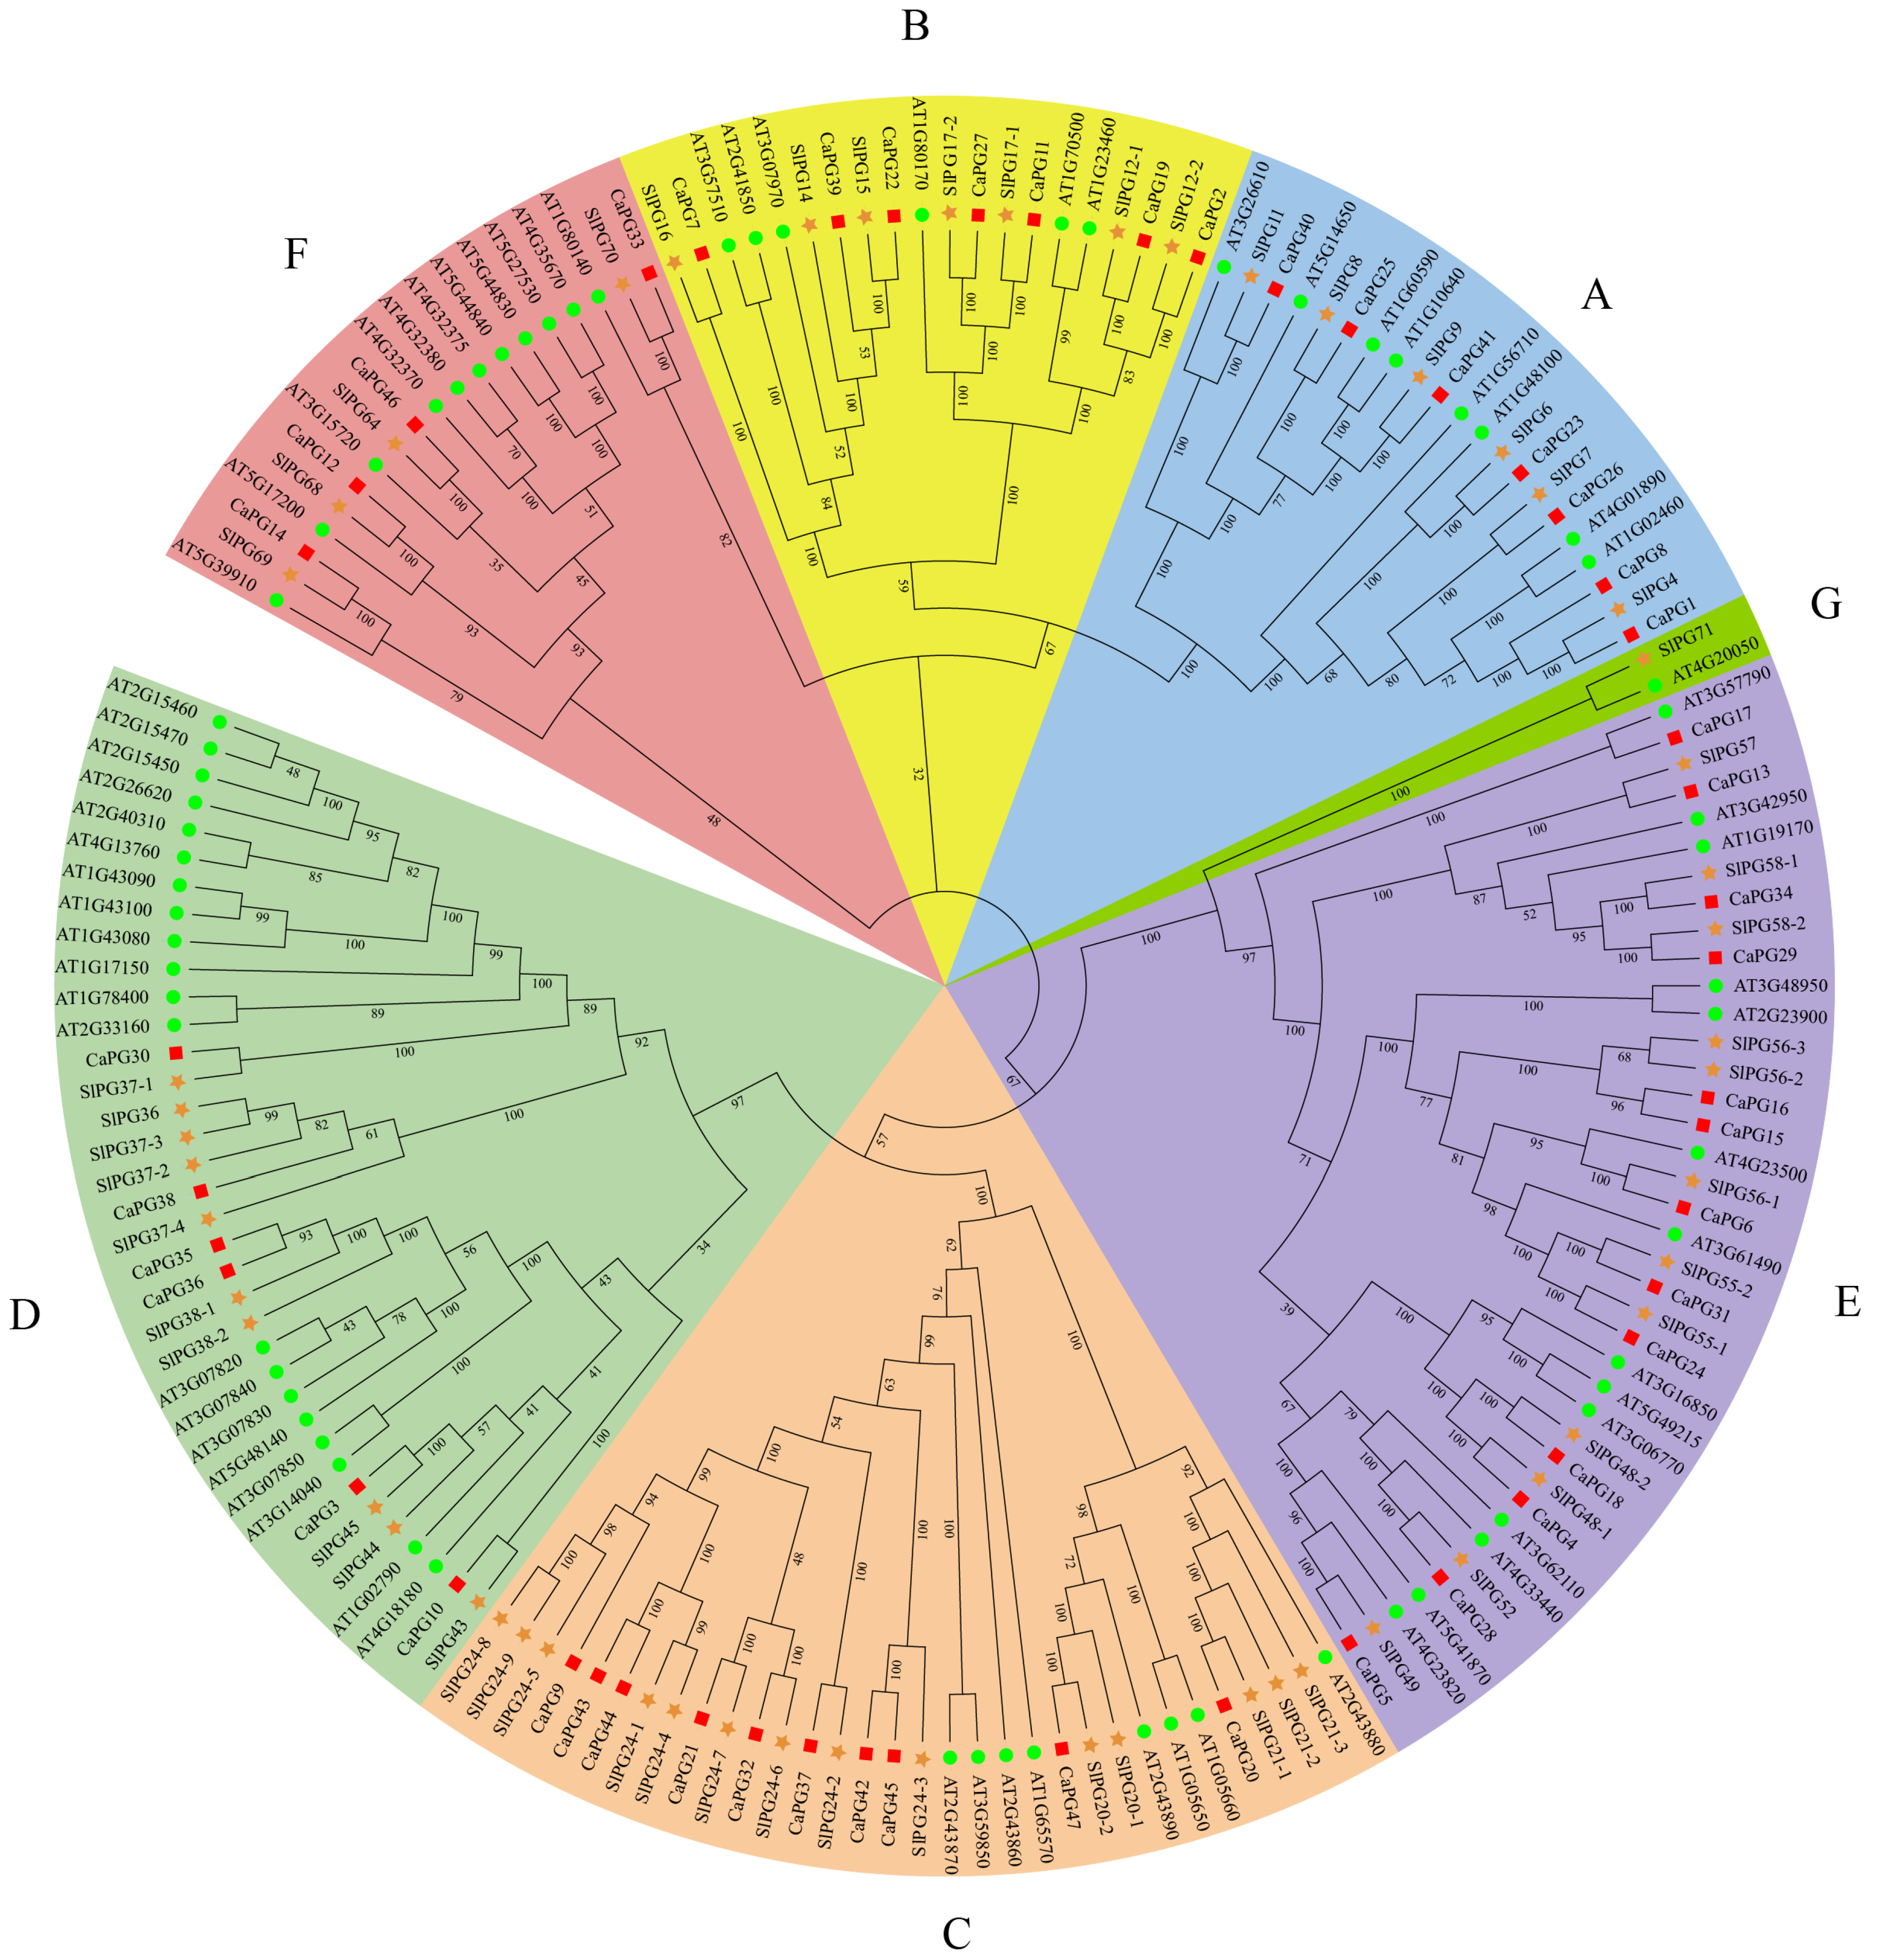
2.2. Phylogenetic Analysis and Classification of CaPGs

To further elucidate the evolutionary relationships within the PG gene family in Capsicum annuum, a comprehensive phylogenetic analysis was conducted. This analysis used 169 PG protein sequences, which were derived from Capsicum annuum (47 sequences), Arabidopsis thaliana (68 sequences), and Solanum lycopersicum (54 sequences). The resulting phylogenetic tree classified these PG proteins into seven distinct subfamilies, labeled A through G. The PG proteins from C. annuum were distributed among six subfamilies (A–F), indicating the significant diversification of the PG family across the examined species. Furthermore, the analysis revealed a closer evolutionary affinity between the PG proteins of C. annuum and S. lycopersicum (Figure 1).

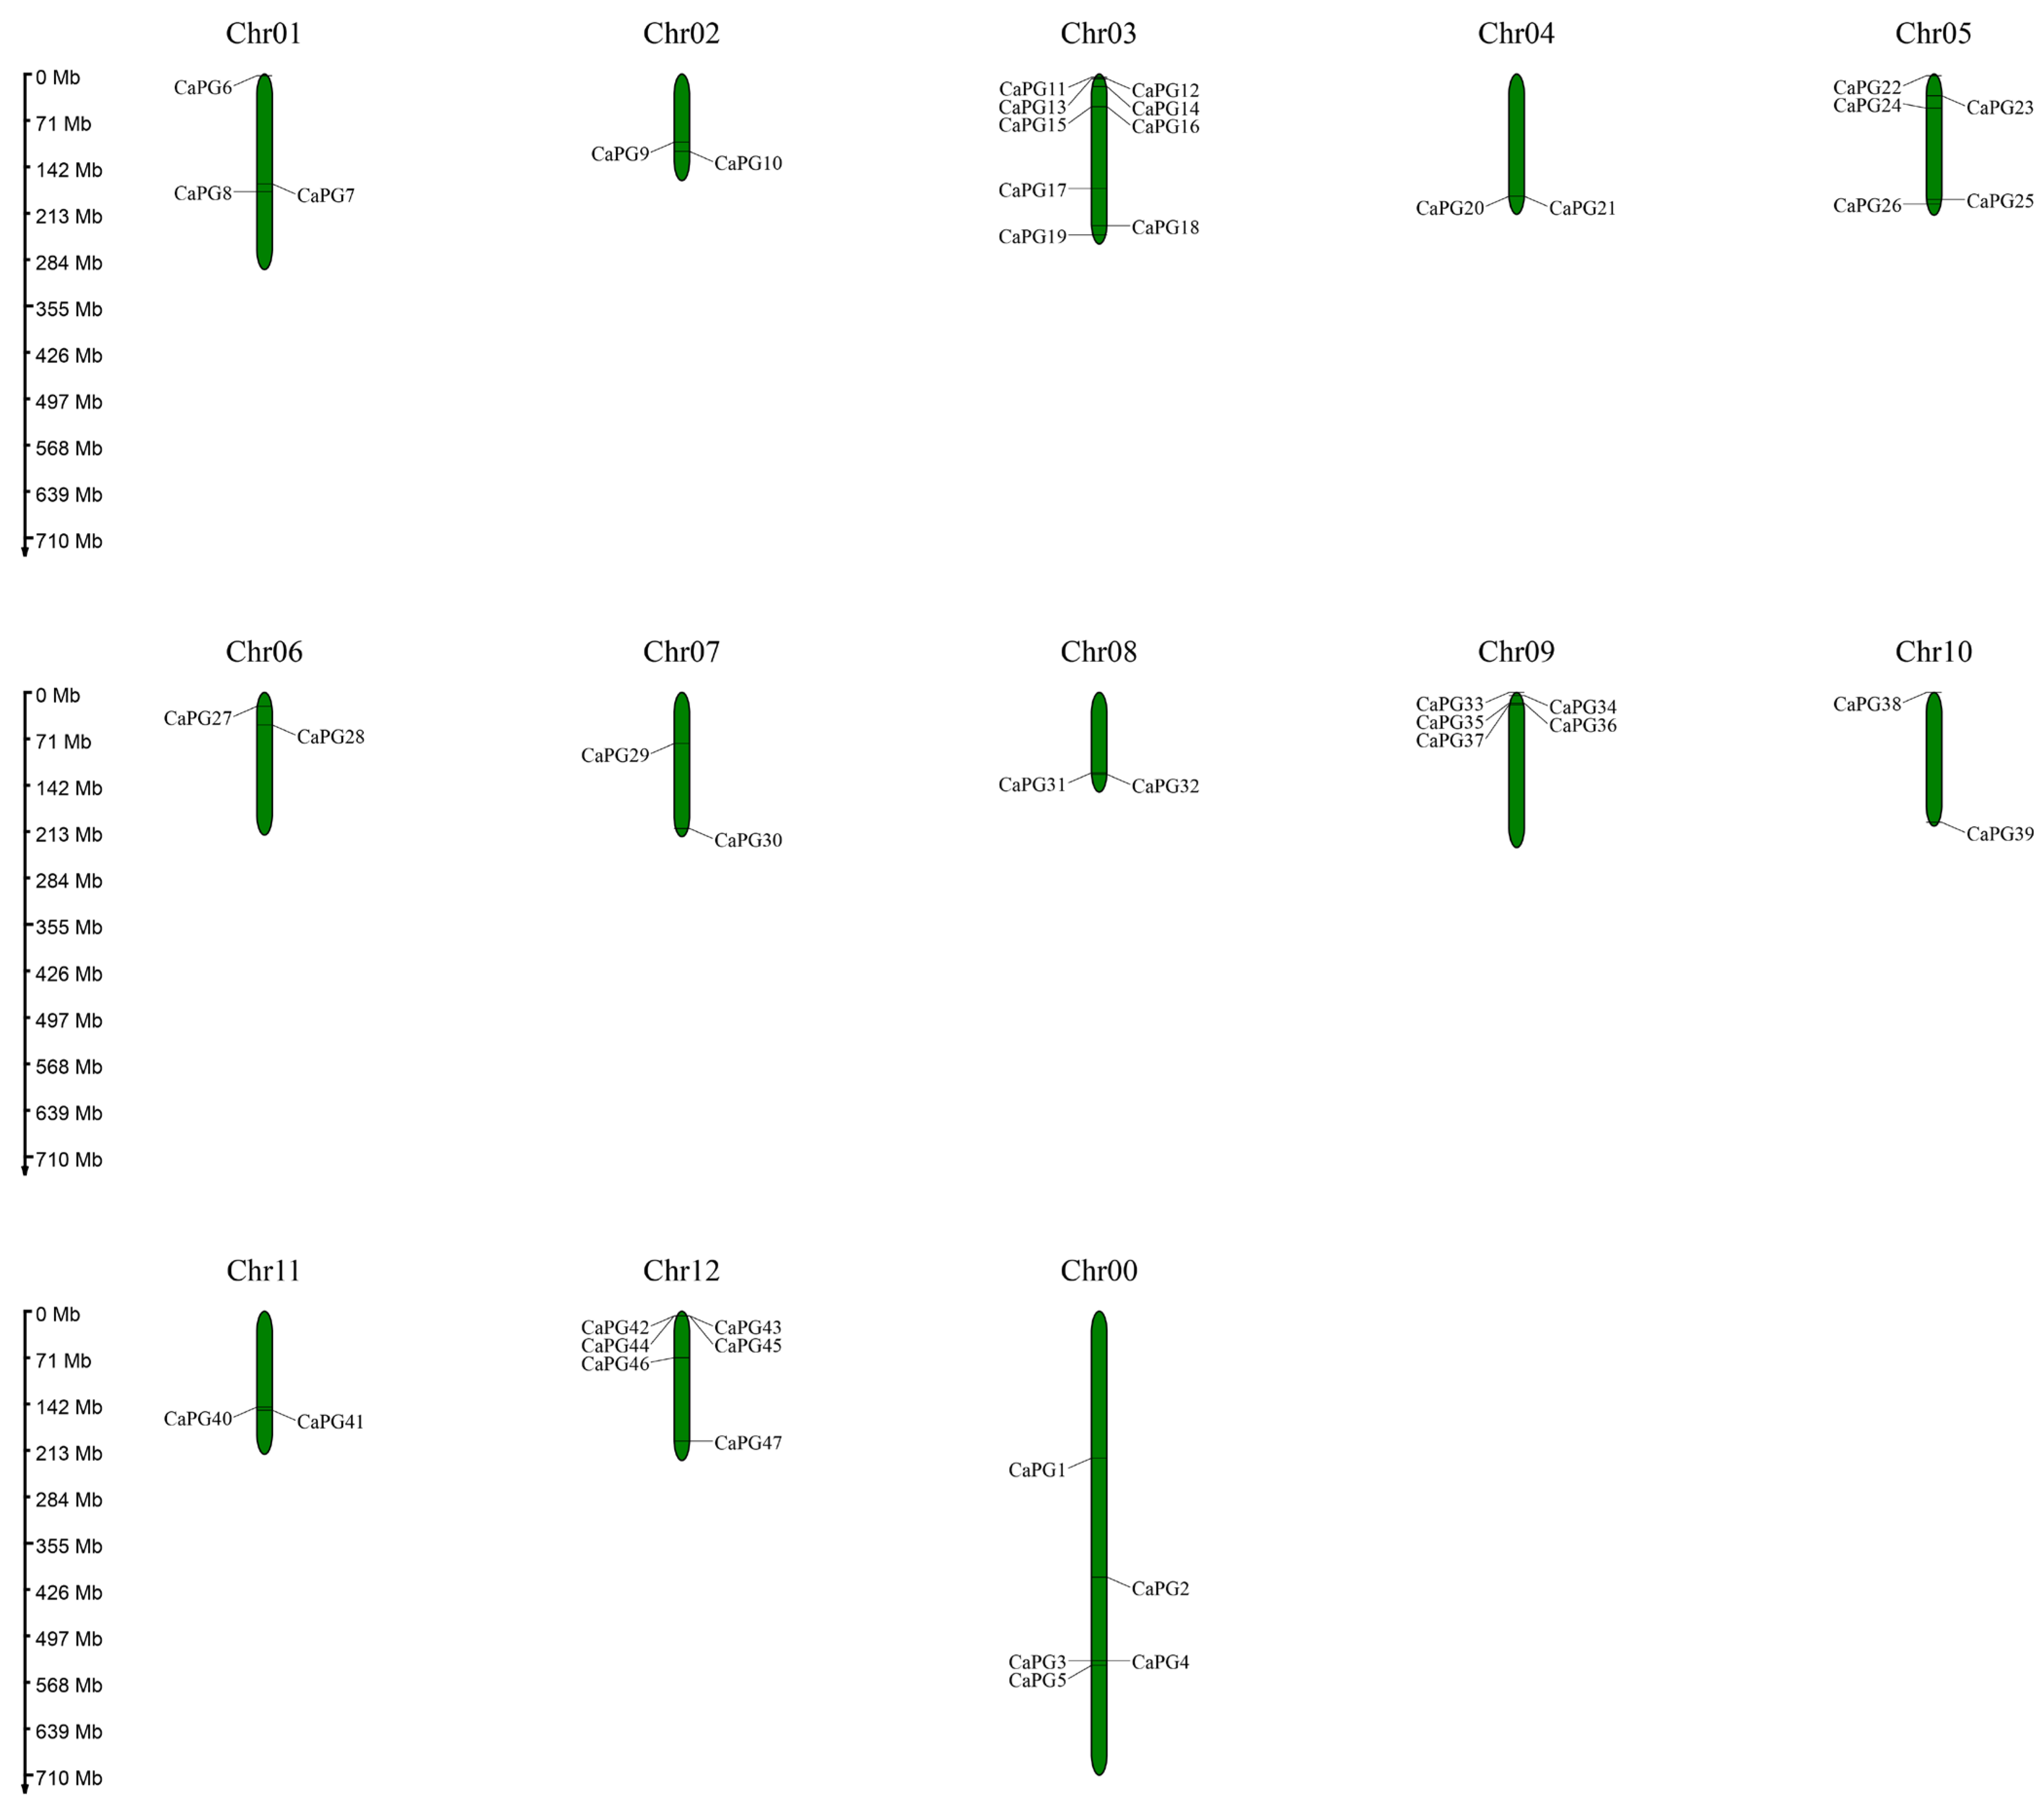
2.3. Distribution of CaPG Genes Across Chromosomes

The identified CaPG genes were distributed across all chromosomes of the Capsicum annuum genome, except for five genes (CaPG1 to CaPG5). These five genes were located on an unassigned chromosome, designated as chromosome 0. Among the 12 annotated chromosomes, chromosome 3 contained the highest number of CaPG genes, with a total of nine (CaPG11 to CaPG19). In contrast, chromosomes 2, 4, 6, 7, 8, 10, and 11 each contained only two CaPG genes. These chromosomes had the lowest gene counts (Figure 2).

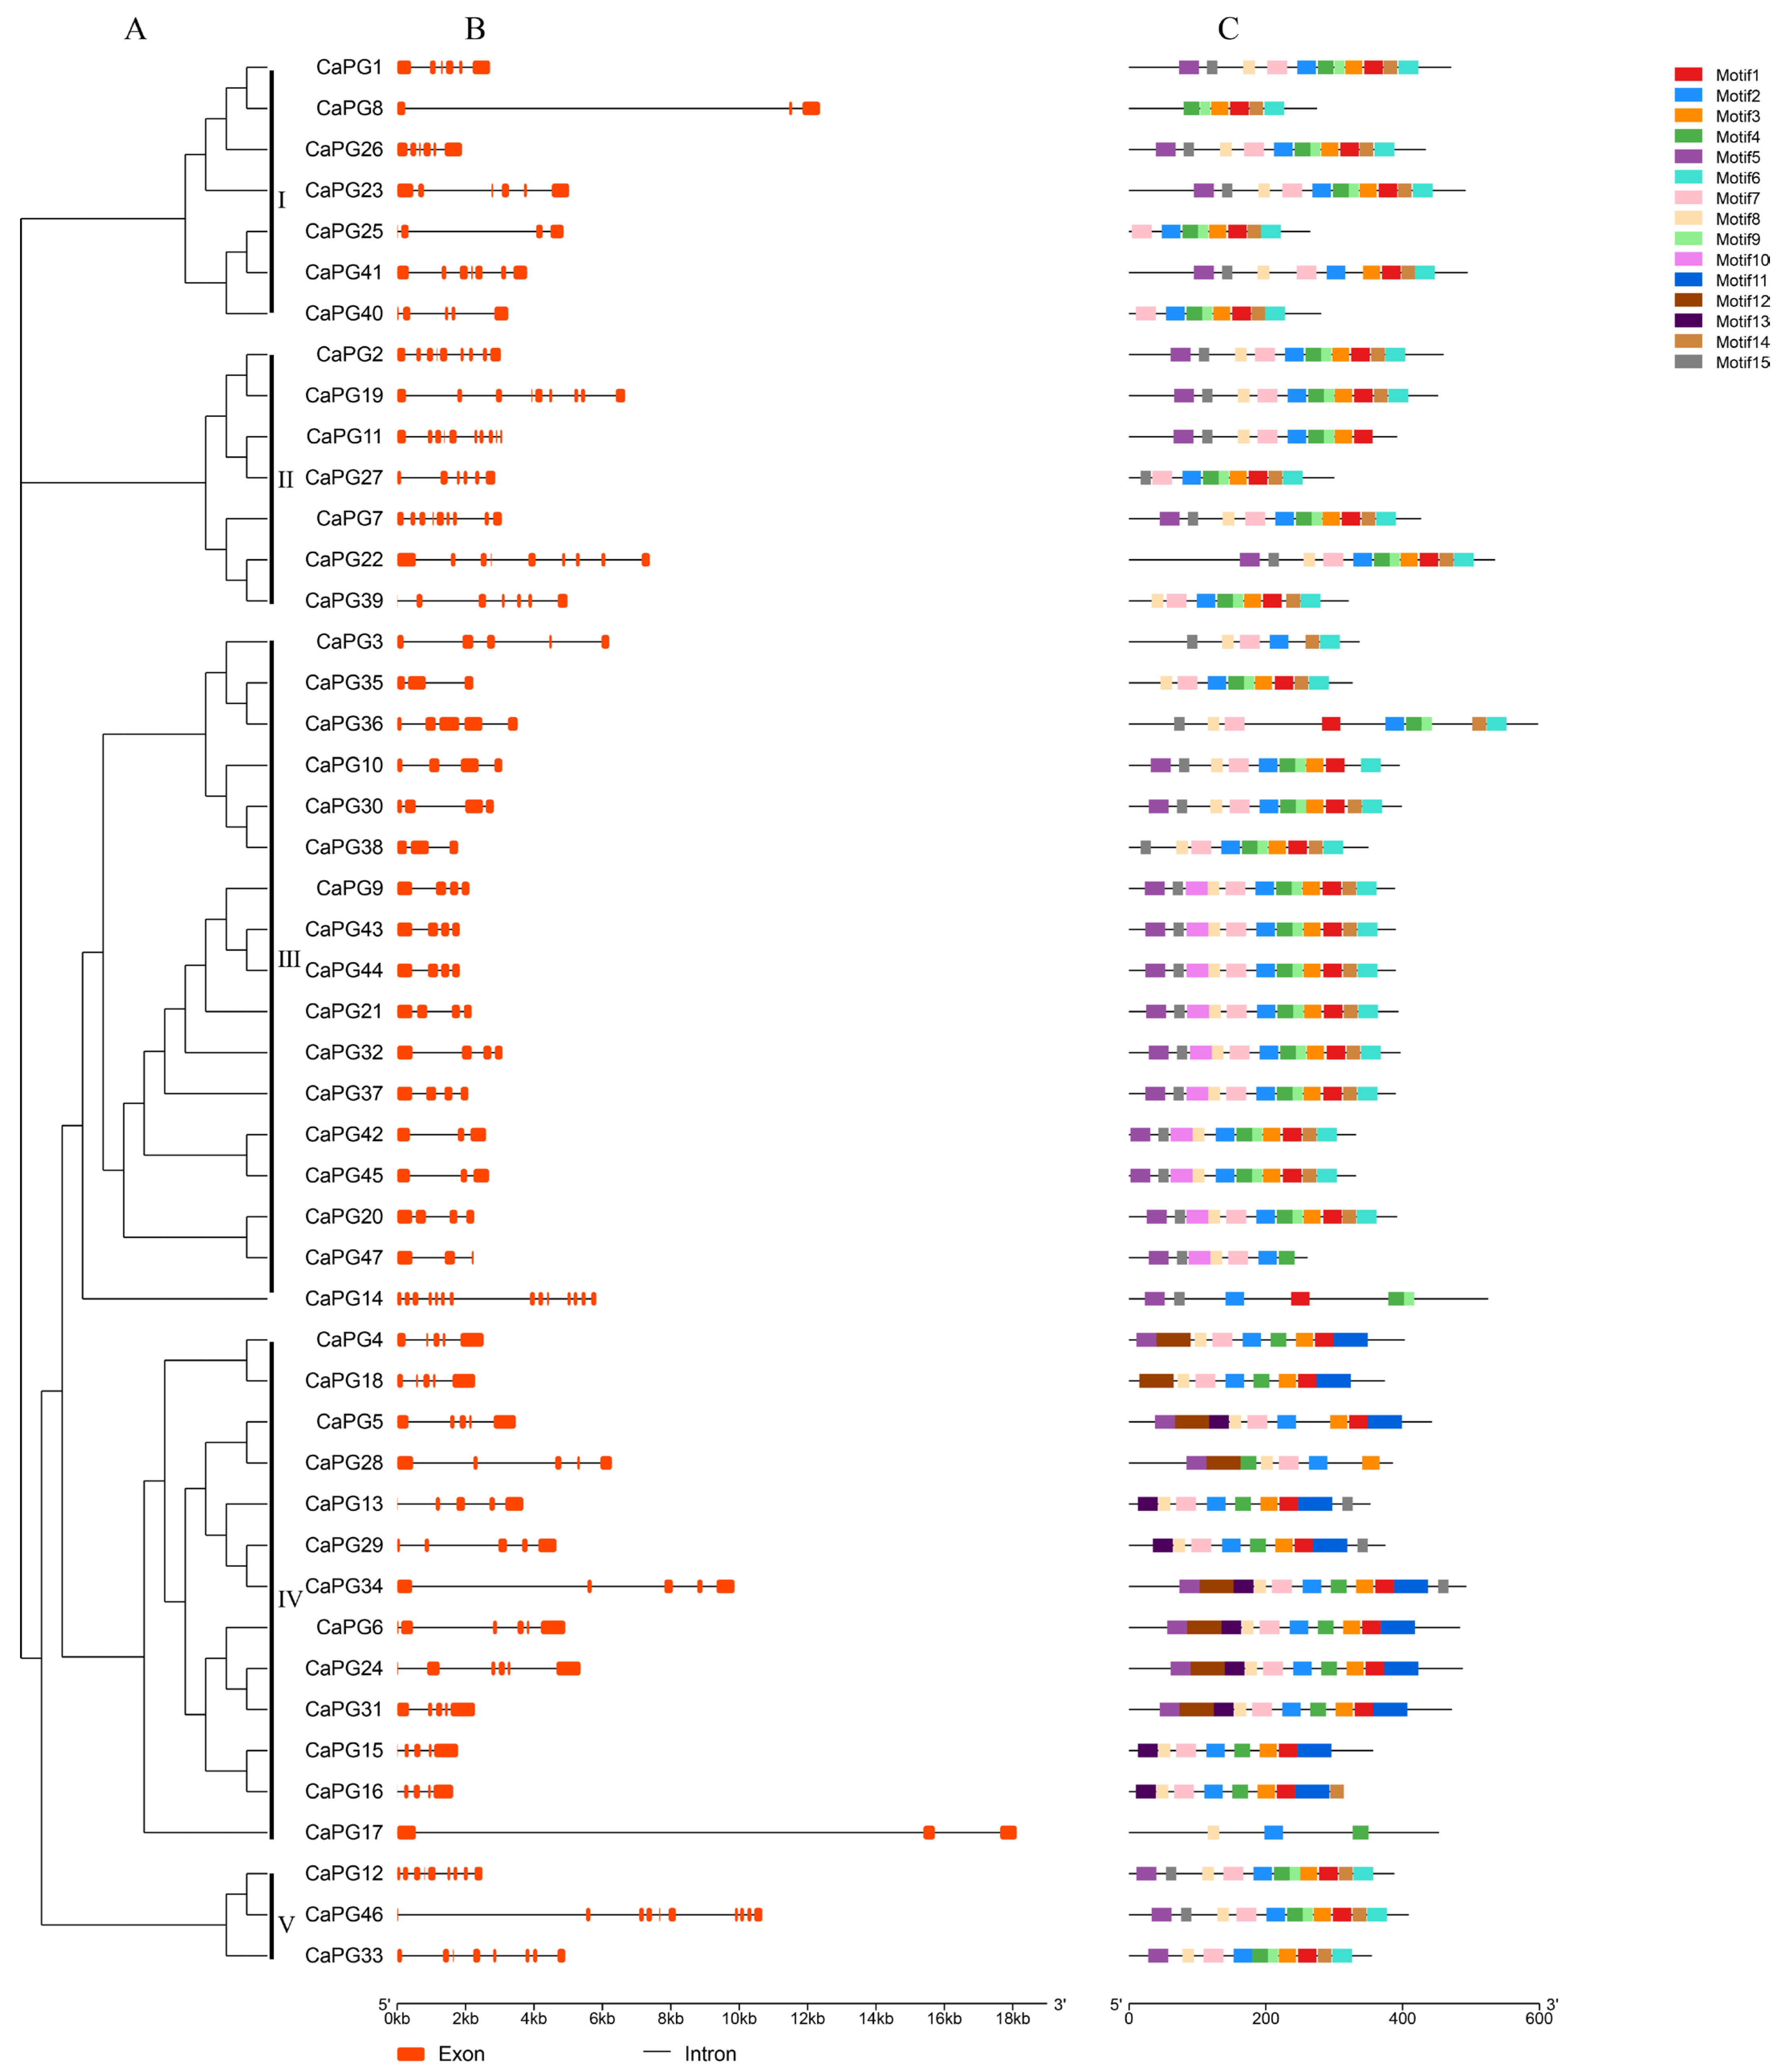
2.4. Gene Structure and Conserved Motif Composition

Figure 3 delineates the phylogenetic relationships, gene structures, and conserved motif compositions of the CaPG gene family. Panel (A) presents a phylogenetic tree of 47 CaPG genes, which are grouped into five distinct clades, indicating evolutionary divergence and potential functional differentiation. Panel (B) depicts the exon–intron structures of the CaPG genes, revealing that most genes comprise between 2 and 6 exons; however, certain genes, such as CaPG8 and CaPG17, display extended intronic regions, suggesting possible regulatory complexity or alternative splicing events. Panel (C) highlights the distribution of 15 conserved motifs within the CaPG protein sequences, with members of the same clade generally exhibiting similar motif compositions, suggesting conserved functional domains within each subgroup.

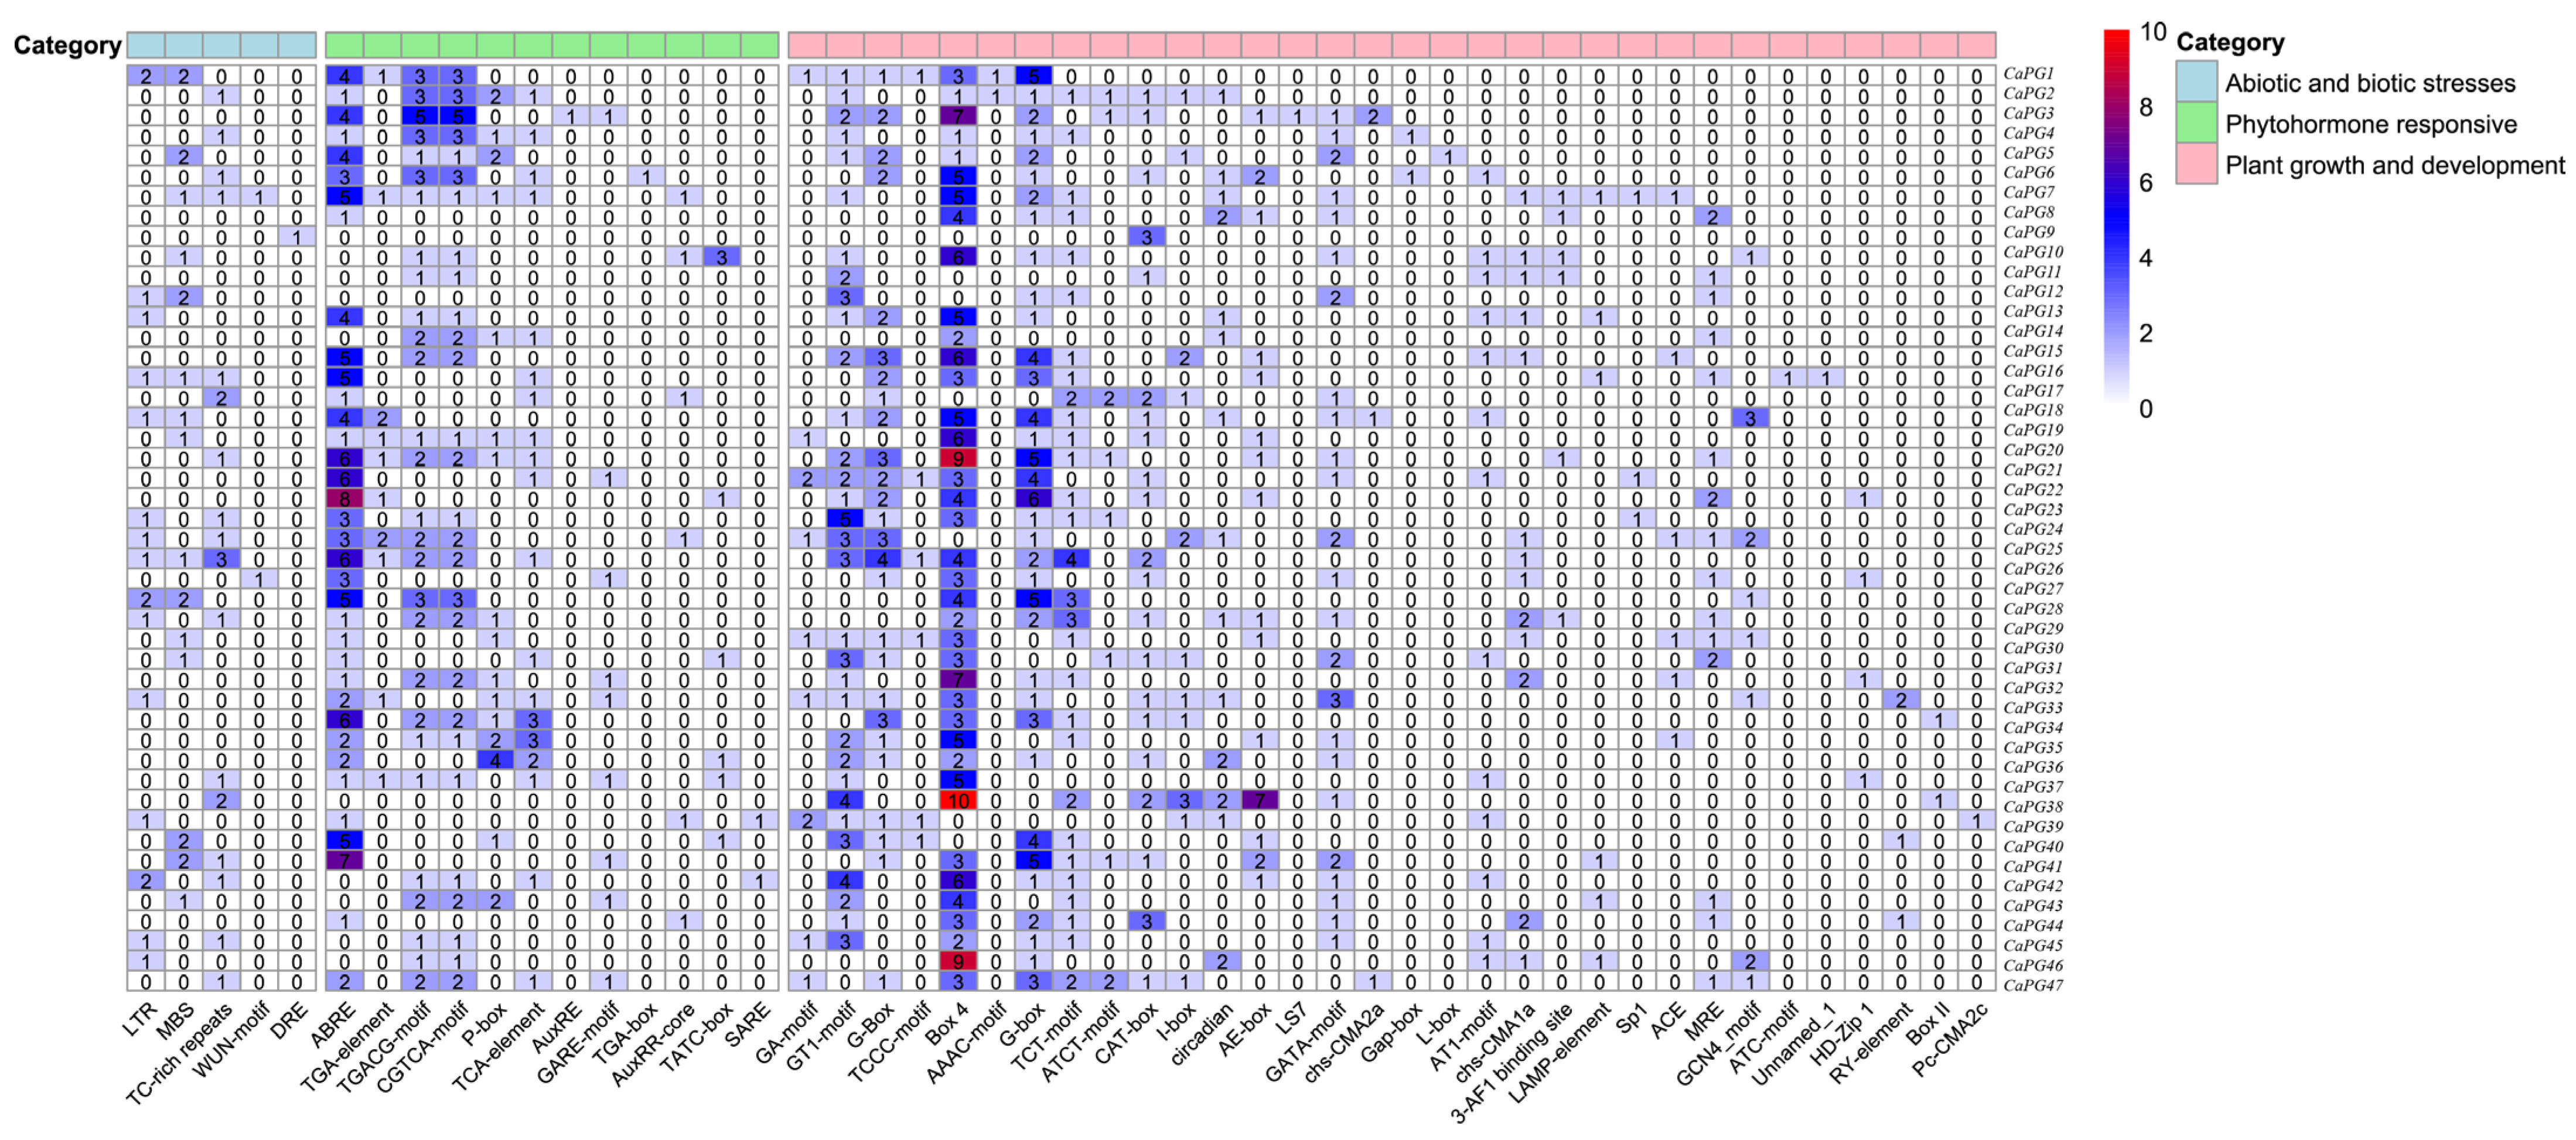
2.5. Analysis of Cis-Acting Elements

The analysis of cis-acting elements within the PG gene family identified “plant growth and development” elements as the most prevalent, with light-responsive elements being particularly common, among which Box-4 was the most frequent, followed by G-box. This underscores their significant roles in morphogenesis and organ differentiation. Elements categorized under “phytohormone responsive”, including ABRE, which is associated with abscisic acid (ABA), were the second most common, indicating their potential involvement in the coordinated regulation of hormonal responses. Conversely, elements linked to “abiotic and biotic stress” responses, such as MBS and LTR, were less frequently observed but may still play a role in stress adaptation (Figure 4).

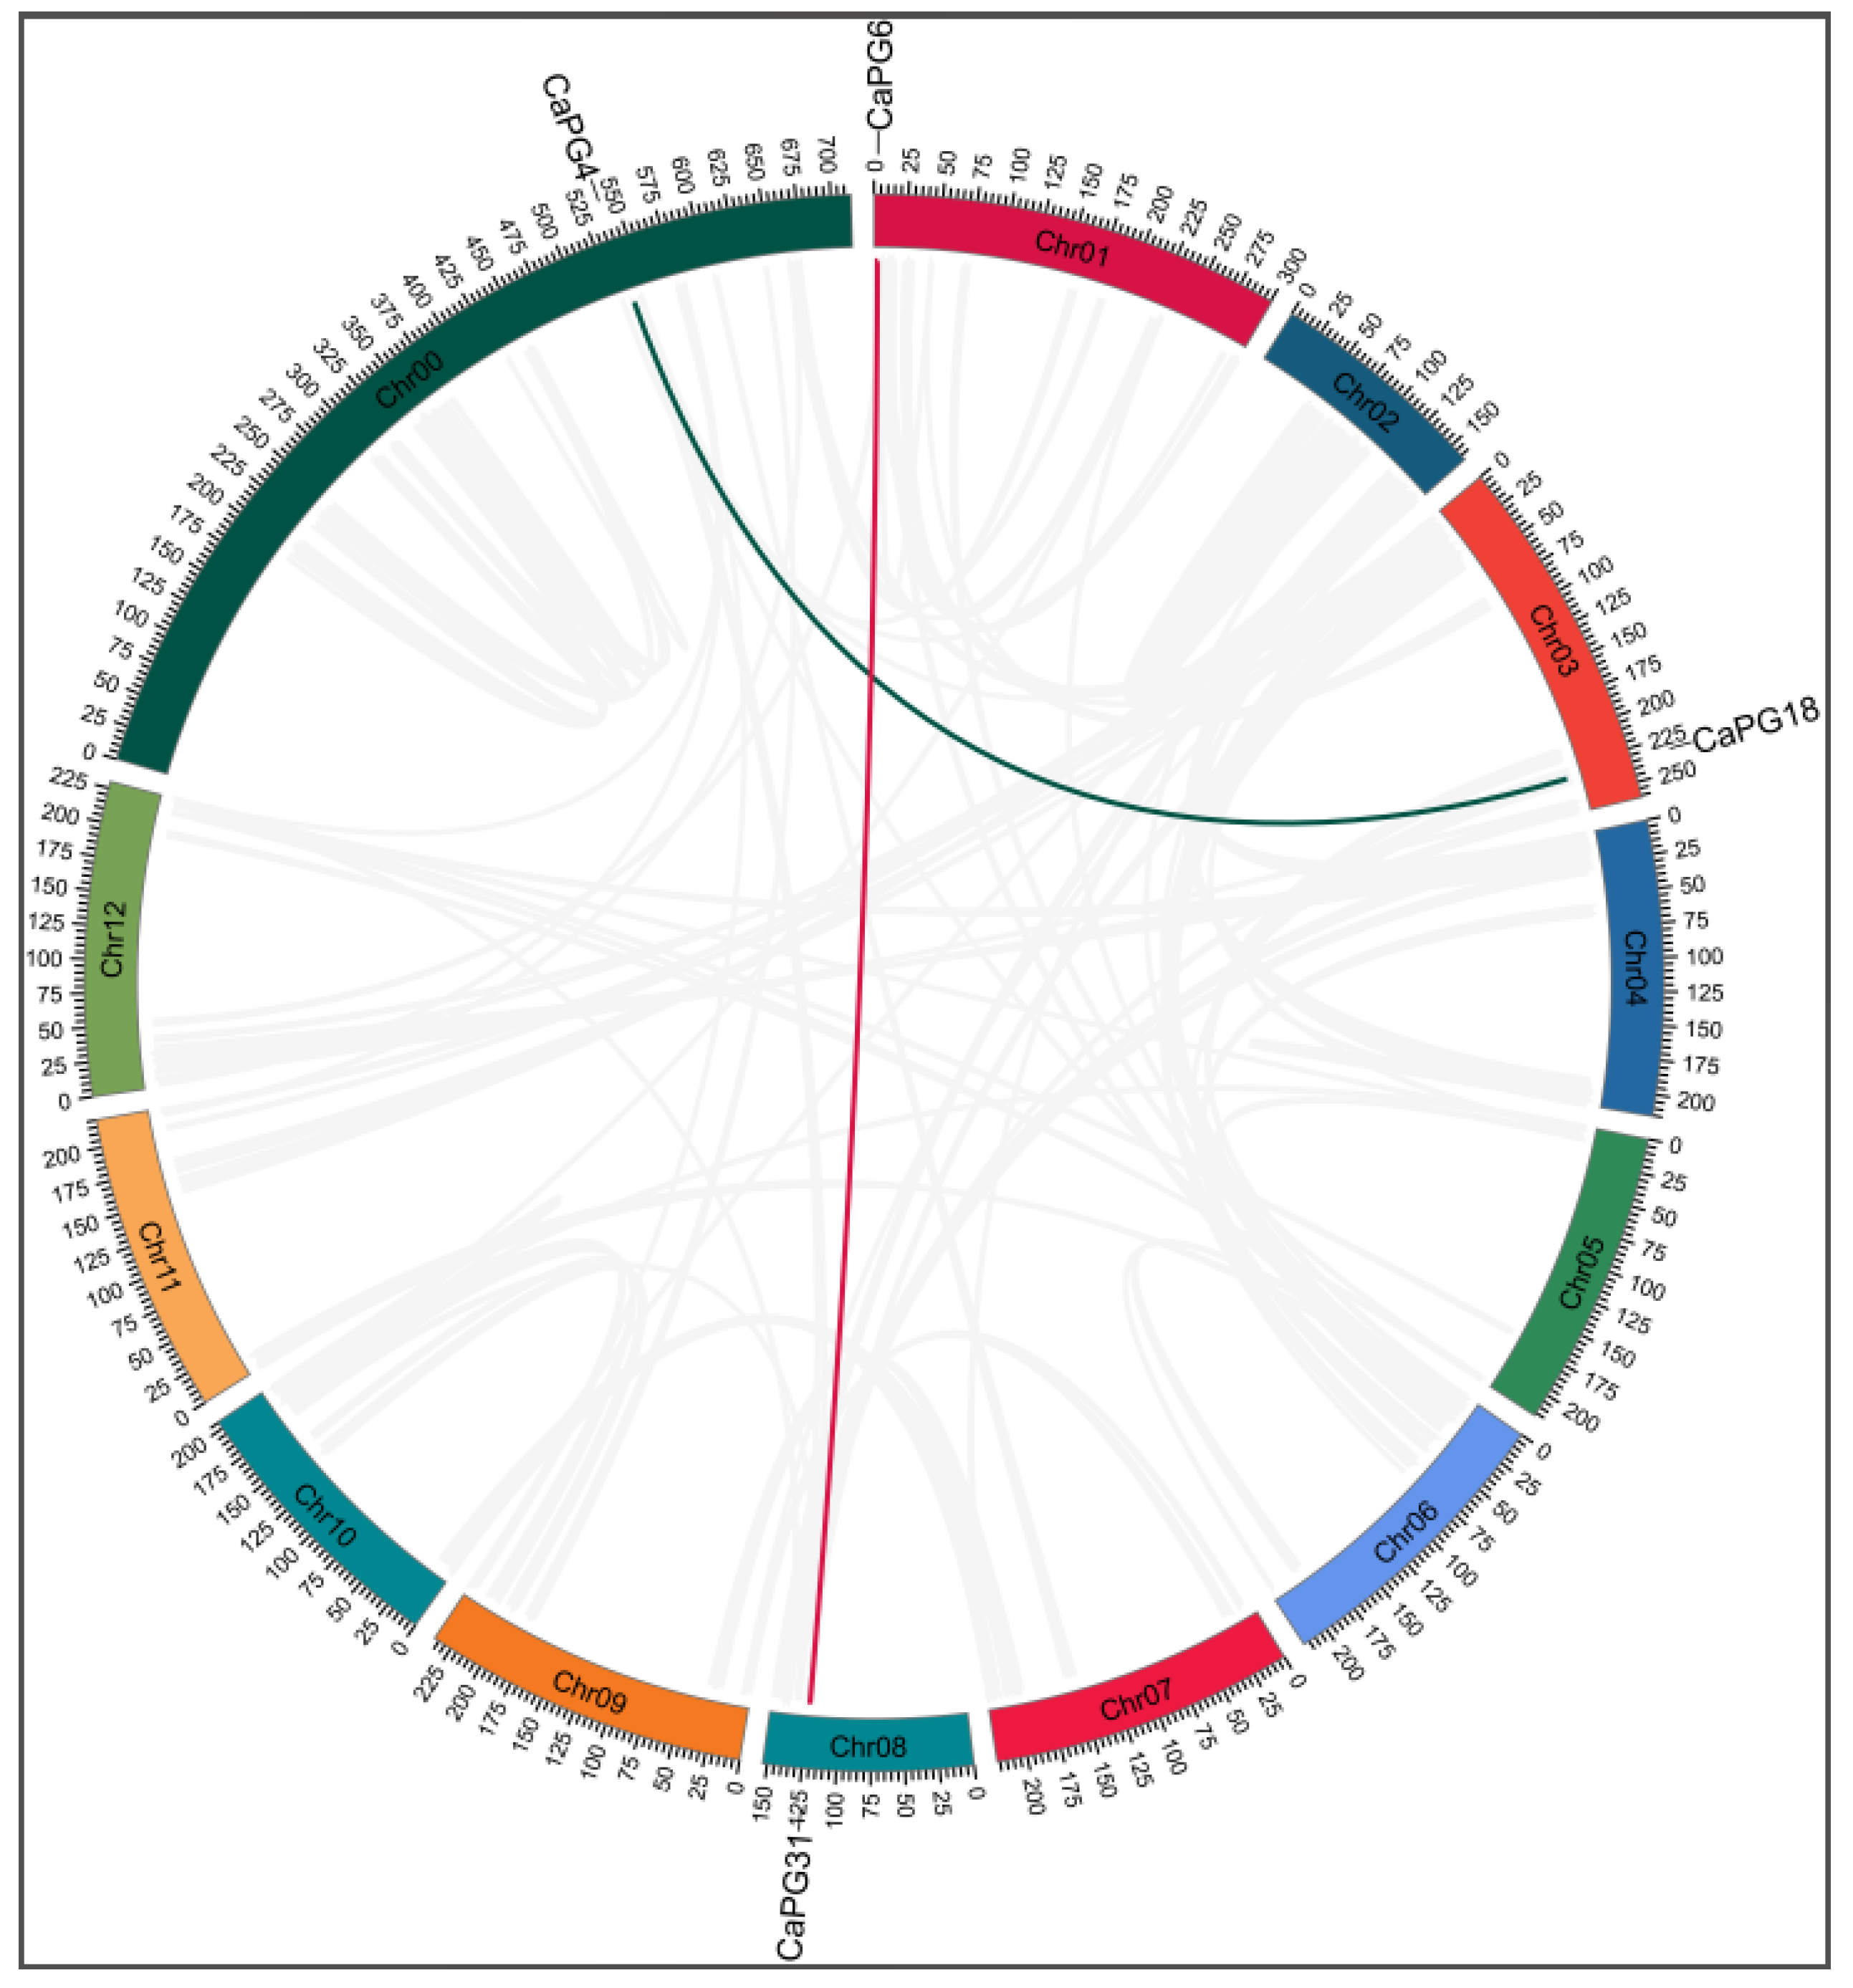
2.6. Intraspecific Collinearity Analysis of CaPG Genes

To elucidate the evolutionary history of the CaPG gene family, a collinearity analysis was performed on the Capsicum annuum genome (Figure 5). This analysis identified two distinct collinear gene pairs, CaPG4CaPG18 and CaPG6CaPG31. The findings suggest that segmental duplication events have been instrumental in the expansion and diversification of the CaPG gene family. Additionally, the presence of extensive gray lines, indicative of genome-wide duplication events, underscores the dynamic and complex evolutionary processes shaping the pepper genome.
The Ka/Ks analysis of the two collinear CaPG gene pairs (CaPG4CaPG18 and CaPG6CaPG31) demonstrated that both pairs exhibit Ka/Ks ratios significantly below 1 (0.1578 and 0.1123, respectively), indicating that they have undergone strong purifying selection to preserve functional conservation. Based on their collinear genomic locations, both pairs are classified as products of segmental duplication events (Table 2).

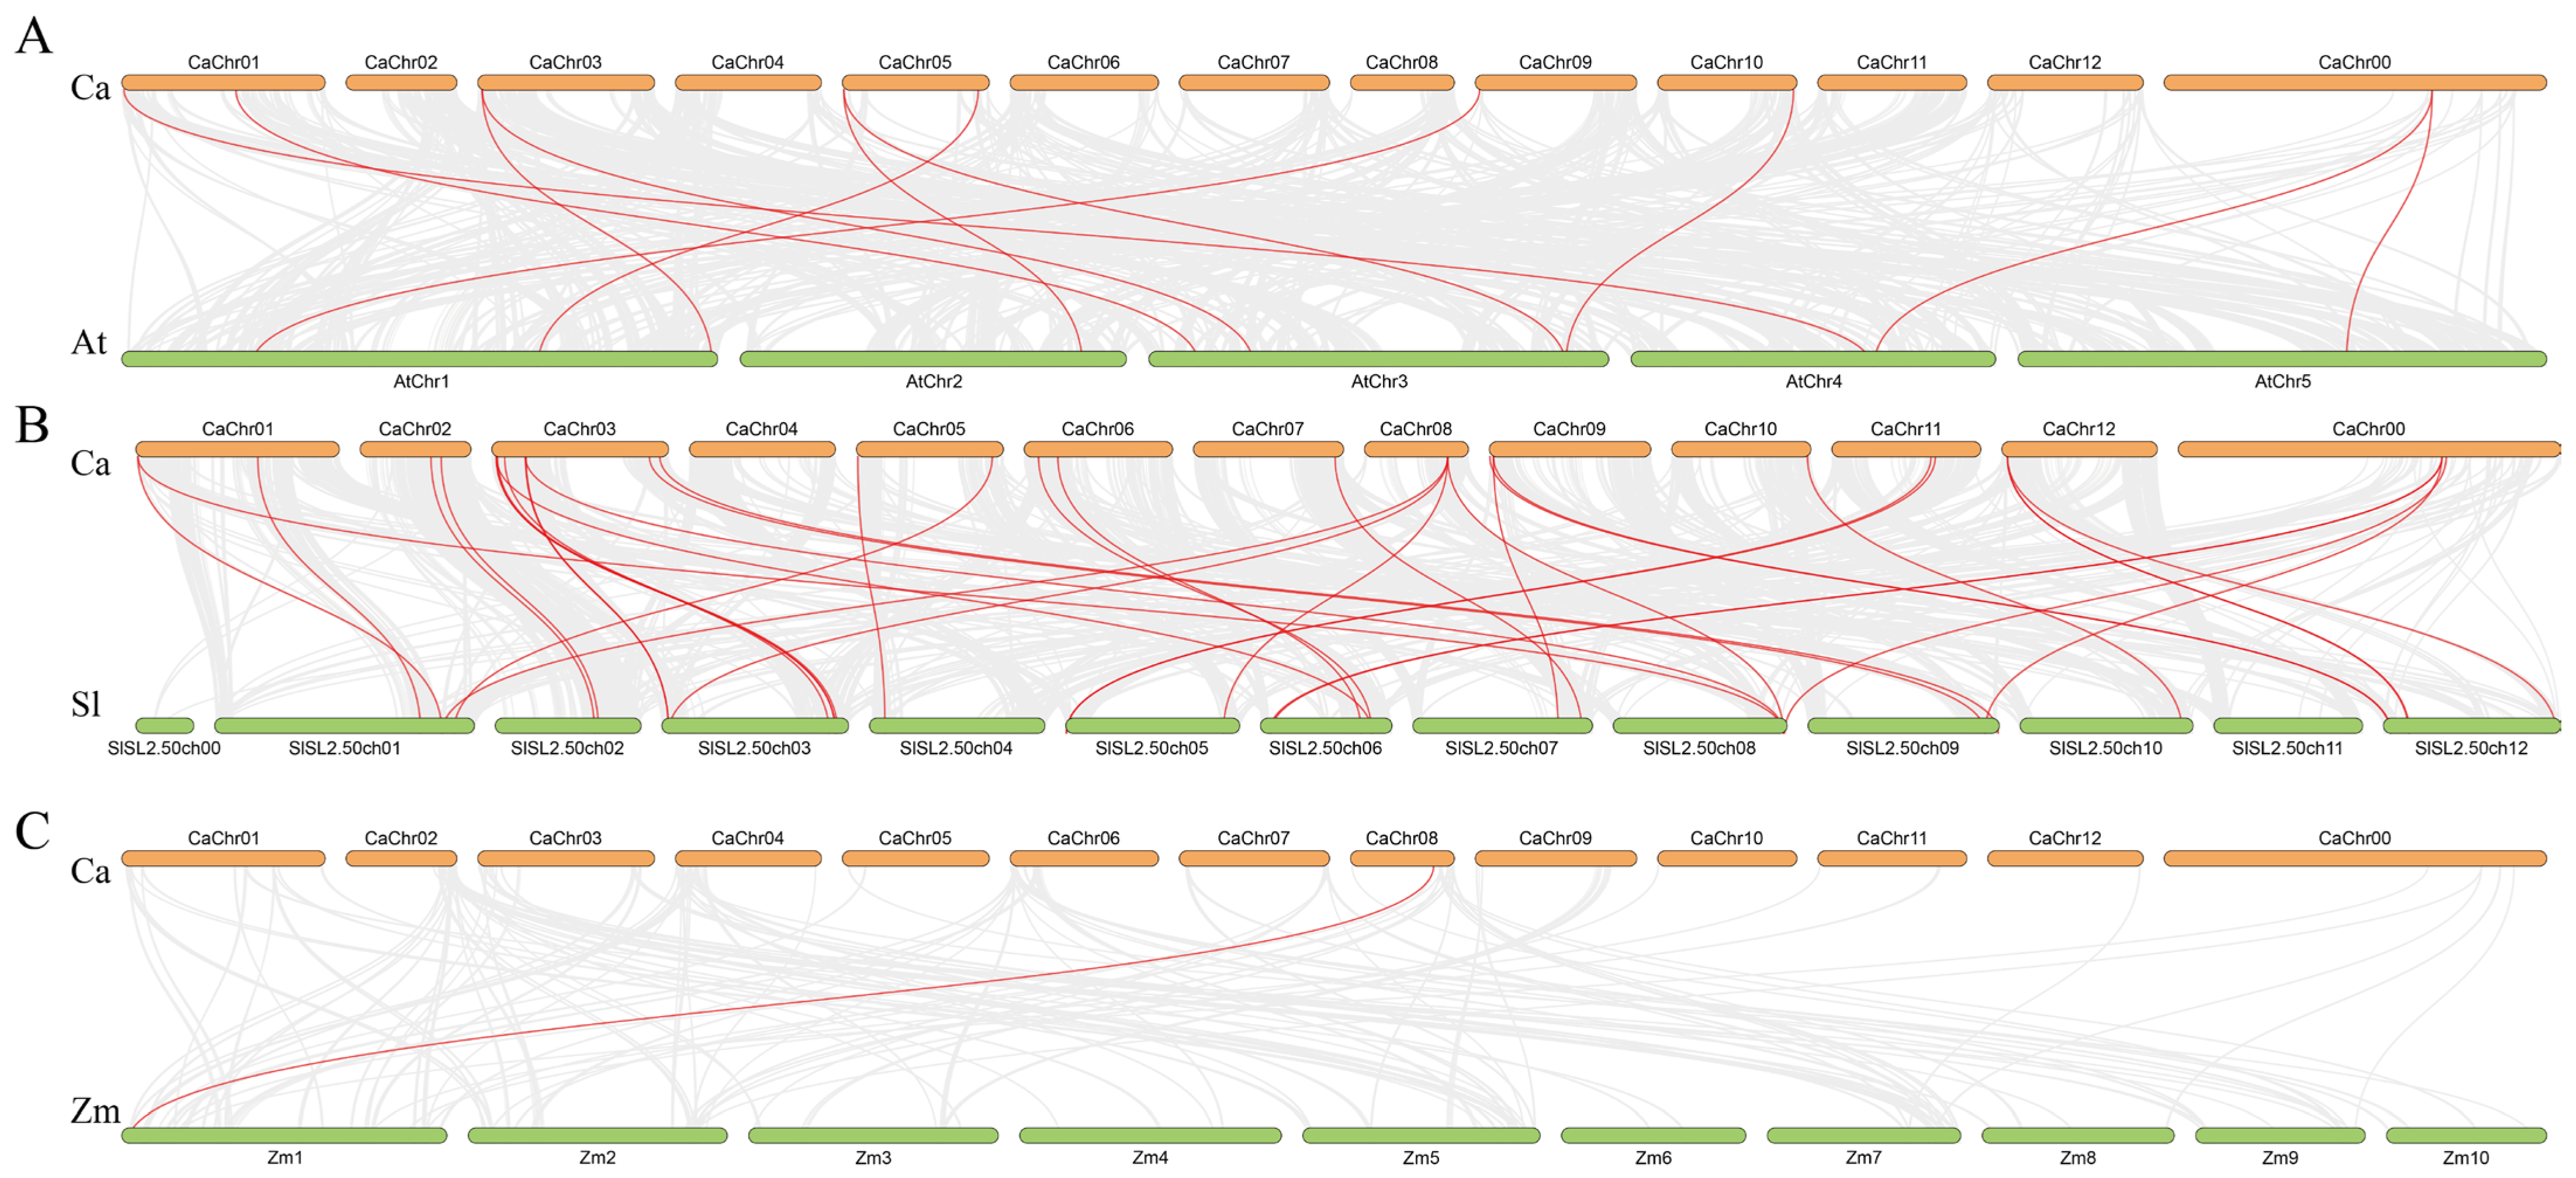
2.7. Synteny Analysis Among CaPG Genes

To investigate the evolutionary history of the CaPG gene family, we performed a comparative synteny analysis between Capsicum annuum and three other species: Arabidopsis thaliana, Solanum lycopersicum, and Zea mays (Figure 6). Our analysis identified 11 homologous gene pairs between CaPG and AtPG genes, 32 pairs between CaPG and SlPG genes, and only a single pair between CaPG and ZmPG genes. Significantly, a greater number of collinear relationships were observed with the dicotyledonous species (A. thaliana and S. lycopersicum) compared to the monocotyledonous species (Z. mays). This suggests that the expansion of the CaPG gene family likely occurred prior to the divergence of dicots and monocots, indicating a closer evolutionary relationship between CaPG genes and those of dicot species.

2.8. Expression Profiles of CaPG Genes in Different Tissues and Fruit Developmental Stages

The expression profiles of 47 CaPG genes across various tissues and developmental stages were analyzed, revealing distinct and tissue-specific transcription patterns (Figure 7, Table S2). Several genes exhibited high expression levels in specific tissues. For instance, CaPG1, CaPG7, CaPG19, CaPG20, CaPG26, CaPG31, CaPG40, and CaPG46 were predominantly expressed in the root (ZL1-Root). In contrast, CaPG3, CaPG15, CaPG35, and CaPG36 showed elevated expression in both the bud (ZL1-Bud) and flower (ZL1-Flower), with CaPG21, CaPG23, and CaPG41 being specifically upregulated in the bud. Genes such as CaPG2 and CaPG4CaPG6 were highly expressed during the early stages of fruit development (ZL1-F-Dev1 to ZL1-F-Dev7), while CaPG7 also had significant expression in the flower (ZL1-Flower). CaPG27 was notably upregulated in both the root and flower, whereas CaPG25 was predominantly expressed in the stem (ZL1-Stem). Additionally, CaPG17 and CaPG18 showed strong expression across multiple tissues and early fruit development stages (ZL1-F-Dev1 to ZL1-F-Dev4). CaPG22 exhibited consistent high expression across all tissues, while CaPG11CaPG13, CaPG28CaPG29, and CaPG34 displayed variable expression across tissues and fruit developmental stages. CaPG33 showed a progressive increase in expression from ZL1-F-Dev1 to ZL1-F-Dev5. In contrast, genes such as CaPG8, CaPG10, CaPG14, CaPG16, CaPG32, CaPG37, CaPG38, CaPG42, CaPG44, CaPG45, and CaPG47 exhibited no detectable expression in any of the tissues or developmental stages. Notably, CaPG39 was sharply upregulated in the later stages of fruit development, with a dramatic increase in expression from ZL1-F-Dev8 to ZL1-F-Dev9. These findings suggest that the CaPG gene family is involved in diverse tissue-specific and developmental stage-specific functions, highlighting the complexity of their roles in pepper plant development.

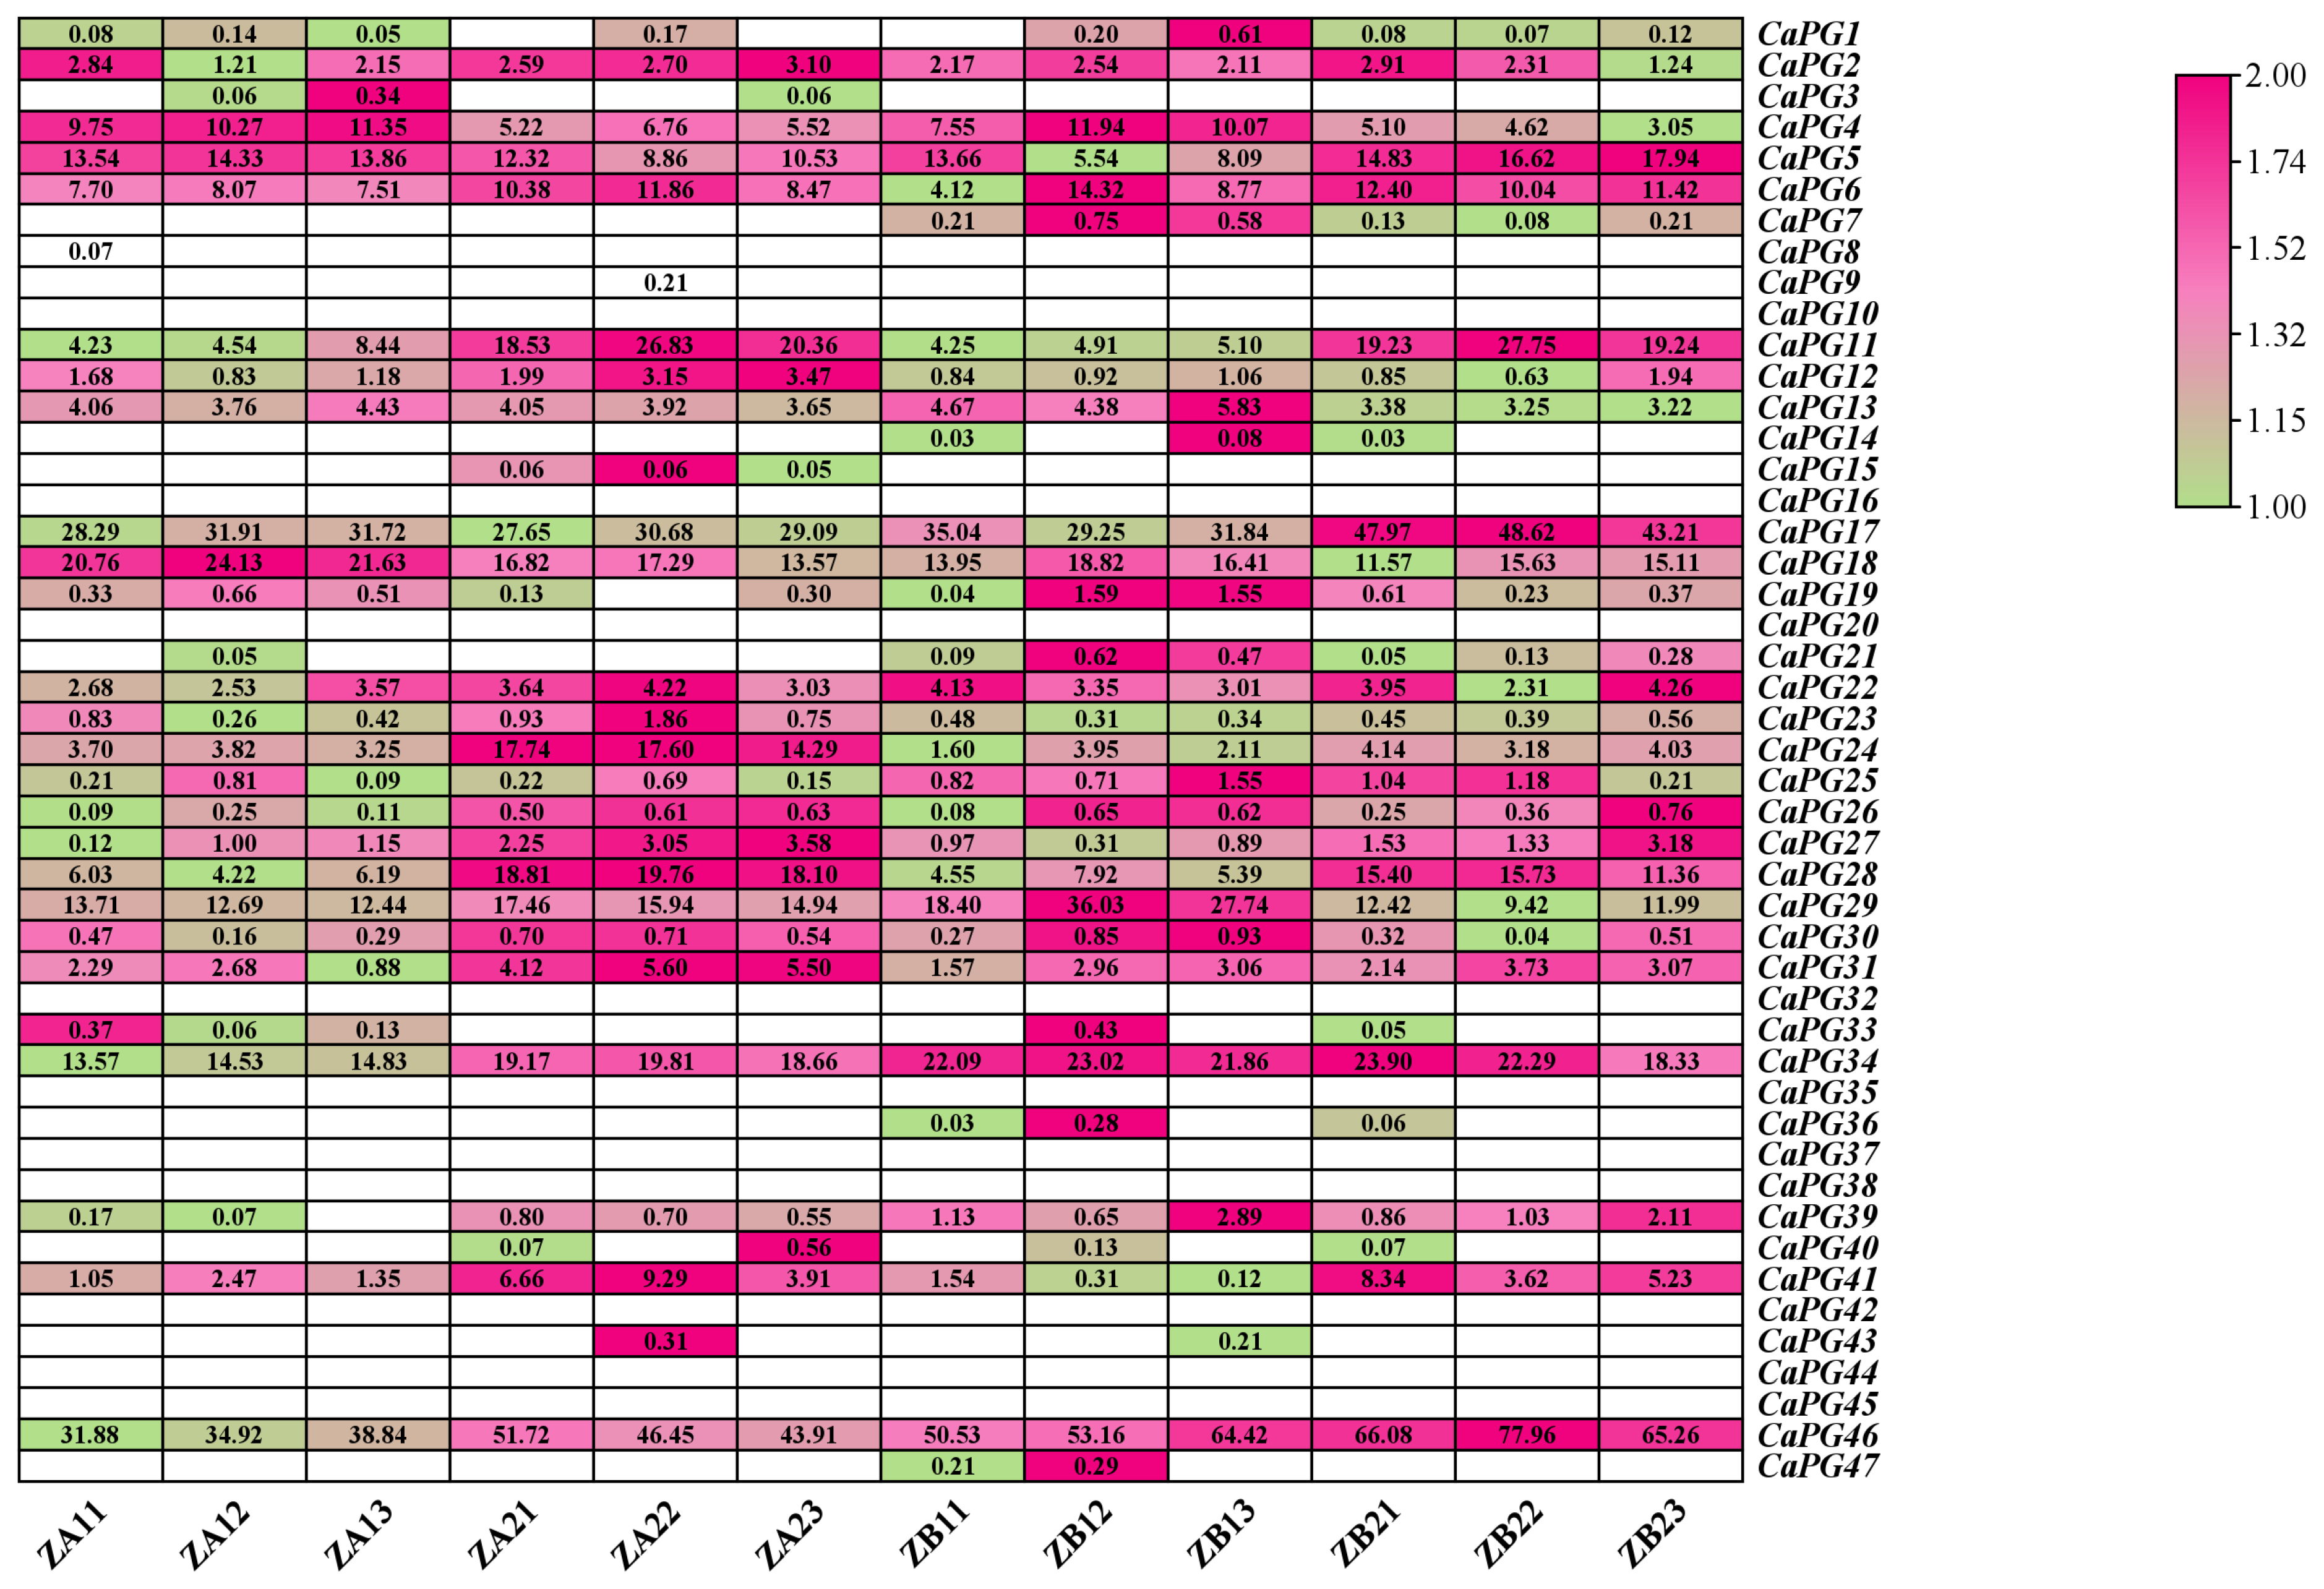
2.9. Expression Patterns of CaPG Genes Related to Pedicel Abscission Susceptibility

Analysis of the heatmap in Figure 8 revealed that 21 CaPG genes were expressed in tissues with differing susceptibility to pedicel abscission (Figure 8, Table S2). Among them, CaPG2, CaPG4, CaPG5, CaPG6, CaPG11, CaPG12, CaPG13, CaPG17, CaPG18, CaPG23, CaPG24, CaPG25, CaPG27, CaPG28, CaPG31, CaPG34, CaPG41, and CaPG46 showed differential expression between the high-susceptibility zones (ZA11–ZA13 and ZB21–ZB23) and the low-susceptibility zones (ZA21–ZA23 and ZB11–ZB13). In particular, CaPG22, CaPG29, and CaPG39 exhibited markedly higher expression levels in the low-susceptibility zones (ZA21–ZA23 and ZB11–ZB13) compared with the high-susceptibility zones (ZA11–ZA13 and ZB21–ZB23), suggesting a potential role in maintaining pedicel integrity and preventing abscission.

2.10. qRT-PCR Validation of CaPG Genes Involvement in Ethylene-Induced Pedicel Abscission

qRT-PCR analysis was performed to validate the expression patterns of 21 CaPG genes in response to ethylene treatment (Figure 9). The results showed that the transcript levels of CaPG2, CaPG22, CaPG24, CaPG29, CaPG31, CaPG34, CaPG39, and CaPG46 increased at 6 and 12 h after ethephon treatment. CaPG12 exhibited a significant upregulation at both 6 h and 12 h post-treatment. In contrast, CaPG11, CaPG17, and CaPG23 displayed a transient increase at 6 h followed by a decrease at 12 h. Similarly, CaPG6, CaPG13, CaPG25, and CaPG41 showed an initial decrease at 6 h, followed by an increase at 12 h. Meanwhile, CaPG4 and CaPG5 exhibited reduced expression at 6 h, with a significant further reduction at 12 h. In addition, CaPG18 and CaPG27 showed a marked downregulation at both 6 h and 12 h after ethephon treatment. These results suggest that multiple CaPG genes are dynamically regulated by ethylene and may play diverse roles during pedicel abscission.

3. Discussion

PGs are integral to cell wall remodeling and are intricately linked to organ abscission, fruit softening, and pathogen responses in plants [23,24,25,26]. This study presents a comprehensive genome-wide analysis of the CaPG gene family in Capsicum annuum, offering significant insights into their evolutionary characteristics, expression patterns, and potential regulatory roles in abscission zones and ethylene-induced cell separation processes. A total of 47 CaPG genes were identified within the pepper genome, which is fewer than the 68 PGs in Arabidopsis and 54 in tomato, indicating a relatively conserved expansion pattern among dicots [26,27]. Variation in molecular weights, isoelectric points, and hydrophobicity values among CaPG proteins highlights their structural diversity, potentially reflecting functional specialization across developmental and stress-responsive pathways [28,29]. Most CaPG proteins were predicted to be hydrophilic and localized primarily in the nucleus (Table 1). Phylogenetic analysis categorized CaPGs into six subfamilies (A–F), similar to classifications observed in Arabidopsis and tomato [26,27], reflecting both functional conservation and lineage-specific divergence within the Solanaceae family [30,31]. The chromosomal distribution of CaPG genes was uneven, with the largest cluster found on chromosome 3 (Figure 2), a pattern also observed in strawberry, suggesting a conserved genomic arrangement of PG genes across some dicots [32].
Gene structure and motif composition analyses revealed conserved consistent exon-intron organization and motif patterns among CaPG genes within the same clades (Figure 3). This structural conservation implies functional coherence, while the presence of long introns in genes like CaPG8 and CaPG17 may suggest regulatory complexity through alternative splicing or transcriptional modulation [33,34,35,36].
Cis-element analysis uncovered diverse hormone- and stress-responsive elements, suggesting that CaPG genes participate in a broad range of biological processes (Figure 4). These findings align with previous evidence showing PG’s involvement in fruit ripening, abscission, and stress responses [11,12,13,14,15,16,17,18].
Synteny analysis showed stronger collinearity between pepper and dicots such as Arabidopsis and tomato compared to monocots like maize (Figure 6). This supports the hypothesis that PG gene family expansion occurred before the monocot–dicot split [26,27,30] and confirms an early expansion event retained in dicot lineages.
Expression profiling demonstrated that CaPGs exhibit distinct tissue- and stage-specific expression patterns (Figure 7). For example, CaPG1, CaPG7, and CaPG26 exhibit high transcript abundance in roots, whereas CaPG35 and CaPG36 show strong expression in floral tissues. This pattern of tissue-specific expression of PGs has been associated with cell wall remodeling during growth and differentiation in other plant species [7,31,32]. Among the CaPGs involved in reproductive development, CaPG2, CaPG4, and CaPG6 exhibit peak expression during the early stages of fruit development (ZL1-F-Dev1 to ZL1-F-Dev7), which is consistent with their putative roles in pectin degradation and cell wall loosening, key events during fruit expansion and softening [30,31,32]. In contrast, CaPG39 was significantly upregulated at later stages (ZL1-F-Dev8 to ZL1-F-Dev9), suggesting an involvement in maturation-related cell wall changes and the potential activation of abscission zone cells, paralleling the role of SlPGs during tomato ripening [14]. In addition, heatmap analysis of CaPG gene expression across tissues with varying susceptibility to pedicel abscission (Figure 8, Table S2) revealed that 21 CaPG genes were differentially expressed among these tissues. Notably, CaPG genes with higher expression in easy-abscission pedicel tissues, such as CaPG22, CaPG29, and CaPG39, are likely involved in promoting cell separation at the abscission zone, whereas genes with low expression in these tissues may function to delay or suppress abscission. This spatial expression divergence indicates that CaPGs participate in the fine-tuning of pedicel abscission zone formation and activation.
Ethylene is known to regulate organ abscission [37,38]. Our qRT-PCR results showed that CaPG22, CaPG29, and CaPG39 are ethylene-responsive, with transcript levels significantly increasing after ethephon treatment. These genes may mediate ethylene-induced cell separation in the pedicel abscission zone. Particularly, CaPG39 (Capana10g002229) exhibited both strong ethylene responsiveness and late-stage upregulation, reinforcing its dual role in fruit maturation and abscission. This is in agreement with previous findings identifying CaPG39 as a candidate gene involved in fruit drop regulation in mature pepper fruit [22]. Combined with its high expression in tissues prone to abscission, CaPG39 may act as a key mediator in ethylene signaling cascades that activate cell wall degradation within the abscission zone. The distinct expression profiles of CaPGs across tissues with varying abscission susceptibility highlight their functional diversification in modulating the timing and strength of abscission. The findings indicate that modulating the expression of specific CaPG genes, particularly those associated with ethylene-induced cell separation, may serve as a genetic approach to delay or control pedicel abscission in peppers. To validate these findings, future research should prioritize functional analyses of candidate genes, including CaPG22, CaPG29, and CaPG39, employing methodologies such as gene knockout, overexpression, or CRISPR/Cas9-mediated editing. Understanding the functional roles of these genes is essential for mitigating preharvest fruit drop and enhancing the efficiency of mechanized harvesting, thereby providing significant benefits for breeding programs aimed at developing varieties that are easier to harvest.

4. Materials and Methods

4.1. Plant Growth and Treatments

Capsicum annuum cv. Zunla-1 plants were cultivated under field conditions at the Zunyi Experimental Station (N 27°44′, E 107°12′) of the Pepper Research Institute, Guizhou Academy of Agricultural Sciences. At the green mature fruit stage, healthy and uniformly growing plants were selected for ethylene treatment. To assess the ethylene responsiveness of CaPG genes, a 40% ethephon solution was diluted 100-fold with distilled water and uniformly applied to the aerial parts of the plants until runoff was achieved. Sampling was conducted at three time points: immediately before ethephon application (0 h, control), and at 6 h and 12 h post-treatment. At each time point, 30 plants were treated, and tissues from the fruit pedicel abscission zone were collected from 10 plants per biological replicate. Fruits from each group of 10 plants were pooled to form one replicate, yielding three independent biological replicates per time point. All samples were flash-frozen in liquid nitrogen and stored at −80 °C for RNA extraction.

4.2. Identification and Chromosomal Distribution of CaPG Genes

The genome assembly, protein sequences, and corresponding annotation files of Capsicum annuum (Zunla-1_v2.0) were retrieved from the Sol Genomics Network database (https://solgenomics.net/ftp/genomes/Capsicum_annuum/C.annuum_zunla/, accessed on 13 August 2024) [39]. To identify PG gene family members in C. annuum, a set of 122 previously characterized PG protein sequences—68 from A. thaliana and 54 from S. lycopersicum—were compiled as reference sequences. These reference sequences were used to construct a Hidden Markov Model (HMM) profile using HMMER v3.0. Following this, the HMM profile was employed to query the C. annuum proteome for potential PG gene family members [40]. To ensure a comprehensive identification, a complementary BLASTP alignment (NCBI-BLAST v2.10.1+) was also performed against the C. annuum protein database using the same reference PG sequences, with an E-value threshold set to 1 × 10⁻⁵. The results obtained from both the HMM and BLASTP approaches were subsequently merged to produce a unified set of candidate PG proteins. To verify the identity of these candidates, all sequences were subjected to domain architecture analysis using PfamScan (v1.6) in combination with the Pfam-A database (v33.1). Only those sequences that harbored the characteristic glycoside hydrolase family 28 domain (PF00295) were retained as bona fide members of the CaPG gene family [41]. Finally, the chromosomal positions of the identified CaPG genes were extracted from the genome annotation files and visualized using the MG2C online tool (http://mg2c.iask.in/mg2c_v2.1/, accessed on 13 August 2024) [42].

4.3. Physicochemical Properties of CaPG Proteins

The physicochemical characteristics of the predicted CaPG protein sequences were analyzed using the ProtParam tool available on the ExPASy server (http://web.expasy.org/protparam/, accessed on 15 August 2024) [43]. For each protein, parameters including amino acid length, molecular weight (MW), theoretical isoelectric point (pI), grand average of hydropathicity (GRAVY), aliphatic index, and instability index were calculated.

4.4. Subcellular Localization Prediction and Signal Peptide Analysis of CaPG Proteins

The subcellular localization of the predicted CaPG proteins was analyzed using the ProtComp tool available on the Softberry server (http://www.softberry.com/berry.phtml?topic=protcomp&group=help&subgroup=proloc, accessed on 18 August 2024) [44].

4.5. Analysis of Conserved Motifs and Gene Structures

The conserved motifs of CaPG protein sequences were identified using the MEME Suite (version 5.0.5; http://meme-suite.org/, accessed on 19 August 2024), a widely used tool for discovering statistically significant sequence motifs [45]. The analysis was conducted using the following parameters: mode set to ZOOPS (zero or one occurrence per sequence), the number of motifs limited to 15 (-nmotifs 15), and the motif width constrained between 6 and 50 amino acids (-minw 6 - maxw 50). The input sequences were analyzed in protein mode (-protein), and the output directory was designated as rea1. The resulting motifs were annotated and visualized to explore the conserved functional domains within the CaPG gene family. For gene structure analysis, the exon–intron organization of CaPG genes was examined by aligning coding sequences (CDS) with their corresponding genomic DNA sequences. The Gene Structure Display Server (GSDS; http://gsds.cbi.pku.edu.cn/, accessed on 19 August 2024) was used to generate visual representations of the gene structures, enabling the comparison of intron–exon arrangements among different family members [46].

4.6. Analysis of Promoters and Phylogeny of CaPG Genes

We extracted the sequence 2000 bp upstream of the transcription start site of the candidate PG family gene in pepper using TBtools v2.225 software [47]. These promoter sequences were then submitted to the PlantCARE database (http://bioinformatics.psb.ugent.be/webtools/plantcare/html/, accessed on 20 August 2024) to identify putative cis-acting regulatory elements, including those responsive to hormones, stresses, and developmental cues. For phylogenetic analysis, full-length amino acid sequences of the CaPG proteins were aligned using MAFFT software version 7.427 with default parameters [48]. Based on the resulting alignment, a phylogenetic tree was constructed using the Neighbor-Joining (NJ) method implemented in MEGA software (version 10). The parameters were set as follows: substitution model = p-distance, method for handling missing data = Partial Deletion, site coverage cutoff = 50%. Bootstrap analysis was performed with 1000 replicates to assess the reliability of the inferred tree topology, and bootstrap values were used to evaluate the confidence of each branch [49]. The resulting tree was further visualized and annotated using iTOL v6 (https://itol.embl.de/, accessed on 20 August 2024) to better illustrate subgroup classification and evolutionary relationships.

4.7. Collinearity Analysis and Visualization of CaPG Genes

Collinearity analysis was conducted to examine the synteny of CaPG genes both within Capsicum annuum and between Capsicum annuum and other species. The species included in the analysis were Arabidopsis thaliana (TAIR10 genome release, accessible at http://arabidopsis.org/, accessed on 21 August 2024), Solanum lycopersicum (ITAG2.4 genome release from the Sol Genomics Network), and Zea mays (B73 RefGen_v4, accessible at http://ensembl.gramene.org/Zea_mays/Info/Index, accessed on 21 August 2024). For within-species synteny analysis, the positions of CaPG genes on the chromosomes of C. annuum were determined, and the collinearity relationships were visualized using the MCScanX tool [50]. This tool was employed to detect and visualize syntenic blocks and gene duplications within the C. annuum genome, providing insights into the evolutionary conservation of PG genes within the species. To examine interspecies synteny, the corresponding CaPG gene sequences were aligned with the genomes of A. thaliana, S. lycopersicum, and Z. mays using the same tool. Visualization was performed using TBtools-Ⅱ v2.225 [47].

4.8. Tissue-Specific Expression Profiles of CaPG Genes

To investigate the expression patterns of CaPG genes in various tissues and during different developmental stages, publicly available transcriptome datasets were utilized. RNA-seq data covering a range of tissues and developmental stages of Capsicum annuum (cv. Zunla-1) were retrieved from the NCBI Gene Expression Omnibus (GEO) under accession number GSE45037. Additionally, transcriptome data related to fruit pedicel abscission were obtained from the NCBI Sequence Read Archive (SRA) under the project ID PRJNA1233832.

4.9. RT-qPCR

Total RNA was extracted from fruit pedicel abscission zone tissues using the RNAprep Pure Plant Kit (Tiangen Biotech, Beijing, China), according to the manufacturer’s instructions. The quality and concentration of RNA were assessed using a NanoDrop 2000 spectrophotometer (Thermo Fisher Scientific, Waltham, MA, USA), and RNA integrity was verified through 1.0% agarose gel electrophoresis. First-strand cDNA was synthesized from 1 μg of total RNA using the PrimeScript™ RT Reagent Kit with gDNA Eraser (TaKaRa, Dalian, China), following the manufacturer’s protocol. The synthesized cDNA was then diluted 10-fold with nuclease-free water and used as a template for RT-qPCR. Quantitative real-time PCR was conducted using TB Green® Premix Ex Taq™ II (TaKaRa, Dalian, China) on a CFX96 Real-Time PCR Detection System (Bio-Rad, Hercules, CA, USA). The 20 μL reaction system contained 10 μL TB Green Premix, 0.4 μL of each forward and reverse primer (10 μM), 2 μL of diluted cDNA, and 7.2 μL nuclease-free water. The thermal cycling conditions were as follows: 95 °C for 30 s, followed by 40 cycles of 95 °C for 5 s and 60 °C for 30 s. A melting curve analysis was performed at the end of the amplification to confirm product specificity. Gene-specific primers were designed using Primer-BLAST (https://www.ncbi.nlm.nih.gov/tools/primer-blast/, accessed on 25 August 2024) and are listed in Supplementary Table S3. The EIF5A2 gene of Capsicum annuum was used as the internal reference. Relative expression levels were calculated using the 2−ΔΔCt method [51]. Each reaction was performed with three biological replicates and three technical replicates to ensure accuracy and reproducibility.

5. Conclusions

This study identified 47 CaPG genes in Capsicum annuum ′Zunla1′ and examined their potential roles in pedicel abscission. Phylogenetic and structural analyses revealed that CaPG genes are evolutionarily conserved and closely related to homologs in Solanum lycopersicum and Arabidopsis thaliana. The expression profiling revealed tissue- and development-specific expression patterns, and 21 CaPG genes were differentially expressed in pedicel zones with varying abscission sensitivities. Following exogenous ethylene treatment, which induced pedicel abscission, qRT-PCR analysis confirmed that several CaPG genes showed altered expression, suggesting their potential involvement in the ethylene-mediated abscission process. The study identified the PG gene family across the genome, analyzed their expression patterns, and evaluated their ethylene responsiveness in pedicel abscission. It supports the idea that certain CaPG genes are regulated by ethylene and influence pedicel abscission. These findings clarify the role of PG genes in pepper abscission and lay the groundwork for future studies, such as gene editing, to explore the functions of specific CaPG genes. Overall, the results improve our understanding of PG gene function and provide insights for breeding better Capsicum cultivars.

Supplementary Materials

The following supporting information can be downloaded at https://www.mdpi.com/article/10.3390/genes16050579/s1, Table S1: List of all PGs; Table S2: The FPKM from RNA-Seq data of CaPG gene family; Table S3: List of primers used in this study.

Author Contributions

Conceptualization, L.H. and J.H.; methodology, L.H. and C.L.; software, L.H. and C.L.; validation, L.H., C.L. and S.Y.; formal analysis, L.H., P.Z. and X.Y.; investigation, L.H., W.L. and X.Y.; resources, L.H., S.Y. and W.L.; data curation, L.H., P.Z. and X.Y.; writing—original draft preparation, L.H.; writing—review and editing, J.H.; visualization, L.H.; supervision, L.H. and J.H.; project administration, L.H. and J.H.; funding acquisition, L.H. and J.H. All authors have read and agreed to the published version of the manuscript.

Funding

This research was funded by the Key Research and Development Project on Core Technologies for Mountain Agriculture in Guizhou Province (GZNYGJHX-2023008), the Guizhou Provincial Science and Technology Projects (Qiankehe Basic-ZK [2022] General 220; Qiankehepingtai ZSYS [2025]027), the National Key Research and Development Program of China (No. 2023YFD1200101), and the Key Technology Research and Development Project for the Pepper Industry in Guizhou Province.

Institutional Review Board Statement

Not applicable.

Informed Consent Statement

Not applicable.

Data Availability Statement

The raw RNA-seq data related to fruit pedicel abscission in this study have been deposited in the NCBI Sequence Read Archive under the ID number PRJNA1233832.

Conflicts of Interest

The authors declare no conflicts of interest.

References

  1. Sun, H.; Zhang, Y.; Zhang, L.; Wang, X.; Zhang, K.; Cheng, F.; Chen, S. Genetic regulation of chlorophyll biosynthesis in Pepper Fruit: Roles of CaAPRR2 and CaGLK2. Genes 2025, 16, 219. [Google Scholar] [CrossRef] [PubMed]
  2. Liu, Z.; Yang, C.; He, J.; Zhang, L.; Xing, X.; Zhang, K.; Yu, H.; Zhang, Z.; Wu, H.; Cheng, F.; et al. Characterization of metabolites and transcriptome of Pepper accessions from four southern provinces of China. Genes 2025, 16, 137. [Google Scholar] [CrossRef] [PubMed]
  3. Hewitt, S.; Kilian, B.; Koepke, T.; Abarca, J.; Whiting, M.; Dhingra, A. Transcriptome analysis reveals potential mechanisms for ethylene-inducible pedicel-Fruit abscission zone activation in non-climacteric sweet cherry (Prunus avium L.). Horticulturae 2022, 7, 270. [Google Scholar] [CrossRef]
  4. Hasan, A.M.; Lakhwani, D.; Pathak, S.; Gupta, P.; Bag, S.K.; Nath, P.; Trivedi, P. K Transcriptome analysis of ripe and unripe fruit tissue of banana identifies major metabolic networks involved in fruit ripening process. BMC Plant Biol. 2014, 14, 316. [Google Scholar] [CrossRef]
  5. Meir, S.; Philosoph-Hadas, S.; Sundaresan, S.; Selvaraj, K.S.V.; Burd, S.; Ophir, R.; Kochanek, B.; Reid, M.S.; Jiang, C.Z.; Lers, A. Microarray analysis of the abscission-related transcriptome in the tomato flower abscission zone in response to auxin depletion. Plant Physiol. 2010, 154, 785–797. [Google Scholar] [CrossRef]
  6. Liu, X.; Cheng, L.; Li, R.; Cai, Y.; Wang, X.; Fu, X.; Dong, X.; Qi, M.; Jiang, C.-Z.; Xu, T.; et al. The HD-Zip transcription factor SlHB15A regulates abscission by modulating jasmonoyl-isoleucine biosynthesis. Plant Physiol. 2022, 190, 1800–1814. [Google Scholar] [CrossRef]
  7. Qi, X.X.; Hu, S.; Zhou, H.S.; Liu, X.; Wang, L.F.; Zhao, B.Y.; Huang, X.S.; Zhang, S.L. A MADS-box transcription factor of Kuerle xiangli (Pyrus sinkiangensis Yu) PsJOINTLESS gene functions in floral organ abscission. Gene 2017, 621, 13–20. [Google Scholar] [CrossRef]
  8. Yi, J.W.; Wang, Y.; Ma, X.S.; Zhang, J.Q.; Zhao, M.L.; Huang, X.M.; Li, J.G.; Hu, G.B.; Wang, H.C. LcERF2 modulates cell wall metabolism by directly targeting a UDP-glucose-4-epimerase gene to regulate pedicel development and fruit abscission of litchi. Plant J. 2021, 106, 620–635. [Google Scholar] [CrossRef]
  9. Lee, Y.S.; Do, V.G.; Kim, S.; Kweon, H.; McGhie, T.K. Cold stress triggers premature fruit abscission through ABA-dependent signal transduction in early developing apple. PLoS ONE 2021, 16, e0248887. [Google Scholar] [CrossRef]
  10. Yang, Z.Q.; Zhong, X.M.; Fan, Y.; Wang, H.C.; Li, J.G.; Huang, X.M. Burst of reactive oxygen species in pedicel-mediated fruit abscission after carbohydrate supply was cut off in longan (Dimocarpus longan). Front. Plant Sci. 2015, 6, 833. [Google Scholar] [CrossRef]
  11. Costa, F.; Peace, C.P.; Stella, S.; Musacchi, S.; Bazzani, M.; Sansavini, S.; Weg, W.E.V.D. QTL dynamics for fruit firmness and softening around an ethylene-dependent polygalacturonase gene in apple (Malus × domestica Borkh.). J. Exp. Bot. 2010, 61, 4301–4313. [Google Scholar] [CrossRef] [PubMed]
  12. Paniagua, C.; Ric-Varas, P.; A García-Gago, J.; López-Casado, G.; Blanco-Portales, R.; Muñoz-Blanco, J.; Schückel, J.; Knox, J.P.; Matas, A.J.; A Quesada, M.; et al. Elucidating the role of polygalacturonase genes in strawberry fruit softening. J. Exp. Bot. 2020, 71, 5107–5121. [Google Scholar] [CrossRef] [PubMed]
  13. Zhang, S.L.; Ma, M.; Zhang, H.P.; Zhang, S.L.; Qian, M.; Zhang, Z.; Luo, W.Q.; Fan, J.B.; Liu, Z.Q.; Wang, L.B. Genome-wide analysis of polygalacturonase gene family from pear genome and identification of the member involved in pear softening. BMC Plant Biol. 2019, 19, 587. [Google Scholar] [CrossRef] [PubMed]
  14. Nie, H.M.; Shi, Y.; Geng, X.Q.; Xing, G.M. CRISPR/Cas9-mediated targeted mutagenesis of tomato polygalacturonase gene (SlPG) delays fruit softening. Front. Plant Sci. 2022, 13, 834018. [Google Scholar] [CrossRef]
  15. Roongsattham, P.; Morcillo, F.; Jantasuriyarat, C.; Pizot, M.; Moussu, S.; Jayaweera, D.; Collin, M.; Gonzalez-Carranza, Z.H.; Amblard, P.; Tregear, J.W.; et al. Temporal and spatial expression of polygalacturonase gene family members reveals divergent regulation during fleshy fruit ripening and abscission in the monocot species oil palm. BMC Plant Biol. 2012, 12, 150. [Google Scholar] [CrossRef]
  16. Kim, J.; Patterson, S.E. Expression divergence and functional redundancy of polygalacturonases in floral organ abscission. Plant Signal. Behav. 2009, 4, 1180–1182. [Google Scholar] [CrossRef]
  17. Ge, T.; Huang, X.; Pan, X.T.; Zhang, J.; Xie, R.J. Genome-wide identification and expression analysis of citrus fruitlet abscission-related polygalacturonase genes. 3 Biotech 2019, 9, 250. [Google Scholar] [CrossRef]
  18. Taylor, J.E.; Tucker, G.A.; Lasslett, Y.; Smith, C.J.; Arnold, C.M.; Watson, C.F.; Schuch, W.; Grierson, D.; Roberts, J.A. Polygalacturonase expression during leaf abscission of normal and transgenic tomato plants. Planta 2013, 238, 743–754. [Google Scholar] [CrossRef]
  19. Ahmed, S.S.; Gong, Z.H.; Khan, M.A.; Yin, Y.X.; Guo, W.L.; Imran, J. Activity and expression of polygalacturonase vary at different fruit ripening stages of sweet pepper cultivars. Genet. Mol. Res. 2011, 10, 3275–3290. [Google Scholar] [CrossRef]
  20. Li, P.P.; Zhang, R.H.; Zhou, H.D.; Mo, Y.R.; Wu, S.; Zhang, X.; Xie, Z.H.; Zhang, T.Y.; Zhao, K.; LV, J.H.; et al. Melatonin delays softening of postharvest pepper fruits (Capsicum annuum L.) by regulating cell wall degradation, membrane stability and antioxidant systems. Postharvest Biol. Technol. 2024, 212, 112852. [Google Scholar] [CrossRef]
  21. Li, Z.D.; Zhao, W.T.; Wang, P.; Zhao, S.; Wang, D.; Zhao, X.Y. Transcriptome analysis integrated with changes in cell wall polysaccharides of different fresh-cut chili pepper cultivars during storage reveals the softening mechanism. Food Chem. 2024, 452, 139445. [Google Scholar] [CrossRef] [PubMed]
  22. Hu, F.; Dong, J.C.; Zhang, S.B.; Song, Z.; Guan, W.D.; Yuan, F.C.; Zhong, J.; Liu, J.; Hu, K.L.; Cheng, J.W. Fine mapping and gene silencing pinpoint Capana10g002229 as a strong candidate gene regulating the deciduous character of ripe pepper fruit (Capsicum spp.). Theor. Appl. Genet. 2023, 136, 107. [Google Scholar] [CrossRef]
  23. Jiang, F.L.; Lopez, A.; Jeon, S.; Freitas, S.T.D.; Yu, Q.H.; Wu, Z.; Labavitch, J.M.; Tian, S.; Powell, A.L.T.; Mitcham, E. Disassembly of the fruit cell wall by the ripening-associated polygalacturonase and expansin influences tomato cracking. Hortic. Res. 2019, 6, 17. [Google Scholar] [CrossRef]
  24. Jiang, C.Z.; Lu, F.; Imsabai, W.; Meir, S.; Reid, M.S. Silencing polygalacturonase expression inhibits tomato petiole abscission. J. Exp. Bot. 2008, 59, 973–979. [Google Scholar] [CrossRef]
  25. Ferrari, S.; Galletti, R.; Pontiggia, D.; Manfredini, C.; Lionetti, V.; Bellincampi, D.; Cervone, F.; Lorenzo, G.D.G. Transgenic expression of a fungal endo-polygalacturonase increases plant resistance to pathogens and reduces auxin sensitivity. Plant Physiol. 2008, 146, 669–681. [Google Scholar] [CrossRef]
  26. González-Carranza, Z.H.; Elliott, K.A.; Roberts, J.A. Expression of polygalacturonases and evidence to support their role during cell separation processes in Arabidopsis thaliana. J. Exp. Bot. 2007, 58, 3719–3730. [Google Scholar] [CrossRef]
  27. Ke, X.B.; Wang, H.S.; Li, Y.; Zhu, B.; Zang, Y.X.; He, Y.; Cao, J.S.; Zhu, Z.J.; Yu, Y.J. Genome-wide identification and analysis of polygalacturonase genes in Solanum lycopersicum. Int. J. Mol. Sci. 2018, 19, 2290. [Google Scholar] [CrossRef]
  28. Kozlowski, L.P. Proteome-pI 2.0: Proteome isoelectric point database update. Nucleic Acids Res. 2021, 49, D407–D412. [Google Scholar] [CrossRef]
  29. Loell, K.; Nanda, V. Marginal protein stability drives subcellular proteome isoelectric point. Proc. Natl. Acad. Sci. USA 2018, 115, E7704–E7713. [Google Scholar] [CrossRef]
  30. Lu, L.; Hou, Q.C.; Wang, L.L.; Zhang, T.Y.; Zhao, W.; Yan, T.W.; Zhao, L.N.; Li, J.P.; Wan, X.Y. Genome-wide identification and characterization of polygalacturonase gene family in maize (Zea mays L.). Int. J. Mol. Sci. 2021, 22, 10722. [Google Scholar] [CrossRef]
  31. He, P.W.; Zhang, J.Z.; Lv, Z.F.; Cui, P.; Xu, X.M.; George, M.S.; Lu, G.Q. Genome-wide identification and expression analysis of the polygalacturonase gene family in sweetpotato. BMC Plant Biol. 2023, 23, 300. [Google Scholar] [CrossRef] [PubMed]
  32. Zhao, M.T.; Hu, R.X.; Lin, Y.X.; Yang, Y.Q.; Chen, Q.; Li, M.Y.; Zhang, Y.; Zhang, Y.T.; Wang, Y.; He, W.; et al. Genome-wide analysis of polygalacturonase gene family reveals its role in strawberry softening. Plants 2024, 13, 1838. [Google Scholar] [CrossRef] [PubMed]
  33. Parra, G.; Bradnam, K.; Rose, A.B.; Korf, I. Comparative and functional analysis of intron-mediated enhancement signals reveals conserved features among plants. Nucleic Acids Res. 2011, 39, 8403–8415. [Google Scholar] [CrossRef] [PubMed]
  34. Ressayre, A.; Glémin, S.; Montalent, P.; Serre-Giardi, L.; Dillmann, C.; Joets, J. Introns structure patterns of variation in nucleotide composition in Arabidopsis thaliana and rice protein-coding genes. Genome Biol. Evol. 2015, 7, 3263–3276. [Google Scholar] [CrossRef]
  35. Godoy Herz, M.A.; Kornblihtt, A.R. Alternative splicing and transcription elongation in plants. Front. Plant Sci. 2019, 10, 1123. [Google Scholar] [CrossRef]
  36. Reddy, A.S.N.; Marquez, Y.; Kalyna, M.; Barta, A. Complexity of the alternative splicing landscape in plants. Plant Cell 2013, 25, 1630–1653. [Google Scholar] [CrossRef]
  37. Meir, S.; Philosoph-Hadas, S.; Riov, J.; Tucker, M.L.; Patterson, S.E.; Roberts, J.A. Re-evaluation of the ethylene-dependent and -independent pathways in the regulation of floral and organ abscission. J. Exp. Bot. 2019, 70, 2887–2899. [Google Scholar] [CrossRef]
  38. Wang, G.Q.; Wei, P.C.; Tan, F.; Yu, M.; Zhang, X.Y.; Chen, Q.J.; Wang, X.C. The Transcription factor AtDOF4.7 is involved in ethylene- and IDA-mediated organ abscission in Arabidopsis. Front. Plant Sci. 2016, 7, 1833. [Google Scholar] [CrossRef]
  39. Qin, C.; Yu, C.S.; Shen, Y.O.; Fang, X.D.; Chen, L.; Min, J.M.; Cheng, J.W.; Zhao, S.C.; Xu, M.; Luo, Y.; et al. Whole-genome sequencing of cultivated and wild peppers provides insights into Capsicum domestication and specialization. Proc. Natl. Acad. Sci. USA 2014, 111, 5135–5140. [Google Scholar] [CrossRef]
  40. Potter, S.C.; Luciani, A.; Eddy, S.R.; Park, Y.; Lopez, R.; Finn, R.D. HMMER web server: 2018 update. Nucleic Acids Res. 2018, 46, W200–W204. [Google Scholar] [CrossRef]
  41. Finn, R.D.; Bateman, A.; Clements, J.; Coggill, P.; Eberhardt, R.Y.; Eddy, S.R.; Heger, A.; Hetherington, K.; Holm, L.; Mistry, J.; et al. Pfam: The protein families database. Nucleic Acids Res. 2014, 42, D222–D230. [Google Scholar] [CrossRef]
  42. Chao, J.M.; Li, Z.Y.; Sun, Y.H.; Aluko, O.O.; Wu, X.R.; Wang, Q.; Liu, G.S. MG2C: A user-friendly online tool for drawing genetic maps. Mol. Hortic. 2021, 1, 16. [Google Scholar] [CrossRef] [PubMed]
  43. Wen, J.; Deng, M.; Zhao, K.; Zhou, H.; Wu, R.; Li, M.; Cheng, H.; Li, P.; Zhang, R.; Lv, J. Characterization of plant homeodomain transcription factor genes involved in flower development and multiple abiotic stress response in pepper. Genes 2023, 14, 1737. [Google Scholar] [CrossRef] [PubMed]
  44. Zhao, Q.; Chen, H.; Zhang, D.; Ma, J.J. Ectopic expression of the apple cytokinin response regulator MdRR9 gene in tomatoes promotes shoot branching. Scientia Hortic. 2023, 321, 112228. [Google Scholar] [CrossRef]
  45. Bailey, T.L.; Boden, M.; Buske, F.A.; Grant, C.E.; Clementi, L.; Ren, J.Y.; Li, W.W.; Noble, W.S. MEME SUITE: Tools for motif discovery and searching. Nucleic Acids Res. 2009, 37, W202–W208. [Google Scholar] [CrossRef]
  46. Gu, H.J.; Feng, W.X.; Mehari, T.G.; Wang, Y.F.; Wang, Z.Y.; Xu, Y.F.; Zhao, Y.Z.; Tang, J.F.; Zhang, K.; Zhou, Z.T.; et al. Genome-wide analysis and functional validation of the cotton FAH gene family for salt stress. BMC Genom. 2025, 26, 271. [Google Scholar] [CrossRef]
  47. Chen, C.J.; Wu, Y.; Li, J.W.; Wang, X.; Zeng, Z.H.; Xu, J.; Liu, Y.L.; Feng, J.T.; Chen, H.; He, Y.H.; et al. TBtools-II: A “One for All, All for One” Bioinformatics Platform for Biological Big-DataMining. Mol. Plant 2023, 16, 1733–1742. [Google Scholar] [CrossRef]
  48. Katoh, K.; Standley, D.M. MAFFT Multiple Sequence Alignment Software Version 7: Improvements in performance and usability. Mol. Biol. Evol. 2013, 30, 772–780. [Google Scholar] [CrossRef]
  49. Kumar, S.; Nei, M.; Dudley, J.; Tamura, K. MEGA: A biologist-centric software for evolutionary analysis of DNA and protein sequences. Brief. Bioinform. 2008, 9, 299–306. [Google Scholar] [CrossRef]
  50. Wang, Y.P.; Tang, H.B.; Wang, X.Y.; Sun, Y.; Joseph, P.V.; Paterson, A.H. Detection of colinear blocks and synteny and evolutionary analyses based on utilization of MCScanX. Nat. Protoc. 2024, 19, 2206–2229. [Google Scholar] [CrossRef]
  51. Livak, K.J.; Schmittgen, T.D. Analysis of relative gene expression data using real-time quantitative PCR and the 2−ΔΔCT method. Methods 2001, 25, 402–408. [Google Scholar] [CrossRef]
Figure 1. Phylogenetic tree of the Capsicum annuum, Solanum lycopersicum, and Arabidopsis thaliana PG family. A phylogenetic tree was generated based on Neighbor-Joining (NJ) analysis, utilizing 1000 bootstrap replicates for accuracy. According to the tree, all PGs were divided into seven groups (AG).
Genes 16 00579 g001
Figure 2. Chromosome location of CaPG genes in pepper.
Genes 16 00579 g002
Figure 3. Phylogenetic relationships, gene structures, and conserved protein motifs of CaPGs. (A) A phylogenetic tree of CaPGs was constructed using the maximum likelihood method in MEGA, based on 1000 bootstrap replicates. (B) Exon–intron structures of CaPG genes are shown, where orange boxes represent exons and black lines represent introns. (C) The distribution of conserved motifs within the CaPG proteins is illustrated, with each of the 15 motifs indicated by differently colored boxes.
Genes 16 00579 g003
Figure 4. Distribution of cis-acting elements in the CaPG gene family. Forty-nine cis-acting element types were grouped into three categories. The grid numbers show element counts, with colors from light blue to red indicating higher quantities.
Genes 16 00579 g004
Figure 5. Collinearity analysis of CaPG genes in Capsicum annuum. Red and green lines represent collinear relationships between CaPG gene pairs (CaPG4CaPG18 and CaPG6CaPG31), while gray lines denote genome-wide duplication events.
Genes 16 00579 g005
Figure 6. Collinearity analysis plot of Capsicum annuum with Arabidopsis thaliana, Solanum lycopersicum, and Zea mays. (A) Capsicum annuum and Arabidopsis thaliana. (B) Capsicum annuum and Solanum lycopersicum. (C) Capsicum annuum and Zea mays. Collinear blocks are marked with gray lines, while collinear gene pairs with PG genes are highlighted with red lines.
Genes 16 00579 g006
Figure 7. Expression profiles of CaPG genes across diverse tissues and fruit development stages in Capsicum annuum. RNA-seq data from root, stem, leaf, bud, flower, and fruit tissues were analyzed to determine transcript abundance. Fruit development was divided into nine stages: five early stages (ZL1-Dev1–ZL1-Dev5: 0–1 cm, 1–3 cm, 3–4 cm, 4–5 cm, and mature green), the breaker stage (ZL1-Dev6: color transition), and three post-breaker stages (ZL1-Dev7–ZL1-Dev9: 3, 5, and 7 days after breaker). Expression levels (FPKM) were log2-transformed, and a heatmap was generated using TBtools-Ⅱ v2.225. High and low transcript levels are represented by magenta and green, respectively; white indicates no detectable expression.
Genes 16 00579 g007
Figure 8. Heatmap of CaPG genes expression in tissues with contrasting susceptibility to pedicel abscission. RNA-seq data were used to examine CaPG transcript levels in samples from high-susceptibility zones (ZA11–ZA13, ZB21–ZB23) versus low-susceptibility zones (ZB11–ZB13, ZA21–ZA23). Expression values (FPKM) were log2-transformed, and the heatmap was generated with TBtools-Ⅱ. Magenta denotes high expression; green, low expression; and white, no detectable expression.
Genes 16 00579 g008
Figure 9. qRT-PCR analysis of 21 CaPG genes in the pedicel abscission zone following ethephon treatment. Transcript levels were measured at 0 h (control), 6 h, and 12 h after ethephon application. Data are presented as means ± SD of three biological replicates. Statistical significance compared with 0 h: * p ≤ 0.05; ** p ≤ 0.005; *** p ≤ 0.0005; **** p ≤ 0.0001; ns, not significant.
Genes 16 00579 g009
Table 1. List of the 47 CaPG genes identified in this study.
Gene NameGene IDAmino Acid
Number
Molecular Weight
(Da)
Theoretical
pI
Instability IndexAliphatic IndexAverage of Hydropathicity (GRAVY)Subcellular
Localization
CaPG1Capana00g00031847151,283.655.6655.7278.43−0.179chloroplast
CaPG2Capana00g00160146049,752.135.4332.5585.17−0.162cytoplasm
CaPG3Capana00g00326733735,659.786.5239.7989.38−0.059extracellular matrix
CaPG4Capana00g00327040343,430.895.5438.8685.780.049cytoplasm
CaPG5Capana00g00340744348,502.598.9234.1890.61−0.095tonoplast
CaPG6Capana01g00018648453,203.55.538.5988.82−0.095chloroplast
CaPG7Capana01g00261842747,497.989.4326.2585.36−0.353chloroplast
CaPG8Capana01g00282627529,680.375.246.9882.22−0.167cytoplasm
CaPG9Capana02g00096638941,790.448.6134.0586.68−0.125nucleus
CaPG10Capana02g00132439642,839.47.1835.3885.13−0.067extracellular matrix
CaPG11Capana03g00042839243,288.718.8242.7385.480.026chloroplast
CaPG12Capana03g00043538841,598.448.5938.9790.67−0.059nucleus
CaPG13Capana03g00056435339,730.856.6641.4587.99−0.399cytoskeleton
CaPG14Capana03g00108652557,077.337.838.9893.330.022cytoplasm
CaPG15Capana03g00214435738,892.435.3536.7988.99−0.045cytoplasm
CaPG16Capana03g00217131334,204.045.3536.489.07−0.02cytoplasm
CaPG17Capana03g00312045350,599.638.8348.5186.47−0.201cytoplasm
CaPG18Capana03g00366537440,615.515.3939.7387.51−0.079chloroplast
CaPG19Capana03g00421845249,398.244.9738.0978.45−0.312extracellular matrix
CaPG20Capana04g00223039242,882.999.831.4774.82−0.215nucleus
CaPG21Capana04g00223139442,274.848.7134.4680.66−0.124nucleus
CaPG22Capana05g00010853559,457.055.6225.2973.57−0.741nucleus
CaPG23Capana05g00088449253,276.094.9653.5177.83−0.211nucleus
CaPG24Capana05g00103348853,375.75.4137.890.7−0.096endoplasmic reticulum
CaPG25Capana05g00202226528,432.098.194773.51−0.217chloroplast
CaPG26Capana05g00217143446,785.26.6951.1475.74−0.149nucleus
CaPG27Capana06g00114130033,023.99.2840.0184.1−0.065nucleus
CaPG28Capana06g00174638642,390.749.0841.2798.420.003cytoplasm
CaPG29Capana07g00074437542,090.847.2336.5186.69−0.332cytoplasm
CaPG30Capana07g00196539943,410.729.0336.3783.01−0.033nucleus
CaPG31Capana08g00096547251,887.048.2638.8589.64−0.187tonoplast
CaPG32Capana08g00120739742,209.55.5242.3288.14−0.038extracellular matrix
CaPG33Capana09g00001235538,489.075.4533.7282.08−0.155extracellular matrix
CaPG34Capana09g00014549355,367.468.940.5892.45−0.145chloroplast
CaPG35Capana09g00045932734,860.557.4729.7980.67−0.296nucleus
CaPG36Capana09g00046059863,472.856.6930.5783.04−0.177nucleus
CaPG37Capana09g00051639041,929.818.8729.0179.72−0.12nucleus
CaPG38Capana10g00000435037,695.184.9545.5983.6−0.163nucleus
CaPG39Capana10g00222932135,227.225.6927.2973.77−0.355nucleus
CaPG40Capana11g00123928130,660.888.4137.3386.62−0.19nucleus
CaPG41Capana11g00128549554,293.948.9739.475.96−0.245chloroplast
CaPG42Capana12g00038433235,479.087.4926.5981.54−0.152nucleus
CaPG43Capana12g00038539041,382.386.743778.74−0.105nucleus
CaPG44Capana12g00038639041,441.457.0736.0278.74−0.113nucleus
CaPG45Capana12g00038733235,479.087.4926.5981.54−0.152nucleus
CaPG46Capana12g00128140944,343.145.9840.4287.43−0.048nucleus
CaPG47Capana12g00213826128,032.148.827.9196.320.207extracellular matrix
Table 2. Evolutionary analysis of CaPG gene pairs.
Duplicated PairsKa 1Ks 2Ka/KsPurifying SelectionDuplicate Type
CaPG4–CaPG180.11230.71150.1578YesSegmental
CaPG6–CaPG310.24932.21930.1123YesSegmental
1 Nonsynonymous substitution rate. 2 Synonymous substitution rate.
Disclaimer/Publisher’s Note: The statements, opinions and data contained in all publications are solely those of the individual author(s) and contributor(s) and not of MDPI and/or the editor(s). MDPI and/or the editor(s) disclaim responsibility for any injury to people or property resulting from any ideas, methods, instructions or products referred to in the content.

