Abstract
Background/Objectives: PAX3 is a transcription factor that drives melanoma progression by promoting cell growth, migration, and survival, while inhibiting cellular terminal differentiation. However, known PAX3 target genes are limited and cannot fully explain the wide impact of PAX3 function. The PAX3 protein can regulate DNA through two separate binding domains, the Paired Domain (PD) and Homeodomain (HD), which bind different DNA motifs. It is not clear if these two domains bind and work together to regulate genes and if they promote all or only a subset of downstream cellular events. Methods: PAX3 direct downstream targets were identified using Cleavage Under Targets & Release Using Nuclease (CUT&RUN) assays in SK-MEL-5 melanoma cells. PAX3-binding genomic regions were identified through MACS2 peak calling, and peaks were categorized based on the presence of PD and/or HD binding sites (or neither) through HOMER motif analysis. The peaks were further characterized as Active, Primed, Poised, Repressed, or Closed based on ATAC-seq data and CUT&RUN for histone Post-Translational Modifications H3K4me1, H3K4me3, H3K27me3, and H3K27Ac. Results: This analysis revealed that most of the PAX3 binding sites in the SK-MEL-5 cell line were primarily through the PD and connected to Active genes. Surprisingly, PAX3 does not commonly act as a repressor in SK-MEL-5 cells. Pathway analysis identified genes involved with transcription, RNA modification, and cell growth. Peaks located in distal enhancer elements were connected to genes involved in neuronal growth, function, and signaling. Conclusions: Our results reveal novel PAX3 regulatory regions and putative genes in a melanoma cell line, with a predominance of PAX3 PD binding on active sites.
1. Introduction
PAX3 is a transcription factor expressed in the embryonic neural crest, somites, and central nervous system (CNS) [1]. Homozygous deletion of PAX3 leads to defects in all these populations in mice. PAX3 is linked to driving lineage specificity genes as the somites and neural crest differentiate and mature, with examples including MyoD in the somite derived-muscle precursors and MITF in neural crest-derived melanocytes [2,3,4,5,6]. PAX3 is required for normal melanocyte development, growth, and migration. Hair hypopigmentation and hearing loss occurs in mice or Waardenburg Syndrome patients with hemizygous PAX3/pax3 gene loss or mutation due to missing or defective melanocytes [7]. On the other hand, PAX3 expression is maintained in melanoma, in early lesions, primary tumors and metastasis [8,9,10,11]. The overexpression of PAX3 in melanoma is not purely an artifact of a prior initiating event of downstream effector genes, since the loss of PAX3 is catastrophic to melanoma viability regardless of expression of these downstream factors [8,9,10,11].
The main function of PAX3 is as a transcription factor, but most downstream targets are not known. While PAX3 target genes have been identified using a candidate approach, non-biased cistromic screens have been limited overall and are nonexistent for melanocyte or melanoma cells. The few studies utilizing either ChIP-seq, CUT&RUN, or CUT&Tag were mostly focused on the role of PAX3 in muscle cells or embryonic stem cells induced toward a muscle lineage [12,13,14]. Genomic PAX3 binding within xenopus neural crest was also examined in a recent report [15]. In cancer cells, current studies have focused on Fusion Positive Rhabdomyosarcoma (FP-RMS) containing the PAX3-FOXO1 translocation product [16,17,18,19,20,21,22,23,24,25]. While these studies are informative, it is not clear if the identified enhancers and genes are normal PAX3 targets or unique to the translocation protein, where the C-terminal tail and transactivation domain is replaced with significant FOXO1 regulatory regions. While several genes have been identified as putative PAX3 targets, only a handful have been verified as direct PAX3 downstream targets with linked enhancer regulatory elements. In neural crest, melanocyte, and melanoma cells, PAX3 was found to regulate MITF, NGN2, RET, SOSTDC1, MSX2, DCT, and TYRP1 genes [5,6,26,27,28,29,30,31,32], as well as genes expressed ubiquitously or widely (and including melanocytes), such as BCL-XL, CXCR4, FGFR4, HES1, MET, NF1, TGFb2, and WNT1 [11,30,33,34,35,36,37,38,39,40,41,42]. While PAX3 is important in both melanocytes and melanoma, gene signature studies have not been performed on a whole genome scale. Clearly, the PAX3-dependent influence on melanoma maintenance and progression is much wider than the few known downstream genes already identified.
In this current study, we focused on the SK-MEL-5 cell line as a model for melanoma, since these cells display common cellular morphology for this cell type and retain a BRAFV600E mutation that is found in about half of melanoma cases [43,44]. The majority of PAX3 peaks contained PD binding sites, were affiliated with active genes, and were within 5 Kb of a Transcriptional Start Site (TSS). Less than 2% of peaks lacked either a PD or HD binding site, and these enhancers contained AP-2, KLF/SP1, and/or SOX binding site motifs. Genes associated with PAX3 peaks were commonly associated with pathways involved in transcription, RNA modification, and cell growth. While the majority of PAX3 peaks were within 5 Kb of the start sites of genes, 13.1% were over 50 Kb away from connected genes. These genes were commonly found in pathways involved in neuronal growth, function, and signaling. In this first report to employ a non-biased screen of PAX3 regulated genes in melanoma cells, there were several similarities and differences from prior gene candidate approaches. This highlighted shared cellular pathways as well as the heterogenetic variation of melanoma cells between donors. Here, we revealed several previously unknown potential gene targets of PAX3 and provide some insight into the wide functions of PAX3 in the regulation of melanoma growth, migration, and survival.
2. Materials and Methods
2.1. Cell Culture and Harvest
Human melanoma cell line SK-MEL-5 was obtained by the National Cancer Institute (NCI) Cell repository [RRID: CVCL_0527]. Cells were cultured in DMEM (Gibco, Waltham, MA, USA) with addition of 10% FBS (Corning/Mediatech, Inc. Woodland, CA, USA) without antibiotics. Histological analysis by DAPI staining of SK-MEL-5 cells was used to verify lack of mycoplasma contamination.
2.2. Cleavage Under Targets and Release Using Nuclease (CUT&RUN)
CUT&RUN [45,46] was performed using the CUTANA CUT&RUN kit (Epicypher, Durham, NC, USA, Cat.# 14-1048) following the manufacturer’s instructions with minor modifications. Briefly, 5 × 10⁵ cells were added to 10 μL activated magnetic Concanavalin A-coated beads per reaction. After a 10 min incubation, the supernatant was removed and cell–bead complexes were resuspended in cold buffer containing 0.02% Digitonin. Appropriate antibodies (Table 1) were added to reactions and incubated overnight at 4 °C with mixing. After washing beads twice, 2.5 μL pAG-MNase was added per reaction and incubated. pAG-MNase was activated by addition of 1 μL of 100 mM calcium chloride to 50 μL fresh buffer per reaction and incubated at 4 °C for 2 h with mixing followed by addition of 33 μL Stop Buffer and further incubation at 37 °C for 10 min. Released DNA fragments were treated with 0.2% SDS and 0.5 ug Proteinase K, incubated at 50 °C for 1 h, then purified by phenol/chloroform-extraction and ethanol precipitation. Fragment sizes were analyzed using a 2100 Bioanalyzer (Aligent, Santa Clara, CA, USA).

Table 1.
Antibodies used for CUT&RUN assay. All antibodies were rabbit raised antibodies against the indicated targets.
2.3. CUT&RUN Library Preparation and Data Analysis
All CUT&RUN libraries were generated using the NEBNext Ultra II DNA Library Prep Kit for Illumina (New England Biolabs (NEB), Ipswich, MA, USA, Cat.# E7645S) with NEBNext Multiplex Oligos for Illumina (NEB Cat.# E6440S). Libraries for histone CUT&RUN assays were performed per manufacturer’s instructions, except the NEBNext End Prep step temperature was reduced to 50 °C. Libraries for PAX3 CUT&RUN were performed as described [47]. Post library QC was achieved by fragment analysis on 2100 Bioanalyzer (Aligent). Libraries were pooled at equimolar concentrations and sequenced with 75 bp paired-end reads on an Illumina NextSeq550 platform (Illumina, Inc., San Diego, CA, USA). Rabbit anti-IgG control was used to account for non-specific binding and background signal. Reads were trimmed using Cutadapt (v4.8) and QC of trimmed files was implemented using MultiQC (v1.11) [48,49]. Trimmed reads were aligned against the hg19 genome assembly using Bowtie2 (v 2.4.5) [50]. Read-alignment BAM files were filtered using SAMtools (v1.8) [51] and PCR duplicates removed using Picard (v3.1.1) before BAM to BED and BigWig conversions were performed (BEDTools, v2.31.1) [52]. Peak calling was performed on BED files using MACS2 (v2.2.7.1) narrow peaks for PAX3 analysis and broad peaks for histone analyses [53]. The visualization of CUT&RUN tracks was generated using IGV (v2.15.4) [54].
2.4. ATAC-Seq Processing
Raw ATAC-seq data from the SK-MEL-5 cell line was downloaded from the GEO database (accession SRX13052791) and processed using a custom Snakemake (v7.32.4) pipeline [55,56,57]. The ATAC-seq had been performed in duplicate on 55,000 SK-MEL-5 cells using standard methodology and sequenced on an Illumina HighSeq 4000 instrument [56]. Reads were trimmed using Trimmomatic (v0.39) and QC of trimmed reads was implemented with FastQC (v0.12.1) [58,59]. Trimmed reads were aligned to the hg19 genome using Bowtie2 (v2.5.3) and mitochondrial reads were filtered out with SAMtools (v1.19.2). To account for Tn5 transposase binding characteristics alignments were shifted +4 bp and −5 bp on the forward and reverse strand, respectively using deepTools alignmentSieve (v3.5.4) [60]. Peaks were called using MACS2 (v2.7.1) with -nomodel. Identification of reproducible peaks was achieved by intersecting the two replicates with a 50% overlap requirement using BEDTools (v2.31.1) and filtering against the ENCODE blacklist regions.
2.5. Identification and Classification of PAX3 Binding Motifs
PAX3 peak coordinates were obtained from MACS2 narrow peak files generated from the CUT&RUN analysis and annotated with ChIPseeker (v1.38.) [61]. Peaks were extended by ±150 bp to capture the full mono-nucleosome using GenomicRanges (v1.54.1) [62]. The corresponding nucleotide sequences were extracted using the getSeq function from BSgenome.Hsapiens.UCSC.hg19 (v1.4.3) using R (v4.3.0). Blacklist regions (ENCODE hg19 v2) were filtered using rtracklayer (v1.62.0) to exclude artifactual or repetitive sequences [63,64]. Since PAX3 is known to bind via PD or HD, the processed PAX3 peak nucleotide files were analyzed for those motifs using regular expression-based screening. Nucleotide sequences were scanned for PD motifs (T[T/C][C/A][C/T][G/C][G/C], GTCA[C/T]GG) and HD motifs (TAAT[N2,3]ATTA and minor variants) using Biostrings (v2.7.0) [65]. Results of motif scanning were classified hierarchically as PD, HD, PDHD (possessing both PD and HD), or None.
2.6. Gene State Assessment and Classification
Histone Post-Translational Modification (PTM), and ATAC-seq binding sites were annotated with ChIPseeker (v1.38.). TSS were defined as regions spanning 2 Kb upstream and downstream of the annotated gene start sites, while gene regions were defined by extending gene body coordinates by 5 Kb on each side to capture proximal regulatory elements, except for H3K27me3. Using an in-house R script, each gene associated with a PAX3 peak was evaluated and classified hierarchically based upon associated histone PTMs and chromatin accessibility (Table 2).
Table 2.
Classification of gene state based upon chromatin marks and accessibility. Note, for Active, Primed, and Poised classifications, the presence of either H3K4me1 or H3K4me3, or both together, are required to satisfy the classification criteria. + = presence, − = absence, +/− can be either present or absent.
2.7. Data Processing and Analysis
A small number of PAX3 annotated genes (22 of 837 genes or 2.6%) were found to not be readily assignable to any of the five gene state groupings. These were manually cross-checked and re-classified as appropriate. Gene Ontology (GO) enrichment analysis of Biological Processes (BP) and Molecular Function (MF) were performed using Metascape [66] and clusterProfiler [67] using the Benjamini–Hochberg adjusted p-values to determine the top 10 enriched pathways. All plots were generated with ggplot2 (v3.5.2) using R (v4.4.2) [68].
3. Results
3.1. PAX3-Bound Cistromic Regions in Melanoma Cells
What genes and enhancer elements are controlled by PAX3 in melanoma is not well understood. To address this, we performed CUT&RUN to reveal the cistrome of PAX3 in SK-MEL-5 melanoma cells. First, two PAX3 antibodies, one monoclonal [Developmental Studies Hybridoma Bank/University of Iowa, Iowa City, IA, USA, Cat. # Pax3] and one polyclonal [Invitrogen/ThermoFisher, Waltham, MA, USA, Cat. # 38-1801], were tested and validated by assessing the constructed libraries using a 2100 Bioanalyzer (Aligent) to determine effectiveness for use in CUT&RUN. Analysis showed that only the polyclonal PAX3 antibody was suitable for CUT&RUN. CUT&RUN was also performed using antibodies for H3K4me1 and H3K4me3 (Active or Poised enhancers and promoters), and H3K27Ac and H327me3 (Active or Repressed chromatin). To mark open chromatin, ATAC-seq tracks were added from previously published datasets for SK-MEL-5 cells [56]. Three rounds of CUT&RUN were performed on SK-MEL-5 cells. One sample that did not pass QC was excluded from the downstream analysis. A total of 837 PAX3 peaks were detected from two remaining replicates. (Supplementary Table S1). Several of these peaks linked to previously identified enhancer elements regulated by PAX3, including MITF (Figure 1a). The PAX3 peak in the MITF loci was located proximal to the promoter driving the melanocyte specific m-MITF isoform, with H3K4me1, H3K4me3, H3K27Ac, and ATAC-seq peaks and a lack of H3K27me3 peak. Annotation of the dataset revealed that the vast majority of PAX3 peaks (more than 60%) were less than 5 Kb (<Kb) away from the TSS of the nearest annotated gene (Figure 1b). Over 90% of the peaks that were less than 5 Kb were within 0.5 Kb or less from the TSS (Figure 1c). This analysis uncovered a clear cistromic map of PAX3 regulation in SK-MEL-5 melanoma cells.
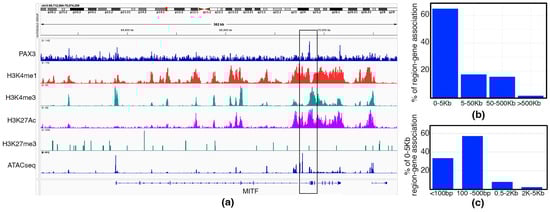
Figure 1.
Analysis of SK-MEL-5 cell cistromic signatures. (a) Example of CUT&RUN and ATAC-seq data at the MITF locus, MACS2 peak (boxed), with antibodies against PAX3, H3K4me1 (Active enhancer), H3K4me3 (Active promoter), H3K27Ac (Active chromatin), H3K27me3 (Repressed chromatin).; (b,c) distance of PAX3 peaks from TSS, shown as the percentage of total peaks (b) and the total percentage of peaks 0–5 Kb from the TSS (c).
3.2. Binning of PAX3 Peaks with Paired and/or Homeodomain Binding Sites and with Histone Signatures
For this analysis, an in-house bioinformatic approach to examine PAX3 regulatory enhancers in terms of PAX3 binding motifs and histone signatures was employed (Figure 2a). First, the PAX3 peaks were identified, and then paired with the presence or absence of a PAX3-binding site within the peak (binning by motif), or with histone PTM tags and ATAC-seq peaks (binning by histone signature). For binning by motif, PAX3 has two DNA binding domains, PD and HD. How PAX3 interacts with DNA, and what cofactors cooperate on enhancers, differs between the PD and HD [1]. PAX3 peaks were sorted using custom R scripts containing PAX3 binding sites based on previously identified PD, HD, and dual PDHD sites [34,69,70,71,72,73,74,75,76,77] or peaks containing none of these sequences (Figure 2b). The PD binding site is difficult to predict due to the wobbly binding preferences of this domain, but has been determined through binding site selection assays, electrophoretic mobility shift assays, and DNA binding interference experiments [34,70,71,73,78]. The major HD site found in PAX family proteins is TAAT (N)2–3 ATTA, but there are several minor sites identified (referred to as HDminor, HD half-sites, H.12) identified for PAX3 and other PAX proteins through in vitro assays and crystal structure analysis [75,76]. While the PD and HD often bind independently, there is also evidence of crosstalk during DNA binding of either domain, as well as enhancer elements with dual PDHD sites. While many of the PDHD sites identified show a high binding affinity by the translocation product PAX3-FOXO1 or paralog PAX7, there is evidence that PAX3 can interact with PDHD sites as well, including the HP.E0 pioneer site [72,74,77]. For binning by histone signature, gene and promoter regions proximal to PAX3 peaks were classified as Active, Poised, Primed, Repressed, or Closed based on histone marks and accessibility (ATAC-seq) using previously identified signatures (Figure 2c) [79,80,81,82].
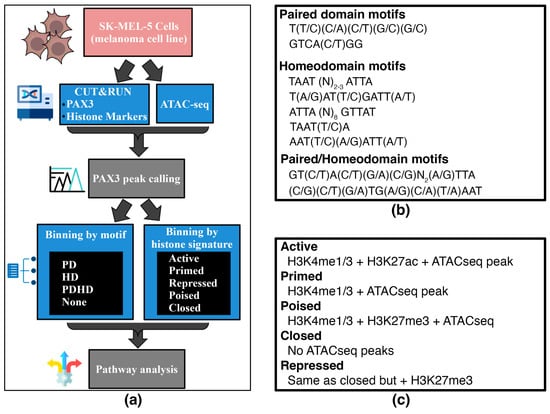
Figure 2.
Schematic and criteria for the binning of PAX3 peaks with Paired and/or Homeodomain binding sites with histone signatures. (a) Schematic of workflow for characterizing peaks by motif and histone PTM signatures; (b) sequences of PD and HD motifs; (c) criteria for histone PTM marks for peaks. This binning is shown in tabular form in Table 2.
3.3. PAX3 Commonly Binds to Enhancers of Active Genes Through the Paired Domain in SK-MEL-5 Cells
After analyzing the PAX3 peaks using the criteria outlined in Figure 2, the peaks were sorted based on motif and histone signature. First, peaks were analyzed for PD, HD, and PDHD sites (Figure 3a). In SK-MEL-5 cells, the peaks predominantly contained PD sites, with 684 out of 837 peaks (81.8%) with this motif (Figure 3b,c). This included a previously identified PAX3 site in a RET gene enhancer [28]. Peaks containing a HD site (either HD only, coupled with a PD site, or a combined PDHD motif) were less common, comprising 16.7% of the peaks (Figure 3b,c). These peaks included a previously identified PAX3 site in a MITF gene enhancer [83,84]. A minority of the peaks (13 peaks, 1.6%) did not have a PD nor a HD binding motif (“None” peaks) (Figure 3b,c) and it is assumed that PAX3 is interacting with a cofactor that is recruiting PAX3 to the DNA (Figure 3a). To identify potential binding partners, HOMER motif analysis was performed on these 13 peak sequences. The None peaks contained AP-2, KLF, SP1, and/or SOX motifs (Figure 4).
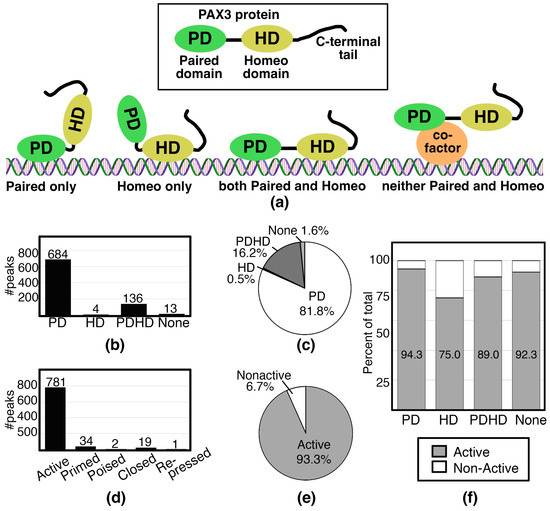
Figure 3.
PAX3 binds to DNA primarily through the Paired Domain on enhancers affiliated with active genes. (a) Schematic representing the definition of PD, HD, PDHD, and None peaks; (b,c) number (b) or percentage (c) of peaks containing motifs for PD, HD, or PDHD, or none of these sites.; (d,e) number (d) or percentage (e) of peaks identified as Active, Primed, Poised, Closed, or Repressed chromatin; (f) percent of each peak identified as PD, HD, PDHD, or None that have Active (grey) or Non-Active (white) chromatin.
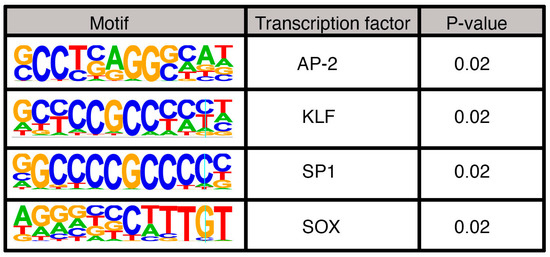
Figure 4.
Motifs identified in PAX3 peaks without PD, HD, or PDHD sites.
In terms of histone signature, the majority of PAX3 peaks in the SK-MEL-5 cells have an Active signature. The PAX3 peaks were identified to be Active for 781 peaks, or 93.3% of total PAX3 peaks (Figure 3d,e). Unsurprisingly, sorting motifs (PD, HD, PDHD, None) by histone markers yielded mostly Active histone marks across all motif groups, due to the high number of peaks with Active histone marks (Figure 3f). While only 6.7% of the peaks were classified as Non-Active (identified as a Primed, Poised, Closed, or Repressed gene), motifs not classified as PD only (HD, PDHD, None) were overrepresented in this group, comprising 30.4% of the Non-Active genes (17 of 56 total peaks). Overall, our findings are that PAX3 is interacting with active gene enhancers directly through the Paired DNA binding domain.
3.4. Pathway Analysis of Potential PAX3 Downstream Genes in SK-MEL-5 Melanoma Cells
Comparative GO enrichment analysis by clusterProfiler found little difference between the most significant Biological Process (BP) and Molecular Function (MF) pathways in PAX3 genes from the Active and PD classification groups, with 70% of the top 10 BP pathways and 60% of the top 10 MF pathways shared between both groups (Figure 5a–d, Supplementary Tables S2 and S3). The GO:BP analysis revealed a substantial overlap between the two gene sets for RNA processing and cell cycle regulation, suggesting a shared functional signature of transcriptional and proliferative activity. Furthermore, GO:MF analysis showed considerable overlap in protein kinase activity, transcriptional corepression, histone modification, and ubiquitin-mediated processes, indicating commonality between the two gene sets in gene expression regulation and protein turnover. Presumably these results are due to both Active and PD group classifications containing the majority of the PAX3 genes which would result in a high degree of overlap between those groups. GO analysis of the PDHD + HD gene set found that no pathways were significantly enriched, likely due to the smaller number of genes present in that gene set (Supplementary Table S4).
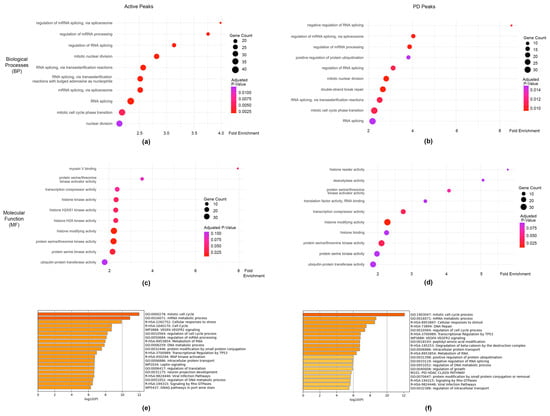
Figure 5.
Pathway analysis of genes associated with PAX3 cistromic peaks. (a,b) Top 10 Gene Ontology (GO) pathways in Biological Process (BP) pathways for Active (a) and PD (b) groups; (c,d) GO pathways for Molecular Function (MF) for Active (c) and PD (d) groups.; (e,f) top 20 ontological terms from Metascape [66].
Further analysis of the Active and PD pathways and processes was conducted in Metascape, which provides enrichment analysis using additional ontology terms including from the Broad Institute’s MSigDB [66]. Parallel with the clusterProfiler results, there was a substantial overlap in RNA processing and cell cycle regulation pathways with the Active and PD gene sets sharing 50% of the top 20 significant pathways between them (Figure 5e,f). Overall, the genes associated with PAX3 peaks fell into several pathways involved with transcription, RNA modification, and cell growth.
3.5. Genes Associated with Distal PAX3 Enhancers Have a Neuronal Signature
Since 13.1% of the PAX3 peaks were found to be ≥50 Kb from the TSS of the genes they annotated to, we performed separate GO-based pathway enrichment analyses to determine the pathways they influenced (Figure 6, Supplementary Table S5 and S6). Interestingly clusterProfiler GO:BP analysis found that the Distant gene set comprising distal PAX3 enhancers was significantly overrepresented in biological processes associated with neuronal development, cell adhesion, junction regulation, and developmental processes (Figure 6a,b). Meanwhile GO:MF analysis revealed enrichment for several signaling and regulatory activities such as neuropilin and ephrin receptor binding and semaphorin receptor activity. Metascape-based BP pathway enrichment analysis also found significant gene set overrepresentation in neuronal development, synaptic organization, and tissue morphogenesis pathways, which was a large departure from the Active and PD results (Figure 6c). These results suggest that genes with distal PAX3 enhancers ≥50 Kb from TSS coordinate neuronal differentiation, tissue development, and adaptive signaling processes, and may reflect a reactivation of neural crest-derived programs.
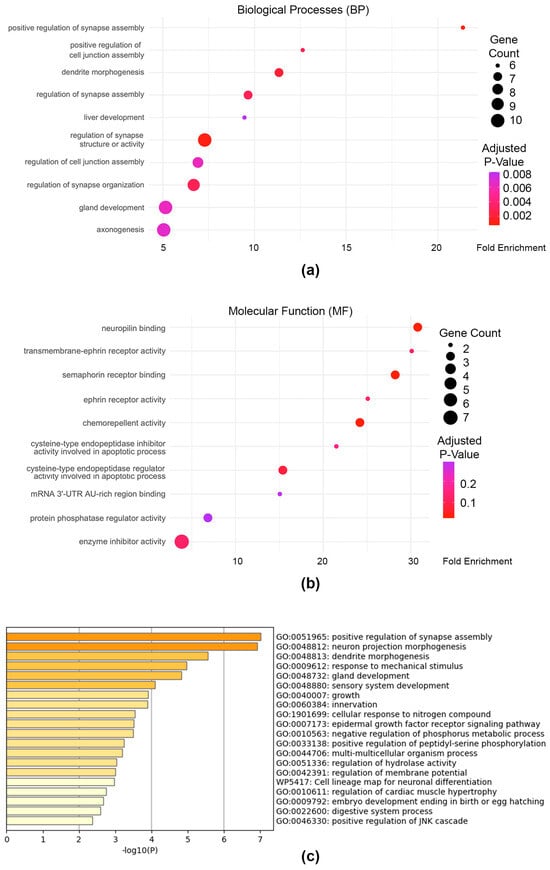
Figure 6.
Pathway analysis of genes associated with PAX3 enhancers that are over 50 Kb from transcriptional start sites. (a) Gene Ontology (GO) pathways in Biological Process (BP) pathways of Distant genes, or genes with PAX3 peaks over 50 Kb from Transcriptional Start Sites; (b) GO pathways for Molecular Function (MF) for Distant gene set; (c) top 20 ontological terms from Metascape [66].
4. Discussion
This report is the first to investigate PAX3 genomic interaction in a melanoma cell line. We focused on SK-MEL-5 cells since there are already databases available containing cistromic information, and that this cell line has the common BRAF valine 600 to glutamic acid mutational change coupled with a wild-type N-RAS gene [43,44]. In these cells, we identified several known melanoma PAX3 targets, including MITF and BRN2/POU3F2 [5,8,85]. However, several other downstream targets were absent from our dataset. These include validated melanoma targets, such as CXCR4, MET and TYRP1 [9,11,26,36]. Conversely, some of the known PAX3 target genes that had PAX3 peaks in SK-MEL-5 cells were also variably controlled by PAX3 in other cell lines. An example of this is MITF, which is not always regulated by PAX3 in melanoma [4,11,86]. This is likely due to the heterogenicity of melanoma cells, and that these prior reports did not test SK-MEL-5 cells. Further, while we chose SK-MEL-5 cells as a representative of melanoma cells due to their BRAF mutation and cellular morphology, a difference between this cell line and other established lines is that the donor was significantly younger (24 years old) and has a CDKN2A mutation [87]. The role of PAX3 may differ depending on how melanoma is induced and promoted, such as genetic, environmental or other variables.
Most of the peaks contain PD, while only a small minority have a HD (140 peaks), and even less with HD only (4 peaks) (Figure 3b,c). This was not surprising, since it was previously described that PAX3 was not effective in inducing transcription from enhancer elements with only HD motifs in myogenic cells [14]. Further, while the majority of the genes associated with PAX3 peaks in this study are Active, there are a minority of genes that are Non-Active, and HD containing sites are overrepresented in this peak set (Figure 3). There is a precedent for Paired-type HD to act as repressors, often working with TLE/Groucho factors [88]. PAX3 functions as a transcriptional repressor for some genes such as MBP and Dct [29,89]. PAX3 interacts with TLE4 in murine melanocyte stem cells, but it is not clear through which domain PAX3 is interacting with the enhancers of either MDP or Dct [29,89]. We do not see evidence of direct gene repression in this study. It may be that in this cell line gene repression is indirect, since several genes were in pathways involved in transcriptional repression (Figure 5b,e).
There was a small minority of peaks identified that lacked either HD or PD sites. Motif analysis of these peaks revealed AP-2, KLF/SP1, and SOX sites (Figure 4). SOX family members are common PAX protein co-factors; in melanocytes and melanoma, PAX3 interacts with SOX10 and drives a number of downstream genes, such as MITF, MET, and RET [1,11,28,83,90]. AP-2, also known as TFAP2 family members, are known to promote melanocyte development and maturation, as well as function in melanoma [91,92,93]. No prior connection is known between PAX proteins and TFAP2 factors, except for some evidence supporting an upstream role for promoting TFAP2 expression in xenopus [94]. PAX3 is known to drive expression of genes involved in both an invasive and proliferative phenotype in melanoma, and TFAP2A can work as a rheostat switch between phenotypic groups [95]. While an interaction between PAX3 and TFAP2 factors in driving phenotype switching is an interesting possibility, presently it is unknown if these proteins cooperate in this way. We also found KLF/SP1 sites. SP1-like proteins and Krüppel-like factors (KLF) are highly related zinc-finger transcription factors that bind to GC-rich promoter regions [96]. These factors are known to regulate several cellular functions, including cell growth, survival, and differentiation. While there is currently no known connection between PAX3 and KLF/SP1 factors, SP1 is known to compete with TFAP2 factors through transcriptional steric interference and act as a repression/activation switch [97]. It may be a clue into a potential mechanism of a PAX3/TFAP2/SP1 rheostat between cell phenotypes of functions.
The majority of documented PAX3-targeted enhancers are located in the 5′ proximal promoter, within the first intron, or in the 3′ UTR [5,10,26,33,36,37], which was supported by our CUT&RUN analysis where the majority of PAX3 peaks were near gene TSS in this cell line (Figure 1). One caveat is that the enhancer with the closest proximity to a gene does not definitively regulate that gene. Indeed, several known PAX3 enhancer sites in somites and muscle cells are more than 5 Kb away from their regulated gene’s TSS; for example MYF5 (57.5 Kb and 111 Kb upstream from the start site) [98,99] and DMRT2 (11 Kb upstream) [100]. While we predict regulated genes in this report based on proximity, each enhancer would need additional experimentation to validate their regulation by PAX3. Furthermore, nearly 40% of our enhancers were more than 5 Kb away from a TSS, with nearly 20% over 50 Kb away (Figure 1b). The analysis of genes associated with these distal enhancers revealed a neuronal pathway profile, with terms linked to neuronal growth, function, and signaling (Figure 6). This is a vastly different signature than for the other PAX3 enhancers, which fall into transcription, RNA modification, and cell growth pathways (Figure 5). The genes that are associated with these distal enhancers include ephrins, semaphorins, and SLIT/TRK proteins. Several of these proteins are involved in neural crest differentiation, which requires PAX3 function for normal development and differentiation. This raises a possibility that PAX3 regulated enhancers involved with differentiation are located distally from genes in neural crest populations, in parallel to what is seen in somite and muscle precursors.
5. Conclusions
In SK-MEL-5 melanoma cells, PAX3 is bound to DNA elements associated with genes involved with transcription, RNA modification, cell growth, and neuronal growth, function, and signaling. This is the first study to perform a non-biased genomic screen to reveal a PAX3 cistromic signature in melanoma cells.
Supplementary Materials
The following supporting information can be downloaded at: https://www.mdpi.com/article/10.3390/genes16050577/s1, Supplementary Table S1. Pax3 peaks categorized to histone marks and binding sites; Supplementary Table S2. Active GO, BP and MF merged (clusterProfiler); Supplementary Table S3. PD GO, BP and MF merged (clusterProfiler); Supplementary Table S4. PDHD_HD GO, BP and MF merged (clusterProfiler); Supplementary Table S5. Genes with PAX3 peaks greater than 50Kb from TSS (distant); Supplementary Table S6. Distant GO, BP & MF merged (clusterProfiler).
Author Contributions
Conceptualization, S.P.G.M., S.G.K., C.Z. and D.L.; methodology, S.P.G.M., S.G.K., R.J.K., C.K., C.Z. and. D.L.; software, S.P.G.M., S.G.K., R.J.K. and C.Z.; validation, S.P.G.M., S.G.K., C.K., C.Z. and D.L.; formal analysis and investigation, S.P.G.M., S.G.K., R.J.K., C.K., C.Z. and D.L.; resources, S.P.G.M. and D.L.; data curation, S.P.G.M. and C.Z.; writing—original draft preparation and review and editing, S.P.G.M., S.G.K., R.J.K., N.B.P., C.K., C.Z. and D.L.; visualization, S.P.G.M. and D.L.; supervision, S.P.G.M., C.Z. and D.L.; project administration and funding acquisition, D.L. All authors have read and agreed to the published version of the manuscript.
Funding
This research was funded by the Leo Foundation, LF-OC-21-00088; The American Cancer Society, DBG-23-1152683-01-RMC, TLC-24-1345883-01-TLC, and IRG-22-153-42-IRG-07; The National Institutes of Health/National Cancer Institute, 1R03CA288281-01A1, The National Institutes of Health/National Center for Advancing Translational Sciences and the Boston University Clinical and Translational Science Institute 1TL1TR001410 and 1UL1TR001430, and the Boston University Genome Science Institute (GSI) pilot project program.
Institutional Review Board Statement
Not applicable.
Informed Consent Statement
Not applicable.
Data Availability Statement
The original data presented in the study are openly available in NCBI Sequence Read Archive at Accession number PRJNA1260960, https://www.ncbi.nlm.nih.gov/bioproject/PRJNA1260960 accessed on 9 May 2025.
Conflicts of Interest
The authors declare no conflicts of interest.
Abbreviations
The following abbreviations are used in this manuscript:
| BP | Biological Processes |
| CNS | Central Nervous System |
| CUT&RUN | Cleavage Under Targets & Release Using Nuclease |
| FP-RMS | Fusion Positive Rhabdomyosarcoma |
| GO | Gene Ontology |
| HD | Homeodomain |
| MF | Molecular Function |
| NCI | National Cancer Institute |
| PD | Paired Domain |
| PDHD | Homeodomain and Paired Domain |
| PTM | Post-Translational Modification |
| TSS | Transcriptional Start Site |
References
- Kubic, J.D.; Young, K.P.; Plummer, R.S.; Ludvik, A.E.; Lang, D. Pigmentation PAX-ways: The role of Pax3 in melanogenesis, melanocyte stem cell maintenance, and disease. Pigment Cell Melanoma Res. 2008, 21, 627–645. [Google Scholar] [CrossRef] [PubMed]
- Tajbakhsh, S.; Rocancourt, D.; Cossu, G.; Buckingham, M. Redefining the genetic hierarchies controlling skeletal myogenesis: Pax-3 and Myf-5 act upstream of MyoD. Cell 1997, 89, 127–138. [Google Scholar] [CrossRef] [PubMed]
- Hu, P.; Geles, K.G.; Paik, J.H.; DePinho, R.A.; Tjian, R. Codependent activators direct myoblast-specific MyoD transcription. Dev. Cell 2008, 15, 534–546. [Google Scholar] [CrossRef]
- Smith, M.P.; Rana, S.; Ferguson, J.; Rowling, E.J.; Flaherty, K.T.; Wargo, J.A.; Marais, R.; Wellbrock, C. A PAX3/BRN2 rheostat controls the dynamics of BRAF mediated MITF regulation in MITF(high)/AXL(low) melanoma. Pigment Cell Melanoma Res. 2019, 32, 280–291. [Google Scholar] [CrossRef]
- Watanabe, A.; Takeda, K.; Ploplis, B.; Tachibana, M. Epistatic relationship between Waardenburg syndrome genes MITF and PAX3. Nat. Genet. 1998, 18, 283–286. [Google Scholar] [CrossRef]
- Corry, G.N.; Underhill, D.A. Pax3 target gene recognition occurs through distinct modes that are differentially affected by disease-associated mutations. Pigment Cell Res. 2005, 18, 427–438. [Google Scholar] [CrossRef]
- Tassabehji, M.; Read, A.P.; Newton, V.E.; Harris, R.; Balling, R.; Gruss, P.; Strachan, T. Waardenburg’s syndrome patients have mutations in the human homologue of the Pax-3 paired box gene. Nature 1992, 355, 635–636. [Google Scholar] [CrossRef]
- Bonvin, E.; Falletta, P.; Shaw, H.; Delmas, V.; Goding, C.R. A phosphatidylinositol 3-kinase-Pax3 axis regulates Brn-2 expression in melanoma. Mol. Cell Biol. 2012, 32, 4674–4683. [Google Scholar] [CrossRef]
- Kubic, J.D.; Little, E.C.; Lui, J.W.; Iizuka, T.; Lang, D. PAX3 and ETS1 synergistically activate MET expression in melanoma cells. Oncogene 2015, 34, 4964–4974. [Google Scholar] [CrossRef]
- Kubic, J.D.; Little, E.C.; Kaiser, R.S.; Young, K.P.; Lang, D. FOXD3 Promotes PAX3 Expression in Melanoma Cells. J. Cell. Biochem. 2016, 117, 533–541. [Google Scholar] [CrossRef]
- Mascarenhas, J.B.; Littlejohn, E.L.; Wolsky, R.J.; Young, K.P.; Nelson, M.; Salgia, R.; Lang, D. PAX3 and SOX10 activate MET receptor expression in melanoma. Pigment Cell Melanoma Res. 2010, 23, 225–237. [Google Scholar] [CrossRef] [PubMed]
- Magli, A.; Baik, J.; Mills, L.J.; Kwak, I.Y.; Dillon, B.S.; Mondragon Gonzalez, R.; Stafford, D.A.; Swanson, S.A.; Stewart, R.; Thomson, J.A.; et al. Time-dependent Pax3-mediated chromatin remodeling and cooperation with Six4 and Tead2 specify the skeletal myogenic lineage in developing mesoderm. PLoS Biol. 2019, 17, e3000153. [Google Scholar] [CrossRef] [PubMed]
- Magli, A.; Baik, J.; Pota, P.; Cordero, C.O.; Kwak, I.Y.; Garry, D.J.; Love, P.E.; Dynlacht, B.D.; Perlingeiro, R.C.R. Pax3 cooperates with Ldb1 to direct local chromosome architecture during myogenic lineage specification. Nat. Commun. 2019, 10, 2316. [Google Scholar] [CrossRef] [PubMed]
- Soleimani, V.D.; Punch, V.G.; Kawabe, Y.; Jones, A.E.; Palidwor, G.A.; Porter, C.J.; Cross, J.W.; Carvajal, J.J.; Kockx, C.E.; van IJcken, W.F.J.; et al. Transcriptional dominance of Pax7 in adult myogenesis is due to high-affinity recognition of homeodomain motifs. Dev. Cell 2012, 22, 1208–1220. [Google Scholar] [CrossRef]
- Kotov, A.; Seal, S.; Alkobtawi, M.; Kappes, V.; Ruiz, S.M.; Arbes, H.; Harland, R.M.; Peshkin, L.; Monsoro-Burq, A.H. A time-resolved single-cell roadmap of the logic driving anterior neural crest diversification from neural border to migration stages. Proc. Natl. Acad. Sci. USA 2024, 121, e2311685121. [Google Scholar] [CrossRef]
- Asante, Y.; Benischke, K.; Osman, I.; Ngo, Q.A.; Wurth, J.; Laubscher, D.; Kim, H.; Udhayakumar, B.; Khan, M.I.H.; Chin, D.H.; et al. PAX3-FOXO1 uses its activation domain to recruit CBP/P300 and shape RNA Pol2 cluster distribution. Nat. Commun. 2023, 14, 8361. [Google Scholar] [CrossRef]
- Cao, L.; Yu, Y.; Bilke, S.; Walker, R.L.; Mayeenuddin, L.H.; Azorsa, D.O.; Yang, F.; Pineda, M.; Helman, L.J.; Meltzer, P.S. Genome-wide identification of PAX3-FKHR binding sites in rhabdomyosarcoma reveals candidate target genes important for development and cancer. Cancer Res. 2010, 70, 6497–6508. [Google Scholar] [CrossRef]
- Gryder, B.E.; Yohe, M.E.; Chou, H.C.; Zhang, X.; Marques, J.; Wachtel, M.; Schaefer, B.; Sen, N.; Song, Y.; Gualtieri, A.; et al. PAX3-FOXO1 Establishes Myogenic Super Enhancers and Confers BET Bromodomain Vulnerability. Cancer Discov. 2017, 7, 884–899. [Google Scholar] [CrossRef]
- Hsieh, J.; Danis, E.P.; Owens, C.R.; Parrish, J.K.; Nowling, N.L.; Wolin, A.R.; Purdy, S.C.; Rosenbaum, S.R.; Ivancevic, A.M.; Chuong, E.B.; et al. Dependence of PAX3-FOXO1 chromatin occupancy on ETS1 at important disease-promoting genes exposes new targetable vulnerability in Fusion-Positive Rhabdomyosarcoma. Oncogene 2024, 14, 19–29. [Google Scholar] [CrossRef]
- Kim, Y.Y.; Gryder, B.E.; Sinniah, R.; Peach, M.L.; Shern, J.F.; Abdelmaksoud, A.; Pomella, S.; Woldemichael, G.M.; Stanton, B.Z.; Milewski, D.; et al. KDM3B inhibitors disrupt the oncogenic activity of PAX3-FOXO1 in fusion-positive rhabdomyosarcoma. Nat. Commun. 2024, 15, 1703. [Google Scholar] [CrossRef]
- Manceau, L.; Richard Albert, J.; Lollini, P.L.; Greenberg, M.V.C.; Gilardi-Hebenstreit, P.; Ribes, V. Divergent transcriptional and transforming properties of PAX3-FOXO1 and PAX7-FOXO1 paralogs. PLoS Genet. 2022, 18, e1009782. [Google Scholar] [CrossRef] [PubMed]
- Searcy, M.B.; Larsen, R.K.t.; Stevens, B.T.; Zhang, Y.; Jin, H.; Drummond, C.J.; Langdon, C.G.; Gadek, K.E.; Vuong, K.; Reed, K.B.; et al. PAX3-FOXO1 dictates myogenic reprogramming and rhabdomyosarcoma identity in endothelial progenitors. Nat. Commun. 2023, 14, 7291. [Google Scholar] [CrossRef] [PubMed]
- Singh, S.; Abu-Zaid, A.; Jin, H.; Fang, J.; Wu, Q.; Wang, T.; Feng, H.; Quarni, W.; Shao, Y.; Maxham, L.; et al. Targeting KDM4 for treating PAX3-FOXO1-driven alveolar rhabdomyosarcoma. Sci. Transl. Med. 2022, 14, eabq2096. [Google Scholar] [CrossRef]
- Sunkel, B.D.; Wang, M.; LaHaye, S.; Kelly, B.J.; Fitch, J.R.; Barr, F.G.; White, P.; Stanton, B.Z. Evidence of pioneer factor activity of an oncogenic fusion transcription factor. iScience 2021, 24, 102867. [Google Scholar] [CrossRef]
- Zhang, S.; Wang, J.; Liu, Q.; McDonald, W.H.; Bomber, M.L.; Layden, H.M.; Ellis, J.; Borinstein, S.C.; Hiebert, S.W.; Stengel, K.R. PAX3-FOXO1 coordinates enhancer architecture, eRNA transcription, and RNA polymerase pause release at select gene targets. Mol. Cell 2022, 82, 4428–4442.e4427. [Google Scholar] [CrossRef]
- Galibert, M.D.; Yavuzer, U.; Dexter, T.J.; Goding, C.R. Pax3 and regulation of the melanocyte-specific tyrosinase-related protein-1 promoter. J. Biol. Chem. 1999, 274, 26894–26900. [Google Scholar] [CrossRef]
- Kwang, S.J.; Brugger, S.M.; Lazik, A.; Merrill, A.E.; Wu, L.Y.; Liu, Y.H.; Ishii, M.; Sangiorgi, F.O.; Rauchman, M.; Sucov, H.M.; et al. Msx2 is an immediate downstream effector of Pax3 in the development of the murine cardiac neural crest. Development 2002, 129, 527–538. [Google Scholar] [CrossRef]
- Lang, D.; Chen, F.; Milewski, R.; Li, J.; Lu, M.M.; Epstein, J.A. Pax3 is required for enteric ganglia formation and functions with Sox10 to modulate expression of c-ret. J. Clin. Investig. 2000, 106, 963–971. [Google Scholar] [CrossRef]
- Lang, D.; Lu, M.M.; Huang, L.; Engleka, K.A.; Zhang, M.; Chu, E.Y.; Lipner, S.; Skoultchi, A.; Millar, S.E.; Epstein, J.A. Pax3 functions at a nodal point in melanocyte stem cell differentiation. Nature 2005, 433, 884–887. [Google Scholar] [CrossRef]
- Nakazaki, H.; Reddy, A.C.; Mania-Farnell, B.L.; Shen, Y.W.; Ichi, S.; McCabe, C.; George, D.; McLone, D.G.; Tomita, T.; Mayanil, C.S. Key basic helix-loop-helix transcription factor genes Hes1 and Ngn2 are regulated by Pax3 during mouse embryonic development. Dev. Biol. 2008, 316, 510–523. [Google Scholar] [CrossRef]
- Smith, C.K., 2nd; Janney, M.J.; Allen, R.E. Temporal expression of myogenic regulatory genes during activation, proliferation, and differentiation of rat skeletal muscle satellite cells. J. Cell Physiol. 1994, 159, 379–385. [Google Scholar] [CrossRef] [PubMed]
- Wu, M.; Li, J.; Engleka, K.A.; Zhou, B.; Lu, M.M.; Plotkin, J.B.; Epstein, J.A. Persistent expression of Pax3 in the neural crest causes cleft palate and defective osteogenesis in mice. J. Clin. Investig. 2008, 118, 2076–2087. [Google Scholar] [CrossRef]
- Epstein, J.A.; Cai, J.X.; Maas, R.M. Pax3 recognizes a sequence within the 3′utr of the murine neurofibromatosis gene Nf1. Circulation 1994, 90, 635. [Google Scholar]
- Epstein, J.A.; Shapiro, D.N.; Cheng, J.; Lam, P.Y.; Maas, R.L. Pax3 modulates expression of the c-Met receptor during limb muscle development. Proc. Natl. Acad. Sci. USA 1996, 93, 4213–4218. [Google Scholar] [CrossRef]
- Fenby, B.T.; Fotaki, V.; Mason, J.O. Pax3 regulates Wnt1 expression via a conserved binding site in the 5′ proximal promoter. Biochim. Biophys. Acta 2008, 1779, 115–121. [Google Scholar] [CrossRef]
- Kubic, J.D.; Lui, J.W.; Little, E.C.; Ludvik, A.E.; Konda, S.; Salgia, R.; Aplin, A.E.; Lang, D. PAX3 and FOXD3 Promote CXCR4 Expression in Melanoma. J. Biol. Chem. 2015, 290, 21901–21914. [Google Scholar] [CrossRef]
- Lagha, M.; Kormish, J.D.; Rocancourt, D.; Manceau, M.; Epstein, J.A.; Zaret, K.S.; Relaix, F.; Buckingham, M.E. Pax3 regulation of FGF signaling affects the progression of embryonic progenitor cells into the myogenic program. Genes. Dev. 2008, 22, 1828–1837. [Google Scholar] [CrossRef]
- Lakkis, M.M.; Golden, J.A.; O’Shea, K.S.; Epstein, J.A. Neurofibromin deficiency in mice causes exencephaly and is a modifier for Splotch neural tube defects. Dev. Biol. 1999, 212, 80–92. [Google Scholar] [CrossRef][Green Version]
- Margue, C.M.; Bernasconi, M.; Barr, F.G.; Schafer, B.W. Transcriptional modulation of the anti-apoptotic protein BCL-XL by the paired box transcription factors PAX3 and PAX3/FKHR. Oncogene 2000, 19, 2921–2929. [Google Scholar] [CrossRef][Green Version]
- Mayanil, C.S.; Pool, A.; Nakazaki, H.; Reddy, A.C.; Mania-Farnell, B.; Yun, B.; George, D.; McLone, D.G.; Bremer, E.G. Regulation of murine TGFbeta2 by Pax3 during early embryonic development. J. Biol. Chem. 2006, 281, 24544–24552. [Google Scholar] [CrossRef]
- Relaix, F.; Polimeni, M.; Rocancourt, D.; Ponzetto, C.; Schafer, B.W.; Buckingham, M. The transcriptional activator PAX3-FKHR rescues the defects of Pax3 mutant mice but induces a myogenic gain-of-function phenotype with ligand-independent activation of Met signaling in vivo. Genes. Dev. 2003, 17, 2950–2965. [Google Scholar] [CrossRef] [PubMed]
- Xu, M.; Li, Y.; Du, J.; Lin, H.; Cao, S.; Mao, Z.; Wu, R.; Liu, M.; Liu, Y.; Yin, Q. PAX3 Promotes Cell Migration and CXCR4 Gene Expression in Neural Crest Cells. J. Mol. Neurosci. 2018, 64, 1–8. [Google Scholar] [CrossRef] [PubMed]
- Tanami, H.; Imoto, I.; Hirasawa, A.; Yuki, Y.; Sonoda, I.; Inoue, J.; Yasui, K.; Misawa-Furihata, A.; Kawakami, Y.; Inazawa, J. Involvement of overexpressed wild-type BRAF in the growth of malignant melanoma cell lines. Oncogene 2004, 23, 8796–8804. [Google Scholar] [CrossRef] [PubMed]
- Xing, F.; Persaud, Y.; Pratilas, C.A.; Taylor, B.S.; Janakiraman, M.; She, Q.B.; Gallardo, H.; Liu, C.; Merghoub, T.; Hefter, B.; et al. Concurrent loss of the PTEN and RB1 tumor suppressors attenuates RAF dependence in melanomas harboring (V600E)BRAF. Oncogene 2012, 31, 446–457. [Google Scholar] [CrossRef]
- Meers, M.P.; Bryson, T.D.; Henikoff, J.G.; Henikoff, S. Improved CUT&RUN chromatin profiling tools. Elife 2019, 8, e46314. [Google Scholar] [CrossRef]
- Skene, P.J.; Henikoff, S. An efficient targeted nuclease strategy for high-resolution mapping of DNA binding sites. Elife 2017, 6, e21856. [Google Scholar] [CrossRef]
- Liu, N. Library Prep for CUT&RUN with NEBNext® UltraTM II DNA Library Prep Kit for Illumina® (E7645) V2; Protocols.io: Berkeley, CA, USA, 2018. [Google Scholar] [CrossRef]
- Ewels, P.; Magnusson, M.; Lundin, S.; Kaller, M. MultiQC: Summarize analysis results for multiple tools and samples in a single report. Bioinformatics 2016, 32, 3047–3048. [Google Scholar] [CrossRef]
- Martin, M. Cutadapt removes adapter sequences from high-throughput sequencing reads. EMBnet J. 2011, 17, 10. [Google Scholar] [CrossRef]
- Langmead, B.; Salzberg, S.L. Fast gapped-read alignment with Bowtie 2. Nat. Methods 2012, 9, 357–359. [Google Scholar] [CrossRef]
- Li, H.; Handsaker, B.; Wysoker, A.; Fennell, T.; Ruan, J.; Homer, N.; Marth, G.; Abecasis, G.; Durbin, R.; Genome Project Data Processing, S. The Sequence Alignment/Map format and SAMtools. Bioinformatics 2009, 25, 2078–2079. [Google Scholar] [CrossRef]
- Quinlan, A.R.; Hall, I.M. BEDTools: A flexible suite of utilities for comparing genomic features. Bioinformatics 2010, 26, 841–842. [Google Scholar] [CrossRef]
- Zhang, Y.; Liu, T.; Meyer, C.A.; Eeckhoute, J.; Johnson, D.S.; Bernstein, B.E.; Nusbaum, C.; Myers, R.M.; Brown, M.; Li, W.; et al. Model-based analysis of ChIP-Seq (MACS). Genome Biol. 2008, 9, R137. [Google Scholar] [CrossRef]
- Robinson, J.T.; Thorvaldsdottir, H.; Winckler, W.; Guttman, M.; Lander, E.S.; Getz, G.; Mesirov, J.P. Integrative genomics viewer. Nat. Biotechnol. 2011, 29, 24–26. [Google Scholar] [CrossRef]
- Edgar, R.; Domrachev, M.; Lash, A.E. Gene Expression Omnibus: NCBI gene expression and hybridization array data repository. Nucleic Acids Res. 2002, 30, 207–210. [Google Scholar] [CrossRef]
- Donohue, L.K.H.; Guo, M.G.; Zhao, Y.; Jung, N.; Bussat, R.T.; Kim, D.S.; Neela, P.H.; Kellman, L.N.; Garcia, O.S.; Meyers, R.M.; et al. A cis-regulatory lexicon of DNA motif combinations mediating cell-type-specific gene regulation. Cell Genom. 2022, 2, 100191. [Google Scholar] [CrossRef]
- Mölder, F.; Jablonski, K.P.; Letcher, B.; Hall, M.B.; Tomkins-Tinch, C.H.; Sochat, V.; Forster, J.; Lee, S.; Twardziok, S.O.; Kanitz, A.; et al. Sustainable data analysis with Snakemake. F1000Res 2021, 10, 33. [Google Scholar] [CrossRef]
- Andrews, S. FastQC: A Quality Control Tool for High Throughput Sequence Data [Online]. 2010. Available online: https://www.bioinformatics.babraham.ac.uk/projects/fastqc/ (accessed on 29 March 2022).
- Bolger, A.M.; Lohse, M.; Usadel, B. Trimmomatic: A flexible trimmer for Illumina sequence data. Bioinformatics 2014, 30, 2114–2120. [Google Scholar] [CrossRef]
- Ramirez, F.; Ryan, D.P.; Gruning, B.; Bhardwaj, V.; Kilpert, F.; Richter, A.S.; Heyne, S.; Dundar, F.; Manke, T. deepTools2: A next generation web server for deep-sequencing data analysis. Nucleic Acids Res. 2016, 44, W160–W165. [Google Scholar] [CrossRef]
- Yu, G.; Wang, L.G.; He, Q.Y. ChIPseeker: An R/Bioconductor package for ChIP peak annotation, comparison and visualization. Bioinformatics 2015, 31, 2382–2383. [Google Scholar] [CrossRef]
- Lawrence, M.; Huber, W.; Pages, H.; Aboyoun, P.; Carlson, M.; Gentleman, R.; Morgan, M.T.; Carey, V.J. Software for computing and annotating genomic ranges. PLoS Comput. Biol. 2013, 9, e1003118. [Google Scholar] [CrossRef]
- Lawrence, M.; Gentleman, R.; Carey, V. rtracklayer: An R package for interfacing with genome browsers. Bioinformatics 2009, 25, 1841–1842. [Google Scholar] [CrossRef]
- Team-TBD. BSgenome.Hsapiens.UCSC.hg19: Full Genome Sequences for Homo Sapiens (UCSC Version hg19, Based on GRCh37.p13); R Package Version 1.4.3; Bioconductor. 2020. Available online: https://bioconductor.org/packages/release/data/annotation/html/BSgenome.Hsapiens.UCSC.hg19.html (accessed on 29 March 2024).
- Pagés, H.; Aboyoun, P.; Gentleman, R.; DebRoy, S. Biostrings: Efficient Manipulation of Biological Strings; Bioconductor. 2024. Available online: https://bioconductor.org/packages/release/bioc/manuals/Biostrings/man/Biostrings.pdf (accessed on 29 March 2024).
- Zhou, Y.; Zhou, B.; Pache, L.; Chang, M.; Khodabakhshi, A.H.; Tanaseichuk, O.; Benner, C.; Chanda, S.K. Metascape provides a biologist-oriented resource for the analysis of systems-level datasets. Nat. Commun. 2019, 10, 1523. [Google Scholar] [CrossRef]
- Yu, G.; Wang, L.G.; Han, Y.; He, Q.Y. clusterProfiler: An R package for comparing biological themes among gene clusters. OMICS 2012, 16, 284–287. [Google Scholar] [CrossRef]
- Wickham, H. Ggplot2: Elegant Graphics for Data Analysis, 2nd ed.; Springer International Publishing: Berlin/Heidelberg, Germany, 2016. [Google Scholar]
- Chalepakis, G.; Goulding, M.; Read, A.; Strachan, T.; Gruss, P. Molecular basis of splotch and Waardenburg Pax-3 mutations. Proc. Natl. Acad. Sci. USA 1994, 91, 3685–3689. [Google Scholar] [CrossRef]
- Chalepakis, G.; Gruss, P. Identification of DNA recognition sequences for the Pax3 paired domain. Gene 1995, 162, 267–270. [Google Scholar] [CrossRef]
- Jun, S.; Desplan, C. Cooperative interactions between paired domain and homeodomain. Development 1996, 122, 2639–2650. [Google Scholar] [CrossRef]
- Epstein, J.A.; Song, B.; Lakkis, M.; Wang, C. Tumor-specific PAX3-FKHR transcription factor, but not PAX3, activates the platelet-derived growth factor alpha receptor. Mol. Cell Biol. 1998, 18, 4118–4130. [Google Scholar] [CrossRef]
- Chalepakis, G.; Wijnholds, J.; Gruss, P. Pax-3-DNA interaction: Flexibility in the DNA binding and induction of DNA conformational changes by paired domains. Nucleic Acids Res. 1994, 22, 3131–3137. [Google Scholar] [CrossRef]
- Pelletier, A.; Mayran, A.; Gouhier, A.; Omichinski, J.G.; Balsalobre, A.; Drouin, J. Pax7 pioneer factor action requires both paired and homeo DNA binding domains. Nucleic Acids Res. 2021, 49, 7424–7436. [Google Scholar] [CrossRef]
- Wilson, D.S.; Guenther, B.; Desplan, C.; Kuriyan, J. High resolution crystal structure of a paired (Pax) class cooperative homeodomain dimer on DNA. Cell 1995, 82, 709–719. [Google Scholar] [CrossRef]
- Phelan, S.A.; Loeken, M.R. Identification of a new binding motif for the paired domain of Pax-3 and unusual characteristics of spacing of bipartite recognition elements on binding and transcription activation. J. Biol. Chem. 1998, 273, 19153–19159. [Google Scholar] [CrossRef]
- Yin, Y.; Morgunova, E.; Jolma, A.; Kaasinen, E.; Sahu, B.; Khund-Sayeed, S.; Das, P.K.; Kivioja, T.; Dave, K.; Zhong, F.; et al. Impact of cytosine methylation on DNA binding specificities of human transcription factors. Science 2017, 356, eaaj2239. [Google Scholar] [CrossRef]
- Chalepakis, G.; Jones, F.S.; Edelman, G.M.; Gruss, P. Pax-3 contains domains for transcription activation and transcription inhibition. Proc. Natl. Acad. Sci. USA 1994, 91, 12745–12749. [Google Scholar] [CrossRef]
- Barral, A.; Zaret, K.S. Pioneer factors: Roles and their regulation in development. Trends Genet. 2024, 40, 134–148. [Google Scholar] [CrossRef]
- Creyghton, M.P.; Cheng, A.W.; Welstead, G.G.; Kooistra, T.; Carey, B.W.; Steine, E.J.; Hanna, J.; Lodato, M.A.; Frampton, G.M.; Sharp, P.A.; et al. Histone H3K27ac separates active from poised enhancers and predicts developmental state. Proc. Natl. Acad. Sci. USA 2010, 107, 21931–21936. [Google Scholar] [CrossRef]
- Crispatzu, G.; Rehimi, R.; Pachano, T.; Bleckwehl, T.; Cruz-Molina, S.; Xiao, C.; Mahabir, E.; Bazzi, H.; Rada-Iglesias, A. The chromatin, topological and regulatory properties of pluripotency-associated poised enhancers are conserved in vivo. Nat. Commun. 2021, 12, 4344. [Google Scholar] [CrossRef]
- Gates, L.A.; Foulds, C.E.; O’Malley, B.W. Histone Marks in the ’Driver’s Seat’: Functional Roles in Steering the Transcription Cycle. Trends Biochem. Sci. 2017, 42, 977–989. [Google Scholar] [CrossRef]
- Bondurand, N.; Pingault, V.; Goerich, D.E.; Lemort, N.; Sock, E.; Caignec, C.L.; Wegner, M.; Goossens, M. Interaction among SOX10, PAX3 and MITF, three genes altered in Waardenburg syndrome. Hum. Mol. Genet. 2000, 9, 1907–1917. [Google Scholar] [CrossRef]
- Potterf, S.B.; Furumura, M.; Dunn, K.J.; Arnheiter, H.; Pavan, W.J. Transcription factor hierarchy in Waardenburg syndrome: Regulation of MITF expression by SOX10 and PAX3. Hum. Genet. 2000, 107, 1–6. [Google Scholar] [CrossRef]
- Smith, M.P.; Brunton, H.; Rowling, E.J.; Ferguson, J.; Arozarena, I.; Miskolczi, Z.; Lee, J.L.; Girotti, M.R.; Marais, R.; Levesque, M.P.; et al. Inhibiting Drivers of Non-mutational Drug Tolerance Is a Salvage Strategy for Targeted Melanoma Therapy. Cancer Cell 2016, 29, 270–284. [Google Scholar] [CrossRef]
- Eccles, M.R.; He, S.; Ahn, A.; Slobbe, L.J.; Jeffs, A.R.; Yoon, H.S.; Baguley, B.C. MITF and PAX3 Play Distinct Roles in Melanoma Cell Migration; Outline of a “Genetic Switch” Theory Involving MITF and PAX3 in Proliferative and Invasive Phenotypes of Melanoma. Front. Oncol. 2013, 3, 229. [Google Scholar] [CrossRef] [PubMed]
- Gruis, N.A.; Weaver-Feldhaus, J.; Liu, Q.; Frye, C.; Eeles, R.; Orlow, I.; Lacombe, L.; Ponce-Castaneda, V.; Lianes, P.; Latres, E.; et al. Genetic evidence in melanoma and bladder cancers that p16 and p53 function in separate pathways of tumor suppression. Am. J. Pathol. 1995, 146, 1199–1206. [Google Scholar] [PubMed]
- Dasen, J.S.; Martinez Barbera, J.P.; Herman, T.S.; Connell, S.O.; Olson, L.; Ju, B.; Tollkuhn, J.; Baek, S.H.; Rose, D.W.; Rosenfeld, M.G. Temporal regulation of a paired-like homeodomain repressor/TLE corepressor complex and a related activator is required for pituitary organogenesis. Genes. Dev. 2001, 15, 3193–3207. [Google Scholar] [CrossRef]
- Kioussi, C.; Gross, M.K.; Gruss, P. Pax3: A paired domain gene as a regulator in PNS myelination. Neuron 1995, 15, 553–562. [Google Scholar] [CrossRef]
- Lang, D.; Epstein, J.A. Sox10 and Pax3 physically interact to mediate activation of a conserved c-RET enhancer. Hum. Mol. Genet. 2003, 12, 937–945. [Google Scholar] [CrossRef]
- Seberg, H.E.; Van Otterloo, E.; Loftus, S.K.; Liu, H.; Bonde, G.; Sompallae, R.; Gildea, D.E.; Santana, J.F.; Manak, J.R.; Pavan, W.J.; et al. TFAP2 paralogs regulate melanocyte differentiation in parallel with MITF. PLoS Genet. 2017, 13, e1006636. [Google Scholar] [CrossRef]
- Milunsky, J.M.; Maher, T.M.; Zhao, G.; Wang, Z.; Mulliken, J.B.; Chitayat, D.; Clemens, M.; Stalker, H.J.; Bauer, M.; Burch, M.; et al. Genotype-phenotype analysis of the branchio-oculo-facial syndrome. Am. J. Med. Genet. A 2011, 155A, 22–32. [Google Scholar] [CrossRef]
- Kenny, C.; Dilshat, R.; Seberg, H.E.; Van Otterloo, E.; Bonde, G.; Helverson, A.; Franke, C.M.; Steingrimsson, E.; Cornell, R.A. TFAP2 paralogs facilitate chromatin access for MITF at pigmentation and cell proliferation genes. PLoS Genet. 2022, 18, e1010207. [Google Scholar] [CrossRef]
- Hong, C.S.; Devotta, A.; Lee, Y.H.; Park, B.Y.; Saint-Jeannet, J.P. Transcription factor AP2 epsilon (Tfap2e) regulates neural crest specification in Xenopus. Dev. Neurobiol. 2014, 74, 894–906. [Google Scholar] [CrossRef]
- Campbell, N.R.; Rao, A.; Hunter, M.V.; Sznurkowska, M.K.; Briker, L.; Zhang, M.; Baron, M.; Heilmann, S.; Deforet, M.; Kenny, C.; et al. Cooperation between melanoma cell states promotes metastasis through heterotypic cluster formation. Dev. Cell 2021, 56, 2808–2825.e10. [Google Scholar] [CrossRef]
- Black, A.R.; Black, J.D.; Azizkhan-Clifford, J. Sp1 and kruppel-like factor family of transcription factors in cell growth regulation and cancer. J. Cell Physiol. 2001, 188, 143–160. [Google Scholar] [CrossRef] [PubMed]
- Chen, T.T.; Wu, R.L.; Castro-Munozledo, F.; Sun, T.T. Regulation of K3 keratin gene transcription by Sp1 and AP-2 in differentiating rabbit corneal epithelial cells. Mol. Cell Biol. 1997, 17, 3056–3064. [Google Scholar] [CrossRef] [PubMed]
- Bajard, L.; Relaix, F.; Lagha, M.; Rocancourt, D.; Daubas, P.; Buckingham, M.E. A novel genetic hierarchy functions during hypaxial myogenesis: Pax3 directly activates Myf5 in muscle progenitor cells in the limb. Genes. Dev. 2006, 20, 2450–2464. [Google Scholar] [CrossRef] [PubMed]
- Daubas, P.; Buckingham, M.E. Direct molecular regulation of the myogenic determination gene Myf5 by Pax3, with modulation by Six1/4 factors, is exemplified by the -111 kb-Myf5 enhancer. Dev. Biol. 2013, 376, 236–244. [Google Scholar] [CrossRef]
- Sato, T.; Rocancourt, D.; Marques, L.; Thorsteinsdottir, S.; Buckingham, M. A Pax3/Dmrt2/Myf5 regulatory cascade functions at the onset of myogenesis. PLoS Genet. 2010, 6, e1000897. [Google Scholar] [CrossRef]
Disclaimer/Publisher’s Note: The statements, opinions and data contained in all publications are solely those of the individual author(s) and contributor(s) and not of MDPI and/or the editor(s). MDPI and/or the editor(s) disclaim responsibility for any injury to people or property resulting from any ideas, methods, instructions or products referred to in the content. |
© 2025 by the authors. Licensee MDPI, Basel, Switzerland. This article is an open access article distributed under the terms and conditions of the Creative Commons Attribution (CC BY) license (https://creativecommons.org/licenses/by/4.0/).