Article

The Complete Mitochondrial Genome of Red Costate Tiger Moth (Aloa lactinea [Cramer, 1777]), and Phylogenetic Analyses of the Subfamily Arctiinae

1
Anhui Province Eco-Environmental Monitoring Center, Hefei 230071, China
2
College of Life Sciences, Anhui University, Hefei 230093, China
*
Author to whom correspondence should be addressed.
Genes 2025, 16(5), 554; https://doi.org/10.3390/genes16050554
Submission received: 27 March 2025 / Revised: 26 April 2025 / Accepted: 29 April 2025 / Published: 30 April 2025
(This article belongs to the Section Animal Genetics and Genomics)

Abstract

:
Background/Objectives: Aloa lactinea, class Insecta, order Lepidoptera, superfamily Noctuoidea, family Erebidae, and subfamily Arctiinae, is a polytrophic agricultural pest. However, there are still many sequences missing for Arctiinae from mitochondrial whole-genome sequences. Methods: In this study, we determined and analyzed the complete mitochondrial genome sequence of A. lactinea. Furthermore, based on the sequencing results, we used the Bayesian inference, maximum likelihood, and maximum reduction methods to analyze the phylogenies of 18 species of the Hypophora subfamily. Results: The mitochondrial genome was found to be a circular double-stranded DNA with a length of 15,380 bp and included 13 protein-coding genes (PCGS), 22 tRNA genes, 2 rRNA genes, and one control region. With the exception of tRNASer(AGC), all the tRNA genes could form conventional clover structures. There were 23 intergenic spacer regions with lengths of 1–52 bp and six gene overlaps with lengths of 1–8 bp. The control region was located between rrnS and tRNAMet genes and comprised 303 bp and an AT content of 74.25%. Conclusions: The results showed that A. lactinea is closely related to Hyphantria cunea. Our results suggest that Syntomini is phylogenetically distinct from Arctiini and may warrant separate tribal status within Arctiinae. This study is dedicated to researching the mitochondrial genome and phylogenetic relationships of A. lactinea, providing a molecular basis for its classification.

1. Introduction

The red costate tiger moth (Aloa lactinea) belongs to the Arctiinae subfamily, Noctuoidea superfamily, Erebidae family, and Lepidoptera order. It is mainly found in China, Japan, Korea, India, Vietnam, Myanmar, Nepal, Sri Lanka, Indonesia, and other Asian countries [1,2]. The most distinctive feature of the adult A. lactinea is the presence of a distinct red band on the anterior edge of its white wings, and the unique pattern of alternating orange-yellow and black transverse bands on the dorsal side of its abdomen. The male moths have black serrated antennae, red-tipped black labial palps, and red-black feet. These combined features can serve as reliable identification criteria [3]. Hundreds of plants serve as hosts for red costate tiger moths, such as Cruciferae crops, beans, green onions, and other vegetables, making them notable polytrophic agricultural pests [1,2]. The larvae of the red costate tiger moth are voracious, feeding on the stems, flowers, and fruits of host plants. In severe cases, they may defoliate entire plants, leaving only veins and flower stalks [4]. Their eggs tend to be clustered, and larvae disperse after the third instar, chewing holes into leaves.
The taxonomic status of Noctuoidea has undergone continuous revision, and the phylogenetic relationships within this superfamily remain a subject of debate [5]. Initially, Miller proposed that Noctuidae comprised seven subfamilies (Oenosandridae, Doidae, Notodontidae, Lymantriidae, Arctiidae, Aganaidae, and Noctuidae) [6]. However, Scoble contended that Aganainae should be classified as a subfamily within Noctuidae. Subsequently, with advancements in molecular biology techniques, Lafontaine and Fibiger suggested that Noctuidae consists of five subfamilies (Oenosandridae, Doidae, Notodontidae, Micronoctuidae, and Noctuidae) [7]. Zahiri et al., based on recent morphological and molecular analyses [5], proposed a revised classification for Noctuoidea, which offers hope for a more stable family-level taxonomy. Within Noctuoidea, the subfamily Arctiinae includes over 11,000 species [8]. Due to significant morphological similarities and genetic diversity, classifying genera and species within Arctiinae remains particularly challenging, especially for groups that diverged relatively recently [9]. To date, the systematic classification of species within Arctiinae remains unresolved.
Mitochondria are semi-autonomous organelles with independent genetic material in eukaryotic cells [10]. The mitochondrial genome has strict maternal inheritance, is an ideal molecular genetic marker, and has been widely used for species identification in population genetics, molecular diagnoses, and phylogenetic studies [11]. The mitochondrial genome of Lepidoptera is a circular double-stranded DNA molecule of 15–16 kb [12]. Because of their high mutation rates, rapid evolution rates, and ease of expansion, mitochondrial genomes are widely used in species classification and phylogenetic studies and are important molecular markers [13,14]. However, only 22 whole mitochondrial genome sequences have been determined and assembled, with many missing for Arctiinae [9,15,16,17,18].
In this study, we determined and analyzed the whole mitochondrial genome sequence of A. lactinea. We further compared the mitochondrial genome of Rufibridae with those of 17 other species from the subfamily. Based on the mitochondrial genome sequences, we constructed phylogenetic trees of 18 species within the subfamily and discussed the phylogenetic relationships within the subfamily, providing a molecular basis for the classification of various genera and species of the subfamily to lay a foundation for research on the molecular identification, taxonomic status, and mitochondrial genomes of the subfamily.

2. Materials and Methods

2.1. Sample Collection and DNA Extraction

The two A. lactinea specimens used in this study were collected by the authors from Fuxi, Huangshan City, Anhui Province, China (30°09′28″ N, 118°05′54″ E), on 4 July 2023. Four legs were excised from each specimen and preserved in anhydrous ethanol at –20 °C until processing. Mitochondrial genomic DNA was extracted from the ethanol-fixed tissues using the standard phenol/chloroform method [19]. DNA concentration and quality were assessed by 1% agarose gel electrophoresis [20].

2.2. DNA Sequencing and Splicing

A starting amount of 1 μg of DNA was used for whole-genome library construction. The extracted DNA was broken down by ultrasound to 300–500 bp. The TruSeqTM Nano DNA Sample Prep Kit (Illumina, San Diego, CA, USA) was used for terminal repair, adding an A tail to the 3′ end, and connecting indexed splices, followed by 8-cycle PCR amplification (50 μL reaction system: 30–40 μL DNA fragments, 5 μL primer mix, 25 μL 2× master mix, and nuclease-free water to adjust the final volume to 50 μL). The PCR protocol was set as follows: initial denaturation at 98 °C for 30 s; 8 cycles of denaturation at 98 °C for 10 s, annealing at 60 °C for 30 s, and extension at 72 °C for 30 s; followed by a final extension at 72 °C for 5 min. The PCR products were size-selected (300–500 bp) via 2% agarose gel electrophoresis, purified, and then subjected to paired-end sequencing (2 × 150 bp) with a sequencing depth of 52× on the Illumina NovaSeq 6000 platform at Beijing Qingke Biotechnology Co., Ltd. (Beijing, China). Raw reads underwent quality control using Trimmomatic v0.39 (http://www.usadellab.org/cms/index.php?page=trimmomatic) (accessed on 1 July 2024) [21], with default settings applied. This quality control process included the removal of adapter sequences, trimming of non-AGCT bases at the 5′ end, exclusion of low-quality bases (Phred score < 20) from read termini, discarding of reads containing more than 10% ambiguous bases (N), and elimination of fragments shorter than 75 bp after trimming. The resulting high-quality reads were deemed appropriate for subsequent analyses. For the PacBio Sequel II platform data, the raw BAM files were converted into FASTQ format through a stringent quality control pipeline. This pipeline included (1) an initial filtering step to discard Polymerase reads shorter than 200 bp, (2) removal of low-quality reads with accuracy scores below 0.80, (3) extraction of Subreads with subsequent trimming of adapter sequences, and (4) a final filtering step to exclude Subreads under 200 bp in length. This comprehensive approach ensured the generation of high-fidelity third-generation sequencing data, ready for downstream genomic applications. Illumina sequencing data were assembled using GetOrganelle v1.7.5 (https://github.com/Kinggerm/GetOrganelle) (accessed on 1 July 2024) [22]. Align the second-generation assembled sequences to the PacBio third-generation data using BWA v0.7.17 [23], and extract the target sample’s third-generation data. Mix the extracted third-generation data with the second-generation data for assembly using SPAdes v3.14.1 [24]. Select sequences with high coverage depth and longer assembly lengths as candidates. Align these sequences to the NT database to identify mitochondrial scaffold sequences, then use overlap to join the sequences. Align the clean reads back to the mitochondrial genome sequence and use Pilon v1.23 [25] to correct the bases. Determine the starting position and orientation of the mitochondrial assembly sequence based on the reference genome to obtain the final mitochondrial genome sequence. Remove redundancy from the initial gene predictions made by MITOS, manually correct the start and stop codon positions, and obtain a high-accuracy set of conserved genes. Use the CGView v2.0.1 software (http://stothard.afns.ualberta.ca/cgview_server/) (accessed on 1 July 2024) [26] to generate a circular map of the sample genome.

2.3. Mitochondrial Genome Annotation

Base composition and relative synonymous codon usage were calculated using MEGA v11.0 software [27]. The Mitochondrial Genome Annotation Server (http://mitos.bioinf.uni-leipzig.de/index.py) (accessed on 3 July 2024) [28] was used to predict the protein-coding, tRNA, and rRNA genes from the whole mitochondrial genome. Remove redundancy from the initial gene predictions made by MITOS, manually correct the start and stop codon positions, and obtain a high-accuracy set of conserved genes. Use the CGView software (http://stothard.afns.ualberta.ca/cgview_server/) (accessed on 3 July 2024) [26] to generate a circular map of the sample genome. The tRNA secondary structure was predicted using tRNA structure 5.7 [29]. The secondary RNA structure was calibrated based on predictive models from other insect species [30,31,32,33,34]. Tandem Repeats Finder v4.1software was used to identify tandem repeats in the A+T-rich region [35]. Chain asymmetry was calculated using Formulas (3.1) and (3.2) [36] as follows:
A-T skew = [A% − T%]/[A% + T%]
G-C skew = [G% − C%]/[G% + C%]

2.4. Phylogenetic Analysis

In this study, we utilized the newly sequenced complete mitochondrial genome of A. lactinea and combined it with sequences from 22 Arctiinae species obtained from GenBank (Table 1) to construct the phylogenetic relationships within the subfamily Arctiinae. Based on their genetic distances, five species—Eilema depressum, Eilema sororculum, Cybosia mesomella, Spilarctia lutea, and Miltochrista miniata—were selected as outgroups [37].
Complete mitochondrial genome sequences were retrieved from the NCBI database to construct the dataset. Sequence alignment was performed using MAFFT v7.0 [38], followed by manual curation. The dataset was then concatenated using PhyloSuite v1.2.3. Bayesian inference (BI) was performed using MrBayes 3.1.2 [39], with the optimal substitution model (GTR) selected based on jModeltest v2.1 [40]. The BI analysis was initiated with a random starting tree, and the Markov Chain Monte Carlo algorithm was set to four chains (three hot chains and one cold chain), which simultaneously ran 10 million generations. Sampling took place once every 1000 generations, when the mean standard deviation of separation frequency was less than 0.01 and the ESS value in TRACER 1.5 was greater than 200. The first 25% of trees were discarded as Burnin samples, and the remaining samples were used to build a Consensus tree. Bayesian posterior probability (BPP) was then calculated [39,41]. Maximum likelihood and maximum parsimony analyses were conducted in MEGA v11.0 [27], under the same model, with branch support evaluated using the ultrafast bootstrap method (1000 replicates).
Table 1. Information of species used for phylogenetic analysis of Arctiinae in this study.
GenusSpeciesGenbank Sequence Number
VamunaVamuna virilisNC_026844.1\
EilemaEilema ussuricumMN696172.1Unpublished
CyanaCyana sp. MT-2014KM244679.1[42]
ParaonaParaona staudingeriNC_037515.1\
SpilosomaSpilosoma lubricipedaMK903030.1Unpublished
ArctiaArctia plantaginisNC_057559.1[43]
HyphantriaHyphantria cuneaGU592049.1[30]
CallimorphaCallimorpha dominulaNC_027094.1[44]
LemyraLemyra melliNC_026692.1[33]
NyctemeraNyctemera arctata albofasciataKM244681.1[42]
NyctemeraNyctemera adversataNC_062185.1Unpublished
PhragmatobiaPhragmatobia fuliginosaNC_062183.1Unpublished
SpilarctiaSpilarctia subcarneaKT258909.1Unpublished
SpilarctiaSpilarctia casignetaNC_060594.1Unpublished
PareuchaetesPareuchaetes insulataNC_062088.1Unpublished
AmataAmata formosaeKC513737.1[31]
AmerilaAmerila albertiNC_062176.1Unpublished
AloaAloa lactinea\This study
MiltochristaMiltochrista miniataOW121779.1[37]
EilemaEilema sororculumOU618562.1\
EilemaEilema depressumOU612042.1\
CybosiaCybosia mesomellaOX276419.1\
SpilarctiaSpilarctia luteaOU696502.1\

3. Results

3.1. Mitochondrial Whole Genome Basic Structure

The mitochondrial genome was observed to be a circular double-stranded DNA of 15,380 bp and included 37 genes and one control region. These 37 genes comprised 13 protein-coding genes, 22 tRNA genes, and 2 rRNA genes. There were 9 protein-coding genes (ND2, COI, COII, ATP8, ATP6, COIII, ND3, ND6, CYTB), 14 tRNA genes (tRNAAla, tRNAArg, tRNAAsn, tRNASer(AGC), tRNAGlu, tRNAThr, tRNASer(TCA), tRNAMet, tRNAIle, tRNATrp, tRNALeu(TTA), tRNALys, tRNAAsp, tRNAGly), and control areas located on the H chain. Eight tRNA genes (tRNAGln, tRNACys, tRNATyr, tRNAPhe, tRNAHis, tRNAPro, tRNALeu(CTA), tRNAVal), four protein-coding genes (ND1, ND5, ND4, ND4L), and two rRNA genes were located on the L chain (Figure 1 and Table 2). The whole mitochondrial genome structure was the same as that of other existing species of Arctiinae (Figure 2).

3.2. Nucleotide Composition and Deviation Analysis

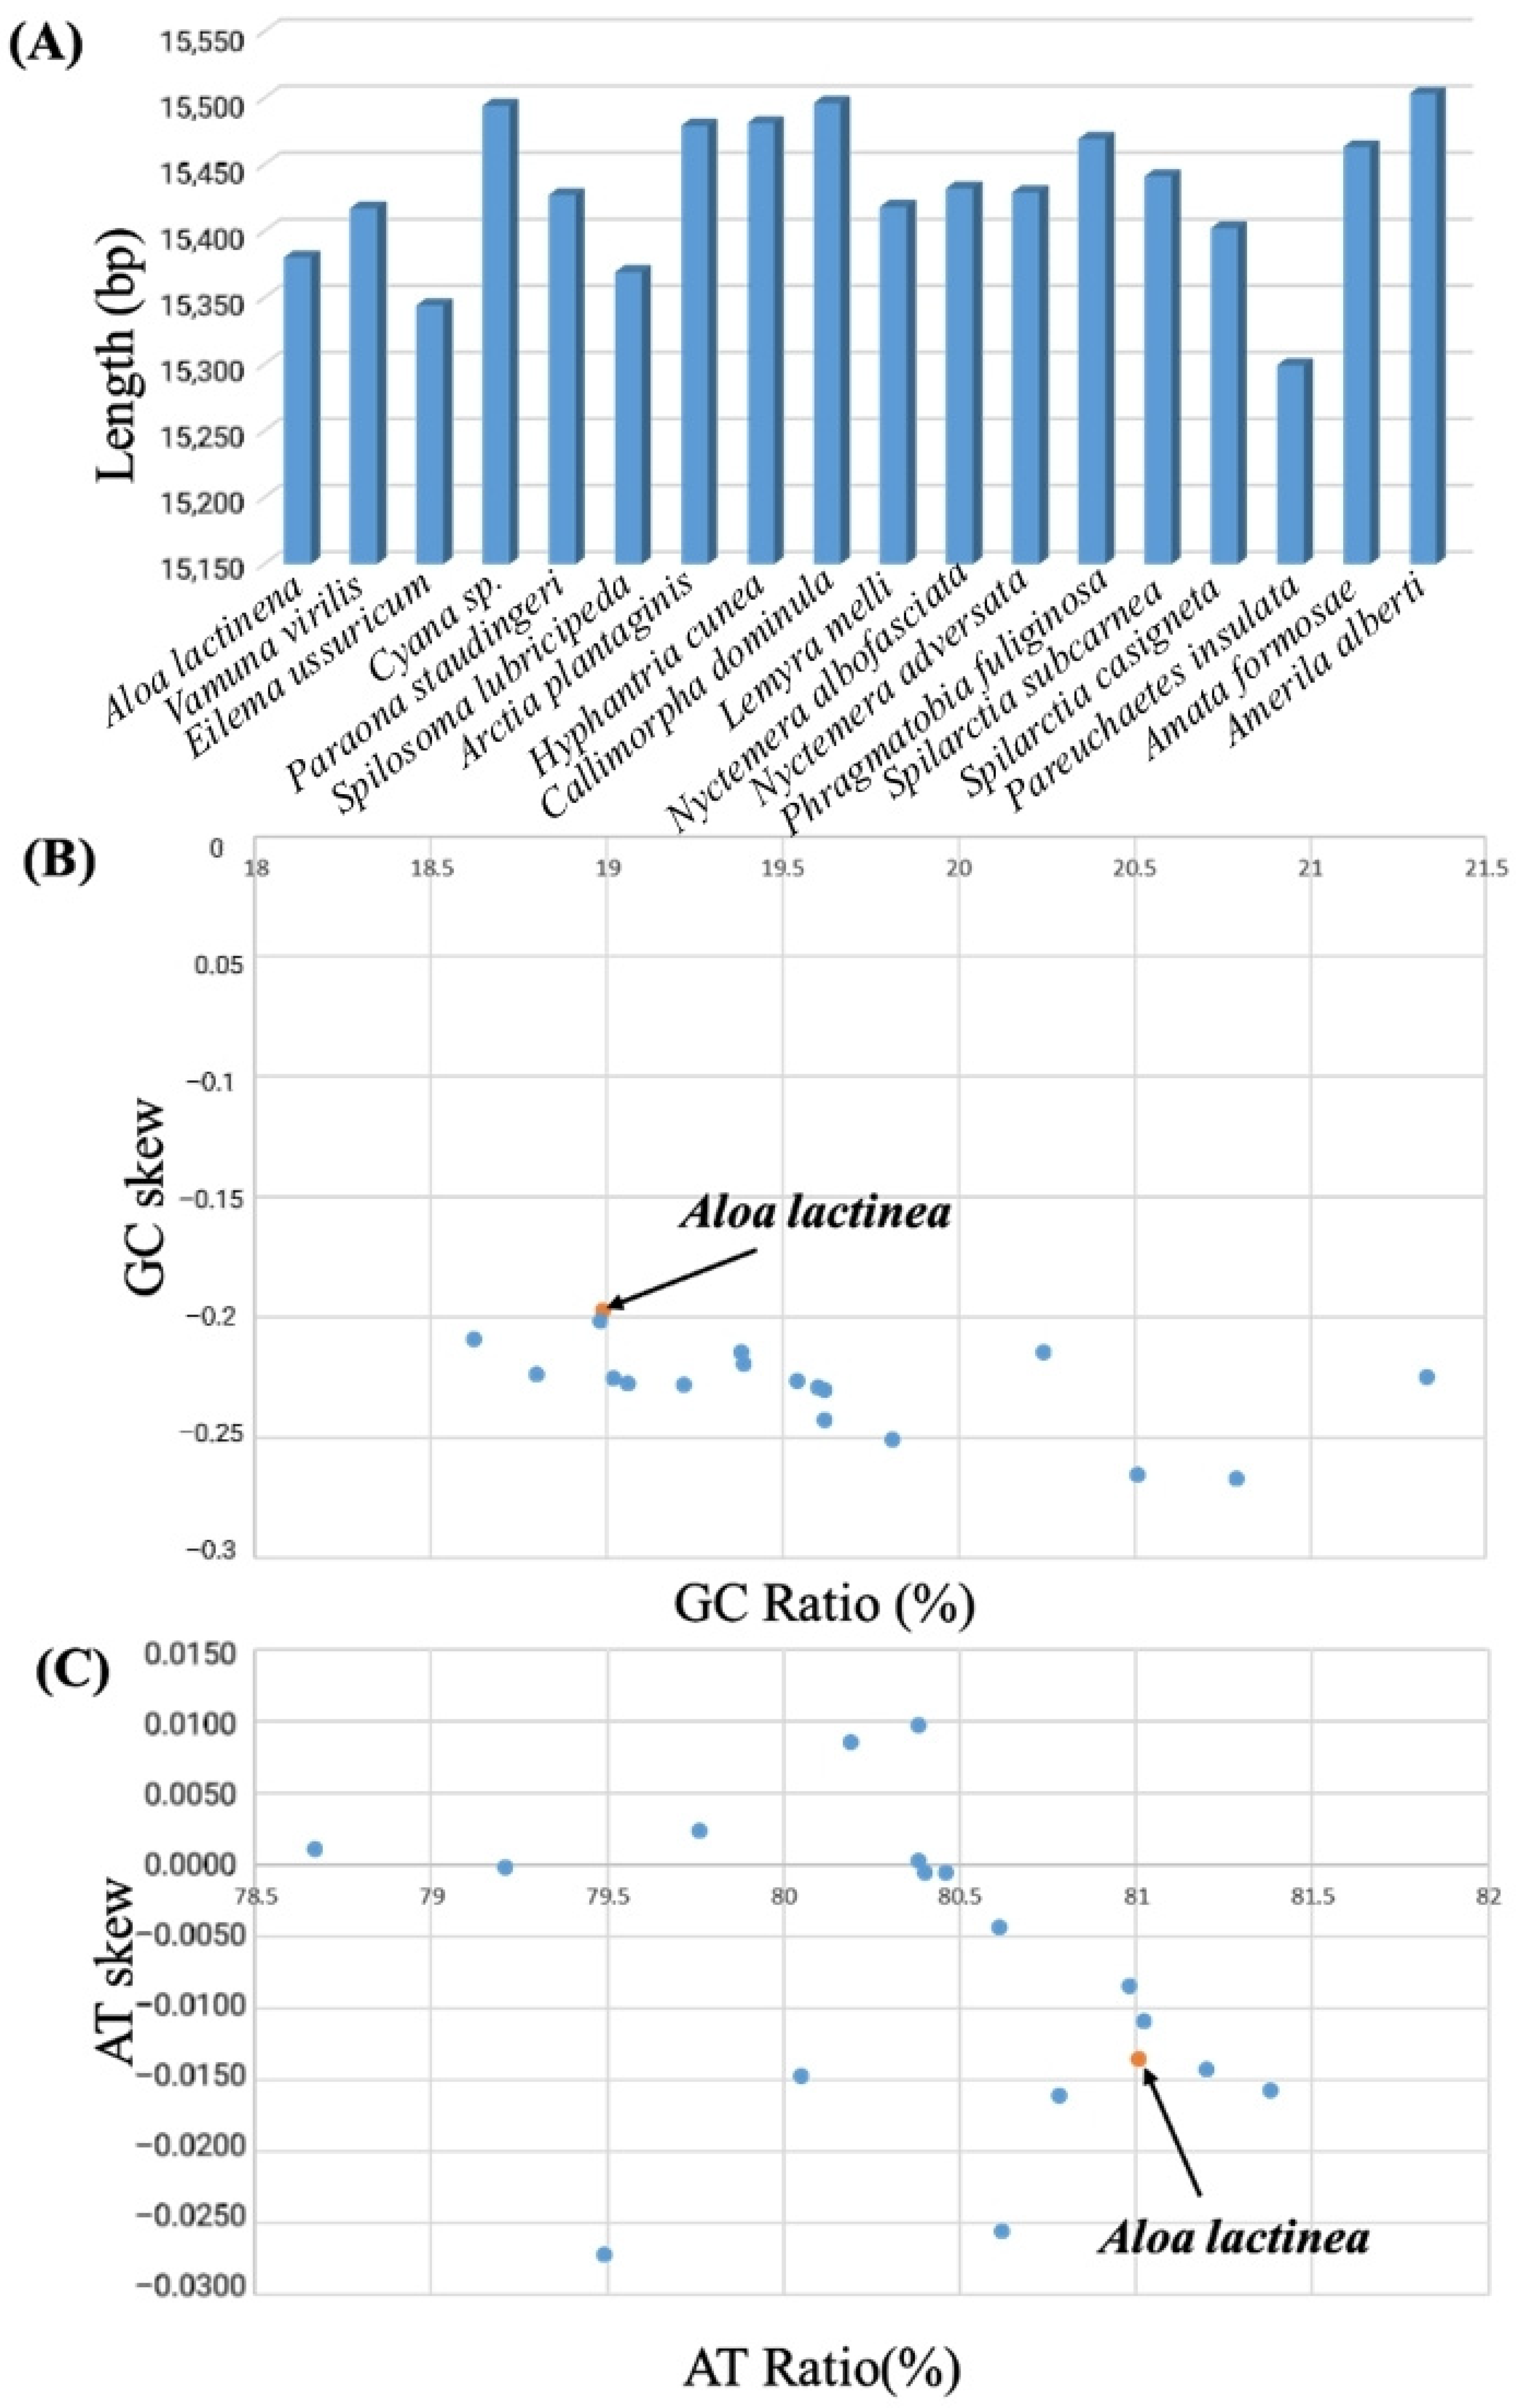
The mitochondrial genome of A. lactinea has a nucleotide composition of T (41.05%), A (39.95%), C (11.37%), and G (7.62%), resulting in an A+T content of 81.01% and a G+C content of 18.99%. All genes exhibit a significantly higher A+T content compared to G+C. The A+T content of tRNA genes is 81.87%, while that of rRNA genes reaches 85.28%. The total A+T content of protein-coding genes (PCGs) is 79.92%, with variation among individual PCGs: the lowest A+T content is observed in CO1 (72.64%), and the highest in ATP8 (93.83%). Across the entire genome, all genes consistently show a significantly higher A+T content than G+C. The AT skew values are positive for tRNA and rRNA genes, while other regions exhibit negative values. GC skew values are positive in ND5, ND4, ND4L, and ND1, as well as in tRNA and rRNA genes, whereas other regions show negative GC skew values (Table 3). The nucleotide composition and deviation of the whole mitochondrial genome of Corymbophora rubra were consistent with those of other species of Corymbophorinae. Spilosoma lubricipeda had the highest A+T content (81.38%) in the mitochondrial genome of the existing species. Lemyra melli had the lowest A+T content (78.67%) (Table 4). Both A. lactinea and the other 22 Arctiinae species mentioned in this study showed negative GC-skew, but while A. lactinea had negative AT-skew, some Arctiinae species displayed positive AT-skew (Figure 3).

3.3. The Use of Protein-Coding Genes and Codons

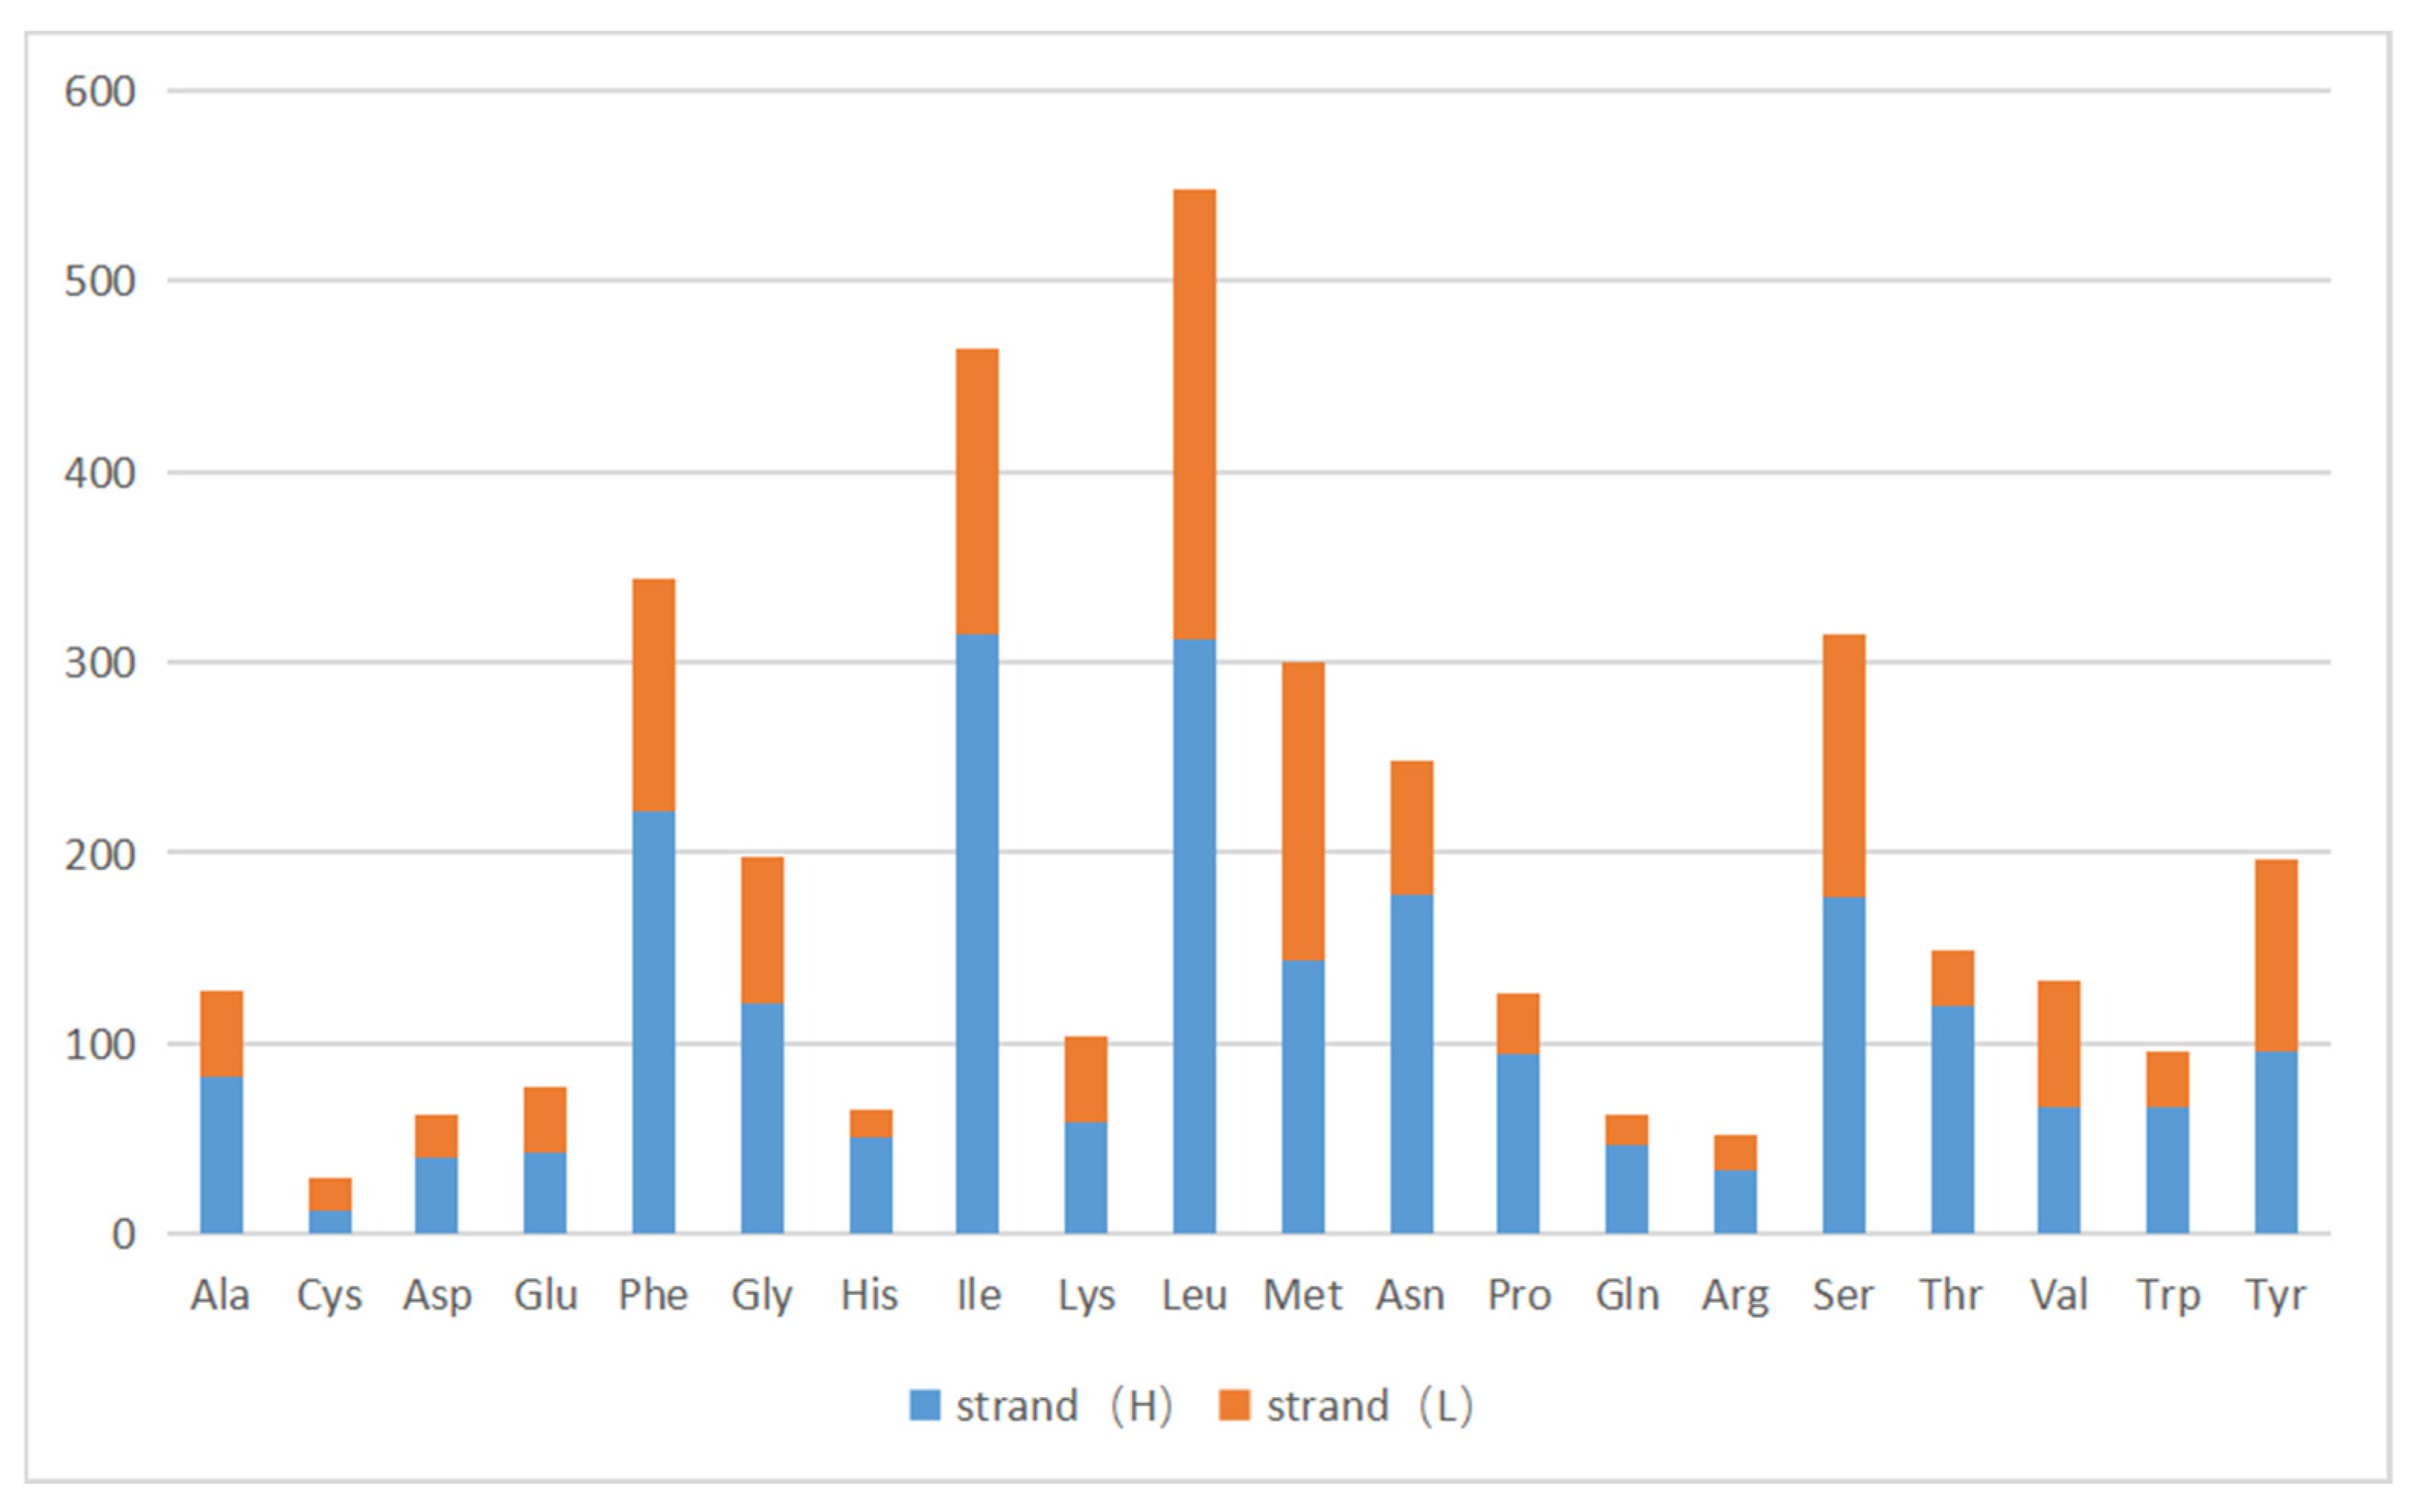
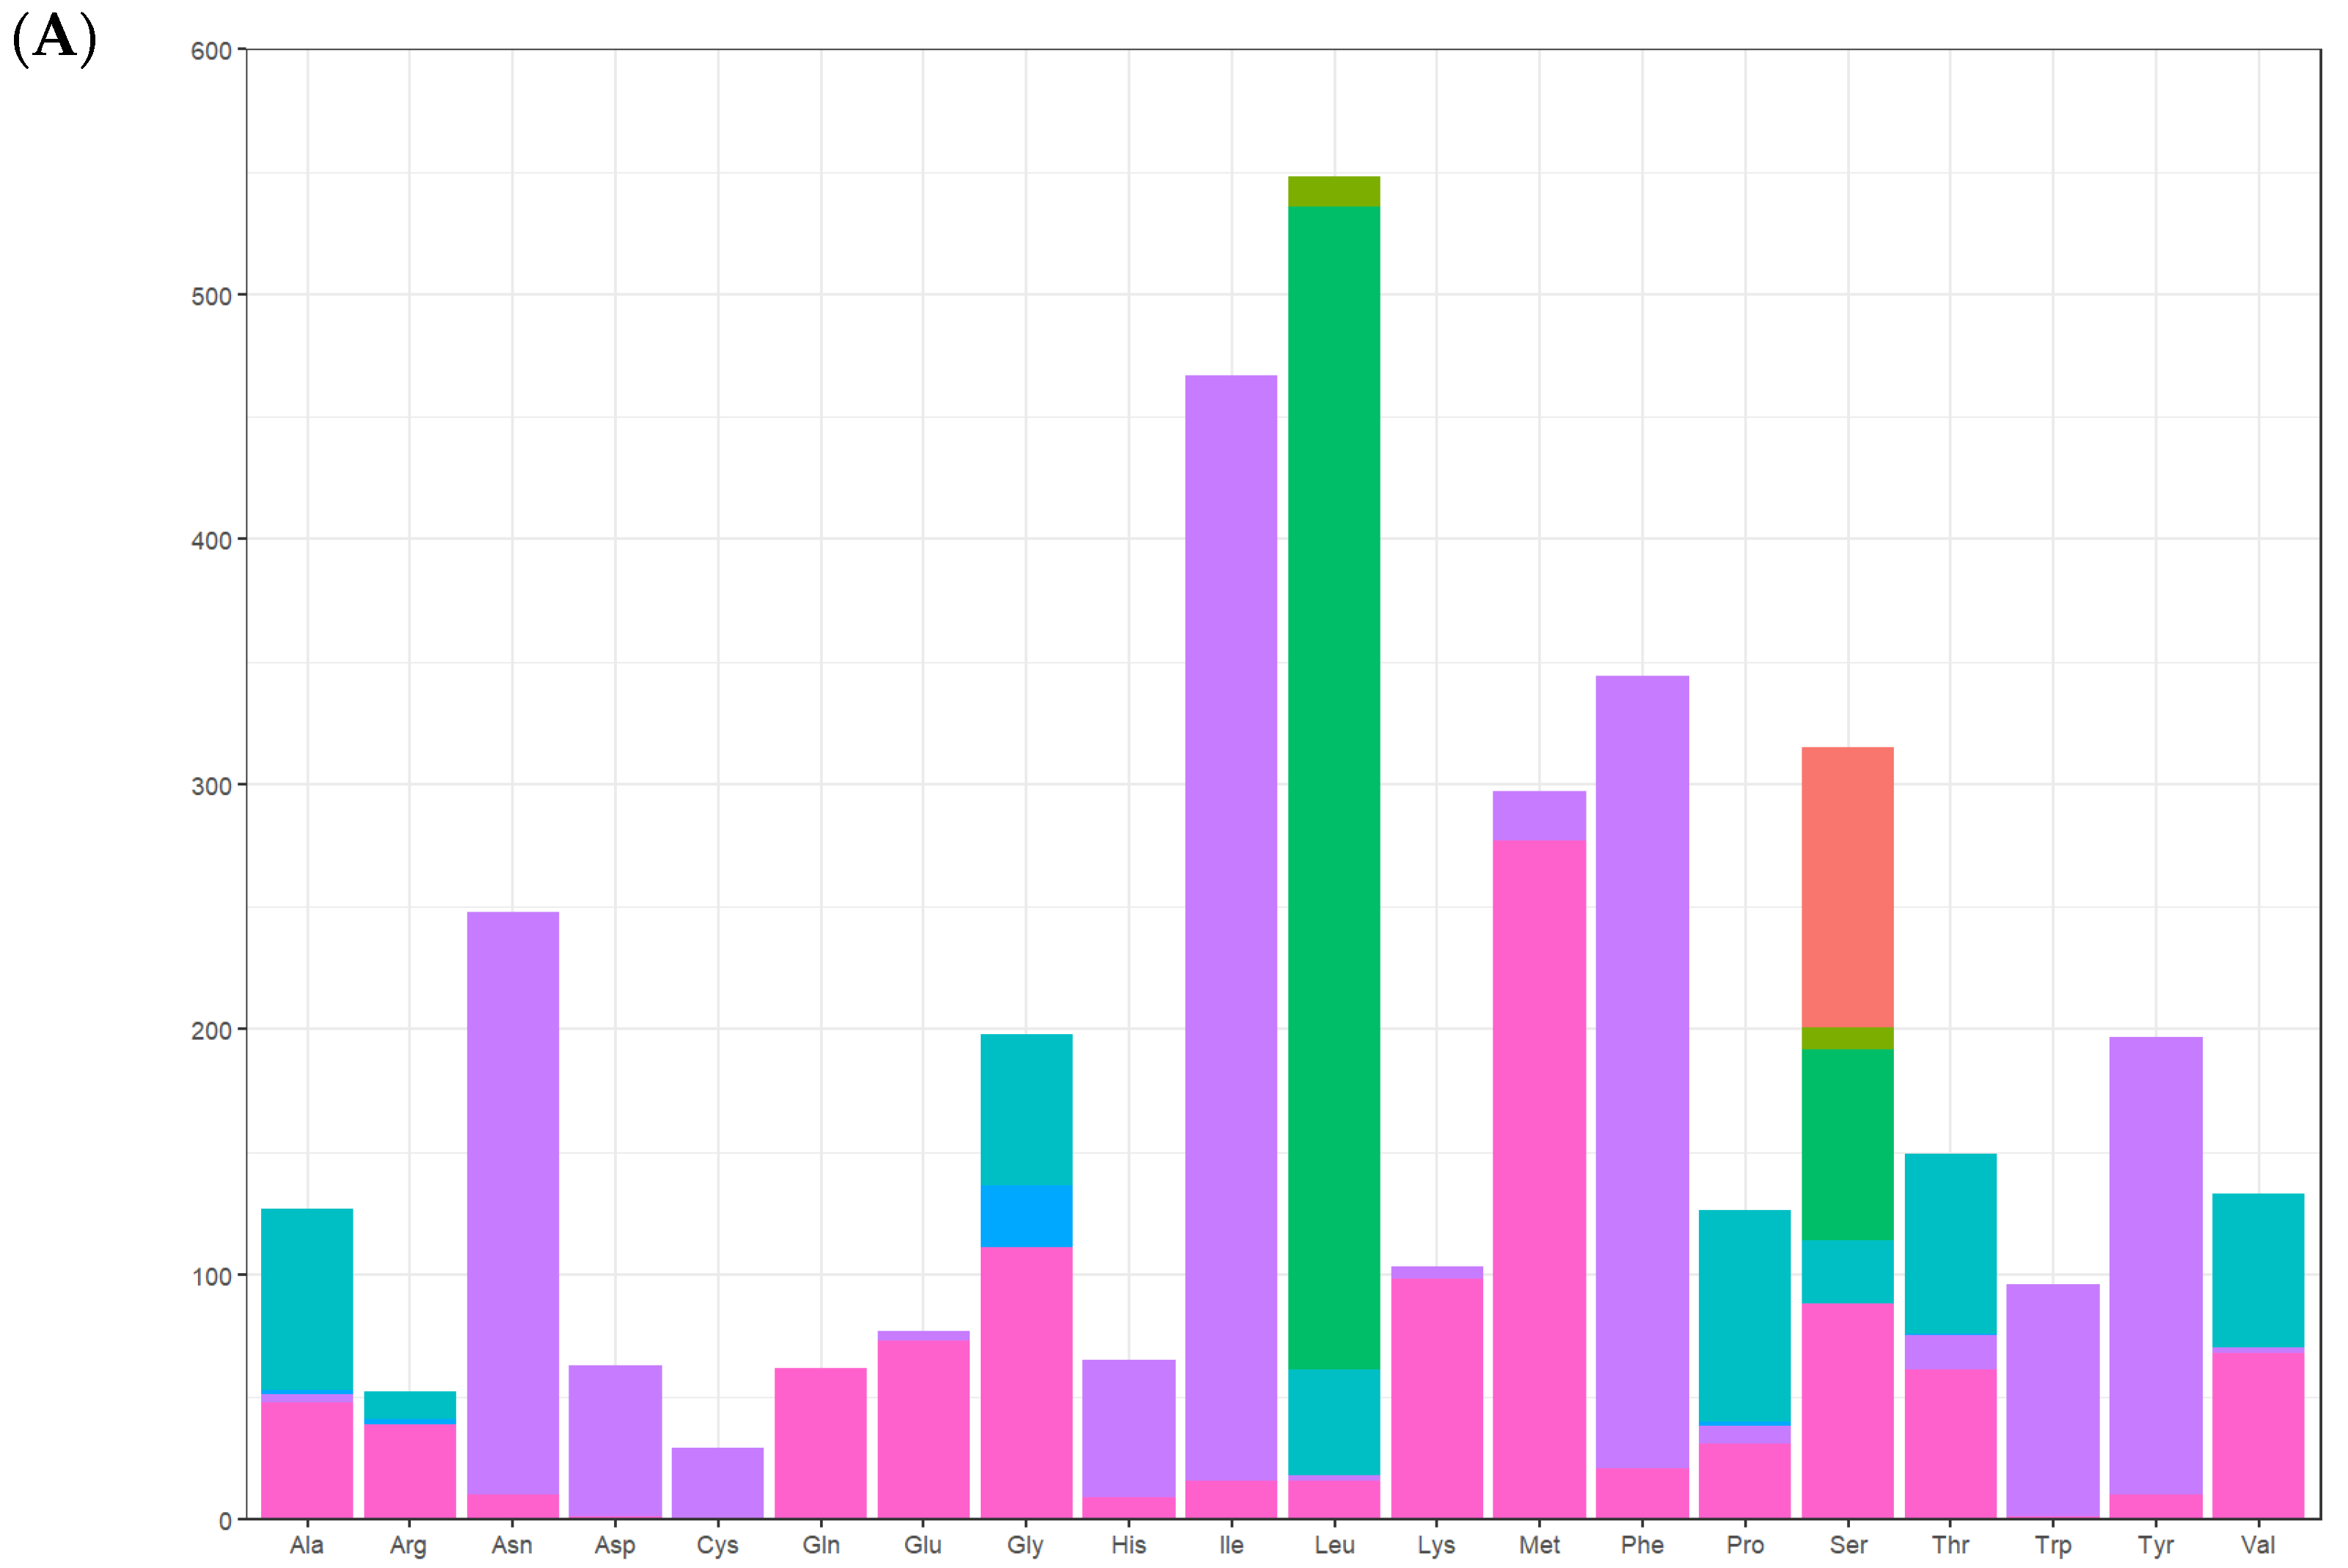
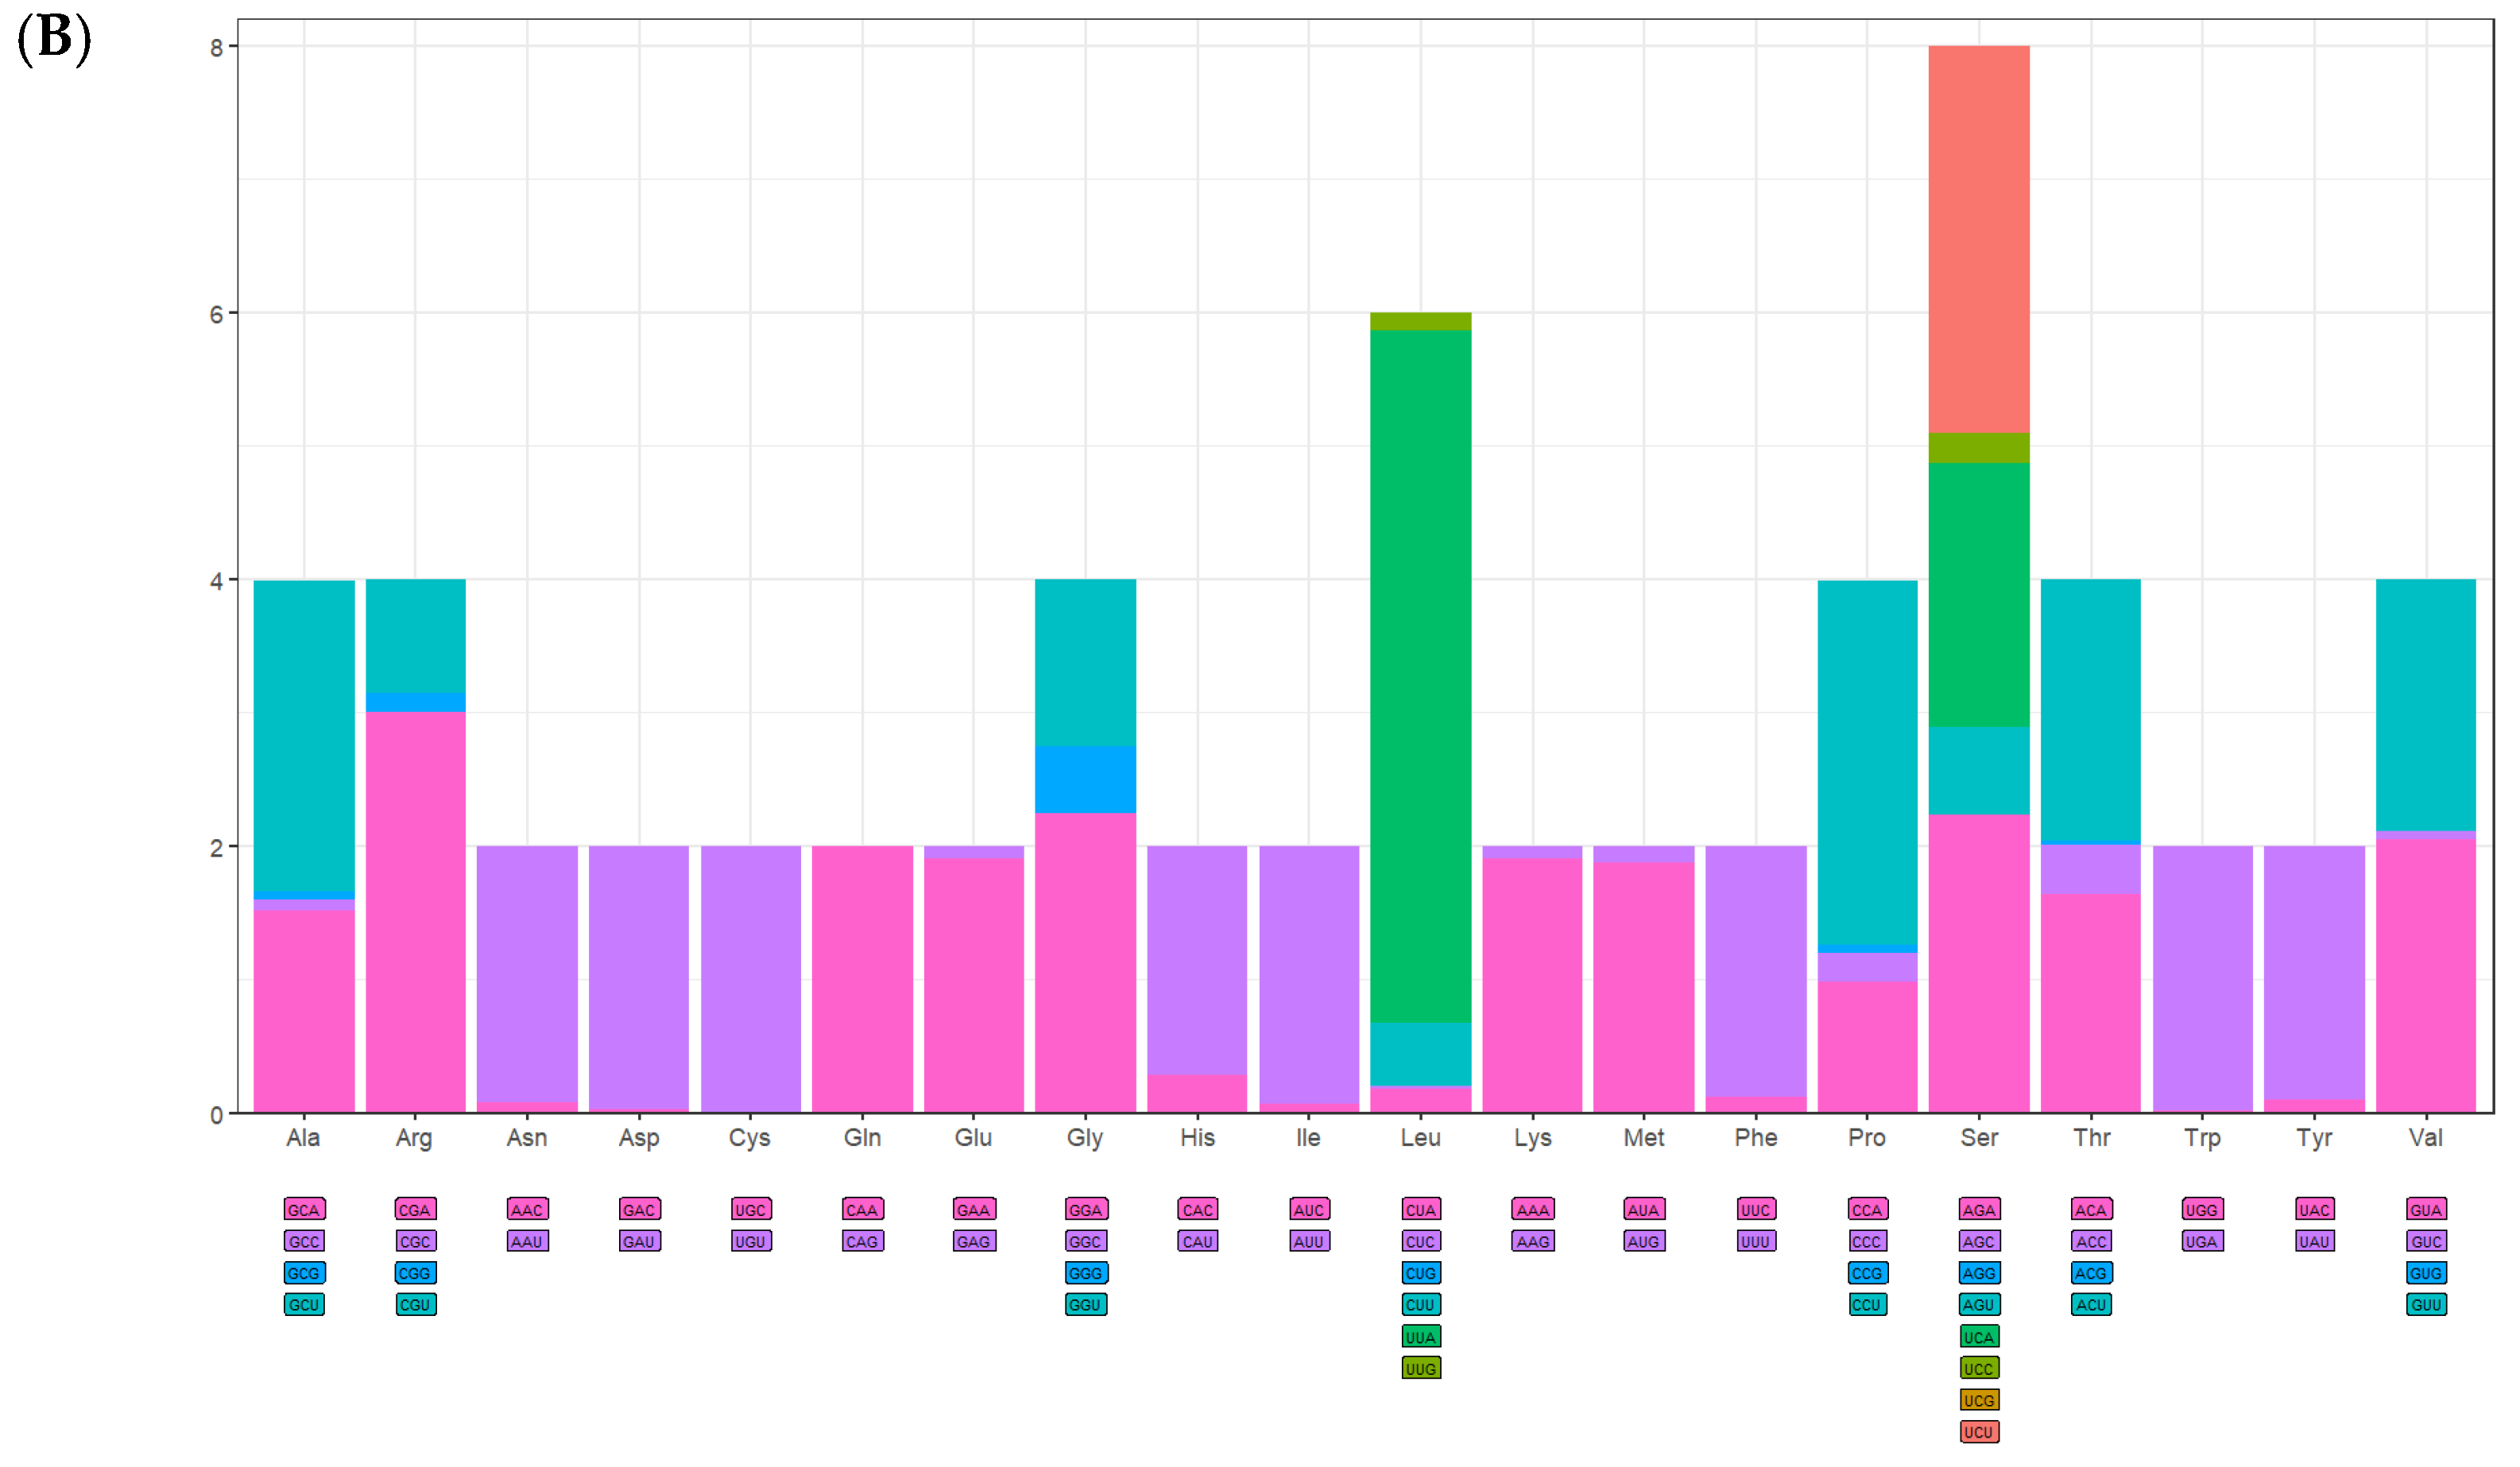
There were 13 protein-coding genes, of which 9 were on the outer ring H chain and 4 were on the inner ring L chain (Figure 1 and Table 2). The number of amino acids represented by the codons in the outer ring H chain was significantly greater than that in the inner ring L chain (Figure 4). ND2, COI, and ATP8 used ATT as their start codon; COII, ATP6, COIII, ND4, CYTB, and ND1 used ATG as their start codon; and ND3, ND5, ND4L, and ND6 used ATA as their start codon. Except for the incomplete stop codon T of COII and ND4, the other protein-coding genes used TAA as the stop codon. Except for tryptophan (Trp), which uses only the TGG codon, the most frequently used amino acid codons were NNT or NNA. In addition to arginine (Arg), glutamine (Gln), glutamic acid (Glu), glycine (Gly), leucine (Leu), and valine (Val), codons with the highest frequency of use strictly corresponded to tRNA anticodons, and codons with the highest frequency of use did not correspond to tRNA anticodons (Table 5). The 13 protein-coding genes showed a high AT preference (Table 3). In the RSCU analysis, the top three most frequently used codons were UUA (frequency F = 12.85%, RSCU = 5.20), CGA (frequency F = 1.06%, RSCU = 3.00), and UCU (frequency F = 3.08%, RSCU = 2.90), encoding Leu, Arg, and Ser, respectively (Table 5, Figure 5).

3.4. rRNA and tRNA Genes

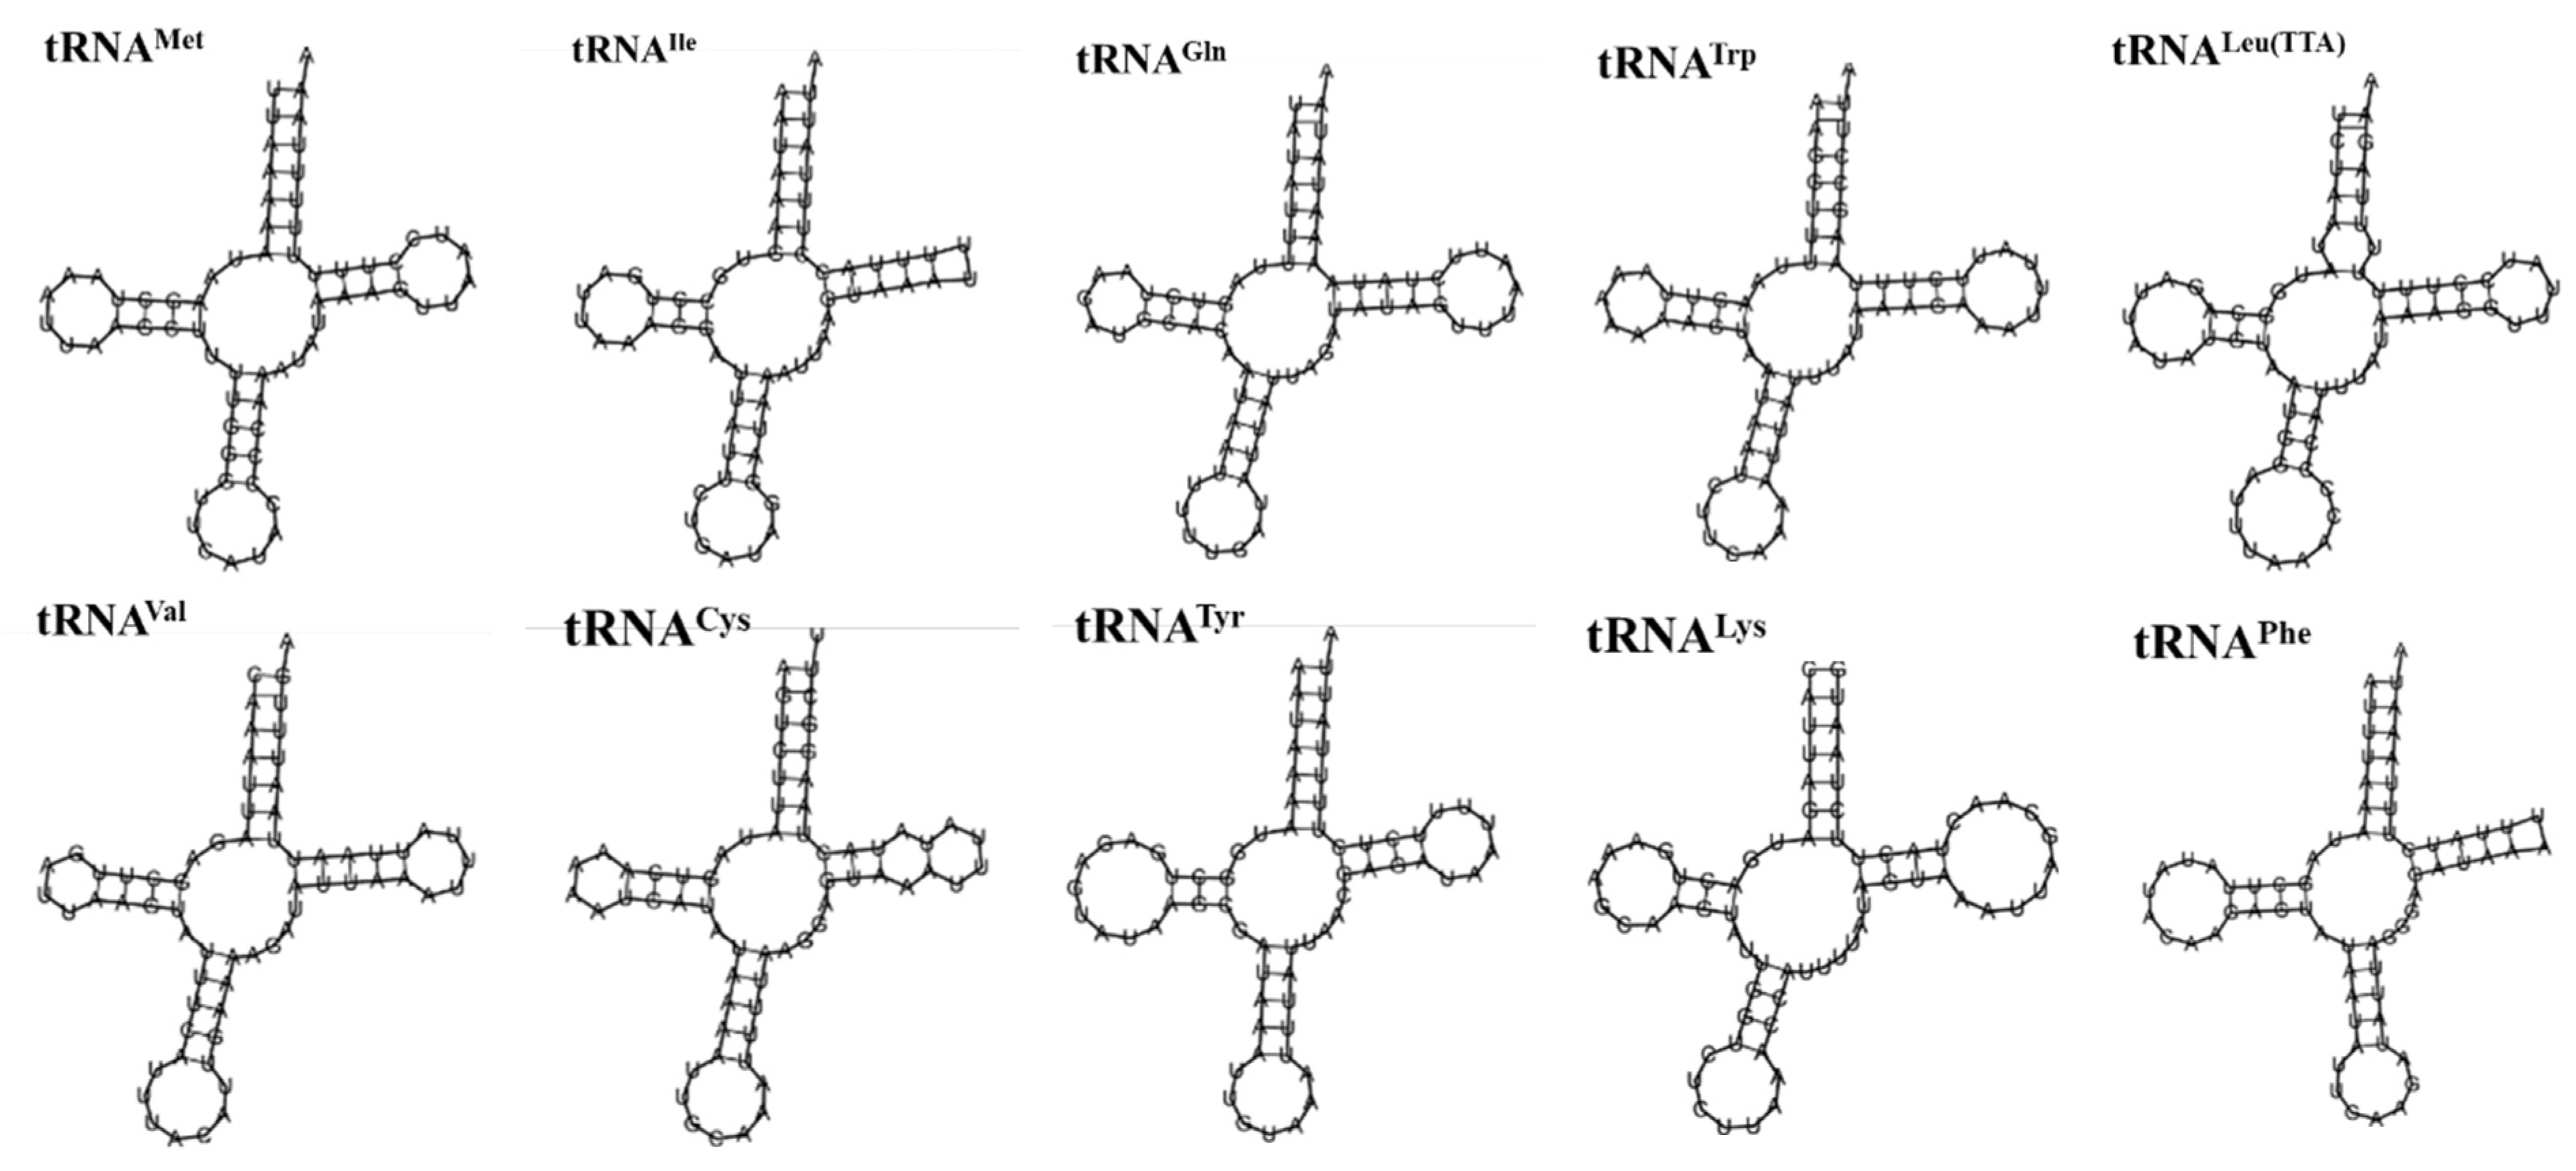
As shown in Table 2 and Figure 6, there were 22 tRNA genes in the mitochondrial genome of A. lactinea, with an average length of 66 bp; the shortest one was the tRNAArg gene, with a length of 63 bp, and the longest one was the tRNALys gene, with an A+T content of 81.87%, indicating an obvious AT bias (Table 2). Except for tRNASer(AGC), all the tRNA genes could form conventional clover structures. A total of 16 mismatched base pairs were identified in the tRNA, all of which were U-G mismatched base pairs and existed in the amino acid arm, dihydrouracil ring, TφC ring, and anticodon ring. The length of the amino acid arm was 6–7 nt, the dihydropyrimidine ring was 3–5 nt, the TφC ring was 4–6 nt, and the anticodon ring was 3–5 nt. Among the 22 tRNA genes, the tRNAArg gene lacked the dihydrouracil ring, and the tRNAPhe gene lacked the TφC ring (Figure 6).
The relative molecular weight of the rRNA gene is high, and it can combine with proteins to form ribosomes. The lengths of the ribosomal small subunit rrnS and ribosome large subunit rrnL genes in the mitochondria of A. lactinea were 819 and 1396 bp, respectively. rrnS was located between the D-loop and tRNAVal(GTA) gene. rrnL was located between tRNAVal(GTA) and tRNALeu(CTA). The A+T content of rrnS and rrnL was 85.28%, indicating an obvious AT bias (Figure 1, Table 2 and Table 3).

3.5. Control Area, Non-Coding Area, and Overlapping Area

A hypothetical control region (D-loop region) of 303 bp in length was found between rrnS and tRNAMet, with a 74.25% AT content, significant skew towards T between A and T (Table 3), and no tandem repeats in the control region. There were 23 non-coding regions (also known as intergenic spacer regions) in the mitochondrial genome, the lengths of which ranged from 1 to 52 bp, totaling 297 bp. Only two intergenic spacer regions were longer than 40 bp, among which the length of the spacer region between tRNAGln and ND2 was 52 bp. The length of the spacer between ND5 and tRNAHis was 51 bp. Six genes overlapped, with overlap lengths ranging from 1 to 8 bp. The overlap between the tRNATrp and tRNACys genes was the largest, with a length of 8 bp.

3.6. Phylogenetic Relationships

The whole mitochondrial genome sequences of 23 Arctiinae species were used to construct BI, maximum parsimony, and maximum likelihood phylogenetic trees with the same topology (Figure 7). Among these, A. lactinea and Hyphantria cunea clustered together (BPP = 100%, MPBP (Maximum parsimony bootstrap proportion) = 64%), indicating that red lactinea and American white moths are closely related. The two Spilarctia species were sister groups to Lemyra (BPP = 100%, maximum likelihood = 100%, and MPBP = 90%) and Spilosoma (BPP = 92% and maximum likelihood = 49%). Phragmatobia fuliginosa, Arctia plantaginis, Callimorpha dominula, and Pareuchaetes insulata were also isolated.
Six species of Amata formosae, Cyana sp. MT-2014, and Amerila alberti were grouped together into one family. Amata formosae and Cyana sp. MT-2014 were clustered together, and the confidence of the Bayesian analysis was 100%, indicating that the two are closely related; however, the branch was not found in the maximum likelihood and maximum parsimony analyses. This group was a sister group to Paraona, and all support rates were greater than 95%.

4. Discussion

In this study, the mitochondrial whole genome sequence was determined for the first time in this species, and it is also the only species in this genus that has great significance for the study of phylogenetic relationships in this genus. The results indicate that the mitochondrial genome is a circular double-stranded DNA molecule containing 37 genes and one control region, a structure consistent with that of most insects in the order Lepidoptera [13,14]. The mitochondrial genome shows a significant A+T bias, which is a common feature in arthropods [45,46], with the A+T content of all genes being much higher than the G+C content. This nucleotide composition bias is in line with that of other species in the subfamily Arctiinae [14,30,31]. All protein-coding genes begin with the ATN codon, which is different from the COI gene of Hyphantria cunea and Amata emma in the Arctiinae, where the start codon is CGA [30,31]. This difference may be related to gene rearrangement or editing [47]. The codon usage of all PCGs also exhibits a strong A+T bias, which is a feature shared by other species in the Arctiinae [42,43,44]. All tRNA genes, except for tRNASer(AGC), form typical cloverleaf structures, which is consistent with the tRNA gene characteristics of other Arctiinae species [42,44]. The control region is located between 12S rRNA and tRNAMet, with an average length of 439 bp and a very high A+T content (93.5%), which is consistent with the findings of Chen Lu, who analyzed mitochondrial genome structural features of 1116 species from 21 families within the Lepidoptera [14]. Additionally, no tandem repeats were found within the control region, which conforms to the structural characteristics of the control region in Lepidoptera [14,48]. However, the A+T content of this control region is only 74.25%, significantly lower than that of other regions in the mitochondrial genome of Lepidoptera [49], and notably lower than in other species of Arctiinae [30,43].
In this research, we constructed a Bayesian tree of 18 species based on the whole mitochondrial genome sequence, and discussed the relationship between some genera and species of the subfamily. The results show that the relationship between A. lactinea and Hyphantria cunea is close. The topological structure of the Bayesian tree indicates that the Spilarctia and the Lemyra are sister groups. The clade formed by these two genera is sister to Spilosoma. Similarly, the Vamuna and the Eilema form a sister group pair, and the clade they constitute is sister to the Paraona. This result is consistent with the maximum likelihood tree structure constructed by Galarza and Mappes in 2021 [42]. Furthermore, in this study, Amata and Cyana cluster into a distinct, well-supported clade in Bayesian analyses, demonstrating a close phylogenetic relationship between them. This finding indirectly suggests that Syntomini is phylogenetically closer to Cyana (Lithosiini) than to Arctiini. Pareuchaetes insulata was placed at the base of the Bayesian tree, indicating its relatively primitive position. The subfamily Arctiinae consists of four main tribes: Arctiini, Lithosiini, Syntomini, and Amerilini [9,15,16,17,18]. Since the 1990s, some researchers have argued that Syntomini shares morphological traits with Arctiini (e.g., the presence of a tympanic apparatus on the posterior metathorax and an anterior spiracular hood) and has feeding habits similar to Lithosiini, leading to its classification within Arctiini. However, many scholars have questioned this placement [2,18,50]. Recent molecular studies have provided increasing evidence for including Syntomini within Arctiinae, but its exact tribal placement remains debated. In our study, Syntomini, Lithosiini, and Amerilini formed a clade, supporting a close relationship among them but not confirming the inclusion of Syntomini within Arctiini. Instead, our results suggest that Syntomini is phylogenetically distinct from Arctiini and may warrant separate tribal status within Arctiinae.

5. Conclusions

In this study, the complete mitochondrial genome of A. lactinea was sequenced for the first time, filling a gap in the mitochondrial genomic data for this genus. The results revealed that the mitochondrial genome is a circular double-stranded DNA molecule, 15,380 bp in length, containing 37 genes and one control region, with a high A+T bias characteristic of Lepidoptera mitochondrial genomes. Phylogenetic analysis, based on the complete mitochondrial genomes of 18 species, constructed a Bayesian tree that elucidated the relationships among certain genera and species within the subfamily. The findings support the inclusion of Syntomini within Arctiinae and indicate a close phylogenetic relationship between Syntomini, Lithosiini, and Amerilini. These results provide new molecular evidence for the study of Lepidoptera mitochondrial genomes and their phylogenetic relationships.

Author Contributions

Conceptualization, C.P. and S.X.; methodology, C.P.; software, S.X.; validation, C.P., Y.S. and J.F.; formal analysis, J.F.; investigation, S.X.; resources, J.F.; data curation, Y.S.; writing—original draft preparation, C.P.; writing—review and editing, J.F.; visualization, S.X.; supervision, J.F.; project administration, C.P.; funding acquisition, J.F. All authors have read and agreed to the published version of the manuscript.

Funding

This work was supported by the Ecological Quality Sample Site Quality Control Monitoring in Anhui Province (K160138390).

Institutional Review Board Statement

Not applicable.

Informed Consent Statement

Not applicable.

Data Availability Statement

The data presented in this study are available in NCBI GenBank (Accession number: PV288325).

Conflicts of Interest

The authors declare no conflicts of interest.

References

  1. Kaleka, A.; Kirti, J.S. Further studies on three indian species of genus aloa walker (Arctiinae: Arctiidae: Lepidoptera). Adv. Biosci. 2000, 19, 47–54. [Google Scholar]
  2. Fang, C.L. Fauna Sinica; Science Press: Beijing, China, 2000. [Google Scholar]
  3. Fang, C.L. Zoology of China, Entomoptera 19 Volume Lepidoptera; Science Press: Beijing, China, 2000; pp. 1–295. (In Chinese) [Google Scholar]
  4. Shu, Y. Taxonomic Study on Arctiinae in Huangshan Scenic Area; Anhui University: Hefei, China, 2023. [Google Scholar]
  5. Zahiri, R.; Kitching, I.J.; Lafontaine, J.D.; Mutanen, M.; Kaila, L.; Holloway, J.D.; Wahlberg, N. A new molecular phylogeny offers hope for a stable family level classification of the Noctuoidea (Lepidoptera). Zool. Scr. 2011, 40, 158–173. [Google Scholar] [CrossRef]
  6. Miller, J.S. Cladistics and classification of the Notodontidae (Lepidoptera, Noctuoidea) based on larval and adult morphology. Bull. Am. Mus. Nat. Hist. 1991, 204, 207–221. [Google Scholar]
  7. Lafontaine, J.D.; Fibiger, M. Revised higher classification of the Noctuoidea (Lepidoptera). Can. Entomol. 2006, 138, 610–635. [Google Scholar] [CrossRef]
  8. Weller, S.J.; Dacosta, M.; Simmons, R.; Dittmar, K.; Whiting, M. Evolution and taxonomic confusion in Arctiidae. In Tiger Moths and Woolly Bears: Behavior, Ecology, and Evolution of the Arctiidae; Conner, W.E., Ed.; Oxford University Press: New York, NY, USA, 2009; pp. 11–30. [Google Scholar]
  9. Zahiri, R.; Holloway, J.D.; Kitching, I.J.; Lafontaine, J.D.; Mutanen, M.; Wahlberg, N. Molecular phylogenetics of Erebidae (Lepidoptera, Noctuoidea). Syst. Entomol. 2012, 37, 102–124. [Google Scholar] [CrossRef]
  10. Song, F.; Li, H.; Jiang, P.; Zhou, X.; Liu, J.; Sun, C.; Vogler, A.P.; Cai, W. Capturing the phylogeny of Holometabola with mitochondrial genome data and Bayesian site-heterogeneous mixture models. Genome Biol. Evol. 2016, 8, 1411–1426. [Google Scholar] [CrossRef]
  11. Lightowlers, R.N.; Chinnery, P.F.; Turnbull, D.M.; Howell, N. Mammalian mitochondrial genetics: Heredity, heteroplasmy and disease. Trends Genet. 1997, 13, 450–455. [Google Scholar] [CrossRef]
  12. Tang, C.; Du, X. Complete mitochondrial genomes of two moths in the tribe Trichaeini (Lepidoptera: Crambidae) and their phylogenetic implications. Ecol. Evol. 2023, 13, e10188. [Google Scholar] [CrossRef]
  13. Wang, W. Studies on Mitochondrial Genomes and Phylogeny of Lepidoptera Insects. Master’s Thesis, Nanjing Agricultural University, Nanjing, China, 2014. [Google Scholar]
  14. Chen, L. Analysis of Structural Characteristics of Mitochondrial Genomes in Lepidoptera Insects. Master’s Thesis, Hunan Agricultural University, Changsha, China, 2021. [Google Scholar]
  15. Zaspel, J.M.; Weller, S.J.; Wardwell, C.T.; Zahiri, R.; Wahlberg, N. Phylogeny and Evolution of Pharmacophagy in Tiger Moths (Lepidoptera: Erebidae: Arctiinae). PLoS ONE 2014, 9, e101975. [Google Scholar] [CrossRef]
  16. Zenker, M.M.; Wahlberg, N.; Brehm, G.; Teston, J.A.; Przybylowicz, L.; Pie, M.R.; Freitas, A.V.L. Systematics and origin of moths in the subfamily Arctiinae (Lepidoptera, Erebidae) in the Neotropical region. Zool. Scr. 2017, 46, 348–362. [Google Scholar] [CrossRef]
  17. Dowdy, N.J.; Keating, S.; Lemmon, A.R.; Lemmon, E.M.; Conner, W.E.; Chialvo, C.H.S.; Weller, S.J.; Simmons, R.B.; Sisson, M.S.; Zaspel, J.M. A deeper meaning for shallow-level phylogenomic studies: Nested anchored hybrid enrichment offers great promise for resolving the tiger moth tree of life (Lepidoptera: Erebidae: Arctiinae). Syst. Entomol. 2020, 45, 874–893. [Google Scholar] [CrossRef]
  18. Przybylowicz, L.; Lees, D.C.; Zenker, M.M.; Wahlberg, N. Molecular systematics of the arctiine tribe Syntomini (Lepidoptera, Erebidae). Syst. Entomol. 2019, 44, 624–637. [Google Scholar] [CrossRef]
  19. Barker, K. Phenol-chloroform isoamyl alcohol (PCI) DNA extraction. Bench 1998, 31, 735. [Google Scholar]
  20. Guo, Y.; Peng, D.; Han, L.; Liu, T.; Li, G.; Garber, P.A.; Zhou, J. Mitochondrial DNA control region sequencing of the critically endangered Hainan gibbon (Nomascus hainanus) reveals two female origins and extremely low genetic diversity. Mitochondrial DNA B Resour. 2021, 6, 1355–1359. [Google Scholar] [CrossRef]
  21. Bolger, A.M.; Lohse, M.; Usadel, B. Trimmomatic: A flexible trimmer for Illumina sequence data. Bioinformatics 2014, 30, 2114–2120. [Google Scholar] [CrossRef]
  22. Freudenthal, J.A.; Pfaff, S.; Terhoeven, N.; Korte, A.; Ankenbrand, M.J.; Förster, F. A systematic comparison of chloroplast genome assembly tools. Genome Biol. 2020, 21, 254. [Google Scholar] [CrossRef]
  23. Li, H.; Durbin, R. Fast and accurate short read alignment with Burrows-Wheeler transform. Bioinformatics 2009, 25, 1754–1760. [Google Scholar] [CrossRef]
  24. Bankevich, A.; Nurk, S.; Antipov, D.; Gurevich, A.A.; Dvorkin, M.; Kulikov, A.S.; Lesin, V.M.; Nikolenko, S.I.; Pham, S.; Prjibelski, A.D. SPAdes: A new genome assembly algorithm and its applications to single-cell sequencing. J. Comput. Biol. 2012, 19, 455–477. [Google Scholar] [CrossRef]
  25. Walker, B.J.; Abeel, T.; Shea, T.; Priest, M.; Abouelliel, A.; Sakthikumar, S.; Cuomo, C.A.; Zeng, Q.D.; Wortman, J.; Young, S.K.; et al. Pilon: An integrated tool for comprehensive microbial variant detection and genome assembly improvement. PLoS ONE 2014, 9, e112963. [Google Scholar] [CrossRef]
  26. Grant, J.R.; Stothard, P. The CGView Server: A comparative genomics tool for circular genomes. Nucleic Acids Res. 2008, 36, 181–184. [Google Scholar] [CrossRef]
  27. Tamura, K.; Stecher, G.; Kumar, S. MEGA11 Molecular Evolutionary Genetics Analysis Version 11. Mol. Biol. Evol. 2021, 38, 3022–3027. [Google Scholar] [CrossRef]
  28. Bernt, M.; Donath, A.; Juehling, F.; Externbrink, F.; Florentz, C.; Fritzsch, G.; Puetz, J.; Middendorf, M.; Stadler, P.F. MITOS: Improved de novo metazoan mitochondrial genome annotation. Mol. Phylogenet. Evol. 2013, 69, 313–319. [Google Scholar] [CrossRef]
  29. Lowe, T.M.; Eddy, S.R. tRNAscan-SE: A program for improved detection of transfer RNA genes in genomic sequence. Nucleic Acids Res. 1997, 25, 955–964. [Google Scholar] [CrossRef] [PubMed]
  30. Liao, F.; Wang, L.; Wu, S.; Li, Y.P.; Zhao, L.; Huang, G.M.; Niu, C.J.; Liu, Y.Q.; Li, M.G. The complete mitochondrial genome of the fall webworm, Hyphantria cunea (Lepidoptera: Arctiidae). Int. J. Biol. Sci. 2010, 6, 172–186. [Google Scholar] [CrossRef] [PubMed]
  31. Lu, H.F.; Su, T.J.; Luo, A.R.; Zhu, C.D.; Wu, C.S. Characterization of the Complete Mitochondrion Genome of Diurnal Moth Amata emma (Butler) (Lepidoptera: Erebidae) and Its Phylogenetic Implications. PLoS ONE 2013, 8, e72410. [Google Scholar] [CrossRef] [PubMed]
  32. Sun, Y.; Tian, S.; Qian, C.; Sun, Y.X.; Abbas, M.N.; Kausar, S.; Wang, L.; Wei, G.; Zhu, B.J.; Liu, C.L. Characterization of the complete mitochondrial genome of Spilarctia robusta (Lepidoptera: Noctuoidea: Erebidae) and its phylogenetic implications. Eur. J. Entomol. 2016, 113, 558–570. [Google Scholar] [CrossRef]
  33. Yang, J.; Kong, W. The complete mitochondrial genome of Lemyra melli (Daniel) (Lepidoptera: Erebidae) and a comparative analysis within the Noctuoidea. Zool. Syst. 2016, 41, 366–378. [Google Scholar]
  34. Liu, N.; Li, N.; Yang, P.; Sun, C.; Fang, J.; Wang, S. The complete mitochondrial genome of Damora sagana and phylogenetic analyses of the family Nymphalidae. Genes Genom. 2018, 40, 109–122. [Google Scholar] [CrossRef]
  35. Benson, G. Tandem repeats finder: A program to analyze DNA sequences. Nucleic Acids Res. 1999, 27, 573–580. [Google Scholar] [CrossRef]
  36. Perna, N.T.; Kocher, T.D. Patterns of nucleotide composition at fourfold degenerate sites of animal mitochondrial genomes. J. Mol. Evol. 1995, 41, 353–358. [Google Scholar] [CrossRef]
  37. Macgregor, C.J.; Saccheri, I.; Fox, B.; Boyes, D. The genome sequence of the Rosy Footman, Miltochrista miniata (Forster, 1771) [version 1; peer review: Awaiting peer review]. Wellcome Open Res. 2023, 8, 582. [Google Scholar] [CrossRef]
  38. Katoh, K.; Standley, D.M. MAFFT multiple sequence alignment software version 7: Improvements in performance and usability. Mol. Biol. Evol. 2013, 30, 772–780. [Google Scholar] [CrossRef]
  39. Ronquist, F.; Huelsenbeck, J.P. MrBayes 3: Bayesian phylogenetic inference under mixed models. Bioinformatics 2003, 19, 1572–1574. [Google Scholar] [CrossRef]
  40. Darriba, D.; Posada, D. jModelTest 2.0 Manual v0. 1.1. 2014. Available online: https://www.phylo.org/pdf_docs/jmodeltest-2.1.6-manual.pdf (accessed on 4 July 2024).
  41. Lemey, P.; Rambaut, A.; Drummond, A.J.; Suchard, M.A. Bayesian Phylogeography Finds Its Roots. PLoS Comput. Biol. 2009, 5, e1000520. [Google Scholar] [CrossRef] [PubMed]
  42. Tang, M.; Tan, M.; Meng, G.; Yang, S.; Su, X.; Liu, S.; Song, W.; Li, Y.; Wu, Q.; Zhang, A.; et al. Multiplex sequencing of pooled mitochondrial genomes—A crucial step toward biodiversity analysis using mito-metagenomics. Nucleic Acids Res. 2014, 42, e166. [Google Scholar] [CrossRef] [PubMed]
  43. Galarza, J.A.; Mappes, J. The complete mitochondrial genome of the wood tiger moth (Arctia plantaginis) and phylogenetic analyses within Arctiinae. Mitochondrial DNA Part B-Resour. 2021, 6, 2171–2173. [Google Scholar] [CrossRef]
  44. Peng, X.Y.; Duan, X.Y.; Qiang, Y. Characterization of the complete mitochondrial genome of the Scarlet Tiger moth Callimorpha dominula (Insecta: Lepidoptera: Arctiidae). Mitochondrial DNA Part A 2016, 27, 3749–3750. [Google Scholar] [CrossRef]
  45. Wang, Z.; Jiang, W.; Ye, J.; Wu, H.; Wang, Y.; Xiong, F. Decoding the Mitochondrial Genome of the Tiger Shrimp: Comparative Genomics and Phylogenetic Placement Within Caridean Shrimps. Genes 2025, 16, 457. [Google Scholar] [CrossRef]
  46. Shi, Q.; Wang, X.; Xing, J.; Xu, X.; Sun, G.; Zhang, J. Complete Mitochondrial Genome of Two Amathusiini Species (Lepidoideae: Nymphalidae: Satyrinae): Characterization, Comparative Analyses, and Phylogenetic Implications. Genes 2025, 16, 447. [Google Scholar] [CrossRef]
  47. Wei, S.J.; Chen, X.X. Progress in research on the comparative mitogenomics of insects. Chin. J. Appl. Entomol. 2011, 48, 1573–1585. [Google Scholar]
  48. Vila, M.; Bjorklund, M. The utility of the neglected mitochondrial control region for evolutionary studies in Lepidoptera (Insecta). J. Mol. Evol. 2004, 58, 280–290. [Google Scholar] [CrossRef] [PubMed]
  49. Hu, J.; Zhang, D.; Hao, J.; Huang, D.; Cameron, S.; Zhu, C. The complete mitochondrial genome of the yellow coaster, Acraea issoria (Lepidoptera: Nymphalidae: Heliconiinae: Acraeini): Sequence, gene organization and a unique tRNA translocation event. Mol. Biol. Rep. 2010, 37, 3431–3438. [Google Scholar] [CrossRef] [PubMed]
  50. Lu, H.F. Systematic Taxonomic Study of Amata (Lepidoptera: Ctenuchidae). Natl. Inst. Health J. 2013, 8, e72410. (In Chinese) [Google Scholar]
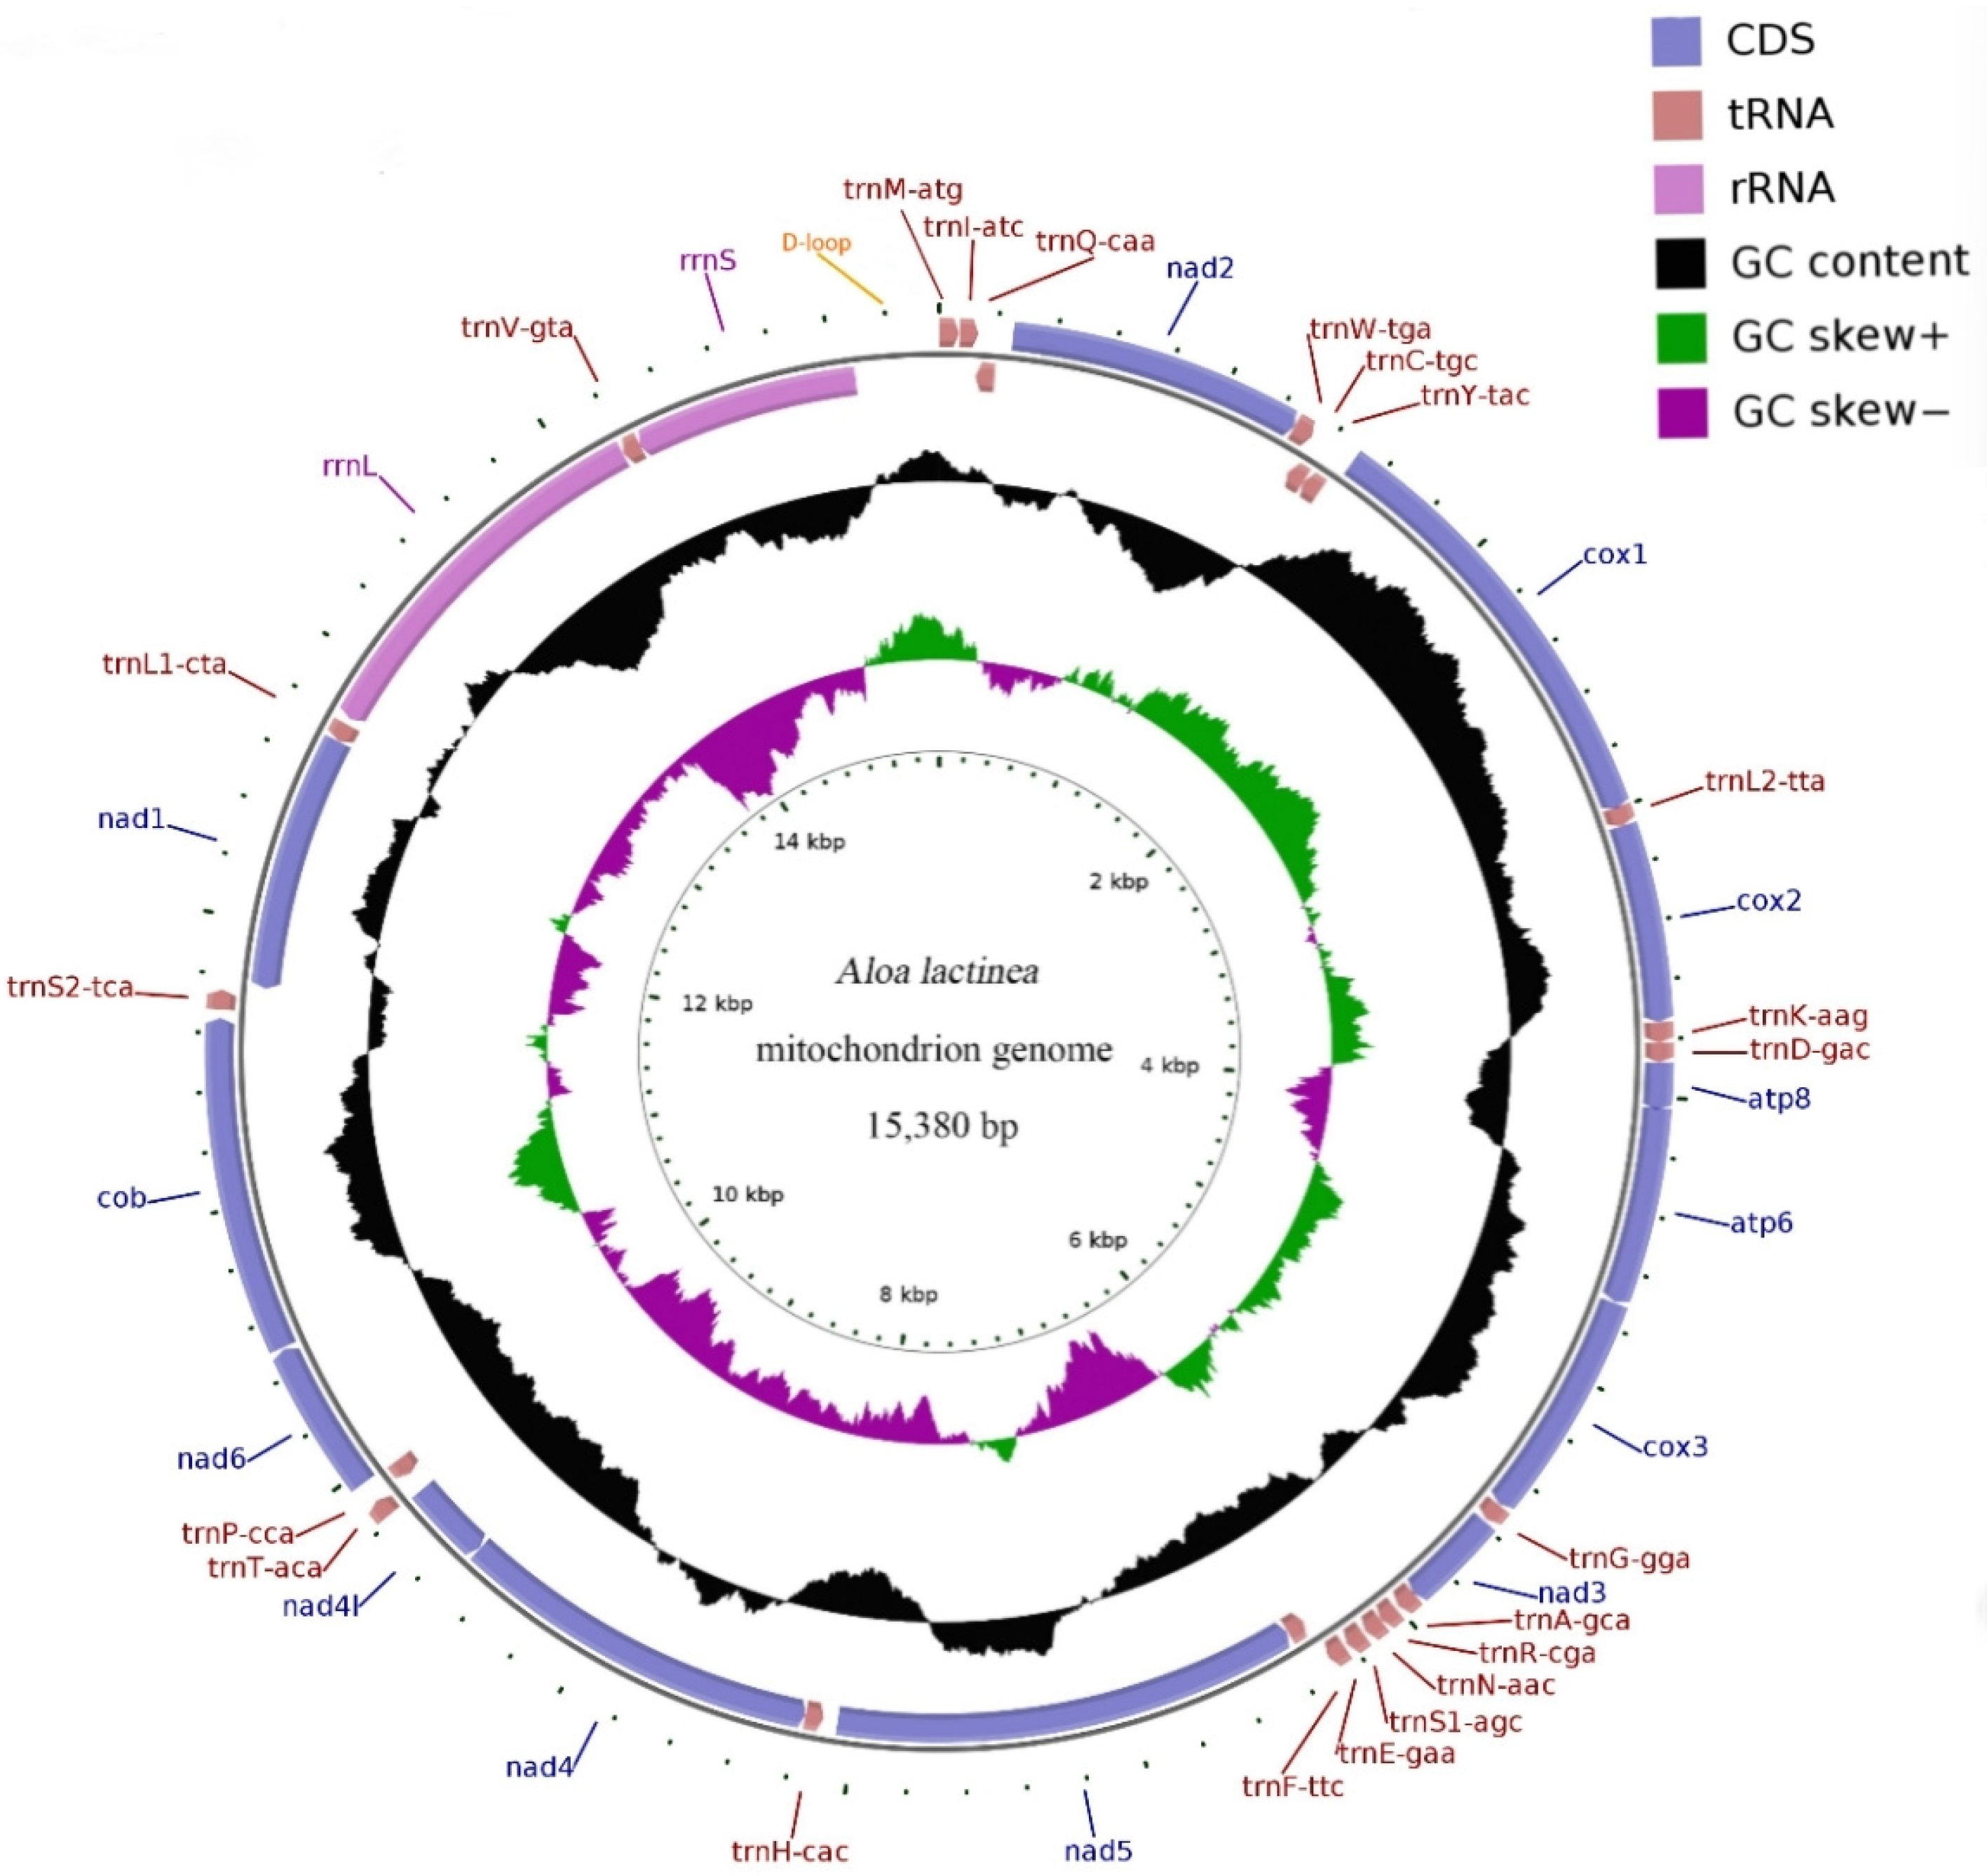
Figure 1. Schematic Map of the complete mitochondrial genome of Aloa lactinea. Protein-coding genes (PCGs) are indicated by blue arrows, transfer RNA (tRNA) genes are shown as brown arrows, and ribosomal RNA (rRNA) genes are represented with purple arrows. Each tRNA is annotated using a single-letter amino acid code followed by its specific anticodon. The black circular plot displays GC content, where peaks extending outward indicate values above the average, and those directed inward signify values below the average. GC skew is visualized using purple and green plots: purple represents skew values ranging from 0 to 1, while green indicates values between −1 and 0. Sequence length is marked with ticks along the inner circle.
Genes 16 00554 g001
Figure 2. The gene order of the A. lactinea mitogenome and the other 18 Arctiinae species (the complete information for the missing five species is unavailable in NCBI). The tRNA genes are represented in blue, the PCGs genes are represented in white, the rRNA genes are represented in green, and a hypothetical control region is represented in yellow.
Genes 16 00554 g002
Figure 3. Mitochondrial genome length, AT% vs. AT-Skew, and GC% vs. GC-Skew graphs in Arctiinae mitochondrial genomes. (A) The X-axis indicates 18 Arctiinae mitochondrial genomes, and the Y-axis represents the length of their complete mitochondrial genome. (B) The X-axis presents the GC ratio, and the Y-axis shows GC-skew. (C) The X-axis presents the AT ratio, and the Y-axis shows AT-skew. The orange dotted box indicates A. lactinea assembled in this study.
Genes 16 00554 g003
Figure 4. Codon usage of the A. lactinea mitochondrial genome. The X-axis presents amino acids, and the Y-axis presents number of amino acids along with the direction of genes. Strand (H) is the blue color, and strand (L) is the orange color.
Genes 16 00554 g004
Figure 5. Relative synonymous codon usage (RSCU) of the mitogenomes of A. lactinea. (A) The X-axis presents amino acids, and the Y-axis presents number of amino acids. (B) The X-axis presents amino acids, and the Y-axis presents RSCU.
Genes 16 00554 g005aGenes 16 00554 g005b
Figure 6. The secondary structure predictions of tRNA genes of A. lactinea.
Genes 16 00554 g006aGenes 16 00554 g006b
Figure 7. The Bayesian tree based on the complete mitochondrial genome of 23 species in Arctiinae. The phylogenetic tree of A. lactinea was constructed using Bayesian Inference, Maximum Likelihood, and Maximum Parsimony, all yielding identical topologies. The numbers above the branches are the support rates of Bayesian analysis, maximum likelihood analysis, and maximum reduction analysis, respectively. All nodes with 100% support rates are represented by *, and the evolutionary branch lengths of outgroups are represented by dashed lines.
Genes 16 00554 g007
Table 2. Thirty-seven genes and one control region of the complete mitogenomes in the A. lactinea.
GeneStrandPositionLengthStart CodonStop CodonAnti
Codons
Intergenic NucleotidesOverlapping
Nucleotide
tRNAMetH1–6767--CAT-
tRNAIleH70–13364--GAT2
tRNAGlnL131–19969--TTG 3
ND2H252–12621011ATTTAA 52
tRNATrpH1264–133269--TCA1
tRNACysL1325–138965--GCA 8
tRNATyrL1390–145768--GTA
COIH1495–30001506ATTTAA 37
tRNALeu(TTA)H2996–306267--TAA 5
COIIH3063–3744682ATGT
tRNALysH3745–381470--CTT
tRNAAspH3815–388167--GTC
ATP8H3882–4043162ATTTAA
ATP6H4037–4714678ATGTAA 7
COIIIH4719–5510792ATGTAA 4
tRNAGlyH5514–557865--TCC3
ND3H5588–5932345ATATAA 9
tRNAAlaH5932–599968--TGC 1
tRNAArgH6012–607463--TCG12
tRNAAsnH6076–614065--GTT1
tRNASer(AGC)H6151–621666--GCT10
tRNAGluH6229–629466--TTC12
tRNAPheL6301–636767--GAA6
ND5L6371–80591689ATATAA 3
tRNAHisL8111–817767--GTG51
ND4L8178–95161339ATGT
ND4LL9519–9815297ATATAA 2
tRNAThrH9822–988665--TGT6
tRNAProL9887–995367--TGG
ND6H9961–10,491531ATATAA 7
CYTBH10,499–11,6501152ATGTAA 7
tRNASer(TCA)H11,680–11,74768--TGA29
ND1L11,765–12,703939ATGTAA 17
tRNALeu(CTA)L12,705–12,77268--TAG1
18S rRNAL12,795–14,1901396-- 22
tRNAValL14,194–14,25966--TAC3
12S rRNAL14,259–15,077819-- 1
D-loopH15,078–15,380303--
Table 3. The base composition of the mitochondrial genome of A. lactinea.
Gene/RegionBase Composition (%)AT SkewGC Skew
ATCGA+TG+C
Genome39.9541.0511.377.6281.0118.99−0.0136−0.1975
Protein-coding genes (total)34.4845.449.6510.4479.9220.08−0.13710.0393
ND236.3048.669.205.8484.9615.04−0.1455−0.2234
COI31.5441.1013.7513.6172.6427.36−0.1316−0.0051
COII35.7841.5012.4610.2677.2822.72−0.0740−0.0968
ATP845.0648.774.321.8593.836.17−0.0395−0.4003
ATP635.5543.8112.837.8279.3620.65−0.1041−0.2426
COIII33.0841.5413.5111.8774.6225.38−0.1134−0.0646
ND335.6546.9611.306.0982.6117.39−0.1369−0.2996
ND535.7046.126.1012.0881.8218.18−0.12740.3289
ND435.1847.275.9011.6582.4517.55−0.14660.3276
ND4L31.9954.553.0310.4486.5413.47−0.26070.5501
ND637.1050.098.104.7187.1912.81−0.1490−0.2646
CYTB33.3344.1812.679.8177.5122.48−0.1400−0.1272
ND131.9547.287.2413.5379.2320.77−0.19350.3028
First site 36.5745.668.419.3382.2417.75−0.11050.0518
Secondary site 35.0643.4210.4411.0678.4921.5−0.10650.0288
Tertiary site31.7547.2310.0910.9278.9721.01−0.19600.0395
tRNA gene41.3840.497.5710.5781.8718.130.01090.1655
rRNA gene43.1242.174.749.9885.2814.720.01110.3559
D-loop zone32.0142.2411.8813.8674.2525.75−0.13780.0769
Table 4. Comparison of different components of the mitochondrial whole genome in 18 species of Arctiinae.
SpeciesWhole GenomePCGstRNA GenerRNA GeneD-Loop
SizeA+TGC/AT SkewSizeA+TGC/AT SkewSizeA+TGC/AT SkewSizeA+TGC/AT SkewSizeA+TGC/AT Skew
(bp)(%)(bp)(%)(bp)(%)(bp)(%)(bp)(%)
Aloa lactinea15,38081.0114.52205911,12379.920.0393/−0.1371146781.870.1655/0.0109221585.280.3559/0.011130374.250.0769/−0.1378
Vamuna virilis15,41780.4458.210,75578.140.0467/−0.1564145681.590.1793/0.0219217684.60.3727/0.031036295.038.7214397
Eilema15,34480.46452.411,19978.750.0118/−0.1512146581.910.1852/0.0383203484.2716.29914532994.221.5237173
ussuricum
Cyana sp. 15,49481.215.62237810,76779.180.0634/−0.1510147581.690.1628/0.0224219284.670.3810/0.0464\\\
MT-2014
Paraona staudingeri15,42780.19−29.1744210,82178.030.0073/−0.1464146281.120.1525/0.0270218184.460.3925/0.000036294.4828.409091
Spilosoma15,36981.3813.30573210,73479.540.0323/−0.1433146381.680.1714/0.0159218785.050.3271/0.014036195.014.8993363
lubricipeda
Arctia plantaginis15,47980.7814.1552810,73178.70.0413/−0.1422146481.560.1779/0.0267220484.5318.74371940196.018.2881806
Hyphantria cunea15,48180.38−23.7525810,75278.180.0339/−0.1480147381.740.1599/0.0250221284.670.3509/0.001735794.9614.631579
Callimorpha dominula15,49681.0218.4678910,78579.850.0491/−0.1456146282.080.1607/0.0217215484.5415.01219548675.1−2.231746
Lemyra melli15,41878.67−204.181810,74976.20.0361/−0.1512146880.650.1829/0.0068223384.19−117.593833894.385.5945626
Nyctemera15,43280.0515.48979610,76178.940.0228/−0.1430144581.110.1941/0.0359205884.2513.5\\\
albofasciata
Nyctemera15,42979.21267010,76176.670.0212014146081.160.1783/0.0261203384.5514.26429294.86129.69444
adversata
Phragmatobia fuliginosa15,46980.9826.78571410,76778.880.0208/−0.1496146381.680.1567/0.0260218185.10.3597/0.017218196.690.0000/−0.0057
Table 5. Statistics of codon usage in the A. lactinea.
CodonAmino Acidn%RSCUCodonAmino Acidn%RSCU
GCAAla481.301.51AAALys982.651.90
GCCAla30.080.09AAGLys50.140.10
GCGAla20.050.06AUAMet2777.491.87
GCUAla742.002.33AUGMet200.540.13
CGAArg391.063.00UUCPhe210.570.12
CGCArg00.000.00UUUPhe3238.741.88
CGGArg20.050.15CCAPro310.840.98
CGUArg110.300.85CCCPro70.190.22
AACAsn100.270.08CCGPro20.050.06
AAUAsn2386.441.92CCUPro862.332.73
GACAsp10.030.03AGASer882.382.23
GAUAsp621.681.97AGCSer00.000.00
UGCCys00.000.00AGGSer00.000.00
UGUCys290.782.00AGUSer260.700.66
CAAGln621.682.00UCASer782.111.98
CAGGln00.000.00UCCSer90.240.23
GAAGlu731.981.90UCGSer00.000.00
GAGGlu40.110.10UCUSer1143.082.90
GGAGly1113.002.24ACAThr611.651.64
GGCGly00.000.00ACCThr140.380.37
GGGGly250.680.51ACGThr10.030.03
GGUGly621.681.25ACUThr731.981.96
CACHis90.240.28UGGTrp10.030.02
CAUHis561.521.72UGATrp952.571.98
AUCIle160.430.07UACTyr100.270.10
AUUIle45112.21.93UAUTyr1875.061.90
CUALeu160.430.18GUAVal681.842.05
CUCLeu20.050.02GUCVal20.050.06
CUGLeu00.000.00GUGVal00.000.00
CUULeu431.160.47GUUVal631.701.89
UUALeu47512.855.20UAG *----
UUGLeu120.320.13UAA *----
A total of 3696 codons were analyzed. RSCU represents the frequency of synonymous relative codons. Bold type indicates the most frequently used codon in a single amino acid. * indicates a stop codon.
Disclaimer/Publisher’s Note: The statements, opinions and data contained in all publications are solely those of the individual author(s) and contributor(s) and not of MDPI and/or the editor(s). MDPI and/or the editor(s) disclaim responsibility for any injury to people or property resulting from any ideas, methods, instructions or products referred to in the content.