Article

Identification of Differentially Expressed Genes in Spinal Cord Injury

1
Medical School, The University of Western Australia, Perth, WA 6009, Australia
2
Department of Orthopaedics, The Second Affiliated Hospital and Yuying Children’s Hospital of Wenzhou Medical University, Wenzhou 325027, China
3
Department of Orthopaedic Surgery, Sir Run Run Shaw Hospital, School of Medicine, Zhejiang University, Hangzhou 310016, China
4
School of Biomedical Sciences, The University of Western Australia, Perth, WA 6009, Australia
5
Shenzhen Insitute of Advanced Technology, Chinese Academy of Sciences, Shenzhen 518055, China
*
Authors to whom correspondence should be addressed.
Genes 2025, 16(5), 514; https://doi.org/10.3390/genes16050514
Submission received: 10 February 2025 / Revised: 1 April 2025 / Accepted: 24 April 2025 / Published: 28 April 2025
(This article belongs to the Section Human Genomics and Genetic Diseases)

Abstract

:
Background: Spinal cord injury (SCI) remains a profound medical challenge, with limited therapeutic options available. Studies focusing on individual molecular markers have limitations in addressing the complex disease process. Methods: This study utilizes RNA-sequencing (RNA-seq) to investigate the differentially expressed genes (DEGs) in spinal cord tissue from a rat SCI model at 1 and 21 days post-injury (dpi). After data processing and analysis, a series of biological pathway enrichment analyses were performed using online tools DAVID and GSEA. Interactions among the enriched genes were studied using Cytoscape software to visualize protein–protein interaction networks. Results: Our analysis identified 595 DEGs, with 399 genes significantly upregulated and 196 significantly downregulated at both time points. CD68 was the most upregulated gene at 21 dpi, with a significant fold change at 1 dpi. Conversely, MPZ was the most downregulated gene. Key immune response processes, including tumor necrosis factor (TNF) production, phagocytosis, and complement cascades, as well as systemic lupus erythematosus (SLE)-associated pathways, were enriched in the upregulated group. The enriched pathways in the downregulated group were related to the myelin sheath and neuronal synapse. Genes of interest from the most significantly downregulated DEGs were SCD, DHCR24, PRX, HHIP, and ZDHHC22. Upregulation of Fc-γ receptor genes, including FCGR2B and FCGR2A, points to potential autoimmune mechanisms. Conclusions: Our findings highlight complex immune and autoimmune responses that contribute to ongoing inflammation and tissue damage post-SCI, underscoring new avenues for therapeutic interventions targeting these molecular processes.

Graphical Abstract

1. Introduction

1.1. The Burden of Spinal Cord Injury

The spinal cord belongs to the central nervous system (CNS) and houses neuronal circuits that integrate and coordinate complex motor, sensory, and autonomic functions between the brain and body [1]. The spinal cord lies within a meningeal sheath in the vertebral column and is divided into segments longitudinally, with each segment having sensory, motor, and autonomic nerve fibers that leave via a spinal nerve [1]. SCI is the injury of the spinal cord from the foramen magnum to the cauda equina which occurs as a result of incision, compulsion, or contusion [2]. Globally, the most common causes of SCI are traffic accidents, gunshot injuries, knife injuries, falls, and sports injuries [2]. SCI is a devastating neurological state with extensive physical, psychological, and financial complications [3]. The annual global prevalence of SCI is estimated to fall between 250,000 and 500,000 individuals [4], and it is highly prevalent in developed nations, with a high economic burden. In Canada, the calculated annual economic burden of SCI is almost 2.67 billion dollars, with the total lifetime cost estimated to exceed 3 million dollars per person [5]. Currently, the available treatments are highly limited for patients with permanent disability and only provide supportive relief and rehabilitation [4]. SCI treatment limitations are primarily due to a poor understanding of the complex disease pathophysiologic consequences post-injury, especially on a gene-expression level [3].

1.2. Pathophysiology of SCI & Regeneration

Our understanding of SCI mechanisms in the past few decades has benefited due to the development of transgenic and preclinical animal models. The pathophysiology of SCI is traditionally categorized into both acute and chronic phases and incorporates a cascade of destructive events, such as ischemia, oxidative stress, inflammatory events, apoptotic pathways, and locomotor dysfunction [3]. More recently, a new systematic classification has been adopted to better define the complicated pathophysiological processes of SCI, which states that the inability of the spinal cord to regenerate can be attributed to a stage-specific imbalance of tissue-, cell-, and molecule-promoting and inhibiting factors in the microenvironment [6]. A transcriptome-wide study can contribute to our understanding of this environment.

1.2.1. Disease Progression

The initial stage of SCI is known as the primary injury, which describes the mechanical injury to the spinal cord. This results in the destruction of neural tissue, disruption of key axonal networks, vascular edema, and disruption of the glial membrane and the blood-spinal cord barrier [3]. Secondary injury describes the cascade of biochemical, mechanical, and physiological changes within neural tissues that ensue [7]. This stage is further sub-classified into acute, sub-acute, and chronic [8]. The timing of these stages remains debated; however, it is generally accepted that the acute phase occurs within the first 48 h, the sub-acute phase extends up to two weeks, and the chronic phase begins thereafter. While these phases overlap, the molecular signals within the injury microenvironment drive variations in cell phenotype. In mice studies, the most dynamic molecular changes occur within 3 days of injury, and by 2 weeks, a second wave of neuroinflammation emerges with neuronal cell changes. Beyond this point, major cell types are significantly deviated from uninjured states, which reflects prolonged alterations in the cellular microenvironment [9,10]. Therefore, a study examining the acute phase and chronic phase of injury allows us to identify key drivers that remain in between the immediate injury and long-term pathological changes, without confounding transitional processes that will not influence chronic outcomes. Chronic outcomes of secondary injury such as axon failure over reactive scar-forming astrocytes and remyelination are crucial to address especially since the main victims of SCI worldwide are well past their moment of injury [11].

1.2.2. Central vs. Peripheral Nervous System

The ability to regenerate relies on neurons transcriptionally reverting to an embryonic-like state [12] and, hence, is associated with specific gene expression or phenotype. Peripheral nervous system (PNS) neurons regenerate more readily than CNS neurons, to the extent that even spinal motor neurons that project to form peripheral nerves regenerate and maintain muscle function post-injury [13]. The CNS and PNS respond differently to injuries, and the differing gene expression post-injury may give insight into the underlying complex biological processes involved. Unlike CNS cells, PNS axons increase their intrinsic growth state due to transcription-dependent changes in their gene expression and axonal transport after a conditioning lesion [14]. It has also been shown that the injury-induced regulation of neuronal transcription in sensory neurons of the PNS relies on the induction of a specific network of genes that promote regeneration, which cannot be seen in the CNS [15]. Since the CNS fails to upregulate certain pro-regenerative genes that are automatically upregulated in the PNS, it logically follows that there could be a combination of downregulated genes in CNS neurons post-injury that are preventing regeneration.

1.2.3. Regenerative Hypotheses

Our understanding of pathological genes contributing to SCI pathology may be incomplete due to a reliance on single-gene hypotheses and protein analyses driving research in the area. Several pioneering studies have hypothesized that both the Nogo and PTEN genes are responsible for inhibiting spinal cord regeneration [16,17,18,19]. In addition, there is the glial scar hypothesis, which describes the physical barrier that prevents axonal regeneration [8,20,21,22]. While some studies did show the therapeutic benefit of targeting these domains of injury, these therapies did not restore function in other injury models. Zheng et al. saw no remarkable CST axon regeneration in knockout mice with targeted disruption of the Nogo loci compared to wild-type mice following spinal cord transection [23]. The glial scar theory is also difficult to appreciate as it is initially neuroprotective in SCI recovery. In the acute and sub-acute secondary phase of SCI, the glial scar acts as both a suppressor and regulator of inflammation via immune cells, while also restricting inflammatory and fibrotic infiltrate in the chronic phase [22]. Anderson et al. observed that ablation of the glial scar fails to create spontaneous axonal regrowth [24].
Several studies have also examined single DEGs. The Bcl-2 family of proteins are potent regulators of apoptotic cell death, which include Bax and anti-apoptotic Bcl-2 [25]. Bax expression in vivo correlated with apoptotic neuronal death in complete SCI and was increased in injured spinal cord tissues, with a decrease in Bcl-2 levels [26,27]. Another DEG identified was published in a study by Park et al., who observed a significant fold increase in SOCS3 mRNA expression in injured spinal cords of mice, with consequent cellular protection after the introduction of a viral vector [28].

1.3. Genetic Analysis

These methods, while informative, might not capture the full spectrum of gene expression changes that occur at the RNA level, potentially overlooking critical regulatory mechanisms and novel targets for therapeutic intervention. There is also a sparse amount of research pertaining to the genes that are downregulated in SCI, with no well-established genes. Microarrays were the gold standard for gene expression for over 15 years [29] but have been swapped out in favor of RNA-Seq. RNA-Seq quantifies the levels of various RNA types in a sample by directly sequencing the RNA and counting the number of sequences [30]. Although RNA-Seq is expensive and requires high computational and data-storage capacity, it is useful in exploratory analysis, has a high throughput, and has less background noise and better detection than even microarrays [30]. Unlike microarray studies, which are limited to predefined gene sets, RNA-seq allows for the exploration of the entire transcriptome, capturing a broader spectrum of gene expression changes to enhance our understanding of the intrinsic neuronal and molecular responses to SCI. Although reporting biases of DEGs in the literature exist and gene expression changes may not always translate into consequential biological activity, data from DEG analysis can be pooled with other biological data to create integrated analyses, forming the target landscape of a pathological state [31]. Hence this study design utilizing total cell RNA can be a valuable tool for identifying novel cell types associated with disease, suggesting new pathophysiological mechanisms, uncovering potential drug targets, and discovering potential biomarkers [32]. The figure below illustrates our analytical pipeline that will provide the foundation for future research into gene suppression or supplementation to regenerate the CNS after injury (Figure 1).

2. Method

2.1. Gene Collection

Female Sprague-Dawley rats (200–220 g) were obtained from the Animal Center of the Chinese Academy of Sciences (Shanghai, China) and housed individually under specific pathogen-free (SPF) conditions in a temperature-controlled facility at the Animal Center of Sir Run Run Shaw Hospital, Zhejiang University. All experimental procedures were approved by the Institutional Animal Care and Use Committee (IACUC) of Zhejiang University (approval number: ZJU20220466) and conducted in accordance with institutional guidelines. Prior to surgery, rats were anesthetized with sodium pentobarbital (40 mg/kg) and the dorsal area was shaved. A clip-compression model of spinal cord injury (SCI) was established at the T9–T10 vertebral level using 5-mm surgical forceps (FT190T, B. Braun, Melsungen, Germany) applied for 1 min. To ensure consistent injury severity, the forceps tips were fully inserted on either side of the exposed spinal cord. Postoperative care included manual bladder expression and shell placement. At 1 and 21 days post-surgery, three rats were humanely euthanized for collection of total spinal cord tissue samples.

2.2. RNA-Sequencing

Total RNA from spinal cord tissue was extracted according to the manufacturer’s instructions using TRIzol reagent. Sample purity was evaluated using a NanoPhotometer (IMPLEN, Westlake Village, CA, USA), while RNA concentration and integrity were assessed with an Agilent 2100 RNA Nano 6000 assay kit (Agilent Technologies, Santa Clara, CA, USA). For library preparation, 1–3 µg of RNA per sample was used. Sequencing libraries were constructed using the VAHTS Universal V6 RNA-seq Library Prep Kit for Illumina (NR604-01/02) according to the supplier’s protocol, with unique index codes assigned to each sample. Preliminary quantification of the RNA libraries was performed using the Qubit RNA Assay Kit on a Qubit 3.0 fluorometer, and samples were diluted to a final concentration of 1 ng/μL. Library insert size was determined with the Agilent Bioanalyzer 2100 system. Once the insert size met the required specifications, the library’s effective concentration (>10 nM) was precisely quantified using a Bio-Rad CFX96 real-time PCR system. The clustering of the index-coded samples was performed on a cBot cluster generation system using HiSeq PE Cluster Kit v4-cBot-HS (Illumina, San Diego, CA, USA) according to the manufacturer’s instructions. Finally, cluster generation and sequencing were performed on a NovaSeq 6000 S4 platform, using the NovaSeq 6000 S4 Reagent kit V1.5 (Illumina, San Diego, CA, USA). The resulting dataset included almost twenty thousand identified genes.

2.3. Data Pre-Processing

The expression profile data were processed by log2 transformation. All blank genes were removed from the dataset. The pre-injury control (Con), day 1 post-injury (1 dpi), and day 21 post-injury (21 dpi) samples were filtered to include those of sufficient size (≥1 FPKM). This arbitrary cutoff was applied to remove noise from weakly expressed genes.

2.4. Statistical Analysis

The expression profile data were then subjected to multiple linear regression using the lmFit function, immediately followed by further computation with the eBayes function. Finally, the R 4.4.1 package Limma (Linear models for microarray data) was utilized to perform differential gene analysis on the expression profiles. Log fold-change values (logFC) were calculated at 21 dpi and 1 dpi, in comparison to Con. DEGs were defined at 1 dpi and 21 dpi as expressing a log FC magnitude of >1 and were statistically significant (p < 0.05). A volcano plot was created of all the statistically significant DEGs, both up- and downregulated, using the ggplot2 package of RStudio 2024.04.2 + 764 [33]. A new dataset was extracted from our filtering to create a list of sustained upregulated and downregulated DEGs; genes that expressed a significant fold change both at 1 dpi and 21 dpi. RStudio was used to generate a heatmap of the top 30 sustained upregulated and downregulated DEGs, an arbitrary cutoff for this visualization. A paired t-test was conducted to assess for significant differences between DEGs at 1 dpi and 21 dpi and comparative boxplots were plotted for the DEGs. Individual genes were selected to confirm pathological genes and add to the literature. Box plots were generated within ggplot2 v3.5.1 in R studio [33]. Genes were selected based on the subsequent pathway analysis and their potential for therapeutic benefit.

2.5. Functional Enrichment Analysis of Downregulated DEGs

A Gene Ontology (GO) analysis of the upregulated DEGs was conducted using the Database for Annotation, Visualisation, and Integrated Discovery (DAVID) (https://david.ncifcrf.gov/) [34,35]. The analysis identified the top enriched biological processes (GO: BP), cellular components (GO: CC), and molecular functions (GO: MF), with results imported into RStudio for the production of bubble plots which exhibit the enrichment score as well as pathway-related genes associated with the top GO pathways (including BP, CC and MF). A Kyoto Encyclopedia of Genes and Genomes (KEGG) pathway analysis of the DEGs was conducted using the Java-based Gene Set Enrichment Analysis (GSEA) [36]. GSEA was performed in preranked mode using GSEA software version 4.3.3. Genes were ranked according to log fold change. Gene identifiers from Rattus norvegicus were mapped using the Mouse_Gene_Symbol_Remapping_Human_Orthologs_MSigDB.v2024.1.Hs.chip file to align with human orthologs. Enrichment analysis was conducted against the KEGG pathway gene sets (C2:CP:KEGG_legacy) from the Molecular Signatures Database (MSigDB v2023.2, human, symbols.gmt). Enrichment plots were produced with normalized enrichment scores (NES) and false discovery rates (FDR). These results were transferred to RStudio and represented as bar plots which exhibit the enrichment score as well as the Q-value associated with the core KEGG pathways.

2.6. Protein–Protein Interaction (PPI) Network and Module Analysis

The Search Tool for the Retrieval of Interacting Genes (STRING) database was used to generate a PPI network for the DEGs with an interaction score exceeding 0.4 [37]. The STRING output was processed through the Molecular Complex Detection (MCODE) module in Cytoscape software v3.10.2 [38]. Cluster analyses of the PPI network for DEGs were produced. The cluster analyses were conducted using parameters of node score cut-off = 0.2, degree cut-off = 2, k-score = 2, and max. Depth = 100. The interactions of critical proteins are indicated by the number of interactions and the thickness of the lines. The clustered genes underwent further KEGG pathway analyses using DAVID with FDR-corrected p < 0.05 used as the level of significance.

3. Results from Total Spinal Cord Tissue of Ratticus Norvegicus

The statistical analysis employed in this study was designed to systematically identify DEGs and elucidate the molecular mechanisms underlying SCI. The DEGs, once identified, were used to explore their own functional significance through GO and KEGG. Finally, a cluster analysis through the Cytoscape MCODE module enabled the identification of key regulatory networks. Overall, this formed a sound methodological framework to facilitate the identification of key genes and pathways involved in SCI, addressing the study objective of understanding the molecular landscape of injury and recovery. By integrating differential expression analysis, pathway enrichment, and network analysis, this study provides a comprehensive view of the transcriptional response to SCI, laying the foundation for future research into potential therapeutic interventions.

3.1. Differential Gene Expression Analysis Between SCI and Control Groups

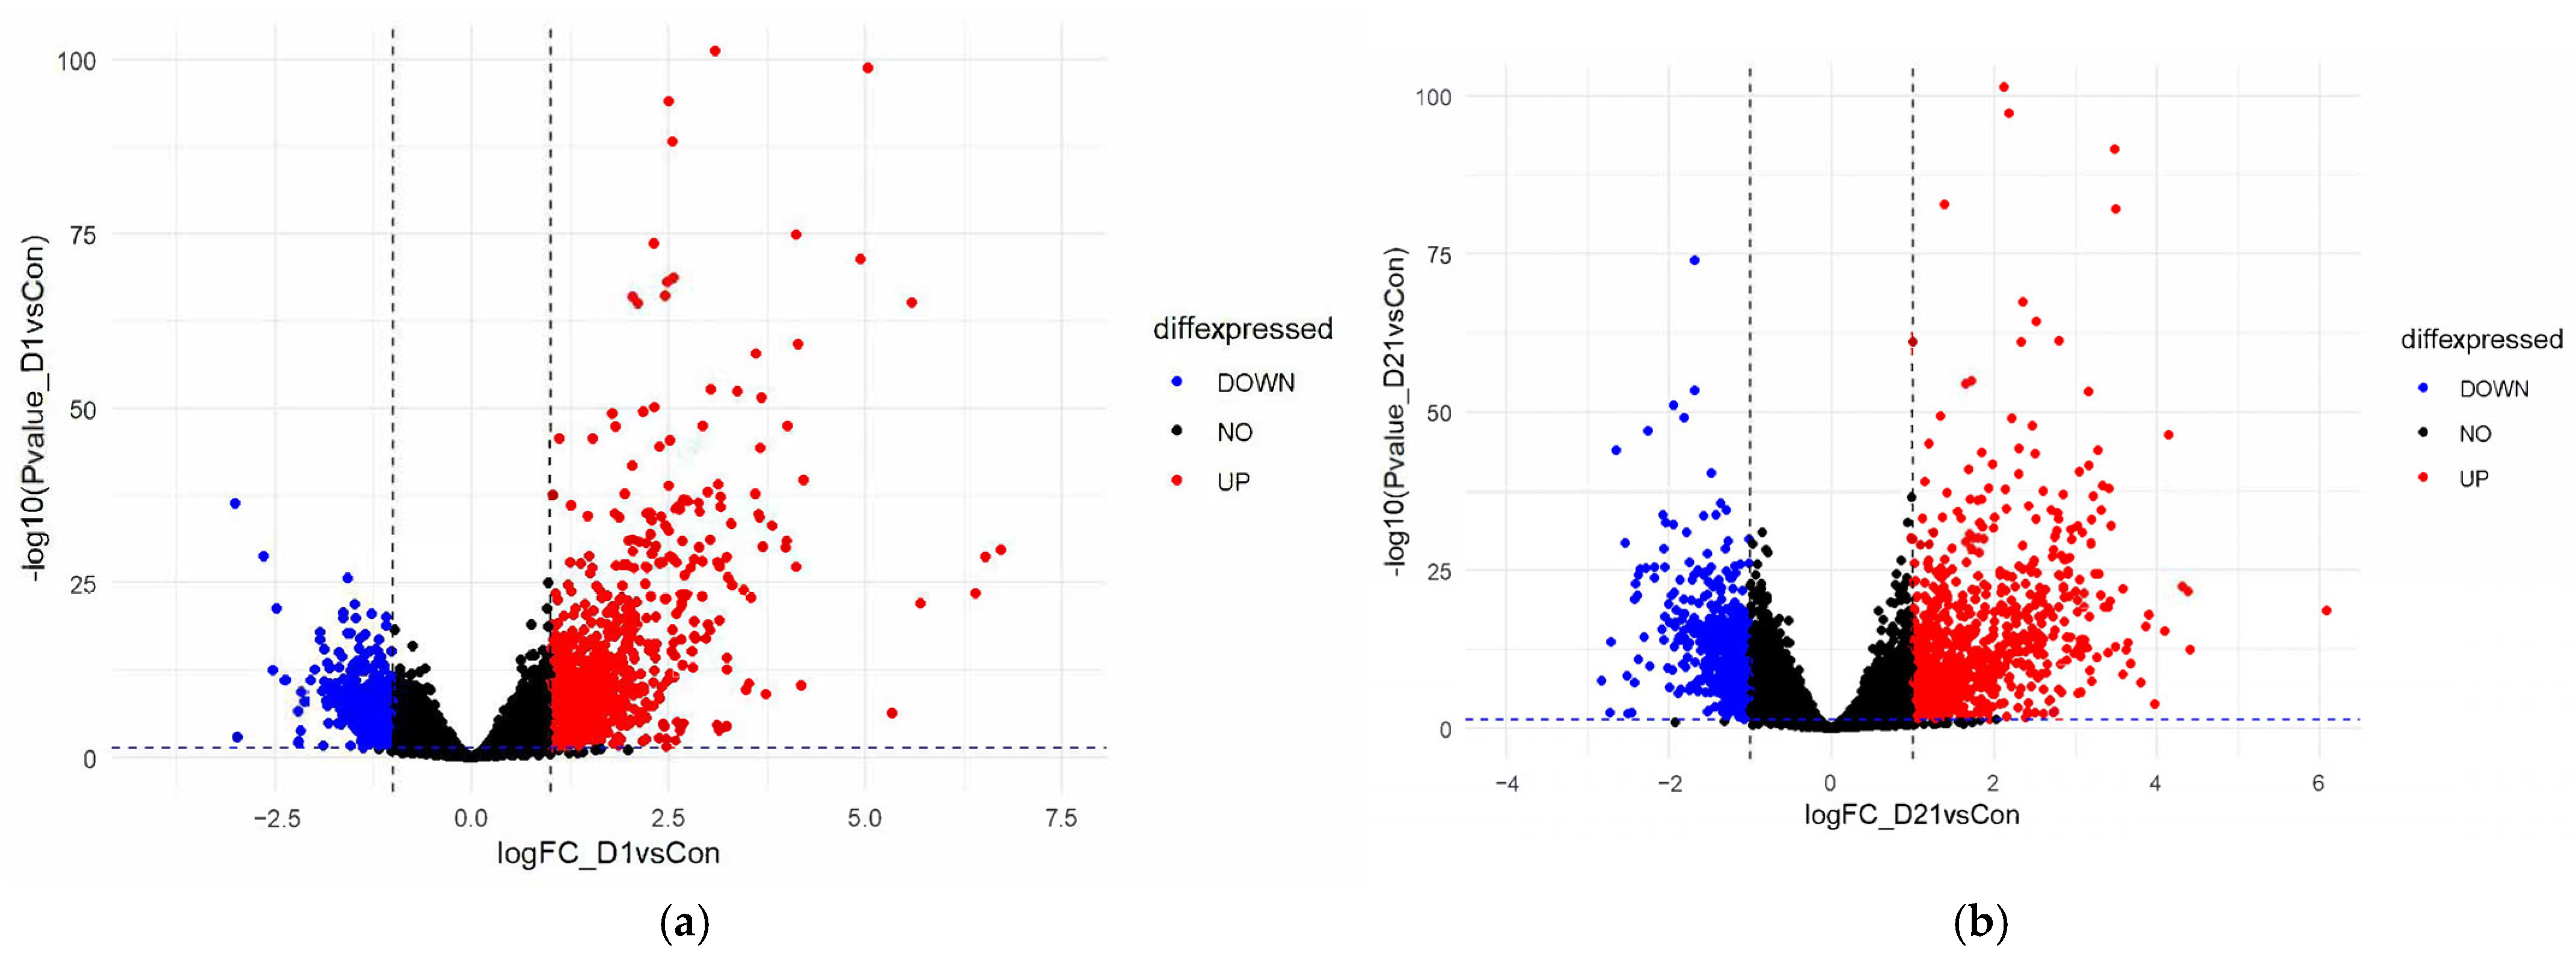
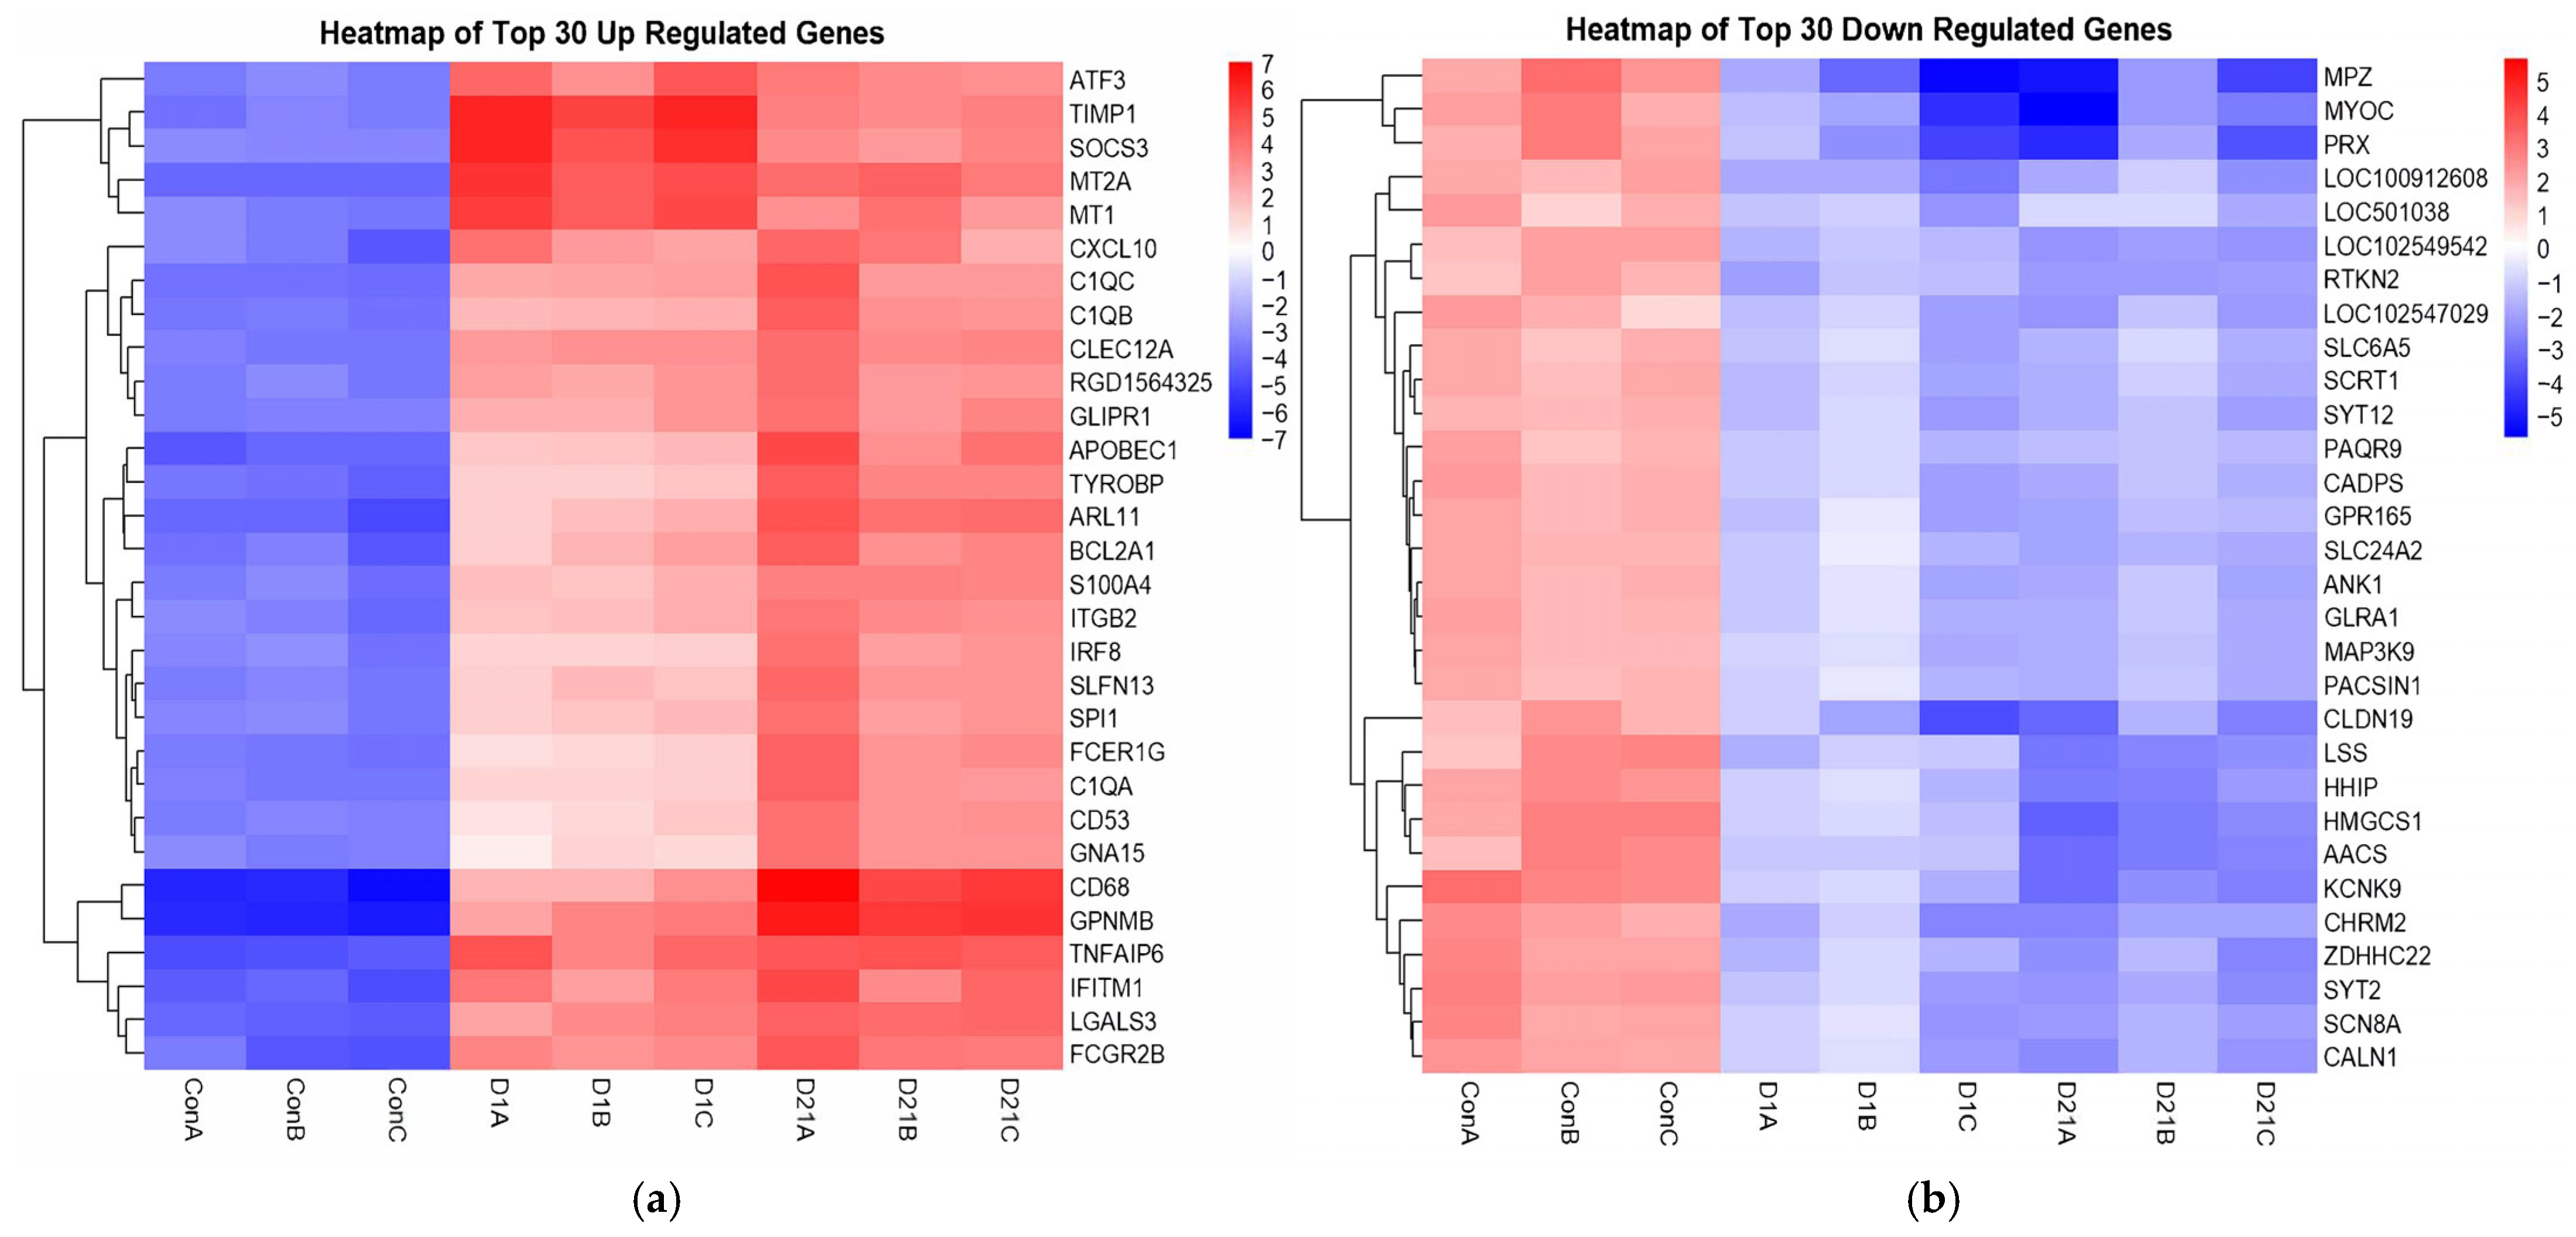
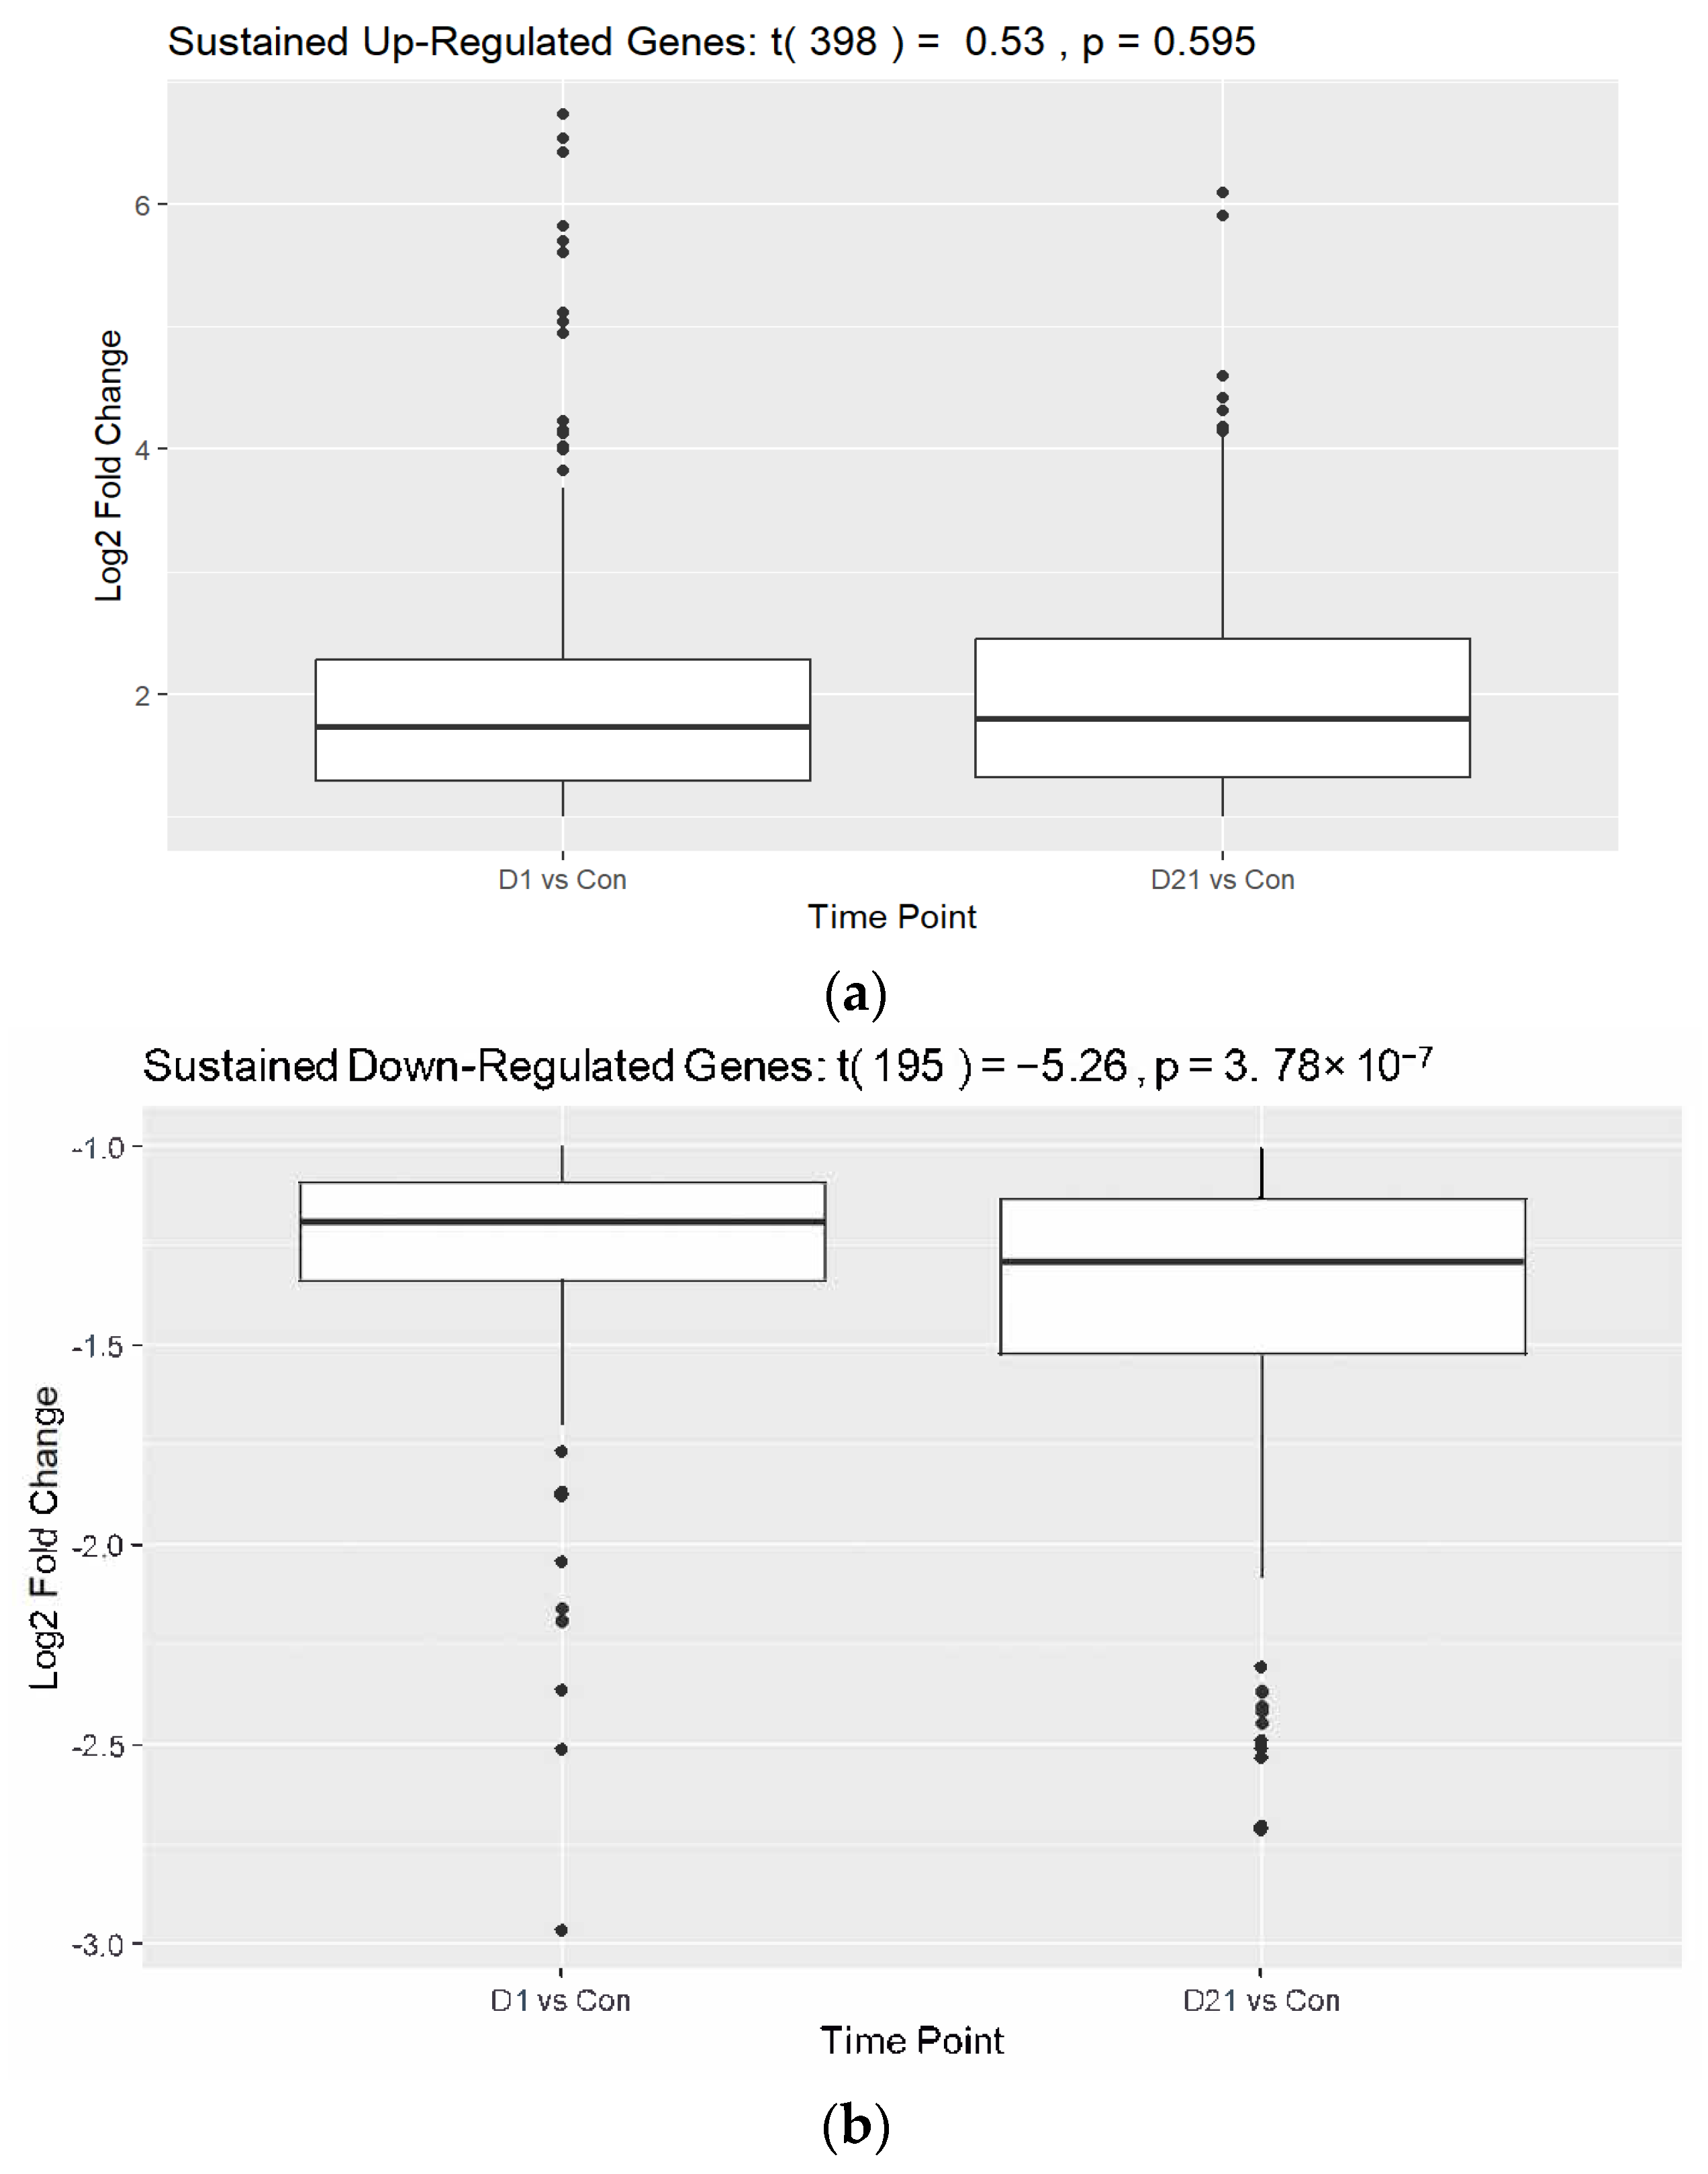
After filtering and quality control were applied, our data were reduced to 12,494 genes (all samples >1 FPKM, zero values removed). Our analysis identified 864 significantly upregulated and 586 significantly downregulated genes at 1 dpi. We identified 873 upregulated and 553 downregulated genes at 21 dpi (Figure 2). When considering both time points simultaneously, we identified 595 DEGs between the injury and control groups, with 11,899 genes being insignificant based on the following parameters: Absolute Value (21 dpi/Con logFC AND 1 dpi/Con logFC) > 1 and p < 0.05. Of the 595 genes, 399 were upregulated and 196 were downregulated at 1 dpi and 21 dpi (Table S1). The top 30 DEGs of each group were presented in a heatmap with hierarchical clustering (Figure 3), and a paired t-test analysis between timepoints was performed. The downregulated group revealed a significant difference between the mean in 21 dpi versus 1 dpi, with the former group being significantly lower, t(195) = −5.26, p < 0.001 (Figure 4). This result suggests that genes affected by injury fail to adapt to the injured state. The t-test showed no significant change in the upregulated group, which suggests that total RNA expression had no significant variation at each time point for upregulated DEGs.

3.2. Analysis of Established Genes Involved in SCI

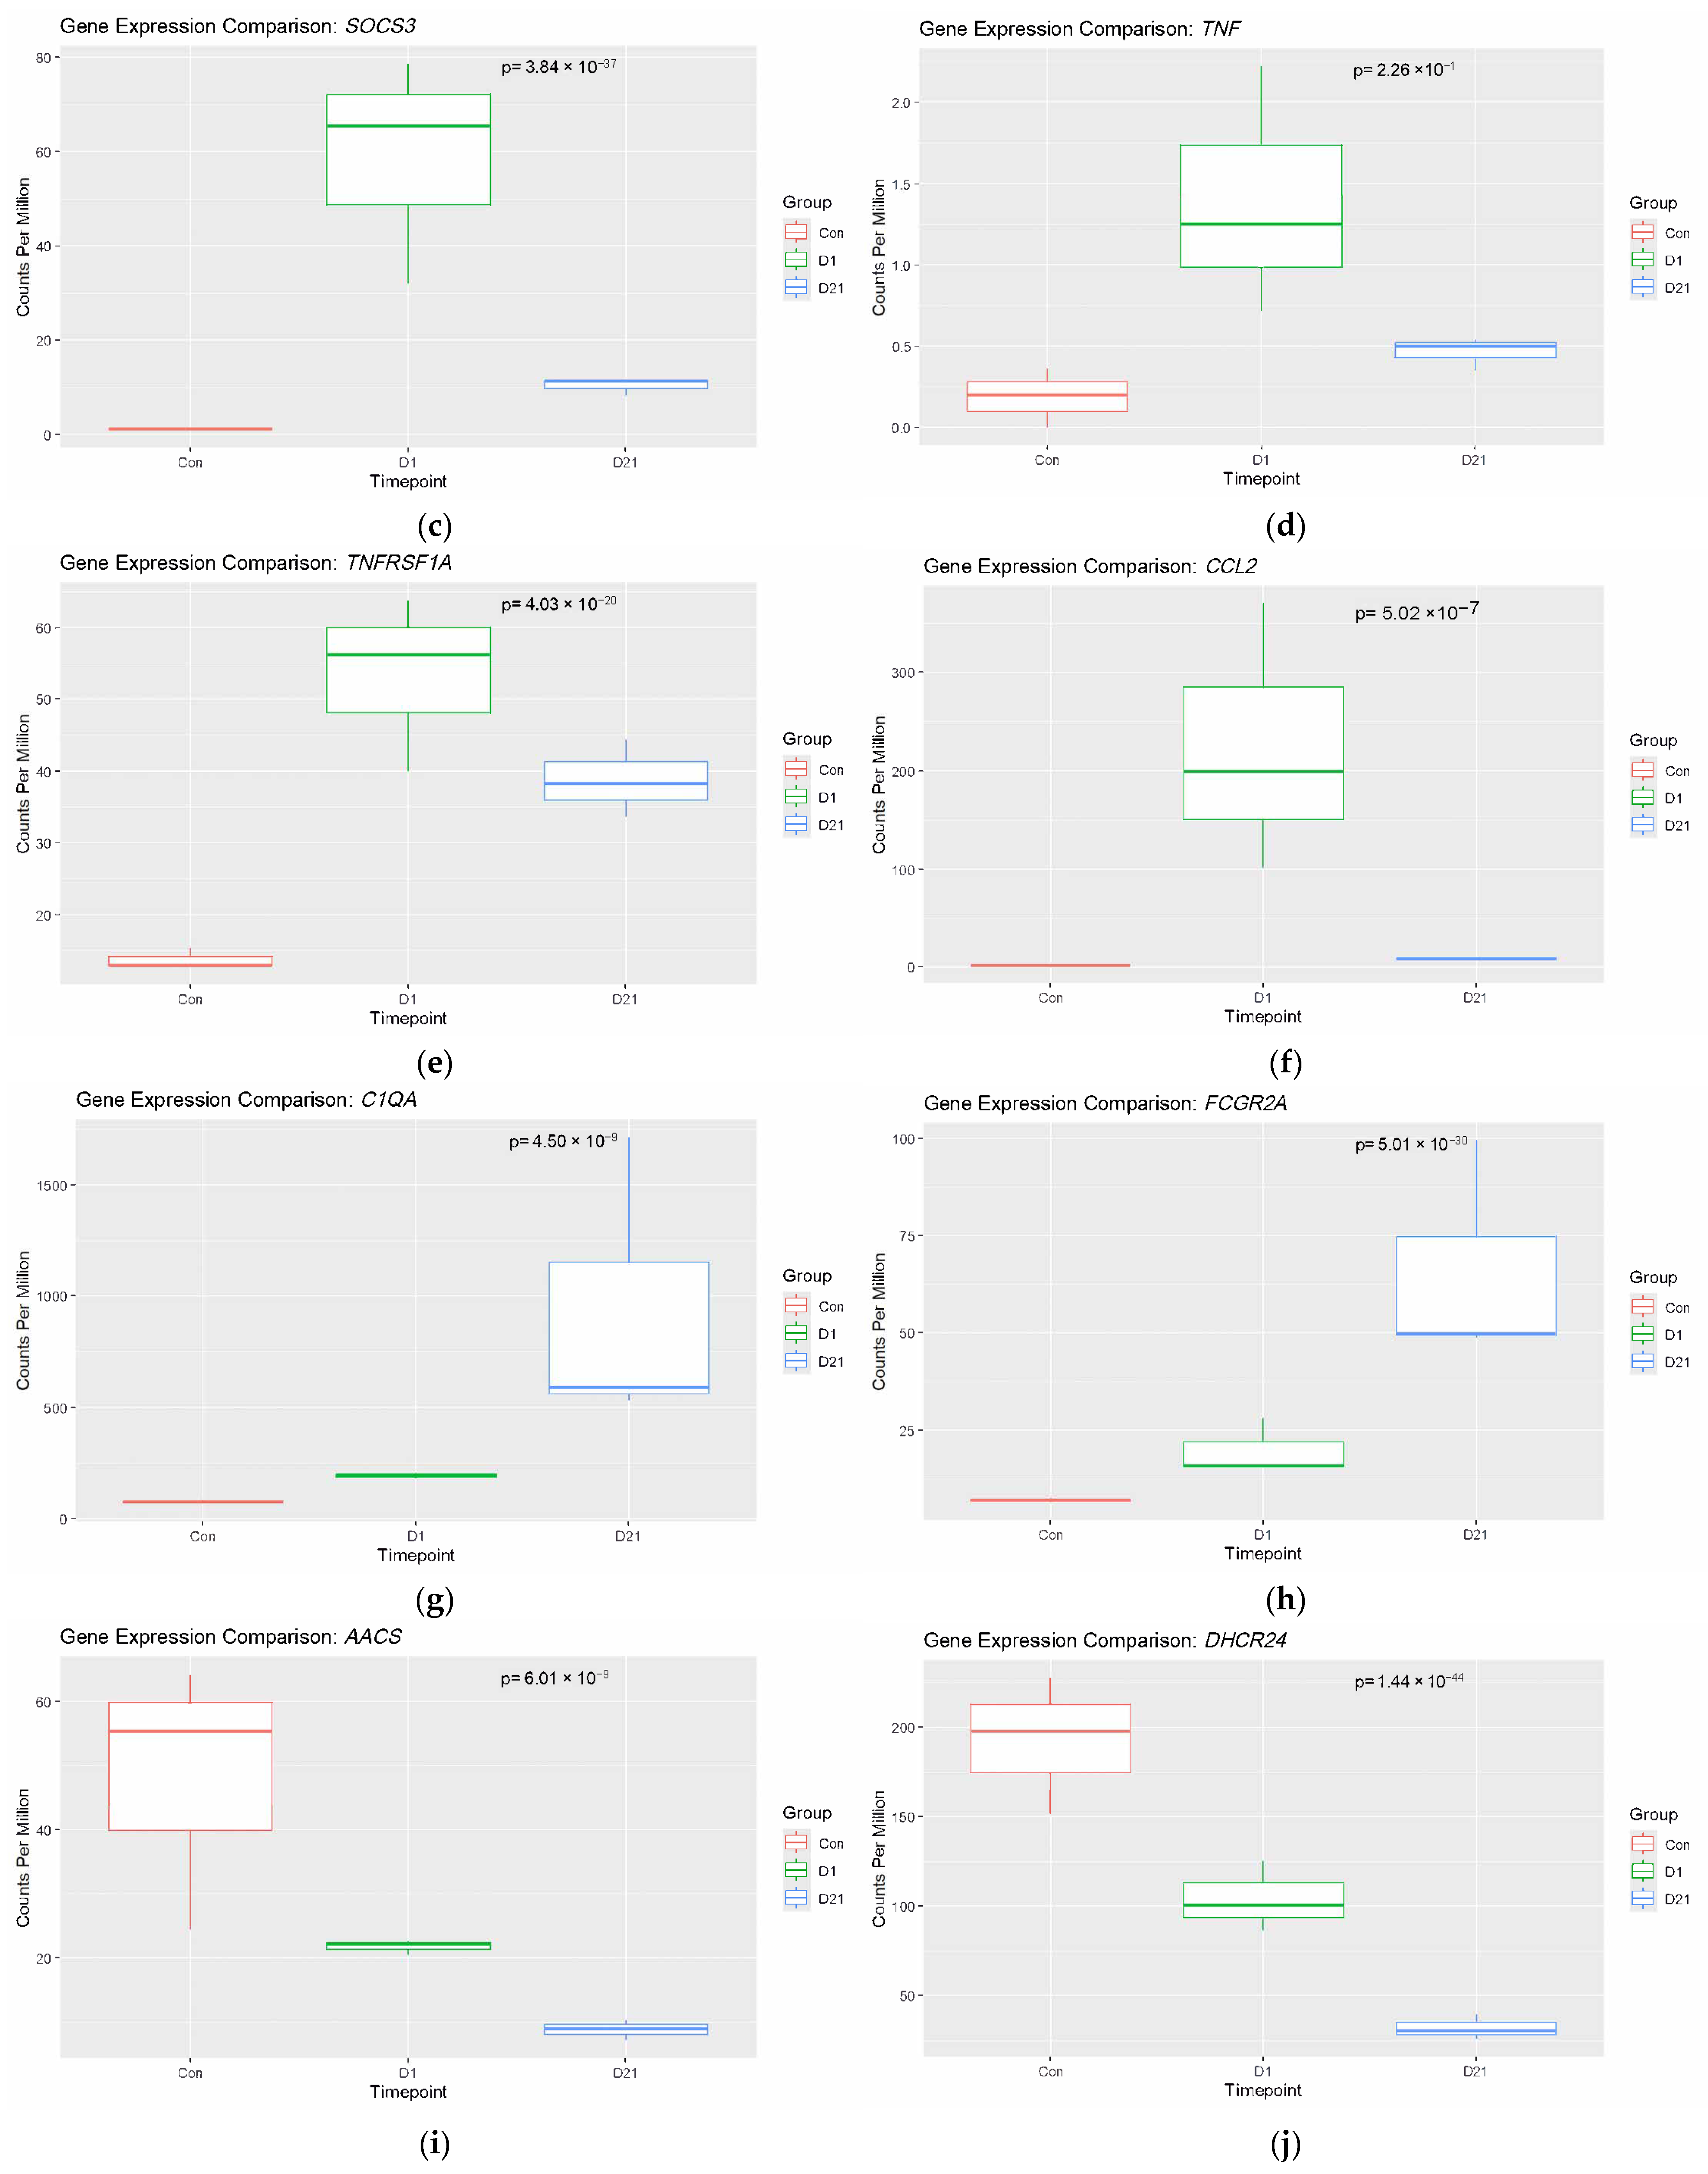
DEG results for several genes known to have a role in SCI pathogenesis were checked in our data to provide confidence in the injury model. These included Suppressor of Cytokine Signaling 3 (SOCS3), B-Cell Lymphoma 2 (BCL2), LGALS3, and TNF. All these genes were found to be significantly upregulated in the injury group at 1 dpi with logFC ≥ 1 and p < 0.05 (Figure 5a–d). Additional box plots were generated for genes of interest that were likely to offer therapeutic benefit for both groups (Figure 5e–r).

3.3. Enrichment Analysis of DEGs

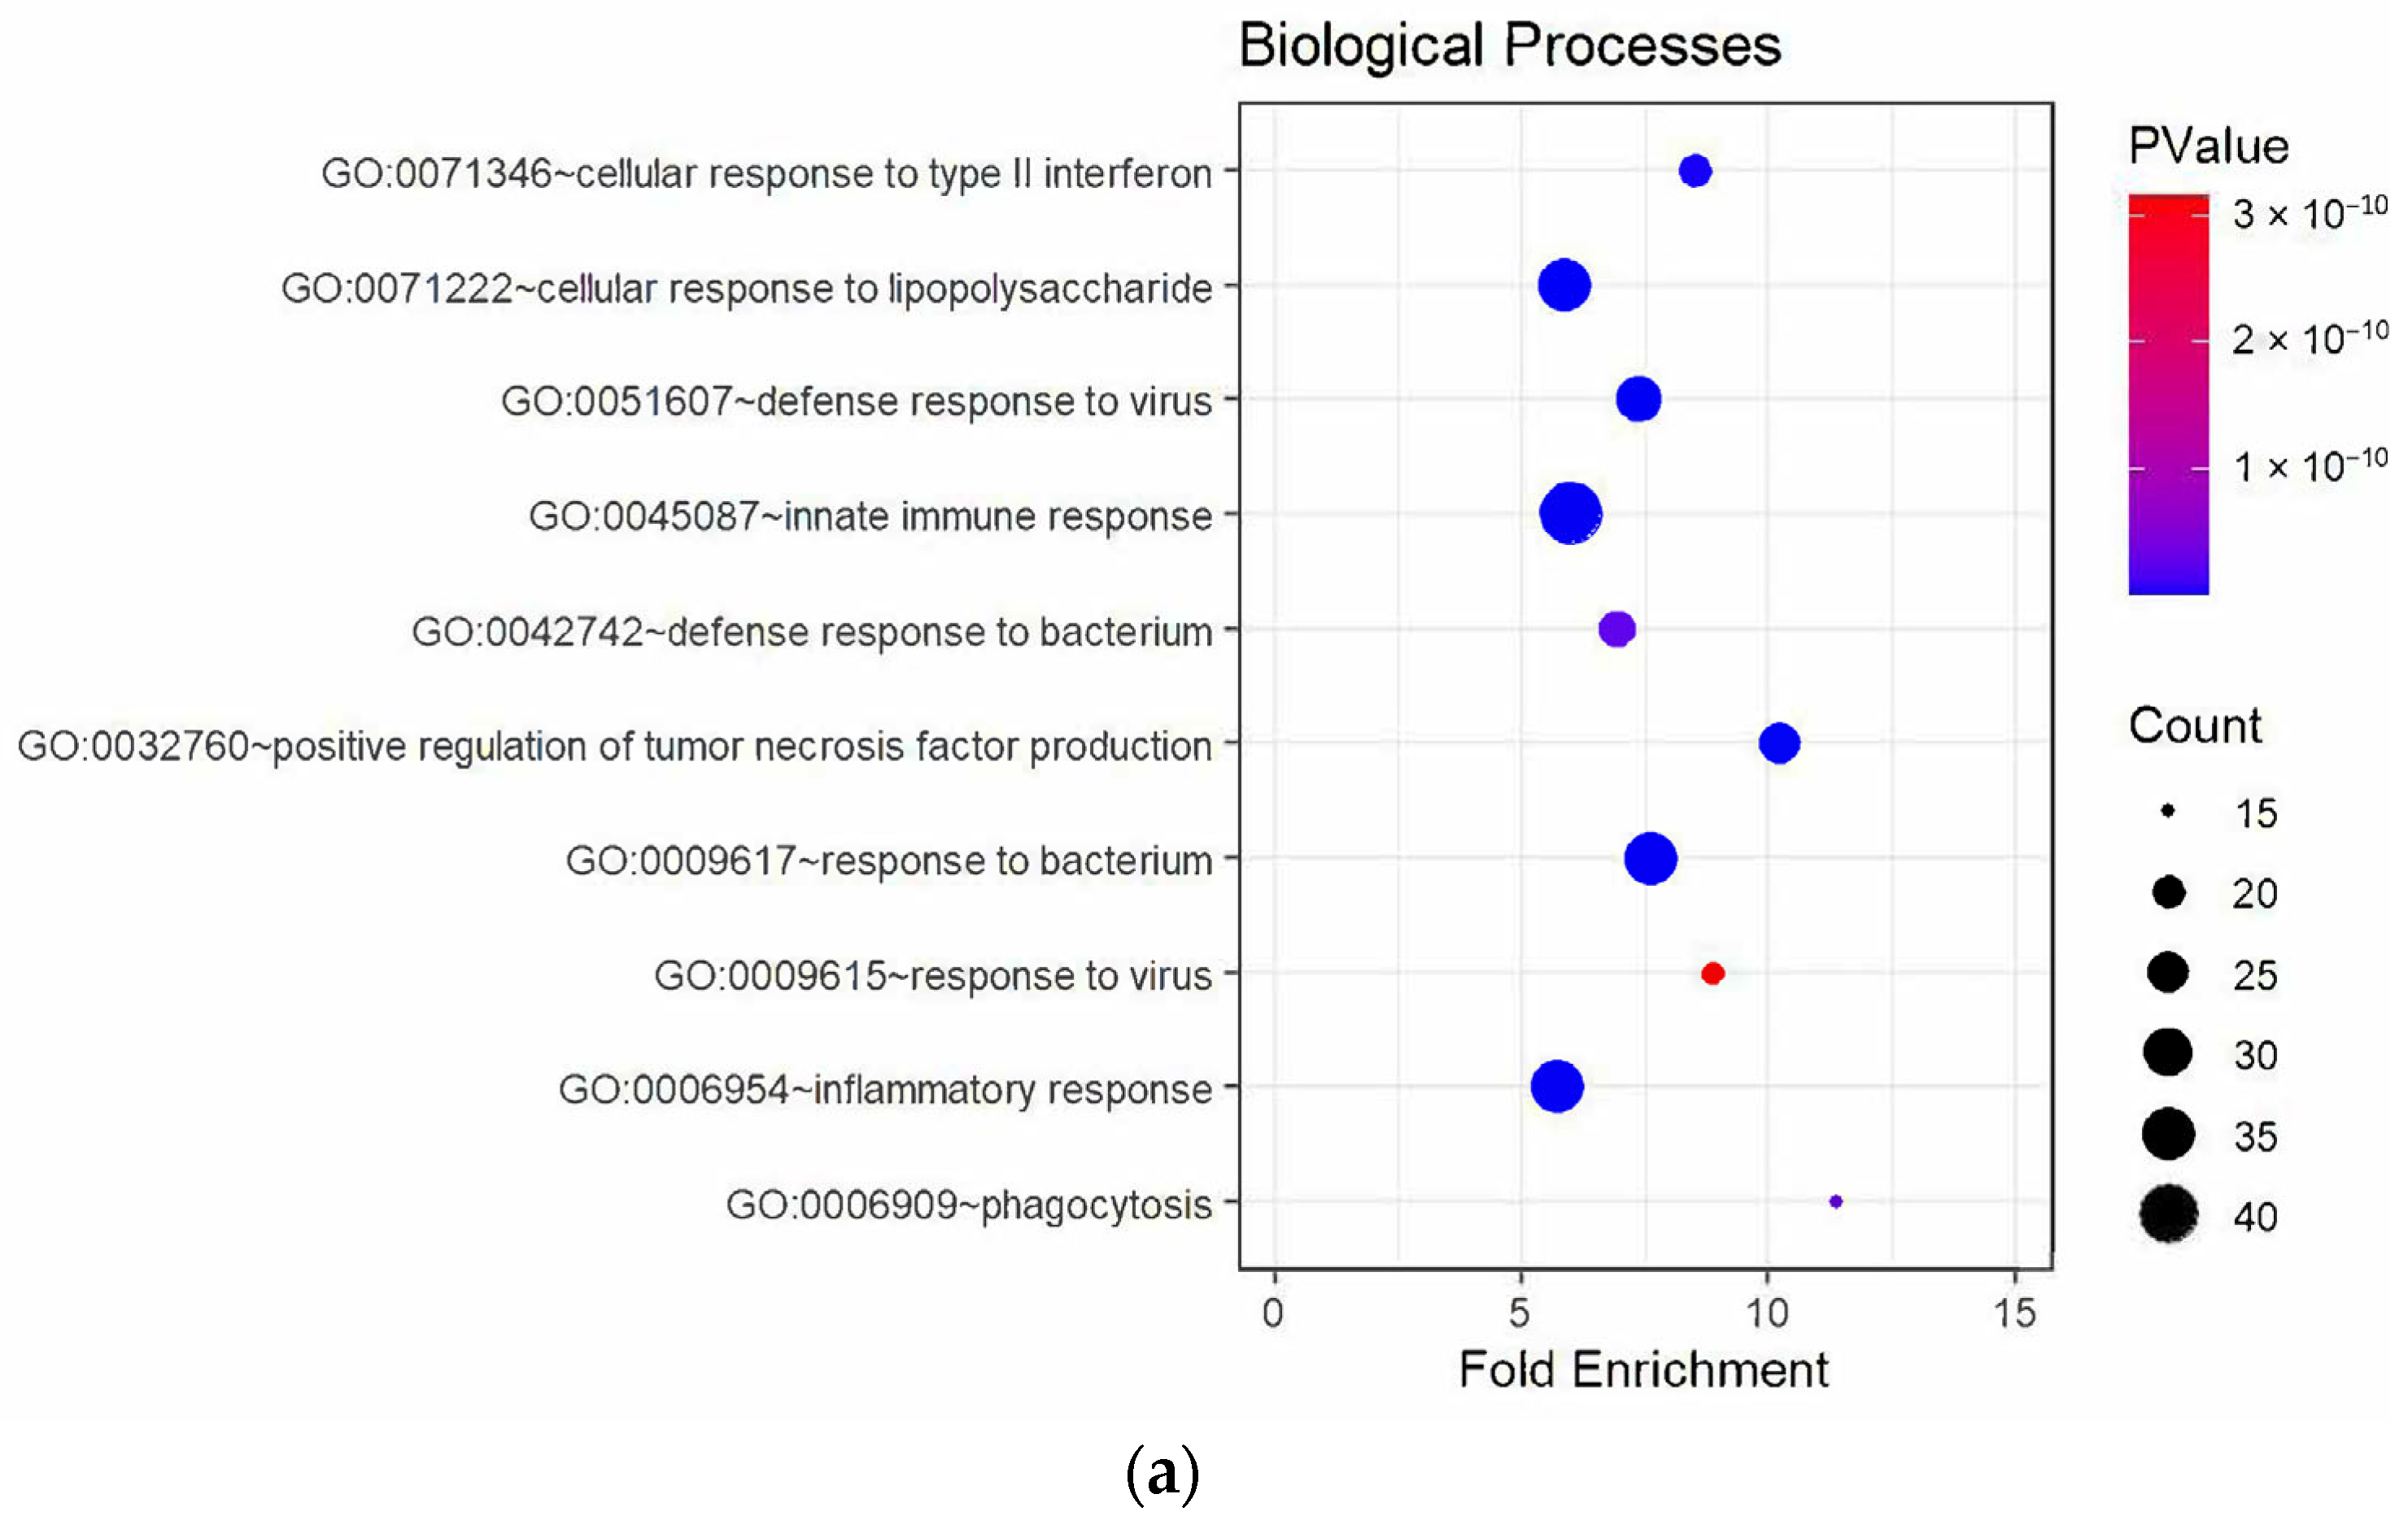
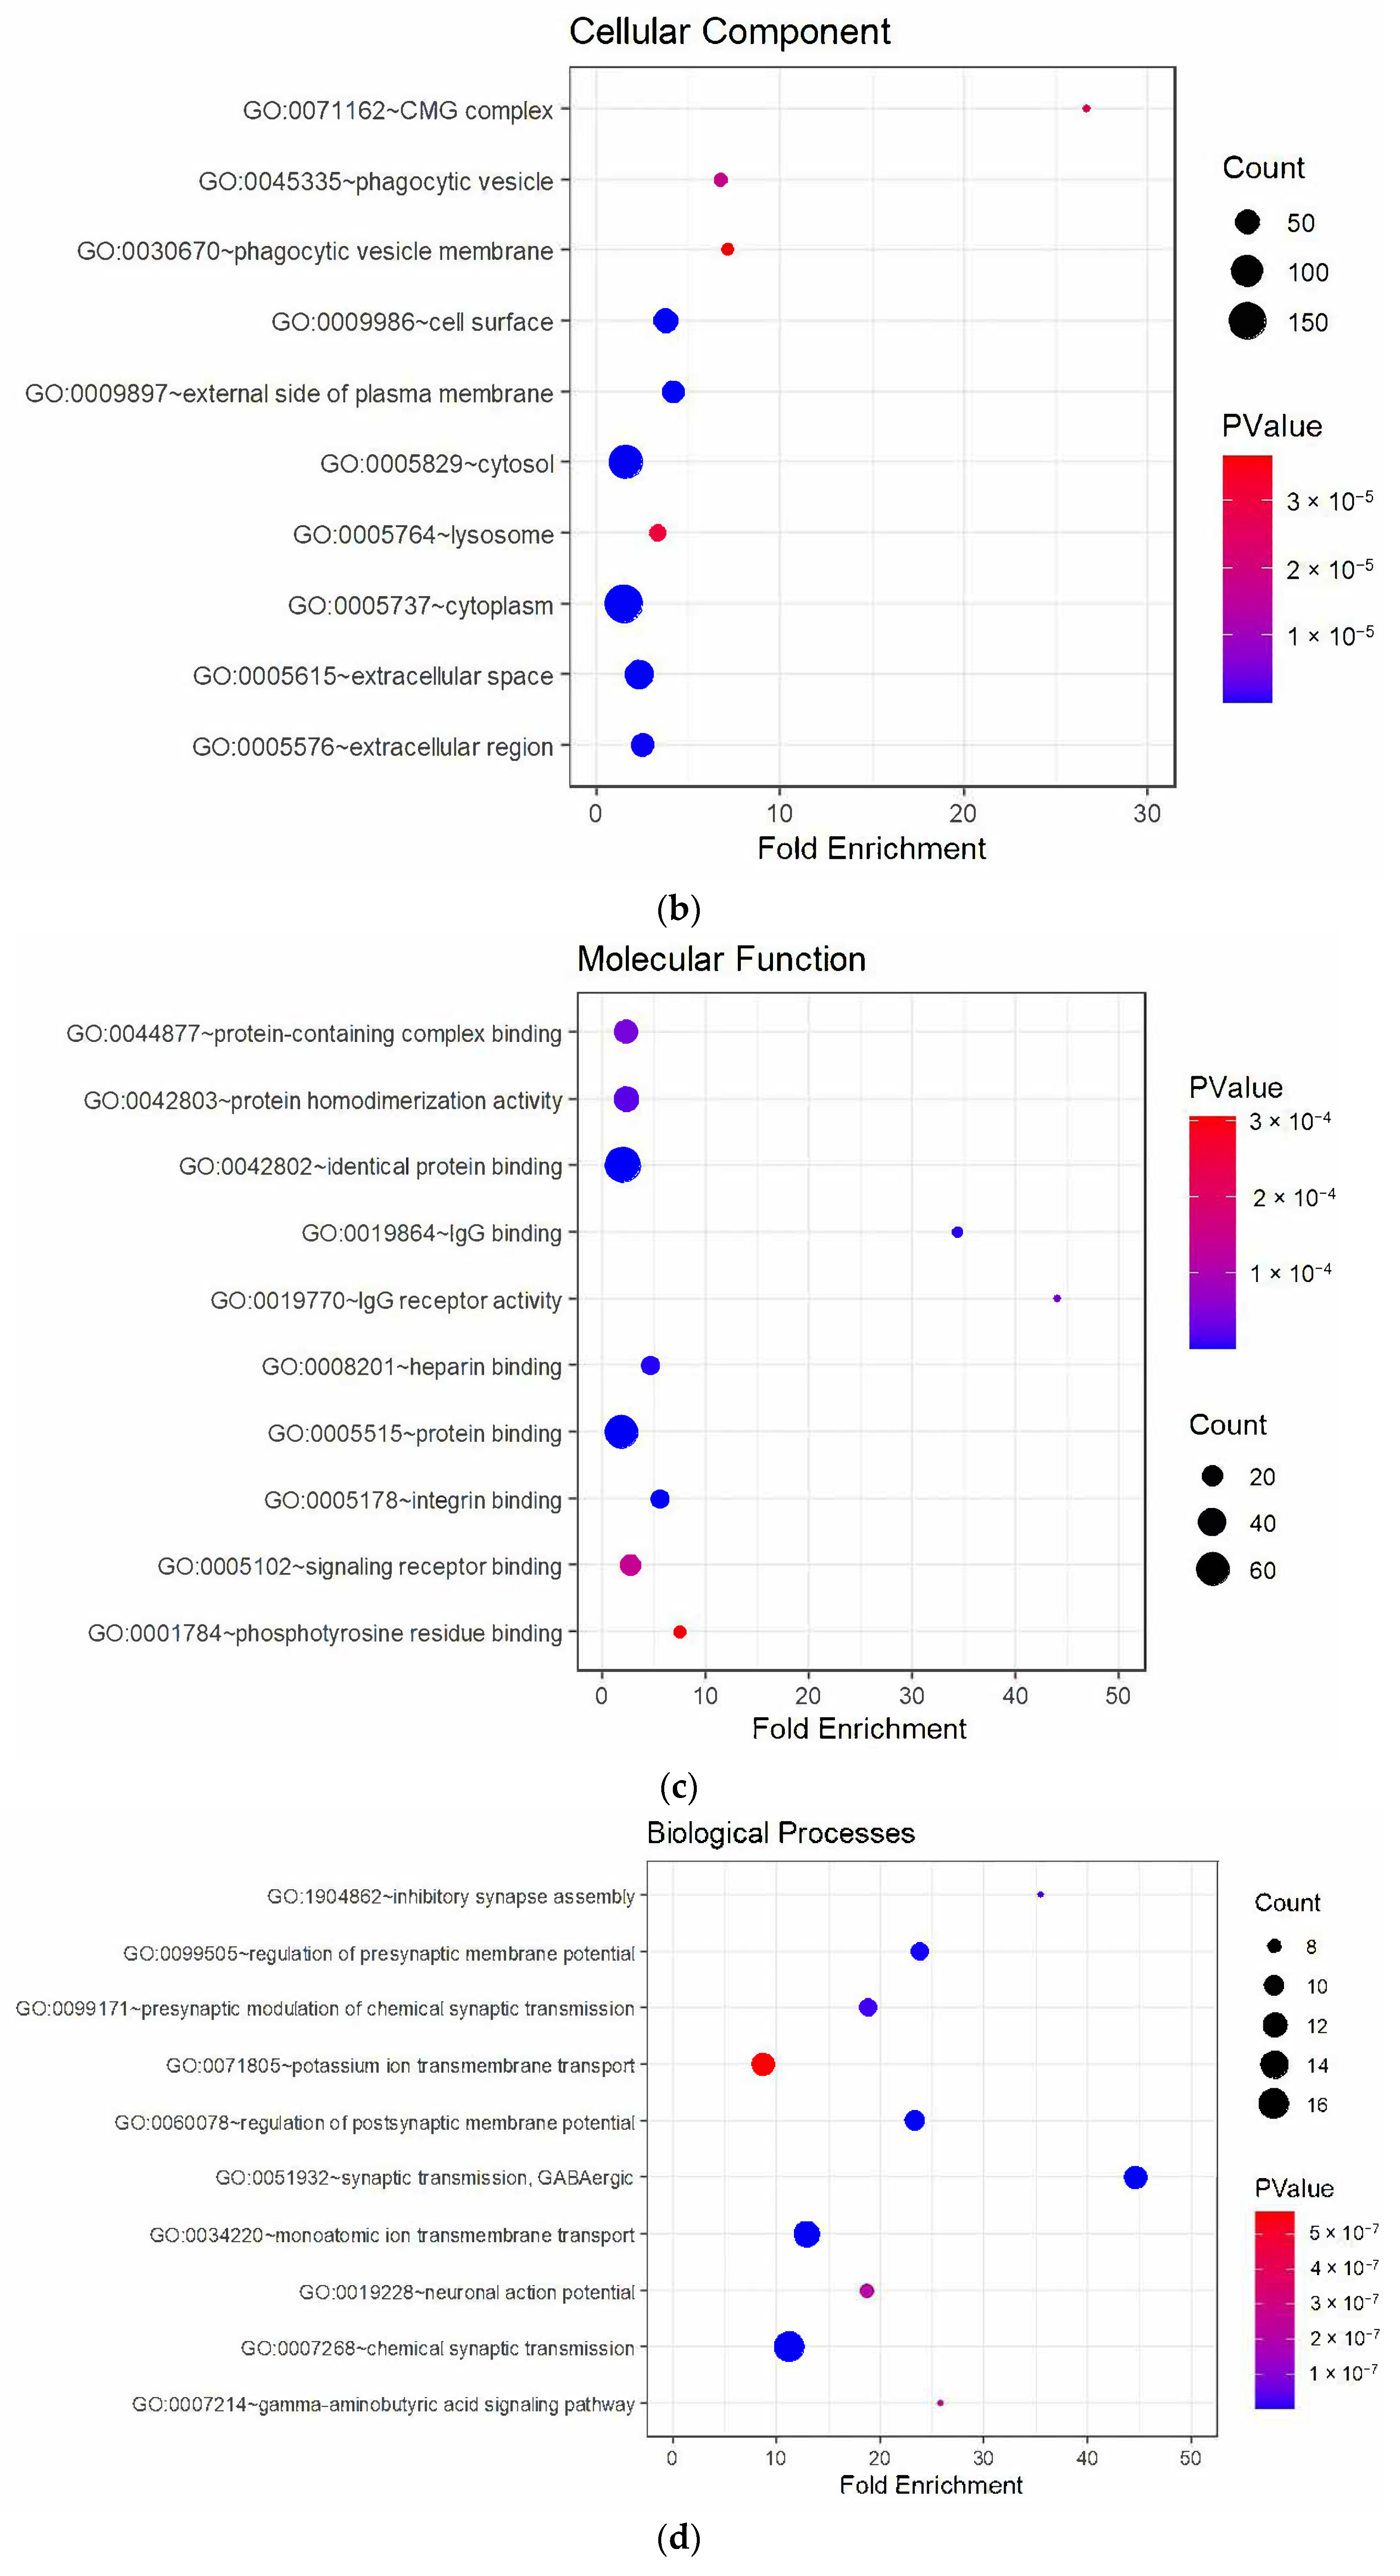
Using DAVID software (version DAVID 2021), the top enriched biological processes identified for the upregulated genes are the positive regulation of tumor necrosis factor production, phagocytosis, inflammatory response, innate immune response, cellular response to lipopolysaccharide, and cellular response to type II interferon (Figure 6a and Table S2). The top enriched cellular components are the CMG complex, phagocytic vesicle, phagocytic vesicle membrane, cytoplasm, and cytosol (Figure 6b and Table S2). The top enriched molecular functions are IgG binding, IgG receptor activity, protein binding, signaling receptor binding, and phosphotyrosine residue binding (Figure 6c and Table S2).
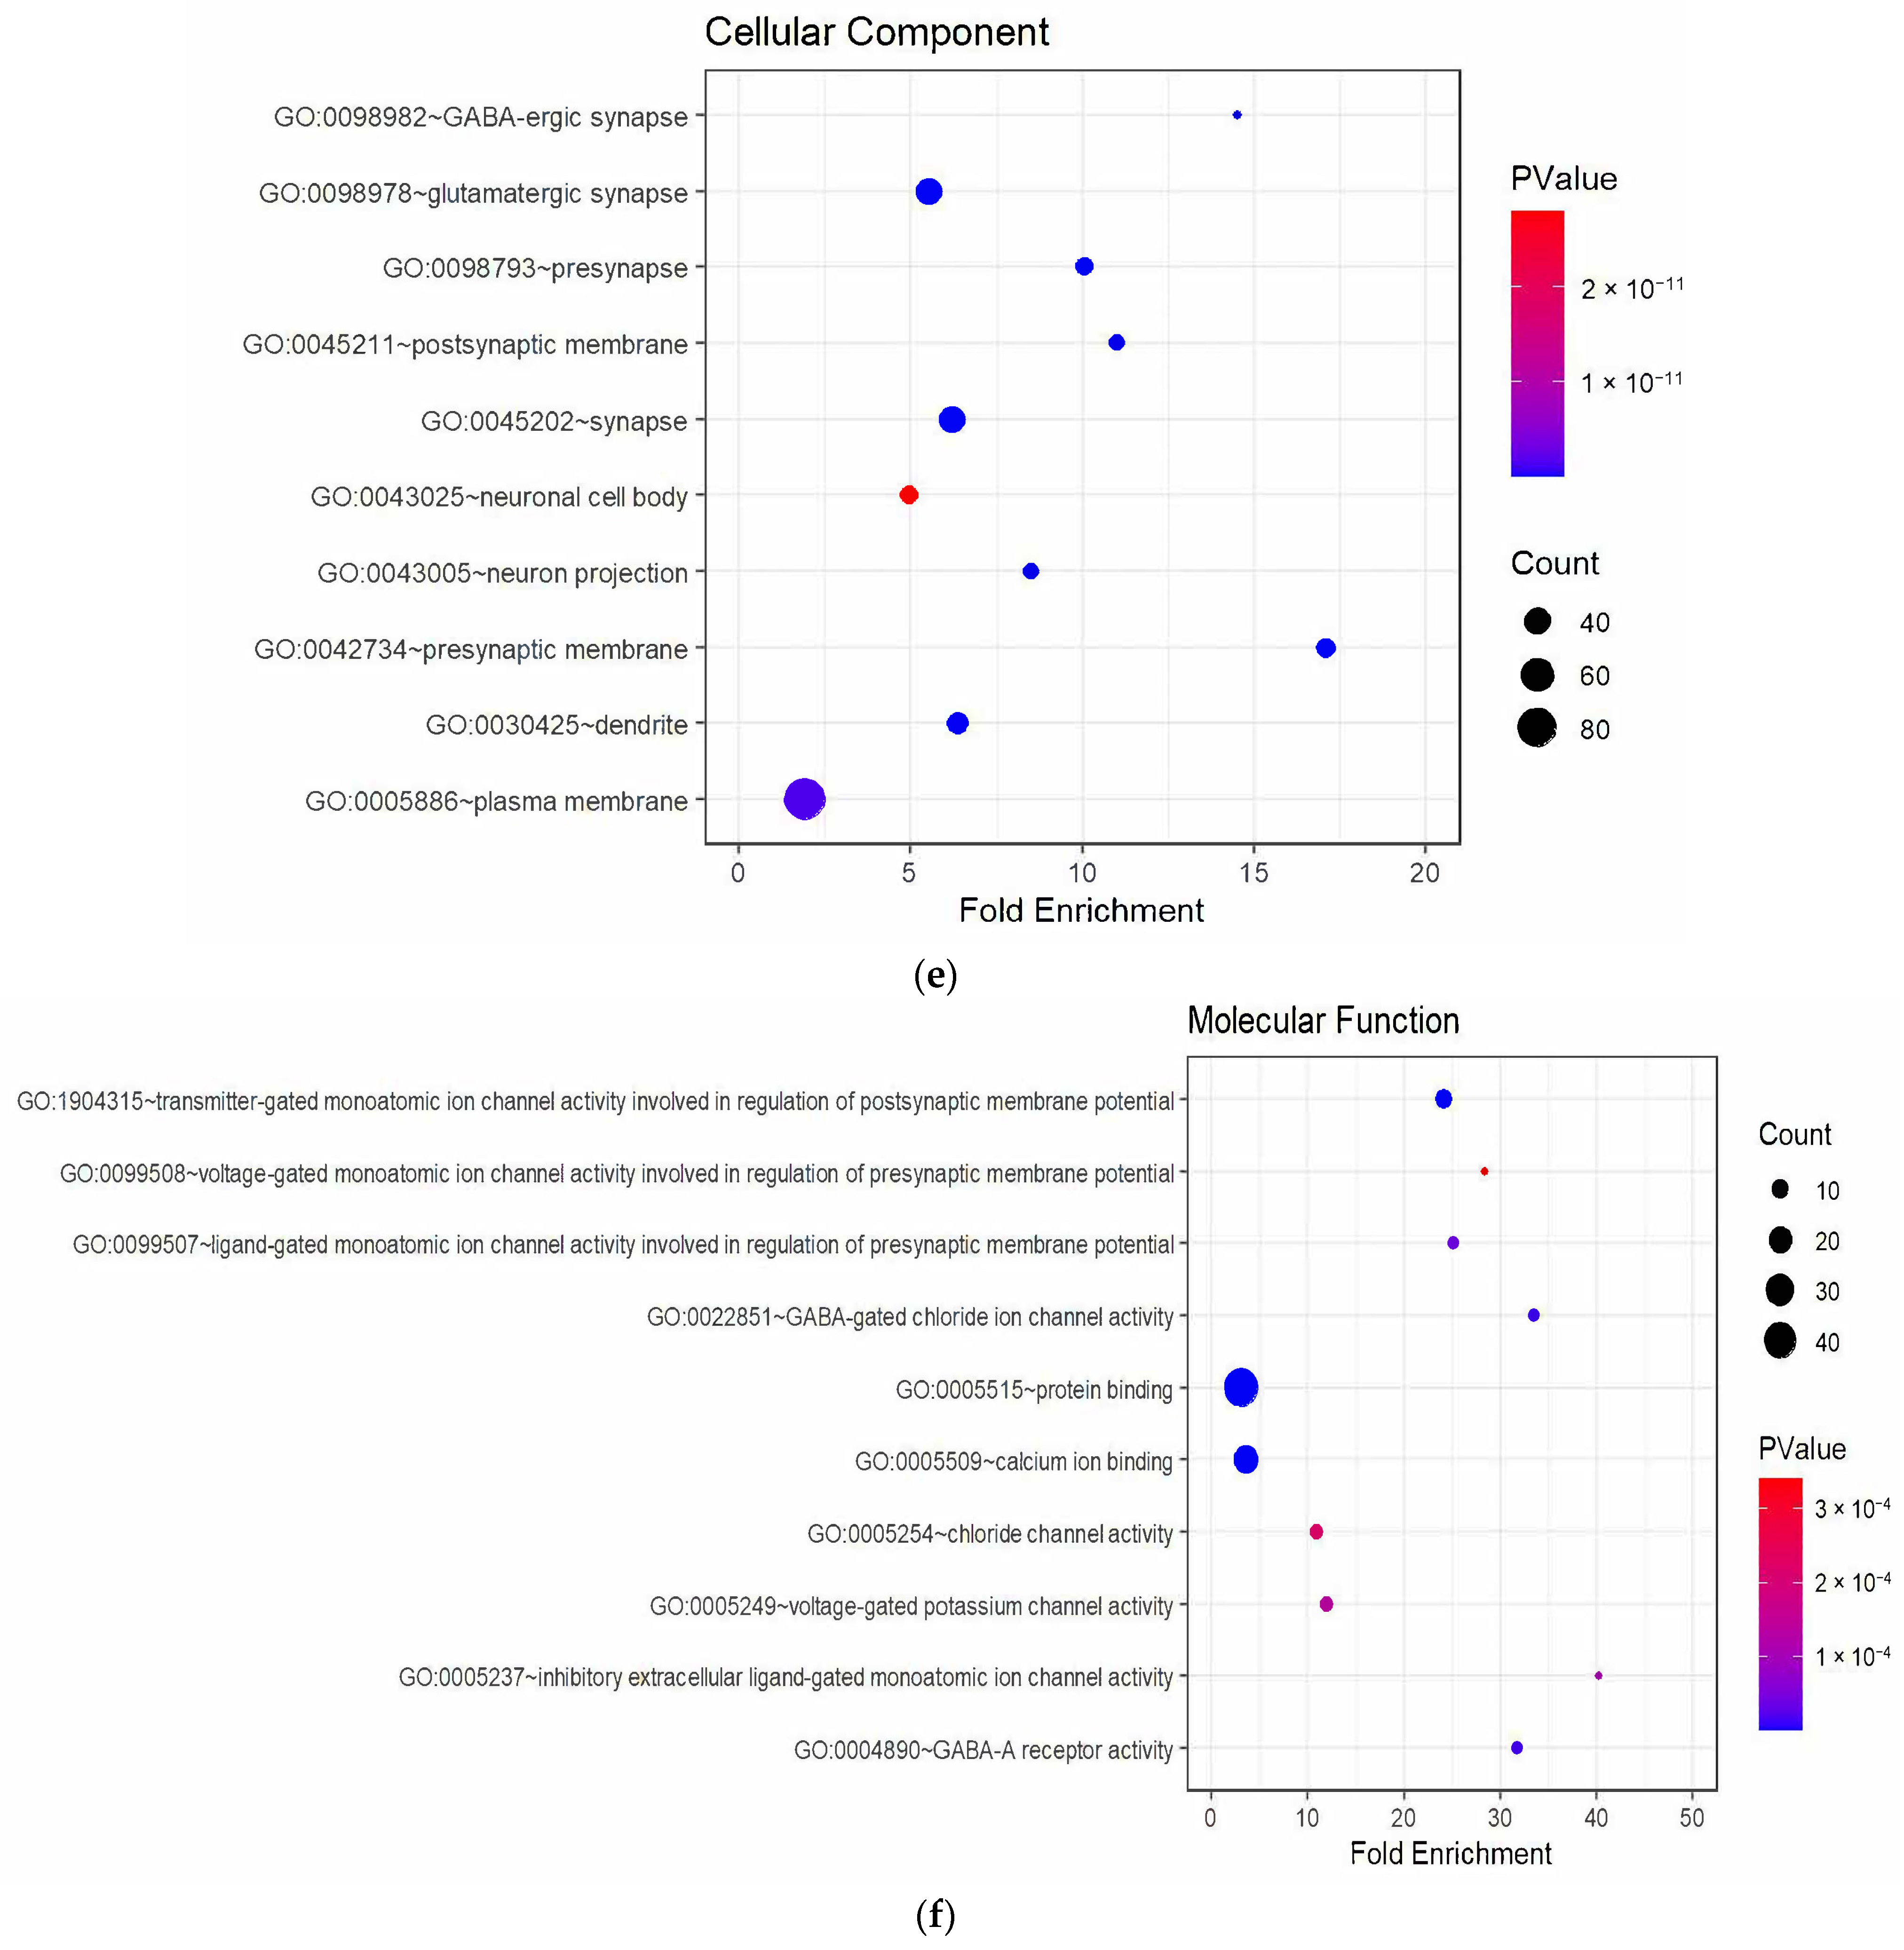
Downregulated genes were also used to identify processes that were affected by SCI. The top enriched biological processes (that is, GO terms that were most affected after injury) included those related to the synapse: synaptic transmission, inhibitory synapse assembly, monoatomic ion transmembrane transport, potassium ion transmembrane transport, and neuronal action potential (Figure 6d and Table S3). The top enriched cellular components also involved those related to the synapse, including the presynaptic membrane, GABAergic synapse, plasma membrane, and glutamatergic synapse (Figure 6e and Table S3). The top enriched molecular functions revolved around channel activity, including inhibitory extracellular ligand-gated monoatomic ion channel activity, GABA-gated chlorine ion channel activity, calcium ion binding, and protein binding (Figure 6f and Table S3).
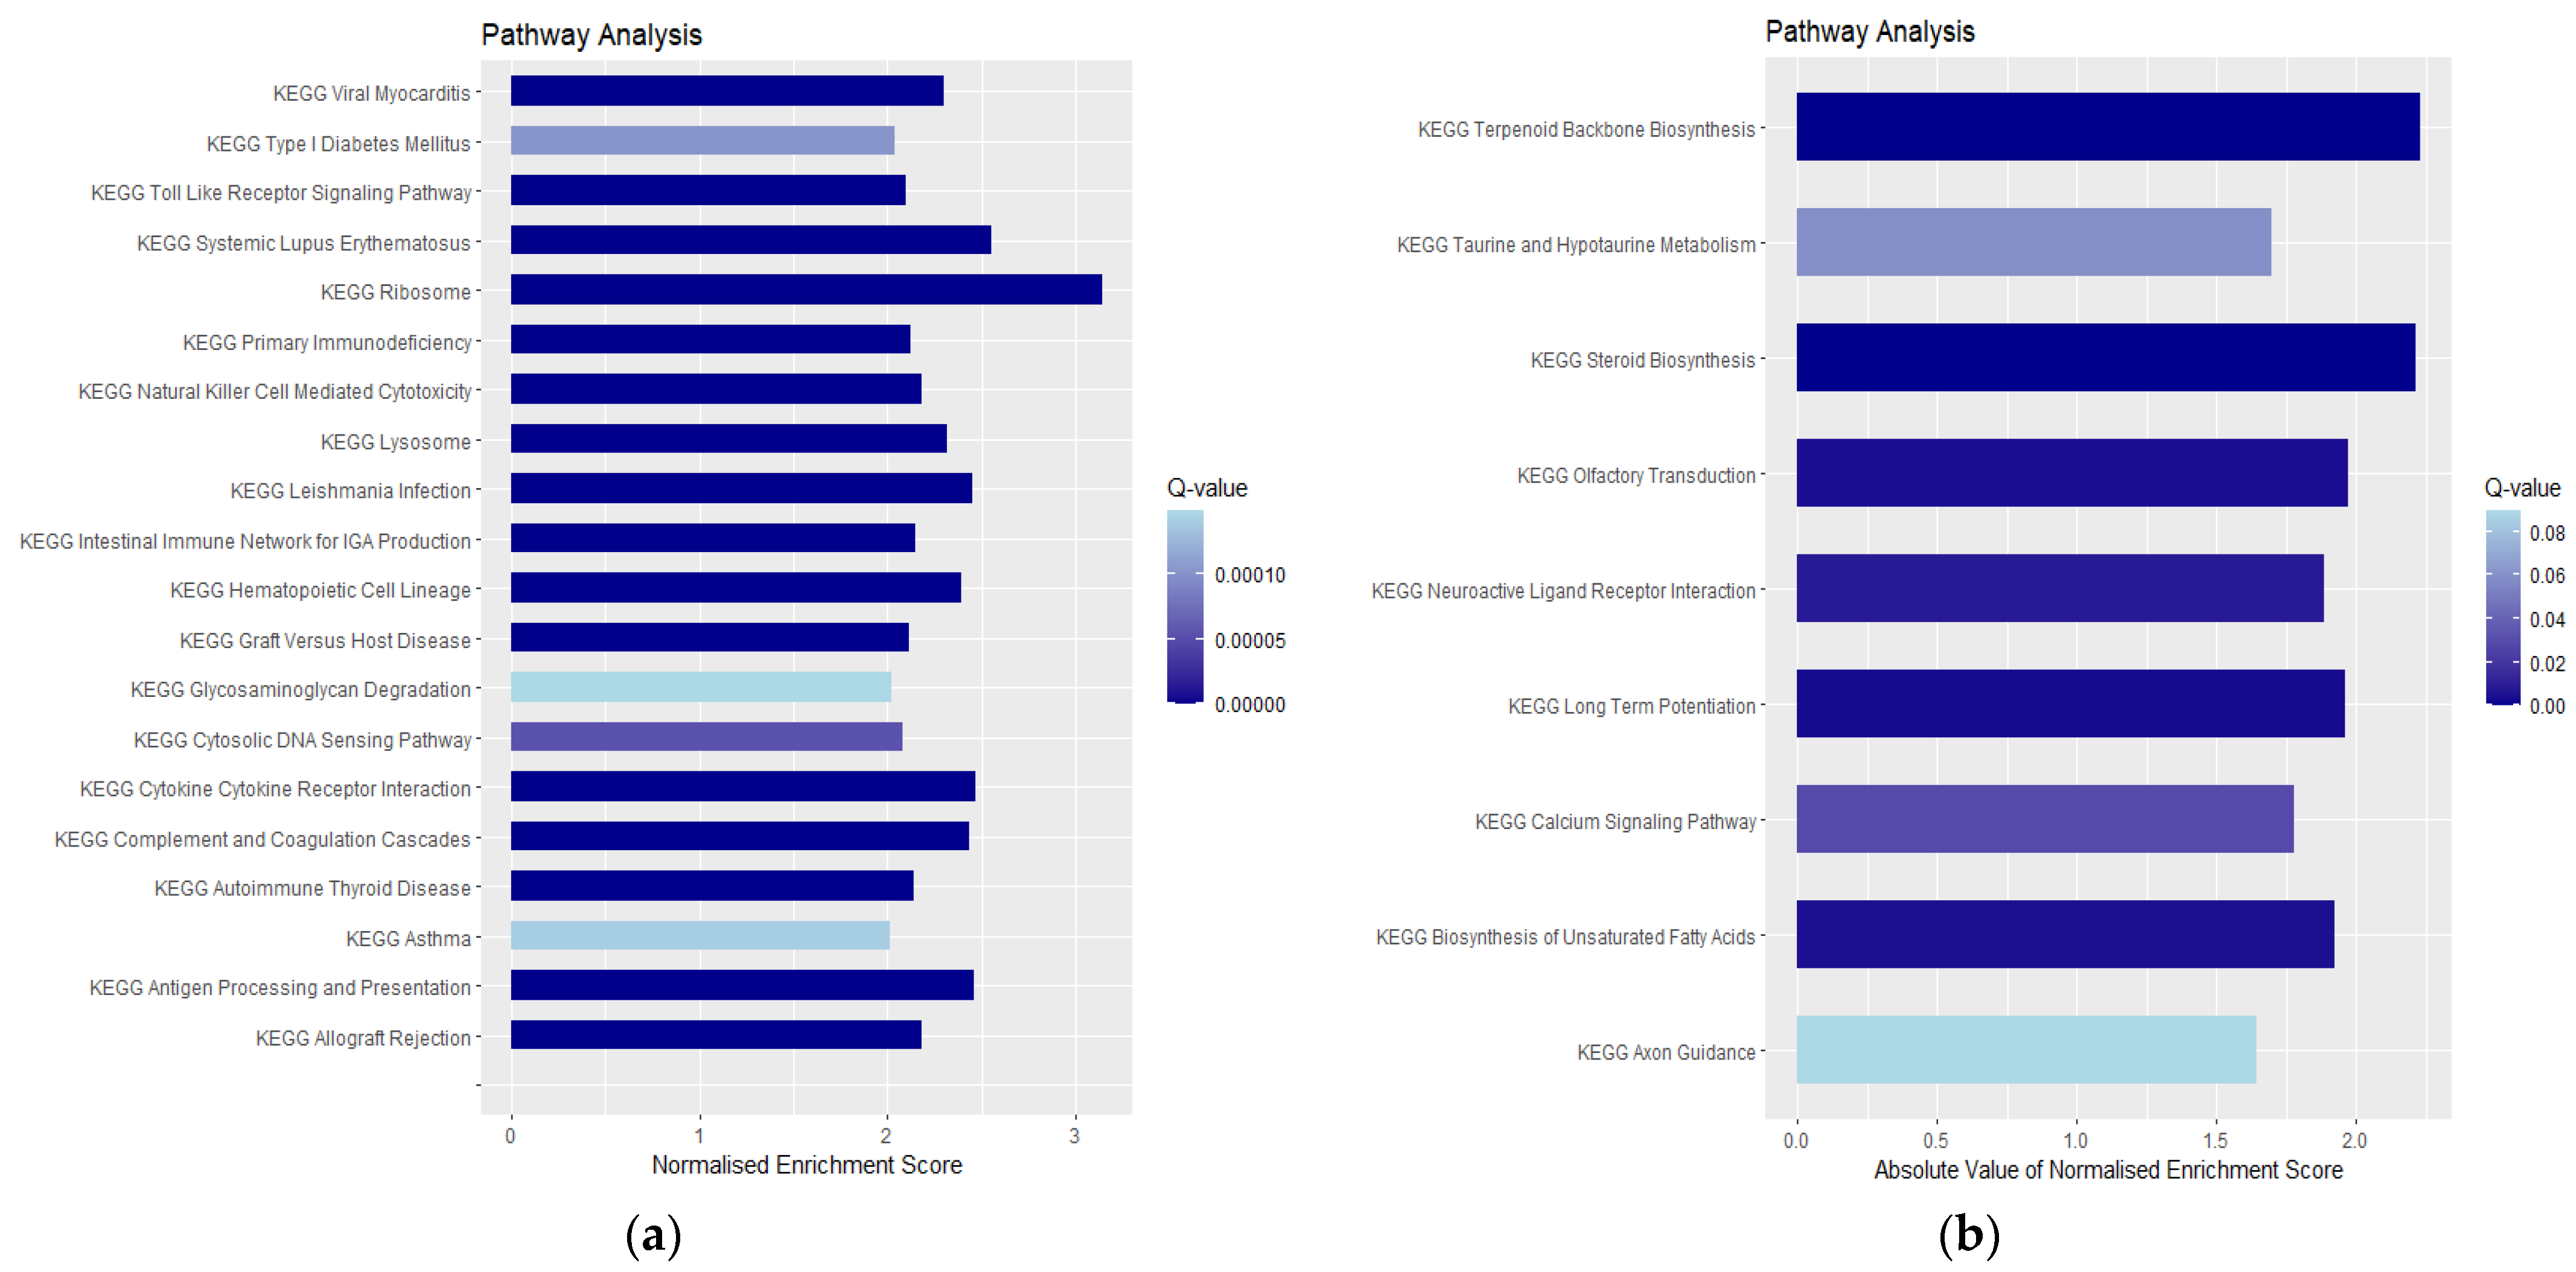
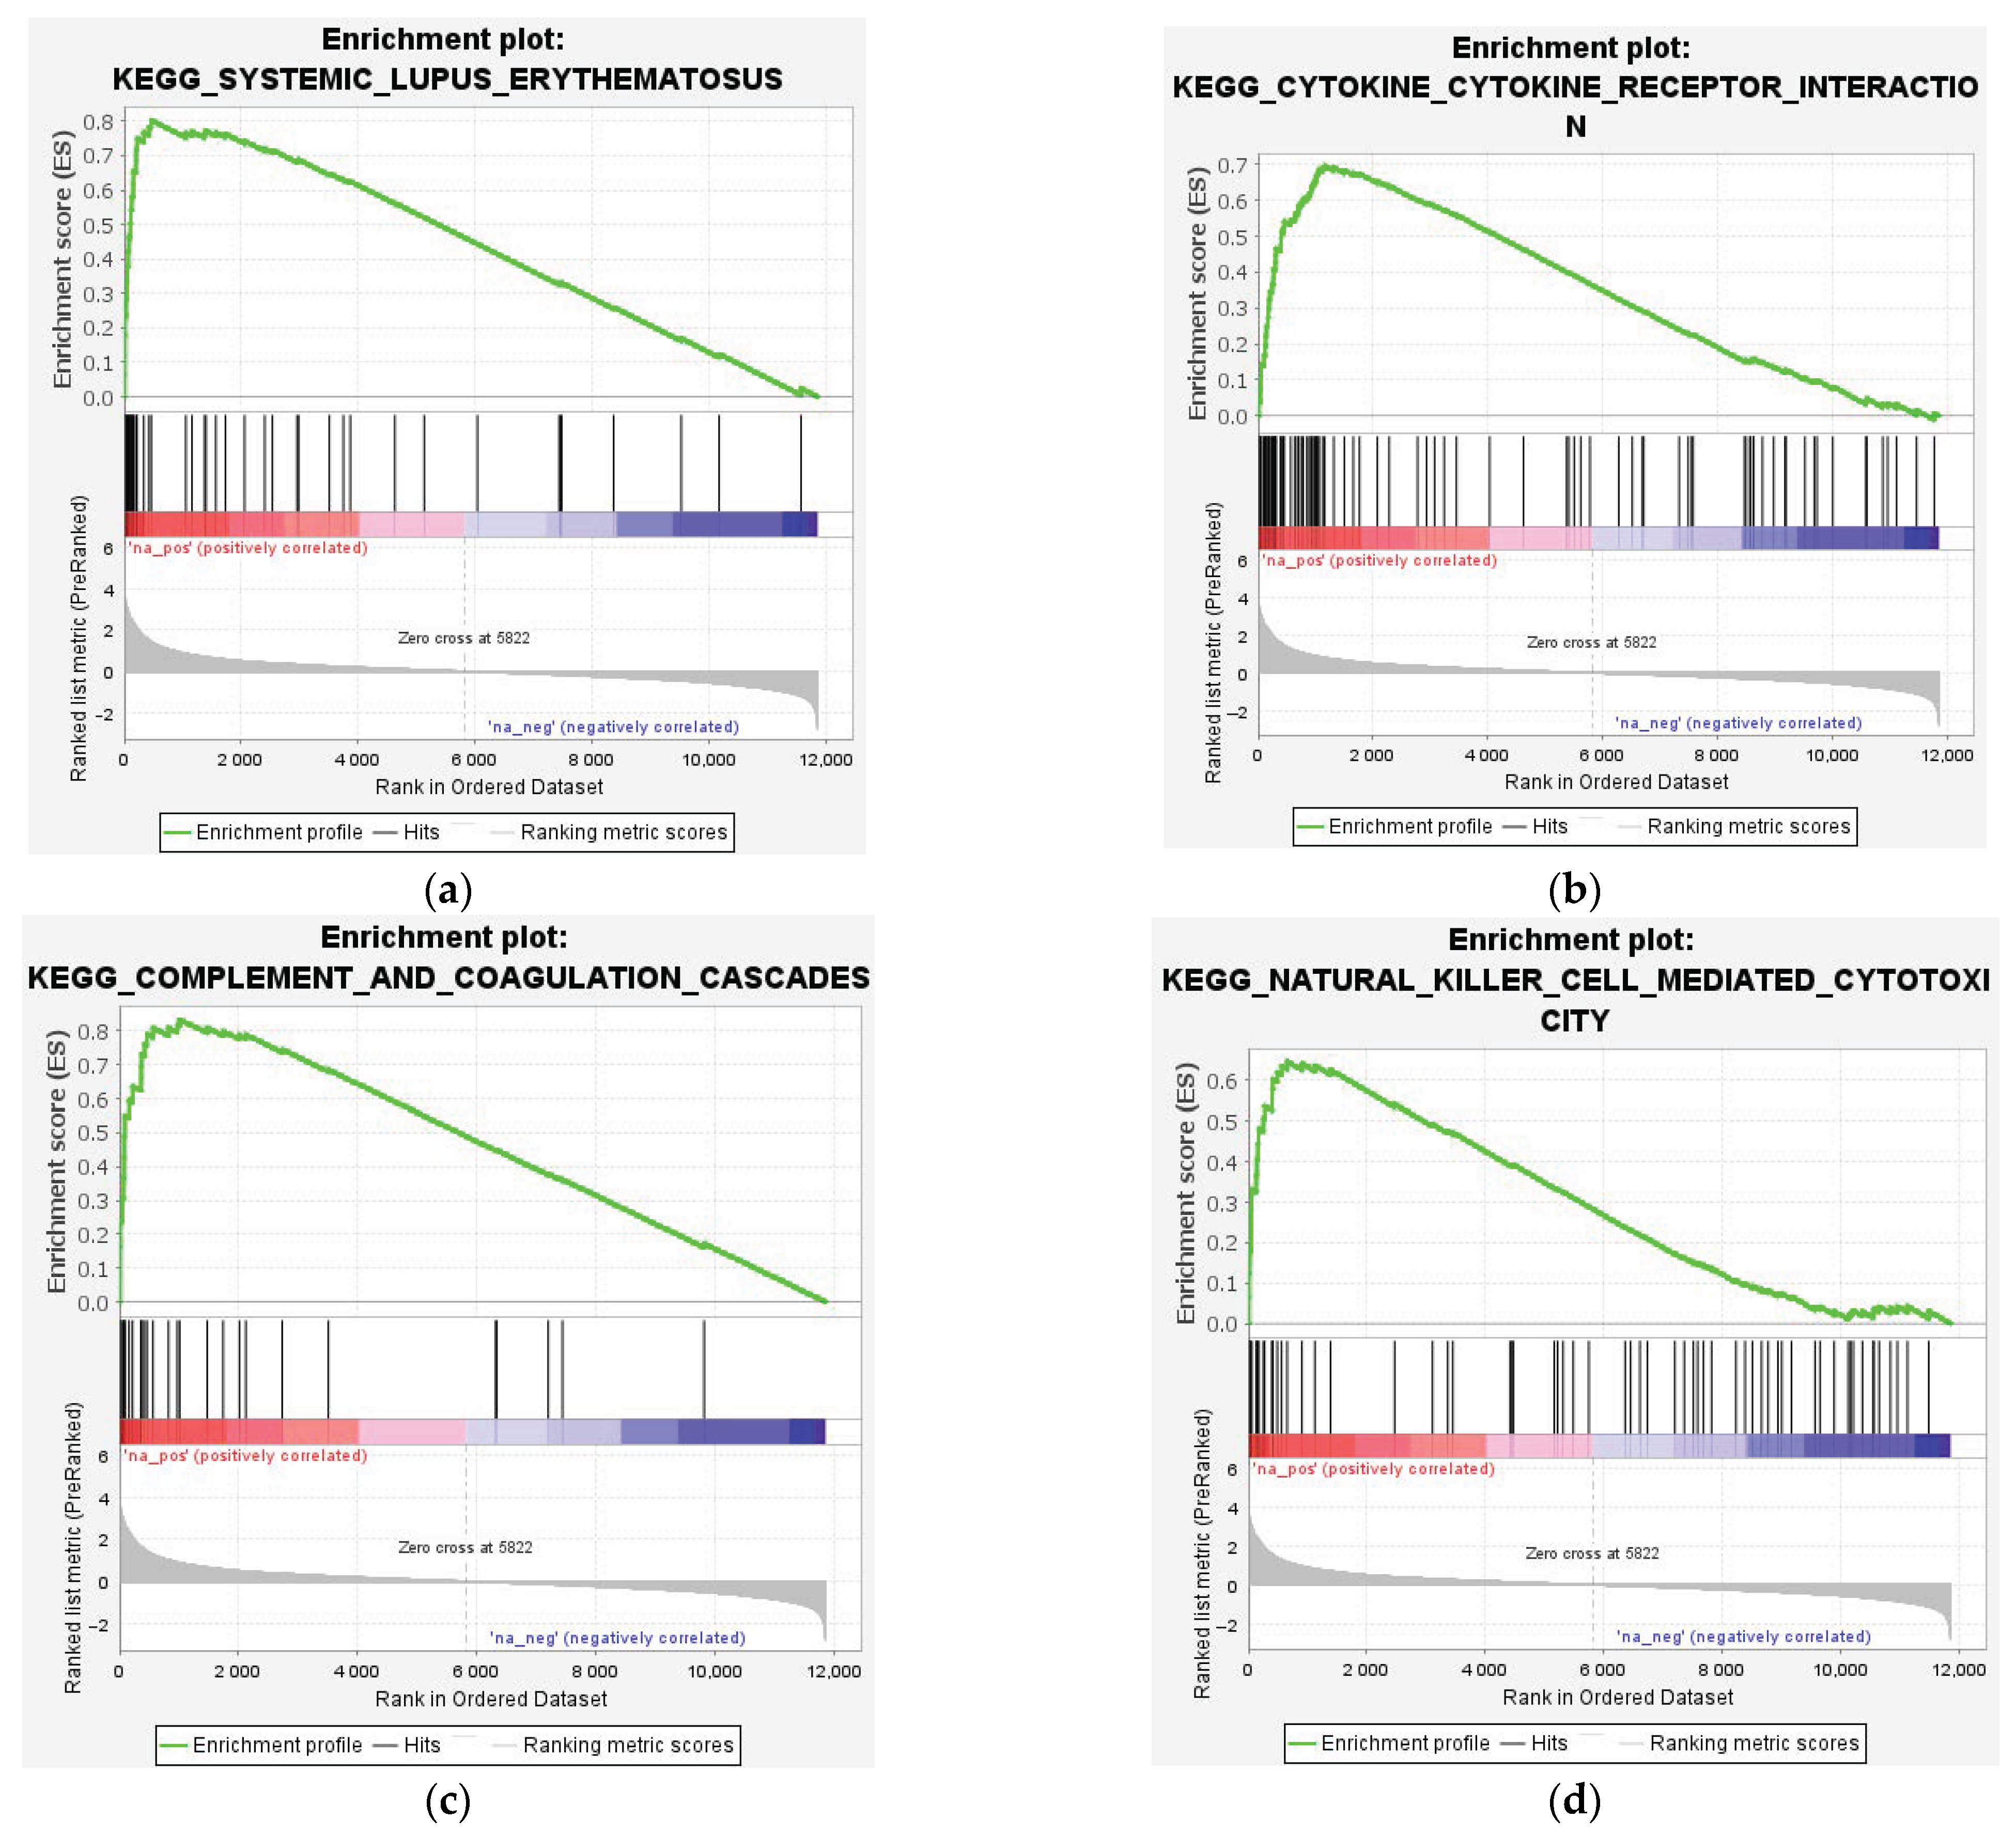
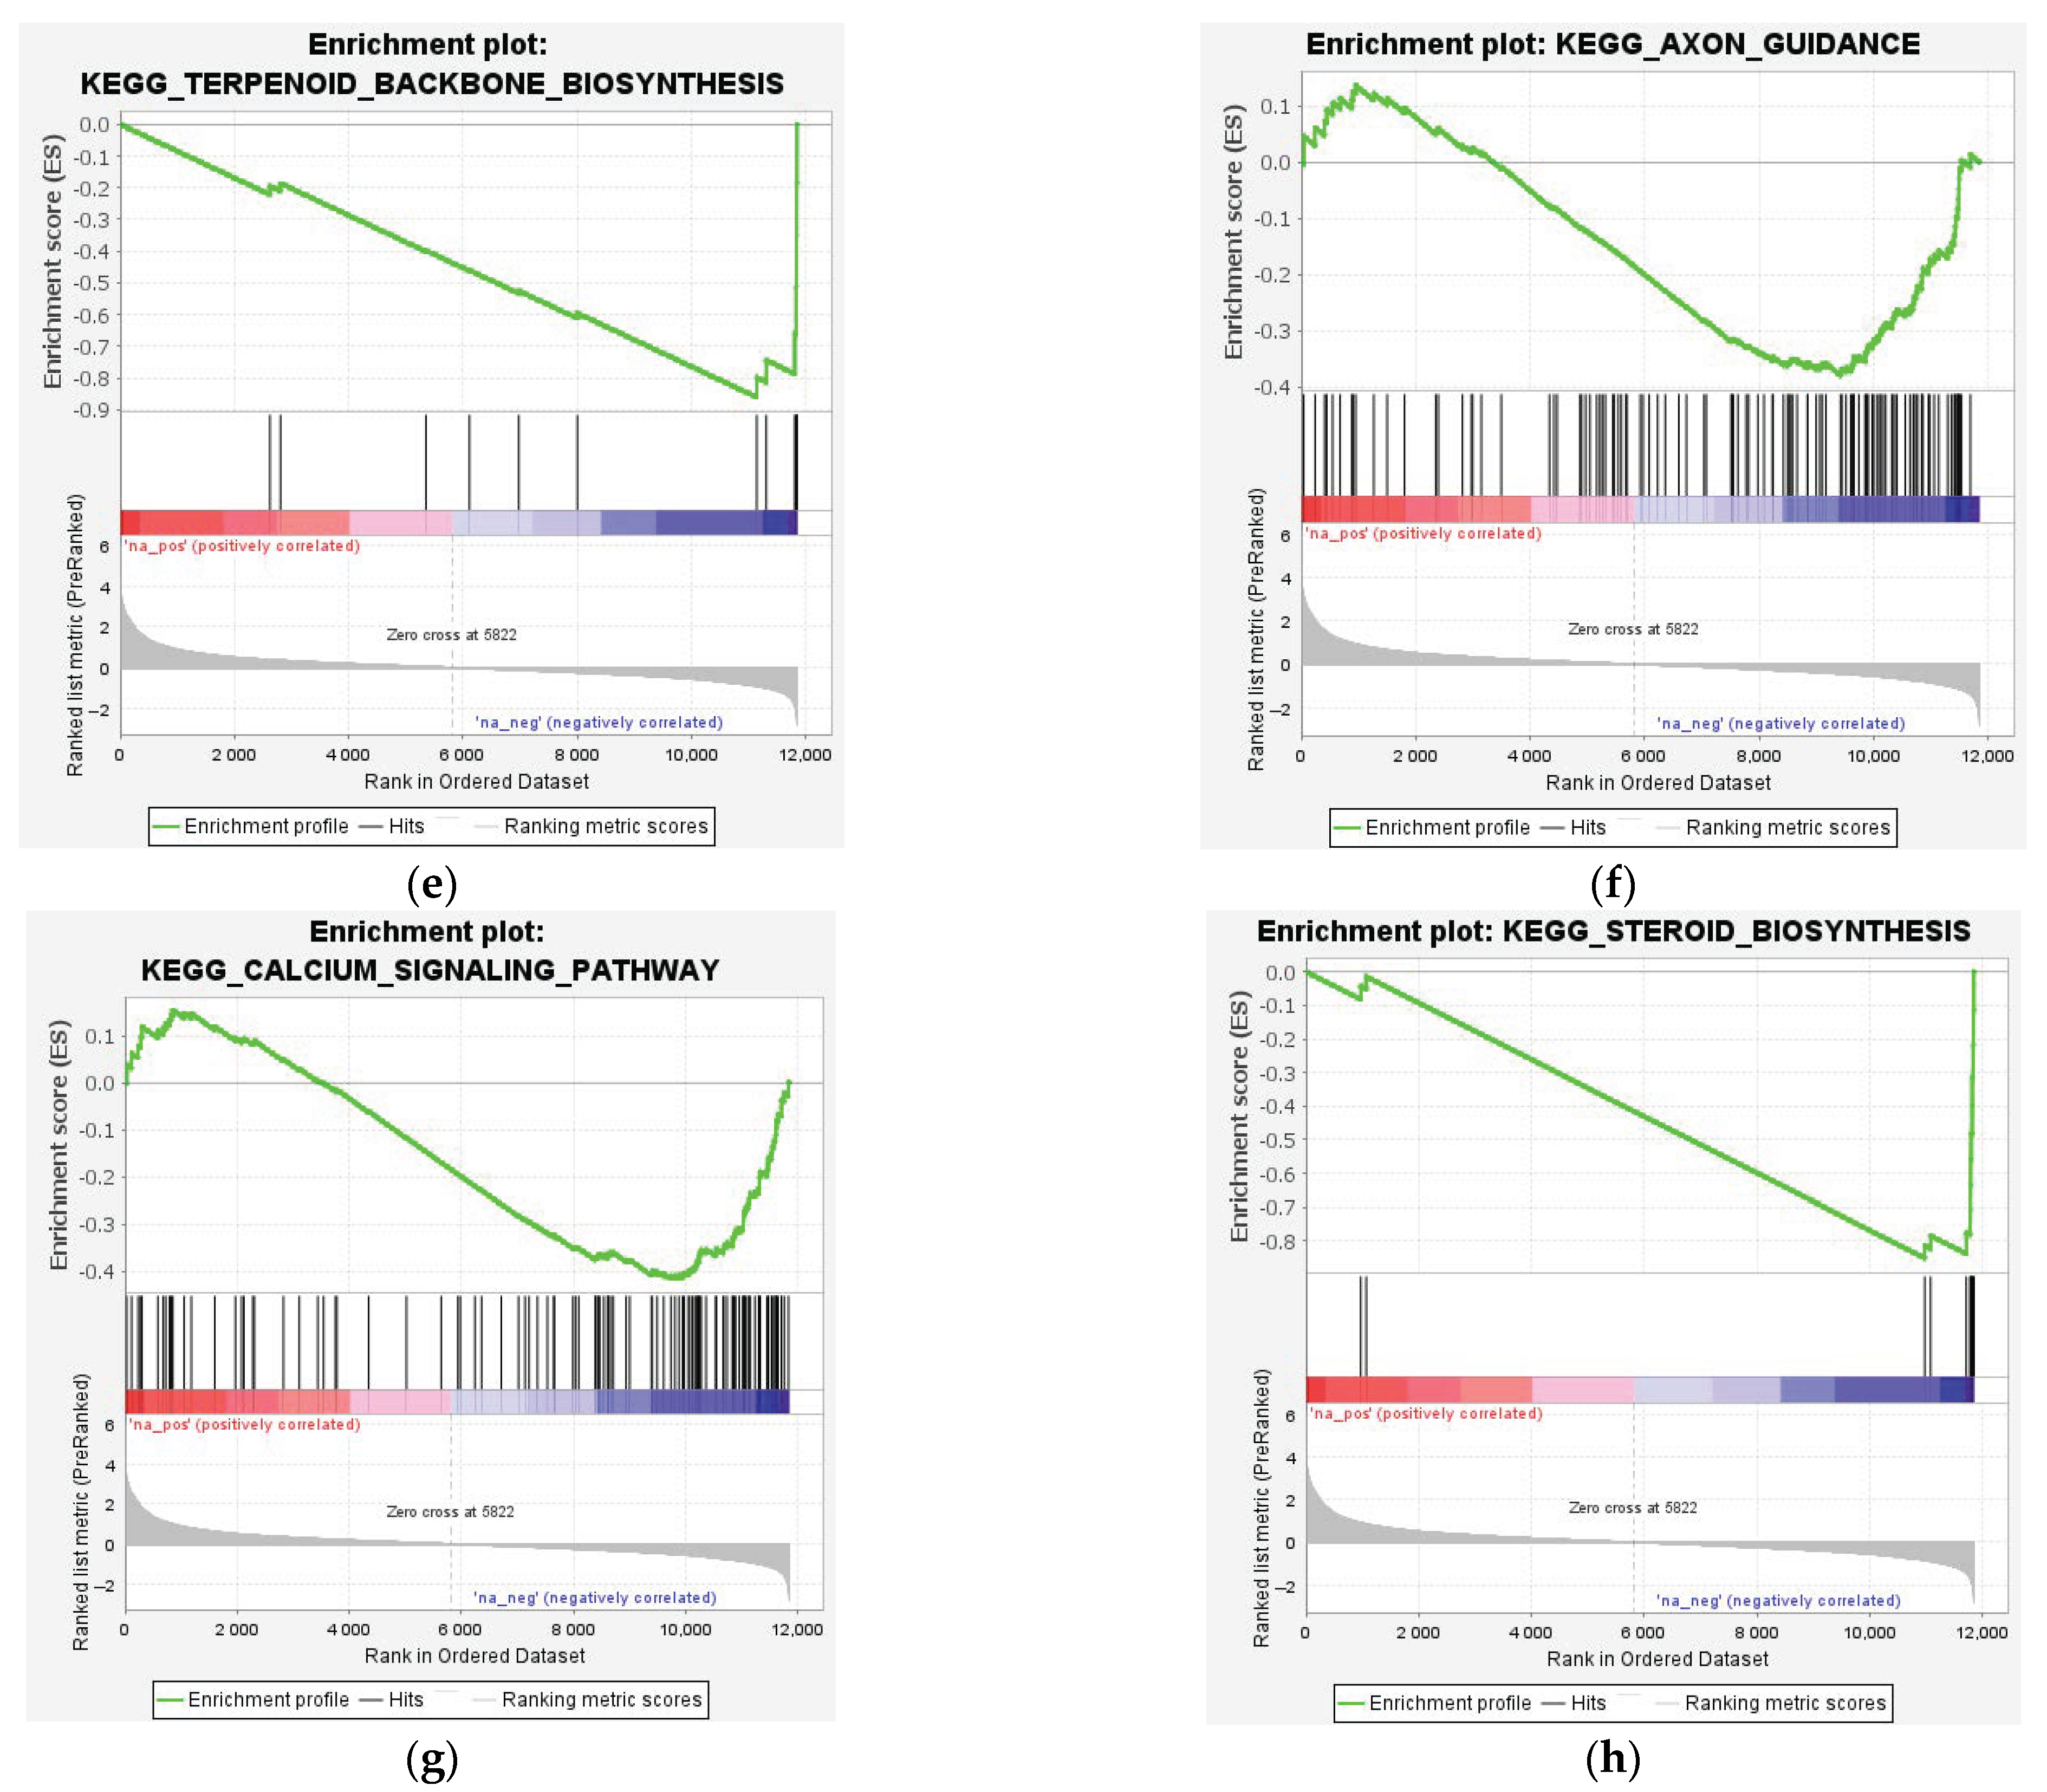
GSEA pathway analysis identified 186 gene sets. 113 gene sets were upregulated and 73 gene sets were downregulated. Upregulated genes were enriched in the ribosome, cytokine–cytokine receptor interaction, lysosome, systemic lupus erythematosus, and complement and coagulation cascades (Figure 7a and Figure 8a–d; Table S4). Specific genes involved in autoimmunity related to these processes, including immunoglobin-involved FCGR2A and complement C1QA, were plotted (Figure 5g,h). Our results point to an enrichment of autoimmune processes after SCI, likely due to the disruption of the blood-spinal cord barrier. The downregulated genes were enriched in calcium signaling, neuroactive ligand–receptor interaction, and the biosynthesis of terpenoid backbones, steroids, and unsaturated fatty acids (Figure 7b and Figure 8e–h; Table S4).

3.4. PPI Interaction Network Analysis

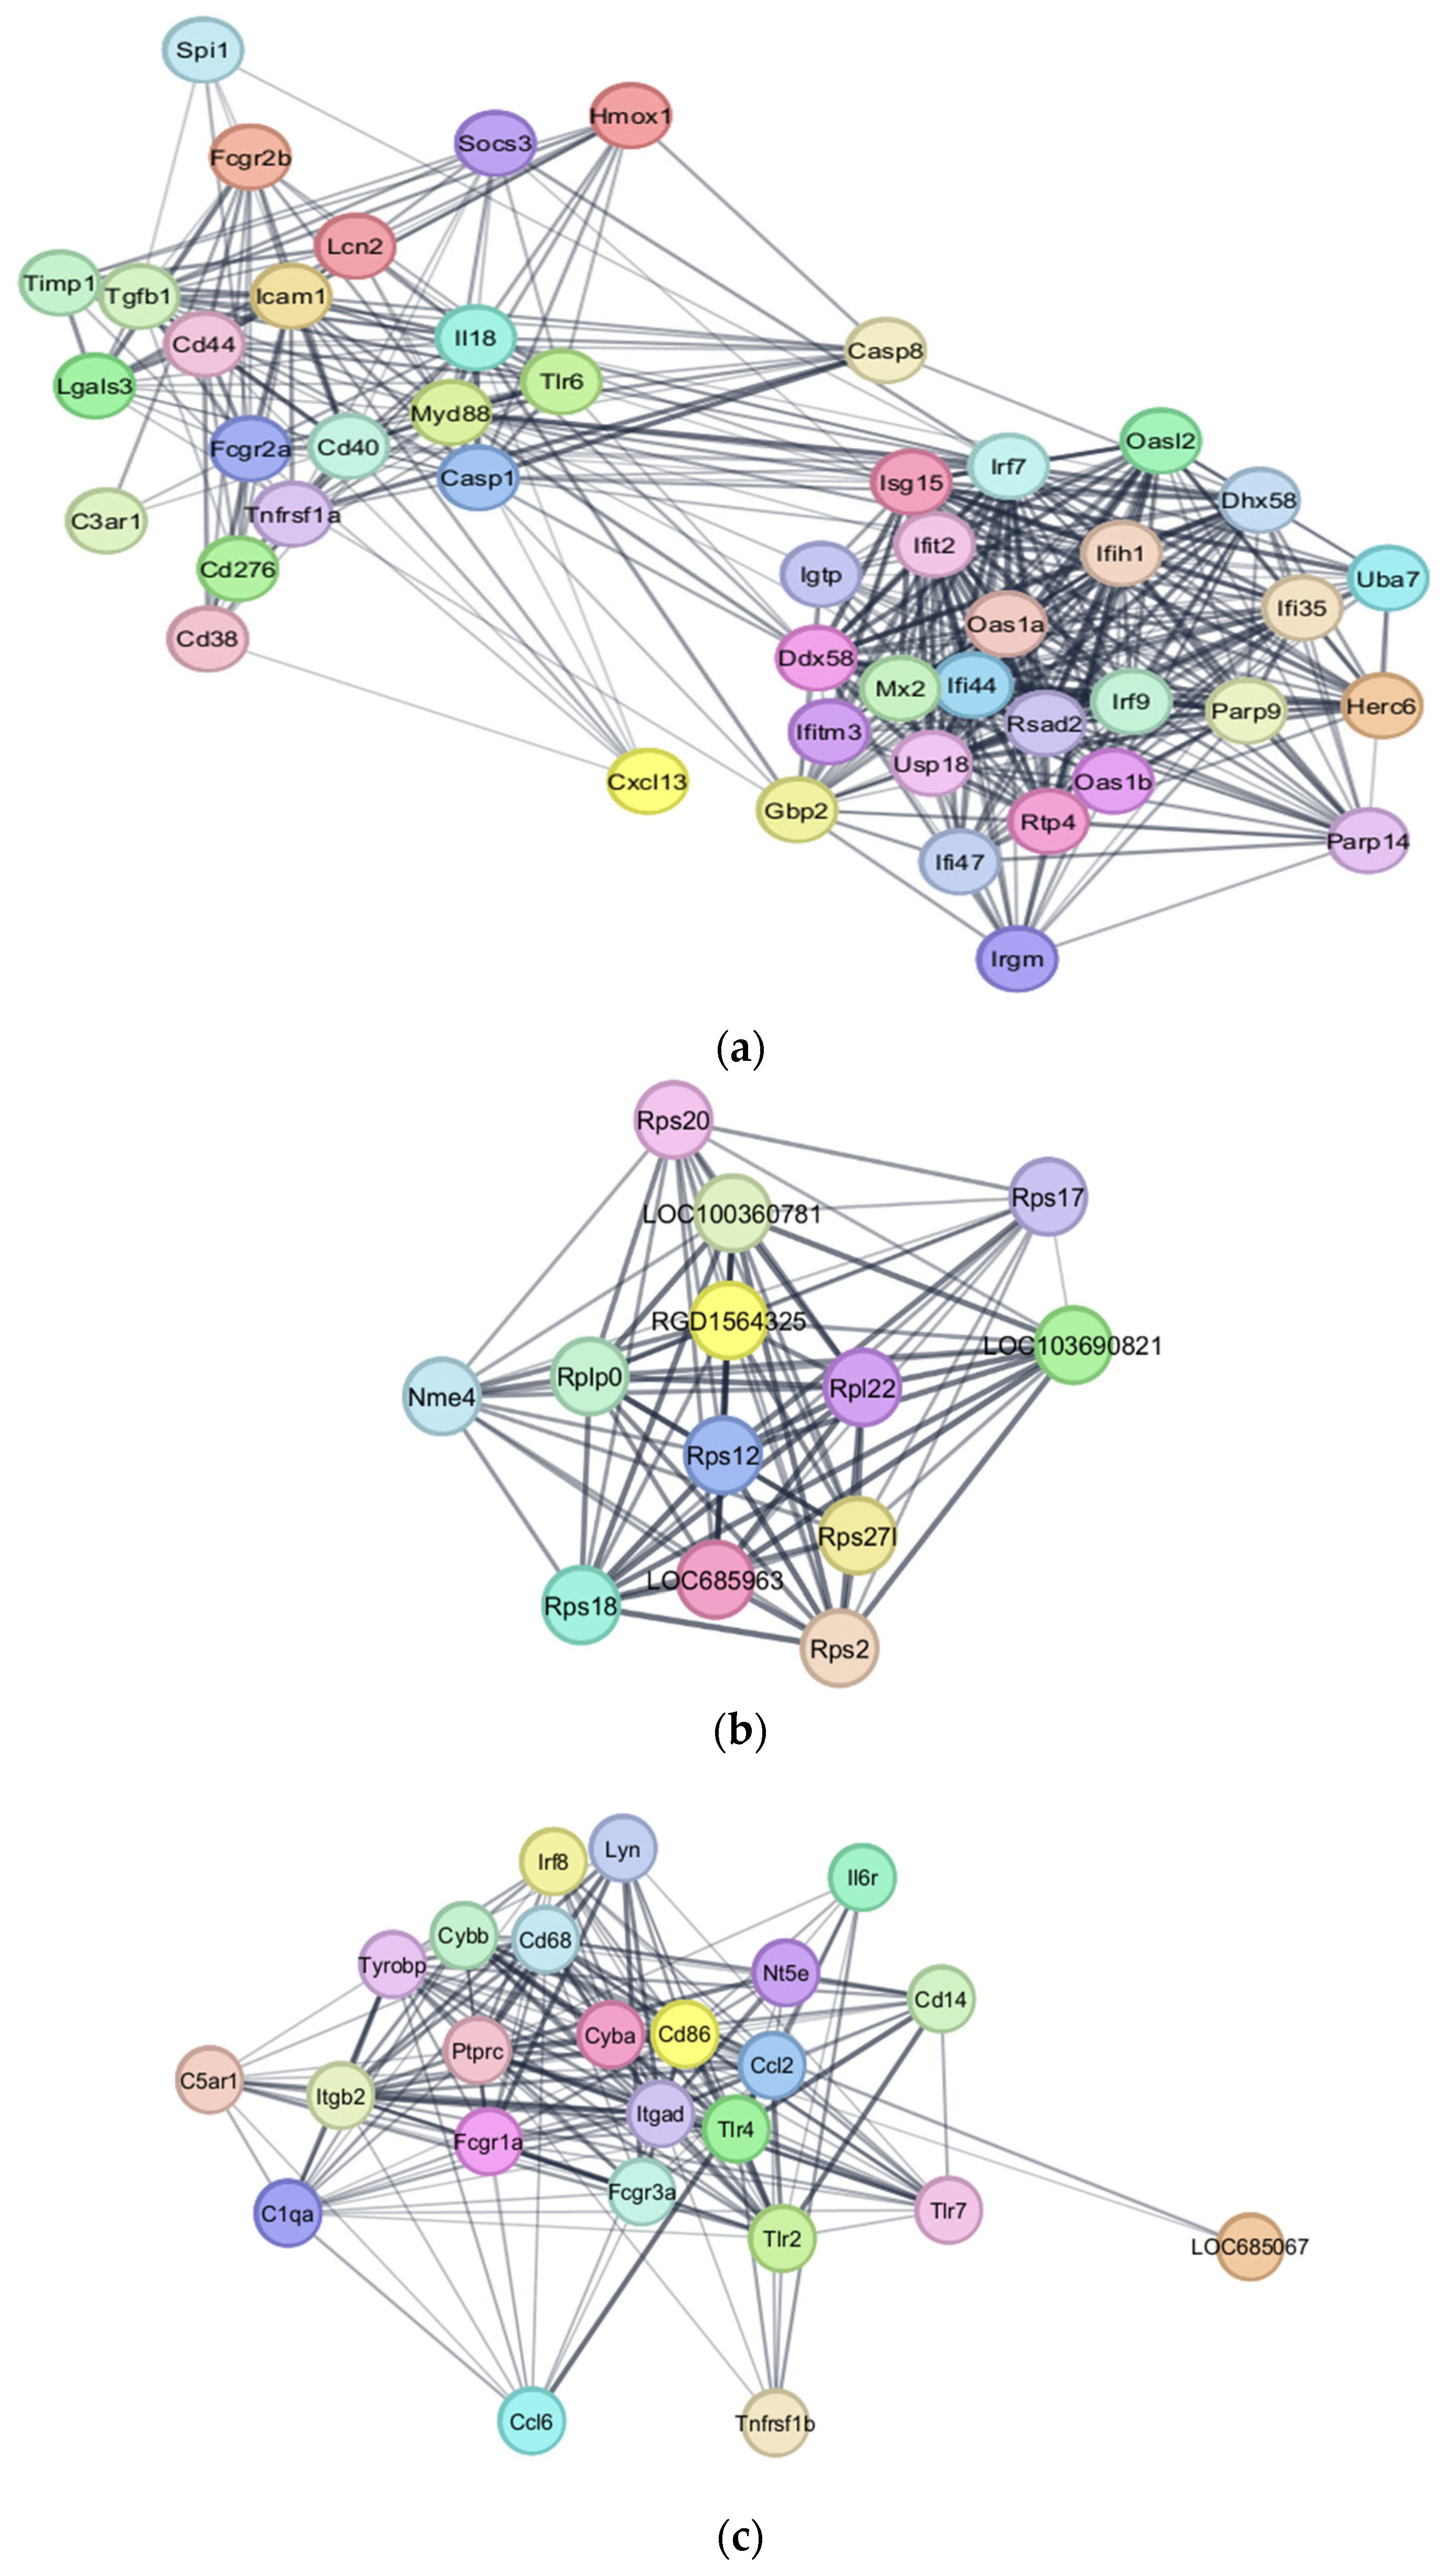
PPI network analysis identified the most inter-connected genes in our DEGs. The top gene clusters in the upregulated group were significant with MCODE scores of 18.696, 15.043, and 13.000. The gene file was input into DAVID to generate their associated KEGG pathways. Cluster 1 genes were associated with the TNF signaling pathway, NF-kappa B signaling pathway, RIG-1-like receptor signaling pathway, and Nod-like receptor signaling pathway (Figure 9a and Table S5a). Cluster 2 genes were associated with neutrophil extracellular trap formation, phagosome, lipid and atherosclerosis, and complement and coagulation cascades (Figure 9b and Table S5a). Cluster 3 genes were associated with ribosome pathways (Figure 9c and Table S5a).
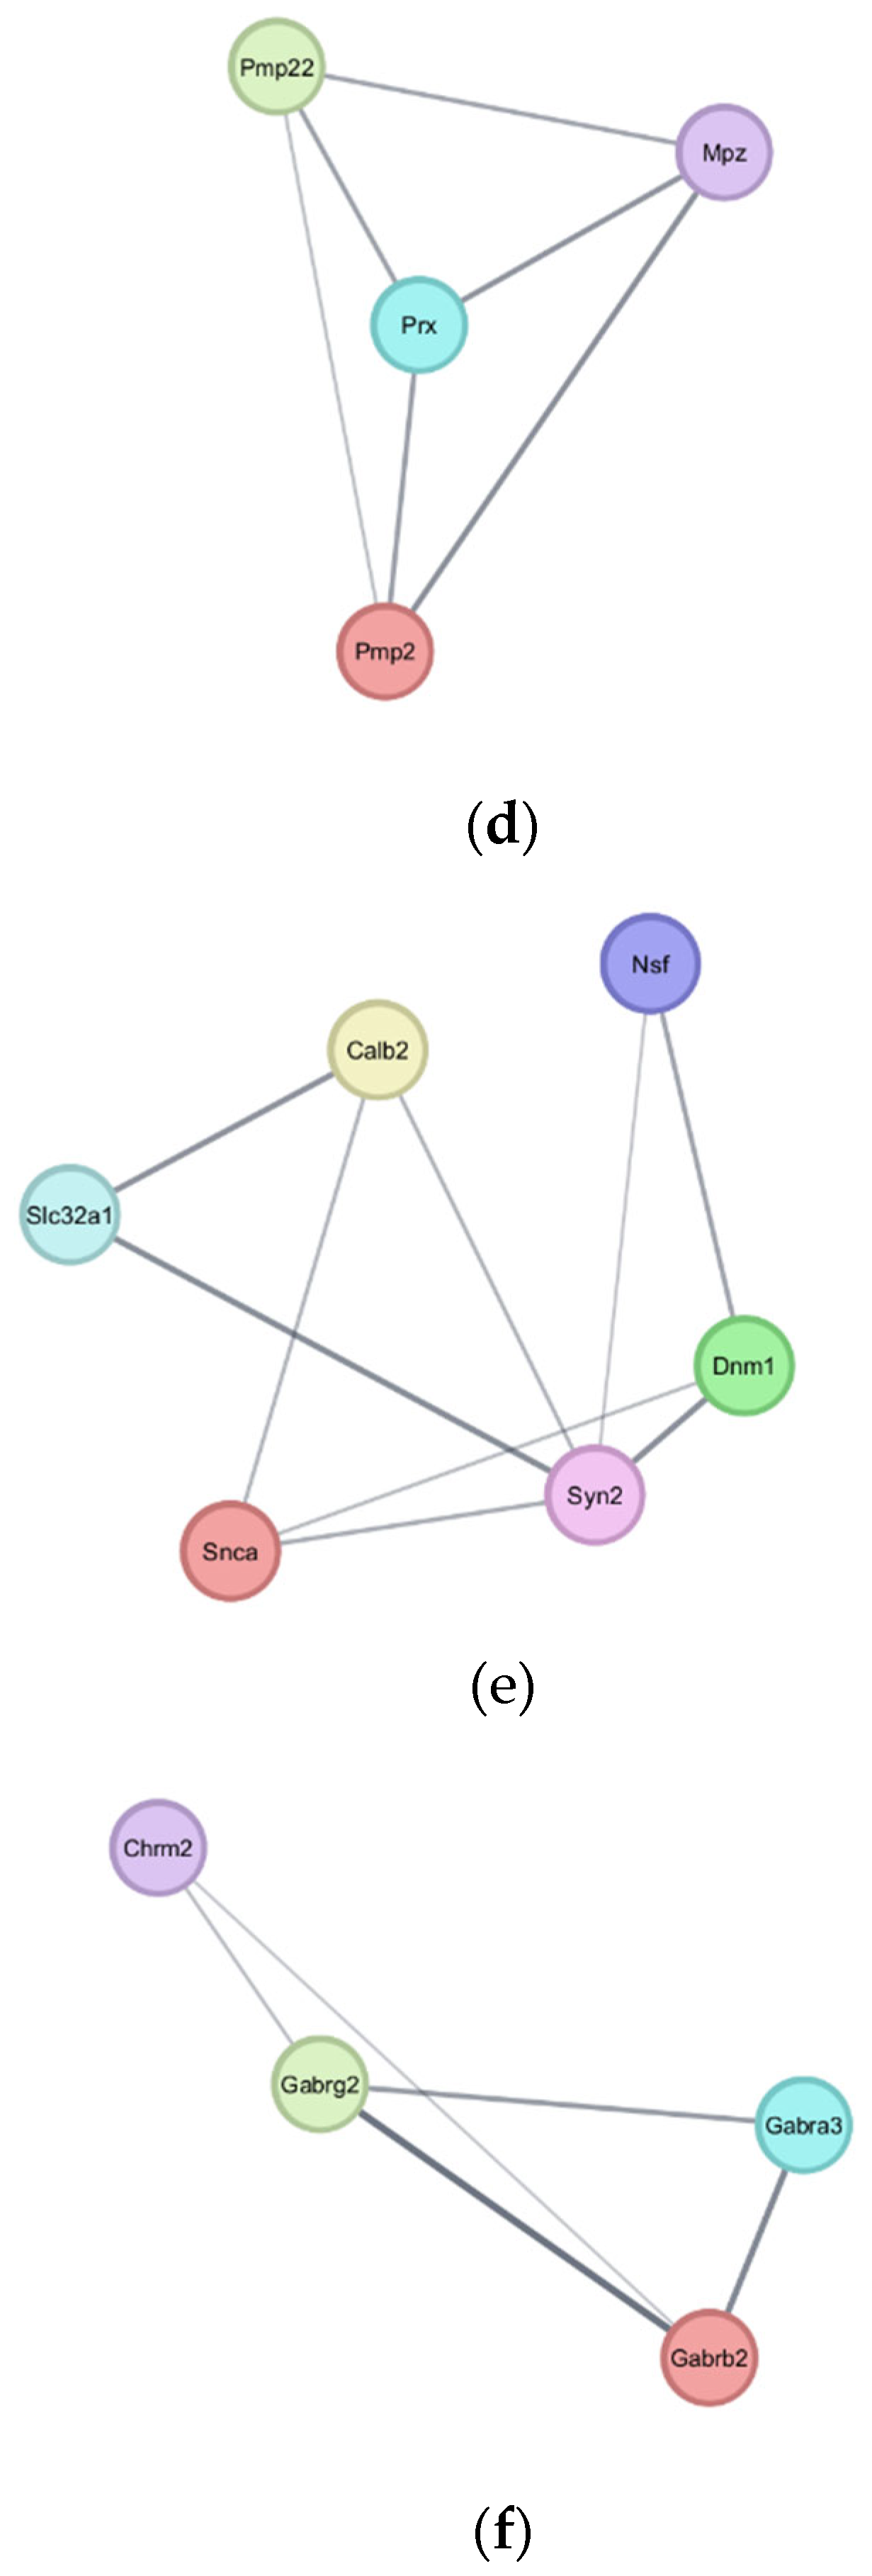
The top gene clusters in the downregulated group were also identified, with MCODE scores of 4.0, 3.6, and 3.33, respectively. However, the first cluster was not statistically significant (Figure 9d). Cluster 2 genes were associated with synaptic vesicle and GABAergic synapse pathways (Figure 9e and Table S5b). Cluster 3 genes were associated with nicotine and morphine addiction, neuroactive ligand–receptor interaction, GABAergic synapse, and retrograde endocannabinoid signaling (Figure 9f and Table S5b).

4. Discussion

In this study, we studied the molecular and cellular pathways involved in SCI through differential gene expression analysis as determined by the temporal expression of total spinal cord mRNA. A total of 12,494 genes were identified in the spinal cords of Ratticus Norvegicus species after data pre-processing. After filtering and quality control were applied, we identified 399 and 196 genes that exhibited significantly sustained upregulation and downregulation at 1 and 21 dpi, respectively. There has been substantial research focused on the identification of upregulated genes following SCI to elucidate potential pathological mechanisms. However, comparatively less attention has been directed toward investigating the downregulated genes in this context. Genes that were significantly downregulated at 1 dpi reveal those that were immediately affected by SCI. However, the host may naturally correct these deficits without the need for any intervention. The genes that were also significantly downregulated at 21 dpi suggest that they are non-temporarily affected by SCI and the host is unable to mount a recovery at the molecular level. Since SCI results in non-temporary neurological deficits, it logically follows that the sustained downregulated DEGs may prove to be useful targets with respect to reversing the negative effects of spinal cord damage. The paired t-test analysis of the sustained downregulated DEGs at 21 dpi versus 1 dpi (Figure 4b) supports this hypothesis as it revealed a statistically significant further downregulation of the genes [t(195) = −5.26, p < 0.001]. This suggests that the significantly downregulated genes will continually decline and fail to mount a regenerative response. Comparatively, the same test performed on the upregulated DEGs shows little deviation of the mean RNA expression between the two groups at 21 dpi and 1 dpi, suggesting that post-injury, the pathological state that ensues remains constant. However, this result is not statistically significant.

4.1. Upregulated Genes and Neuroinflammation

4.1.1. Microglia Activity After SCI

It is well known that following insult to the spinal cord, there is a cascade of neuroinflammation due to the innate immune response that is mediated by cytokines and chemokines released by resident microglia, astrocytes, and peripherally derived immune cells [39]. The DEG with the highest mRNA expression at 21 dpi was CD68 (Table S1). CD68 is a transmembrane glycoprotein highly expressed by cells of the monocyte lineage and tissue macrophages [40]. These cells display both structural and functional heterogeneity that are adaptive within their local microenvironment and can play roles in both physiological and pathological processes, including inflammation and auto-immunity [40,41]. Microglia are a subset of tissue macrophages that populate the central nervous system and are the main effectors of the inflammatory response after SCI in addition to macrophages derived from the peripheral circulation due to homeostatic insult [42]. Macrophages have historically been described to exist in two states, resting and activated [43]. Activated macrophages are broadly classified into two main groups; classically activated M1 and alternatively activated M2 [44]. In the CNS M1 macrophages are thought to be neural destructive, and M2 macrophages are thought to be neural protective [43,45]. However, macrophage reactivity is not binary, and intermediate morphologies that exist on a continuum complicate our understanding of their dual role in both inflammation and recovery [46]. Furthermore, peripheral macrophages are difficult to distinguish from microglia by immunohistology and antigenic markers alone [42]. Nonetheless, it has been shown that macrophage/microglia anti-inflammatory cytokines are prominent at 1-week post-injury and pro-inflammatory effects persist after 1 week for up to months [47].
CCL2 exhibited the highest mRNA expression in the acute phase of injury 1 dpi in our model (Figure 5f). CCL2 is released by resident astrocytes to activate microglia, which contributes to the perpetual formation of the glial scar, which consists of peripheral monocytes, reactive microglia, and a dense astrocytic scar border. The role of the glial scar is controversial. Destruction of the glial scar has been shown to worsen locomotor outcomes and aggravate neuroinflammation [48]. However, it is also a physical barrier to axon regeneration. One study showed that the reduction of CCL2-recruited microglia at the site of injury led to remarkably improved locomotor function in rats [49]. It is likely that the interaction of CCL2 and CCR2 could activate several signaling cascades, including PI3K/Akt/ERK/NF-κB, PI3K/MAPKs, and JAK/STAT-1/STAT-3, contributing to SCI pathogenesis [50].
Lipocalin 2, also known as neutrophil gelatinase-associated lipocalin (LCN2), also exhibited a significant mRNA expression at 1 dpi. LCN2 has diverse functions and is important for both cellular apoptosis and survival. It is widely expressed in microglia and its expression has been shown to be strongly enhanced by inflammatory stimulation [51]. Its role in microglia is largely considered to be proapoptotic, acting in an autocrine manner to induce amoeboid transformation of microglia rendering vulnerability to other apoptotic signals. Tong et al. demonstrated that induction of LCN2 does indeed correlate with apoptosis; however, they concluded that it is also a survival factor against toxic stimuli [52]. One study demonstrated suppression of LCN2 inhibited the activation of neurotoxic microglia and astrocytes [53].

4.1.2. Microglia and the Complement System

Emerging research has identified CD68 and complement C1q as potential markers for the identification of reactive microglia in the CNS [54]. C1q expression in resting microglia is often low, however, increases dramatically in reactive microglia [55]. We confirmed this as expressions of C1QA, C1QB, and C1QC were among the highest DEGs in our analysis 21 dpi and the complement pathway has been identified in both KEGG analysis and protein association networks (Figure 5g, Figure 7a and Figure 8c). C1QA, C1QB, and C1QC encode for the respective chains of the C1q protein, which is organized into six heterotrimeric subunits. Expression of C1q has also been found to remain high after blood-brain-barrier (BBB) dysfunction is restored in a BBB breakdown rat model [55]. Complement and coagulation cascades were an upregulated KEGG pathway as well as played a significant role in our protein network analysis, suggesting that both prolonged microglia/macrophage reactivity and its synergism with complement activation are imperative to the mechanisms of sustained injury in SCI pathology.

4.1.3. Tumor Necrosis Factor and Associated Pathways

The role of tumor necrosis factor α (TNF-α) has been widely studied. Within hours of SCI, local immune cells release inflammatory cytokines IL-1, IL-6, and TNF that are all upregulated and continue to be over 14 dpi [56]. Among the top enriched biological processes in our study were positive regulation of tumor necrosis factor production, innate immune response, and inflammatory response. TNF was not identified as a DEG and was removed by the filtering process as its mRNA expression levels did not meet average FPKM cutoff requirements, although log fold changes were significant >1 (Figure 5d). TNFAIP6, TNFRSF1B, and TNFRSF1A are genes that are regulated by TNF-α that have been identified as DEGs. TSG-6 is the protein product of TNFAIP6 that is upregulated after inflammation and participates in the negative regulation of inflammatory response, generally exhibiting tissue-protective properties, but has at times been correlated with disease pathology [57]. Within the CNS, TSG-6 is up-regulated after injury and binds to hyaluronan (HA) to form an HA-rich glial scar that coalesces at the site of primary injury, contributing to an immunosuppressive environment [58,59]. The change in expression of TNFRSF1A was higher than TNFRSF1B expression at one day post-injury however was slightly lower at twenty-one days post-injury (Figure 5e). TNFRSF1A encodes for the TNFR1, a death domain-containing receptor, and its activation leads to both apoptosis and necroptosis, whereas TNFR2, encoded by TNFRSF1B, promotes cell survival [60]. TNFR1 is expressed ubiquitously in all cells, while TNFR2 is found in neurons, oligodendrocytes, regulatory T cells, and monocytes [61]. TNFR2 can protect neurons and oligodendrocytes against neurotoxic insults in vitro, while TNFR1 promotes neurotoxicity and exacerbates axonal damage through pro-inflammatory effects in vitro [62].

4.2. Autoimmunity and Immune Dysregulation

Several pathways the analysis has identified include those associated with immune dysregulation and autoimmune disorders, including systemic lupus erythematosus (Figure 7a and Figure 8a). The top enriched molecular functions included IgG binding and IgG receptor activity (Figure 6c). Previous studies have highlighted the complex co-existence of both immune dysregulation and autoimmunity after SCI [63]. Thus, SCI can be characterized by a low-grade inflammatory state due to the bidirectional communication between the nervous, endocrine, and immune systems [64]. Furthermore, the immune system is under neuro-modulatory control via the innervation of lymphoid tissues by the sympathetic nervous system, and SCI would expect to induce level-dependent immune suppression due to the disruption of sympathetic neurons [65]. Traumatic SCI damages the blood–brain–spinal cord barrier and exposes the spine parenchyma to the cells of the adaptive immune system. Foreign CNS antigens can then trigger autoimmune responses, and the production of autoantibodies has been shown to worsen pathology within the spinal cord, with pathological mechanisms comparable to multiple sclerosis [66].

Fc-γ Receptors and Autoantibody Production

Ankeny and his colleagues first demonstrated that SCI induces chronic systemic and intraspinal B cell activation with a systemic, lupus-like autoimmune response [67]. Systemic lupus erythematosus (SLE) is characterized by an aberrant immune response leading to autoantibody production and autoreactive lymphocytes that contribute to the activation of innate immune cells via Fc-γ receptor along with complement fixation [68]. Fc-γ receptors are encoded in humans by the FCGR family of genes, and bind to the Fc portion of IgG, serving as a crucial link between humoral and cell-mediated immune responses [69]. Interestingly, genes FCGR2B, FCGR2A, FCGR3A, and FCGR1A were among the upregulated genes identified in the analysis (Figure 5h; Table S1). The Fc-γ receptor IIb is the only inhibitory Fc-γ receptor [70]. Our analysis showed a greater than 3- and 4-fold change in FCGR2B and FCGR2A expression at 1 and 21 dpi, respectively. Our findings disagree with Yan and colleagues, who found a decrease in FCGR2B expression at 7 and 14 dpi [71]. However, research on FCGR2B in the CNS is rare, and warrants further investigation. Likewise, the role of other novel factors that regulate CNS such as TAFA chemokine like family member 4 (TAFA4) and its cell surface receptor formyl peptide receptor 1 (FPR1) remains to be explored during SCI recovery [72,73].

4.3. Downregulated Pathways and Regenerative Hypotheses

A meta-analysis of human and mouse astrocytes in a neurodegenerative CNS disorder identified the downregulated pathways of synaptic integrity, glutamate uptake, and other neuronal support processes [74]. Although this does not relate directly to traumatic spinal cord injuries, it forms the extent of available CNS degeneration sequencing data. Synapse formation and channel activity are key postulated components of CNS axonal regeneration that are required from a neuro-plasticity standpoint [75,76]. Glial cells such as peri-synaptic Schwann cells at the neuromuscular junction have been shown to guide axon regeneration, highlighting the importance of synaptic activity on changes in synapse states and the integrated nature of neurotransmission and long-term synaptic stability [77]. Although these cells may play a role in maintaining synaptic efficiency and promoting synaptic connections after denervation in the PNS, their role in the CNS post-injury is ineffective, but may prove to be a therapeutic target [77]. Synaptic pathways were also identified in the protein–protein interaction analysis as the predominant pathways composing both Cluster 2 and Cluster 3, namely synaptic vesicle cycle, GABAergic synapse pathways, neuroactive ligand–receptor interaction, and retrograde endocannabinoid signaling pathways (Figure 9d–f). It was also found to be a minor component of the top nine downregulated GSEA functional enrichment gene sets, namely, neuroactive ligand–receptor interaction, long-term potentiation, and calcium signaling pathway (Figure 7b).
Our GSEA functional enrichment analysis also found downregulated gene sets that are strongly related to the components required to maintain a healthy myelin sheath; biosynthesis of terpenoid backbones, steroids, and unsaturated fatty acids (Figure 7b). The nervous microenvironment has been postulated to be an essential component in regenerating CNS neurons. Myelin is produced by oligodendrocytes in the CNS and Schwann cells in the PNS. It is an essential component of nervous tissue, maintaining a healthy intracellular electrical and metabolic microenvironment [78]. When combined with a healthy human Schwann cell graft, an injured rat spinal cord was able to demonstrate regeneration, even beyond the graft [79]. According to the literature, the transplantation of stem cells appears to be the most effective strategy for remyelination, by constructing a microcellular environment that promotes myelin sheath generation [3,80,81].

4.4. Key Downregulated Genes and Implications

As mentioned previously, downregulated genes are less frequently studied, as they are challenging to interpret and target therapeutically. The top five downregulated genes based on logFC values at 21 dpi were MPZ, HMGCS1, SYT2, AACS, and MYOC. Other genes of note amongst the top sustained downregulated DEGs were SCD, DHCR24, PRX, HHIP, and ZDHHC22 (Figure 5i–r). In particular, MYOC (Myocilin), has an unknown clinical significance with respect to the general CNS [82]. Interestingly, astrocytes forming the outer border of the CNS, the glia limitans superficialis, have an atypical morphology and are identifiable by a single genetic marker, MYOC, and may prove to be a therapeutic target to reduce peripheral inflammatory effects on the CNS [83].

4.4.1. Myelination and Lipid Metabolism

MPZ (Myelin Protein Zero) is a gene regulating the early developmental stages of Schwann cells and plays a role in their remyelination in the PNS [84]. Although it has been established as a factor required for PNS regeneration, MPZ has not been confirmed as a gene required for CNS regeneration. It has, however, been found to be expressed when Schwann Cells were cocultured with induced pluripotent stem cell-derived motor neurons [85]. One study identified the myelination genes of MPZ, PRX, PMP2, and PMP22, as downregulated in mouse lumbar spines after a de-loading event [86], all of which were identified as significantly downregulated at both 1 and 21 dpi in this study. HMGCS1 (3-Hydroxy-3-Methylglutaryl-CoA Synthase 1) is a potential regulator of the mevalonate pathway, affecting cholesterol synthesis and myelin sheath formation [87,88]. One study found that HMGCS1 was downregulated along with other cholesterol-related genes in rats post-SCI; however, it was not identified as a key individual gene [89]. SCD (Stearoyl-CoA Desaturase) is responsible for the biosynthesis of monosaturated fatty acids from saturated fatty acids, which may, in turn, play a neurotrophic role [90]. DHCR24 (24-Dehydrocholesterol Reductase) is a gene responsible for the final step of cholesterol biosynthesis, and its overexpression may be neuroprotective against apoptosis [91]. One study showed that regenerating neurons of the rat facial nucleus demonstrated strong upregulation of SCD-1 whereas non-regenerating Clarke’s and Red nucleus neurons failed to, suggesting that SCD may play a functionally significant role in neuronal regeneration [90]. AACS (Acetoacetyl-CoA Synthetase) is another regulator of cholesterol and fatty acid synthesis in the CNS and is essential for normal neuronal development [92]. This gene has not been studied well with respect to spinal cord injury; however, the knockdown of AACS in primary neurons decreases neuronal differentiation and spine apparatus markers [92].
It is worth noting that the Long-Evans Shaker (LES) rat gives a model of chronic demyelination due to a mutation in the MBP gene. LES rats are congenitally dysmyelinated and yet are able to prevent axonal degeneration in vivo [93]. However, it is the exposure to inhibitory molecules and the cascade of activated phagocytes that contribute to the retraction of injured axons in SCI [94].

4.4.2. Synaptic Integrity and Neurotransmission

SYT2 (Synaptotagmin-2) is a synaptic vesicle protein that regulates fast calcium-dependent neurotransmitter release and predominates the spinal cord, unlike other members of its family [95]. The SYT2 gene increases its expression during development and persists into adulthood, following neuronal differentiation [95]. It has not been linked to spinal cord injuries until now. PRX (Periaxin) is a protein-coding gene that is involved in maintaining a healthy myelin sheath; one study showed that the PRX gene was linked to the axon diameter of remyelination [96]. HHIP (Hedgehog Interacting Protein) is a vertebral cell surface protein that negatively modulates hedgehog signaling, which is required for the proper development of the mammalian neural tube from an embryo state [97]. The last gene of interest, ZDHHC22 (Zinc Finger DHHC-Type Palmitoyltransferase 22), is responsible for regulating large conductance calcium-activated potassium channels and, interestingly, is related to tumor progression and the immune microenvironment [98,99]. ZDHHC22 may play a neurotrophic role; however, it is yet to be studied with respect to spinal cord injury and neural regeneration.

4.5. Treatment of Spinal Cord Injuries and Therapeutic Considerations

Currently, the treatment for SCI involves stabilizing the spine at the time of injury, surgical decompression if needed, supportive care, management of complications, and rehabilitation. In the US, methylprednisolone is an FDA-approved drug for the treatment of SCI, although this remains controversial by international spine authorities [100]. Our results have shown that there is a complex immune response at both the acute phase 1 dpi and the chronic phase 21 dpi of SCI. Not only is there an immense innate immune response via macrophage/microglia and complement, confirmed by pathway analysis, but there is an element of auto-immune humoral immunity at play. These two systems appear to synergize with each other to propagate a destructive and chronic inflammatory state that Allison et al. described [64]. Furthermore, there are complex temporal changes to immune phenotypes and functions that warrant further investigation.

4.6. Limitations

Our research method focused on the gene expression at 1 and 21 dpi. Although this helped to minimize noise from transient gene expression that may not have long-term pathological significance, gene expressions are a dynamic process, and regulatory processes may occur at intermediate time points. Future research should be aimed at validating our results using functional assays and protein-level analyses to validate functional significance. Single-cell RNA sequencing should be considered to identify cell-specific gene expression changes.

5. Conclusions

The absent regeneration capacity of the CNS is a complex and interesting limitation of the human body that requires more research and investigation to find a solution. This study identified sustained differentially expressed genetic markers that form the foundation for future SCI research. Upregulated genes involved inflammatory and immune pathways, while downregulated genes were related to myelin sheath and neuronal synapse. The downregulated MYOC gene as a sole genetic marker for astrocytes may prove to hold some significance. The most novel finding of our analysis is the association of our upregulated molecular pathways with SLE and autoimmunity. Given that both SCI and SLE result in extensive immune dysfunction and a myriad of organ-system clinical manifestations, further research is warranted investigating the parallels between these two disease states. We propose that SCI is not only characterized by immune dysfunction but, over the long term, autoimmune dysregulation. This study provides a robust scaffold for functional validation and future research around immune mechanisms is warranted.

Supplementary Materials

The following supporting information can be downloaded at: https://www.mdpi.com/article/10.3390/genes16050514/s1. Table S1: Differentially expressed genes identified comparing post-injury with control. Table S2: Top 10 enriched pathways identified in each GO annotation for the upregulated gene set. Table S3: Top 10 enriched pathways identified in each GO annotation for the downregulated gene set. Table S4: GSEA KEGG pathway analysis of up and downregulated DEGs. Table S5a: KEGG analysis of significantly upregulated genes identified in cluster analysis. Table S5b: KEGG analysis of significantly downregulated genes in cluster analysis.

Author Contributions

All authors made significant contributions to the work presented in this paper. A.C. and S.D.A. contributed to the bioinformatic analyses, construction of figures, and formulation of the draft manuscript. X.Z., H.J. and Q.W. conducted the animal model experiments, experimental data collection, and evaluation and assisted in the process of manuscript preparation. J.X. designed and supervised the study and revised the manuscript. All authors have read and agreed to the published version of the manuscript.

Funding

This study was partly funded by grants from the National Natural Science Funding of China (82172424, 82372396, 82350710800, 82374470, 82472407), Shenzhen Medical Research Fund (B2302005), Outstanding Youth Fund of Zhejiang Province (LR22H060002), Zhejiang Medical and Health Science and Technology Plan Project (2022RC210, 2021KY212), and Wenzhou Major Science and Technology Innovation Project Approval Project (ZY2022007).

Institutional Review Board Statement

This study was approved by the Institutional Animal Care and Use Committee (IACUC) of Zhejiang University (approval number ZJU20220466) on 2 December 2022.

Informed Consent Statement

Informed consent was obtained from all subjects involved in the study.

Data Availability Statement

The data presented in this study are available on request from the corresponding author due to privacy.

Conflicts of Interest

The authors declare that they have no conflicts of interest.

References

  1. Hochman, S. Spinal cord. Curr. Biol. 2007, 17, R950–R955. [Google Scholar] [CrossRef] [PubMed]
  2. Nas, K.; Yazmalar, L.; Şah, V.; Aydın, A.; Öneş, K. Rehabilitation of spinal cord injuries. World J. Orthop. 2015, 6, 8–16. [Google Scholar] [CrossRef] [PubMed]
  3. Anjum, A.; Yazid, M.D.; Fauzi Daud, M.; Idris, J.; Ng, A.M.H.; Selvi Naicker, A.; Ismail, O.H.R.; Athi Kumar, R.K.; Lokanathan, Y. Spinal Cord Injury: Pathophysiology, Multimolecular Interactions, and Underlying Recovery Mechanisms. Int. J. Mol. Sci. 2020, 21, 7533. [Google Scholar] [CrossRef]
  4. Khorasanizadeh, M.; Yousefifard, M.; Eskian, M.; Lu, Y.; Chalangari, M.; Harrop, J.S.; Jazayeri, S.B.; Seyedpour, S.; Khodaei, B.; Hosseini, M.; et al. Neurological recovery following traumatic spinal cord injury: A systematic review and meta-analysis. J. Neurosurg. Spine 2019, 30, 683–699. [Google Scholar] [CrossRef]
  5. Katoh, H.; Yokota, K.; Fehlings, M.G. Regeneration of Spinal Cord Connectivity Through Stem Cell Transplantation and Biomaterial Scaffolds. Front. Cell. Neurosci. 2019, 13, 248. [Google Scholar] [CrossRef]
  6. Fan, B.; Wei, Z.; Yao, X.; Shi, G.; Cheng, X.; Zhou, X.; Zhou, H.; Ning, G.; Kong, X.; Feng, S. Microenvironment Imbalance of Spinal Cord Injury. Cell Transplant. 2018, 27, 853–866. [Google Scholar] [CrossRef]
  7. Couillard-Despres, S.; Bieler, L.; Vogl, M. Pathophysiology of traumatic spinal cord injury. Neurol. Asp. Spinal Cord Inj. 2017, 503–528. [Google Scholar]
  8. Alizadeh, A.; Dyck, S.M.; Karimi-Abdolrezaee, S. Traumatic Spinal Cord Injury: An Overview of Pathophysiology, Models and Acute Injury Mechanisms. Front. Neurol. 2019, 10, 282. [Google Scholar] [CrossRef]
  9. Hu, X.; Xu, W.; Ren, Y.; Wang, Z.; He, X.; Huang, R.; Ma, B.; Zhao, J.; Zhu, R.; Cheng, L. Spinal cord injury: Molecular mechanisms and therapeutic interventions. Signal Transduct. Target. Ther. 2023, 8, 245. [Google Scholar] [CrossRef]
  10. Li, C.; Wu, Z.; Zhou, L.; Shao, J.; Hu, X.; Xu, W.; Ren, Y.; Zhu, X.; Ge, W.; Zhang, K.; et al. Temporal and spatial cellular and molecular pathological alterations with single-cell resolution in the adult spinal cord after injury. Signal Transduct. Target. Ther. 2022, 7, 65. [Google Scholar] [CrossRef]
  11. Tran, A.P.; Warren, P.M.; Silver, J. The Biology of Regeneration Failure and Success After Spinal Cord Injury. Physiol. Rev. 2018, 98, 881–917. [Google Scholar] [CrossRef]
  12. Poplawski, G.H.D.; Kawaguchi, R.; Van Niekerk, E.; Lu, P.; Mehta, N.; Canete, P.; Lie, R.; Dragatsis, I.; Meves, J.M.; Zheng, B.; et al. Injured adult neurons regress to an embryonic transcriptional growth state. Nature 2020, 581, 77–82. [Google Scholar] [CrossRef] [PubMed]
  13. Kang, H.; Lichtman, J.W. Motor axon regeneration and muscle reinnervation in young adult and aged animals. J. Neurosci. 2013, 33, 19480–19491. [Google Scholar] [CrossRef] [PubMed]
  14. Hoffman, P.N. A conditioning lesion induces changes in gene expression and axonal transport that enhance regeneration by increasing the intrinsic growth state of axons. Exp. Neurol. 2010, 223, 11–18. [Google Scholar] [CrossRef] [PubMed]
  15. Chandran, V.; Coppola, G.; Nawabi, H.; Omura, T.; Versano, R.; Huebner, E.A.; Zhang, A.; Costigan, M.; Yekkirala, A.; Barrett, L.; et al. A Systems-Level Analysis of the Peripheral Nerve Intrinsic Axonal Growth Program. Neuron 2016, 89, 956–970. [Google Scholar] [CrossRef]
  16. Chen, M.S.; Huber, A.B.; van der Haar, M.E.; Frank, M.; Schnell, L.; Spillmann, A.A.; Christ, F.; Schwab, M.E. Nogo-A is a myelin-associated neurite outgrowth inhibitor and an antigen for monoclonal antibody IN-1. Nature 2000, 403, 434–439. [Google Scholar] [CrossRef]
  17. GrandPré, T.; Li, S.; Strittmatter, S.M. Nogo-66 receptor antagonist peptide promotes axonal regeneration. Nature 2002, 417, 547–551. [Google Scholar] [CrossRef]
  18. Liu, K.; Lu, Y.; Lee, J.K.; Samara, R.; Willenberg, R.; Sears-Kraxberger, I.; Tedeschi, A.; Park, K.K.; Jin, D.; Cai, B.; et al. PTEN deletion enhances the regenerative ability of adult corticospinal neurons. Nat. Neurosci. 2010, 13, 1075–1081. [Google Scholar] [CrossRef]
  19. Park, K.K.; Liu, K.; Hu, Y.; Kanter, J.L.; He, Z. PTEN/mTOR and axon regeneration. Exp. Neurol. 2010, 223, 45–50. [Google Scholar] [CrossRef]
  20. Young, W. Spinal Cord Regeneration. Cell Transplant. 2014, 23, 573–611. [Google Scholar] [CrossRef]
  21. Moeendarbary, E.; Weber, I.P.; Sheridan, G.K.; Koser, D.E.; Soleman, S.; Haenzi, B.; Bradbury, E.J.; Fawcett, J.; Franze, K. The soft mechanical signature of glial scars in the central nervous system. Nat. Commun. 2017, 8, 14787. [Google Scholar] [CrossRef] [PubMed]
  22. Yang, T.; Dai, Y.; Chen, G.; Cui, S. Dissecting the Dual Role of the Glial Scar and Scar-Forming Astrocytes in Spinal Cord Injury. Front. Cell. Neurosci. 2020, 14, 78. [Google Scholar] [CrossRef]
  23. Zheng, B.; Ho, C.; Li, S.; Keirstead, H.; Steward, O.; Tessier-Lavigne, M. Lack of Enhanced Spinal Regeneration in Nogo-Deficient Mice. Neuron 2003, 38, 213–224. [Google Scholar] [CrossRef]
  24. Anderson, M.A.; Burda, J.E.; Ren, Y.; Ao, Y.; O’Shea, T.M.; Kawaguchi, R.; Coppola, G.; Khakh, B.S.; Deming, T.J.; Sofroniew, M.V. Astrocyte scar formation aids central nervous system axon regeneration. Nature 2016, 532, 195–200. [Google Scholar] [CrossRef]
  25. Ola, M.S.; Nawaz, M.; Ahsan, H. Role of Bcl-2 family proteins and caspases in the regulation of apoptosis. Mol. Cell. Biochem. 2011, 351, 41–58. [Google Scholar] [CrossRef]
  26. Wu, K.L.; Hsu, C.; Chan, J.Y. Impairment of the mitochondrial respiratory enzyme activity triggers sequential activation of apoptosis-inducing factor-dependent and caspase-dependent signaling pathways to induce apoptosis after spinal cord injury. J. Neurochem. 2007, 101, 1552–1566. [Google Scholar] [CrossRef]
  27. Kotipatruni, R.R.; Dasari, V.R.; Veeravalli, K.K.; Dinh, D.H.; Fassett, D.; Rao, J.S. p53- and Bax-Mediated Apoptosis in Injured Rat Spinal Cord. Neurochem. Res. 2011, 36, 2063–2074. [Google Scholar] [CrossRef]
  28. Park, K.W.; Lin, C.-Y.; Lee, Y.-S. Expression of Suppressor of Cytokine Signaling-3 (SOCS3) and its role in neuronal death after complete spinal cord injury. Exp. Neurol. 2014, 261, 65–75. [Google Scholar] [CrossRef]
  29. Schulze, A.; Downward, J. Navigating gene expression using microarrays—A technology review. Nat. Cell Biol. 2001, 3, E190–E195. [Google Scholar] [CrossRef]
  30. Singh, K.P.; Miaskowski, C.; Dhruva, A.A.; Flowers, E.; Kober, K.M. Mechanisms and Measurement of Changes in Gene Expression. Biol. Res. Nurs. 2018, 20, 369–382. [Google Scholar] [CrossRef]
  31. Rodriguez-Esteban, R.; Jiang, X. Differential gene expression in disease: A comparison between high-throughput studies and the literature. BMC Med. Genom. 2017, 10, 59. [Google Scholar] [CrossRef] [PubMed]
  32. Walter, T.J.; Suter, R.K.; Ayad, N.G. An overview of human single-cell RNA sequencing studies in neurobiological disease. Neurobiol. Dis. 2023, 184, 106201. [Google Scholar] [CrossRef] [PubMed]
  33. Wickham, H. ggplot2: Elegant Graphics for Data Analysis, 2nd ed.; Springer: Berlin/Heidelberg, Germany, 2016. [Google Scholar]
  34. Sherman, B.T.; Hao, M.; Qiu, J.; Jiao, X.; Baseler, M.W.; Lane, H.C.; Imamichi, T.; Chang, W. DAVID: A web server for functional enrichment analysis and functional annotation of gene lists (2021 update). Nucleic Acids Res. 2022, 50, W216–W221. [Google Scholar] [CrossRef] [PubMed]
  35. Huang, D.W.; Sherman, B.T.; Lempicki, R.A. Systematic and integrative analysis of large gene lists using DAVID bioinformatics resources. Nat. Protoc. 2009, 4, 44–57. [Google Scholar] [CrossRef]
  36. Subramanian, A.; Tamayo, P.; Mootha, V.K.; Mukherjee, S.; Ebert, B.L.; Gillette, M.A.; Paulovich, A.; Pomeroy, S.L.; Golub, T.R.; Lander, E.S.; et al. Gene set enrichment analysis: A knowledge-based approach for interpreting genome-wide expression profiles. Proc. Natl. Acad. Sci. USA 2005, 102, 15545–15550. [Google Scholar] [CrossRef]
  37. Szklarczyk, D.; Franceschini, A.; Wyder, S.; Forslund, K.; Heller, D.; Huerta-Cepas, J.; Simonovic, M.; Roth, A.; Santos, A.; Tsafou, K.P.; et al. STRING v10: Protein-protein interaction networks, integrated over the tree of life. Nucleic Acids Res. 2015, 43, D447–D452. [Google Scholar] [CrossRef]
  38. Bader, G.D.; Hogue, C.W. An automated method for finding molecular complexes in large protein interaction networks. BMC Bioinform. 2003, 4, 2. [Google Scholar] [CrossRef]
  39. Sterner, R.C.; Sterner, R.M. Immune response following traumatic spinal cord injury: Pathophysiology and therapies. Front. Immunol. 2022, 13, 1084101. [Google Scholar] [CrossRef]
  40. Holness, C.L.; Simmons, D.L. Molecular cloning of CD68, a human macrophage marker related to lysosomal glycoproteins. Blood 1993, 81, 1607–1613. [Google Scholar] [CrossRef]
  41. Zhang, J.; Li, S.; Liu, F.; Yang, K. Role of CD68 in tumor immunity and prognosis prediction in pan-cancer. Sci. Rep. 2022, 12, 7844. [Google Scholar] [CrossRef]
  42. David, S.; Kroner, A. Repertoire of microglial and macrophage responses after spinal cord injury. Nat. Rev. Neurosci. 2011, 12, 388–399. [Google Scholar] [CrossRef] [PubMed]
  43. Cherry, J.D.; Olschowka, J.A.; O’Banion, M.K. Neuroinflammation and M2 microglia: The good, the bad, and the inflamed. J. Neuroinflamm. 2014, 11, 98. [Google Scholar] [CrossRef] [PubMed]
  44. Martinez, F.O.; Sica, A.; Mantovani, A.; Locati, M. Macrophage activation and polarization. Front. Biosci. 2008, 13, 453–461. [Google Scholar] [CrossRef]
  45. Huang, Y.-C.; Feng, Z.-P. The good and bad of microglia/macrophages: New hope in stroke therapeutics. Acta Pharmacol. Sin. 2013, 34, 6–7. [Google Scholar] [CrossRef]
  46. Green, T.R.F.; Rowe, R.K. Quantifying microglial morphology: An insight into function. Clin. Exp. Immunol. 2024, 216, 221–229. [Google Scholar] [CrossRef]
  47. Xu, L.; Wang, J.; Ding, Y.; Wang, L.; Zhu, Y.J. Current Knowledge of Microglia in Traumatic Spinal Cord Injury. Front. Neurol. 2021, 12, 796704. [Google Scholar] [CrossRef]
  48. Bellver-Landete, V.; Bretheau, F.; Mailhot, B.; Vallières, N.; Lessard, M.; Janelle, M.E.; Vernoux, N.; Tremblay, M.; Fuehrmann, T.; Shoichet, M.S.; et al. Microglia are an essential component of the neuroprotective scar that forms after spinal cord injury. Nat. Commun. 2019, 10, 518. [Google Scholar] [CrossRef]
  49. Zhang, H.; Hu, Y.M.; Wang, Y.J.; Zhou, Y.; Zhu, Z.J.; Chen, M.H.; Wang, Y.J.; Xu, H.; Wang, Y.H. Macrophage migration inhibitory factor facilitates astrocytic production of the CCL2 chemokine following spinal cord injury. Neural Regen. Res. 2023, 18, 1802–1808. [Google Scholar] [CrossRef]
  50. Zhu, S.; Liu, M.; Bennett, S.; Wang, Z.; Pfleger, K.D.G.; Xu, J. The molecular structure and role of CCL2 (MCP-1) and C-C chemokine receptor CCR2 in skeletal biology and diseases. J. Cell. Physiol. 2021, 236, 7211–7222. [Google Scholar] [CrossRef]
  51. Lee, S.; Lee, J.; Kim, S.; Park, J.-Y.; Lee, W.-H.; Mori, K.; Kim, S.-H.; Kim, I.K.; Suk, K. A Dual Role of Lipocalin 2 in the Apoptosis and Deramification of Activated Microglia1. J. Immunol. 2007, 179, 3231–3241. [Google Scholar] [CrossRef]
  52. Tong, Z.; Wu, X.; Ovcharenko, D.; Zhu, J.; Chen, C.S.; Kehrer, J.P. Neutrophil gelatinase-associated lipocalin as a survival factor. Biochem. J. 2005, 391 Pt 2, 441–448. [Google Scholar] [CrossRef] [PubMed]
  53. Wang, X.; Li, X.; Zuo, X.; Liang, Z.; Ding, T.; Li, K.; Ma, Y.; Li, P.; Zhu, Z.; Ju, C.; et al. Photobiomodulation inhibits the activation of neurotoxic microglia and astrocytes by inhibiting Lcn2/JAK2-STAT3 crosstalk after spinal cord injury in male rats. J. Neuroinflamm. 2021, 18, 256. [Google Scholar] [CrossRef] [PubMed]
  54. Hopperton, K.E.; Mohammad, D.; Trépanier, M.O.; Giuliano, V.; Bazinet, R.P. Markers of microglia in post-mortem brain samples from patients with Alzheimer’s disease: A systematic review. Mol. Psychiatry 2018, 23, 177–198. [Google Scholar] [CrossRef]
  55. Lynch, N.J.; Willis, C.L.; Nolan, C.C.; Roscher, S.; Fowler, M.J.; Weihe, E.; Ray, D.E.; Schwaeble, W.J. Microglial activation and increased synthesis of complement component C1q precedes blood–brain barrier dysfunction in rats. Mol. Immunol. 2004, 40, 709–716. [Google Scholar] [CrossRef]
  56. Hellenbrand, D.J.; Quinn, C.M.; Piper, Z.J.; Morehouse, C.N.; Fixel, J.A.; Hanna, A.S. Inflammation after spinal cord injury: A review of the critical timeline of signaling cues and cellular infiltration. J. Neuroinflamm. 2021, 18, 284. [Google Scholar] [CrossRef]
  57. Day, A.J.; Milner, C.M. TSG-6: A multifunctional protein with anti-inflammatory and tissue-protective properties. Matrix Biol. 2019, 78–79, 60–83. [Google Scholar] [CrossRef]
  58. Coulson-Thomas, V.J.; Lauer, M.E.; Soleman, S.; Zhao, C.; Hascall, V.C.; Day, A.J.; Fawcett, J.W. Tumor Necrosis Factor-stimulated Gene-6 (TSG-6) Is Constitutively Expressed in Adult Central Nervous System (CNS) and Associated with Astrocyte-mediated Glial Scar Formation following Spinal Cord Injury. J. Biol. Chem. 2016, 291, 19939–19952. [Google Scholar] [CrossRef]
  59. La Russa, D.; Di Santo, C.; Lizasoain, I.; Moraga, A.; Bagetta, G.; Amantea, D. Tumor Necrosis Factor (TNF)-α-Stimulated Gene 6 (TSG-6): A Promising Immunomodulatory Target in Acute Neurodegenerative Diseases. Int. J. Mol. Sci. 2023, 24, 1162. [Google Scholar] [CrossRef]
  60. Brenner, D.; Blaser, H.; Mak, T.W. Regulation of tumour necrosis factor signalling: Live or let die. Nat. Rev. Immunol. 2015, 15, 362–374. [Google Scholar] [CrossRef]
  61. Atretkhany, K.-S.N.; Gogoleva, V.S.; Drutskaya, M.S.; Nedospasov, S.A. Distinct modes of TNF signaling through its two receptors in health and disease. J. Leukoc. Biol. 2020, 107, 893–905. [Google Scholar] [CrossRef]
  62. Fischer, R.; Maier, O.; Siegemund, M.; Wajant, H.; Scheurich, P.; Pfizenmaier, K. A TNF receptor 2 selective agonist rescues human neurons from oxidative stress-induced cell death. PLoS ONE 2011, 6, e27621. [Google Scholar] [CrossRef] [PubMed]
  63. Arevalo-Martin, A.; Grassner, L.; Garcia-Ovejero, D.; Paniagua-Torija, B.; Barroso-Garcia, G.; Arandilla, A.G.; Mach, O.; Turrero, A.; Vargas, E.; Alcobendas, M.; et al. Elevated Autoantibodies in Subacute Human Spinal Cord Injury Are Naturally Occurring Antibodies. Front. Immunol. 2018, 9, 2365. [Google Scholar] [CrossRef] [PubMed]
  64. Allison, D.J.; Ditor, D.S. Immune dysfunction and chronic inflammation following spinal cord injury. Spinal Cord. 2015, 53, 14–18. [Google Scholar] [CrossRef] [PubMed]
  65. Lucin, K.M.; Sanders, V.M.; Jones, T.B.; Malarkey, W.B.; Popovich, P.G. Impaired antibody synthesis after spinal cord injury is level dependent and is due to sympathetic nervous system dysregulation. Exp. Neurol. 2007, 207, 75–84. [Google Scholar] [CrossRef]
  66. Ankeny, D.P.; Popovich, P.G. Mechanisms and implications of adaptive immune responses after traumatic spinal cord injury. Neuroscience 2009, 158, 1112–1121. [Google Scholar] [CrossRef]
  67. Ankeny, D.P.; Lucin, K.M.; Sanders, V.M.; McGaughy, V.M.; Popovich, P.G. Spinal cord injury triggers systemic autoimmunity: Evidence for chronic B lymphocyte activation and lupus-like autoantibody synthesis. J. Neurochem. 2006, 99, 1073–1087. [Google Scholar] [CrossRef]
  68. Choi, J.; Kim, S.T.; Craft, J. The pathogenesis of systemic lupus erythematosus-an update. Curr. Opin. Immunol. 2012, 24, 651–657. [Google Scholar] [CrossRef]
  69. Li, X.; Ptacek, T.S.; Brown, E.E.; Edberg, J.C. Fcgamma receptors: Structure, function and role as genetic risk factors in SLE. Genes. Immun. 2009, 10, 380–389. [Google Scholar] [CrossRef]
  70. Smith, K.G.; Clatworthy, M.R. FcgammaRIIB in autoimmunity and infection: Evolutionary and therapeutic implications. Nat. Rev. Immunol. 2010, 10, 328–343. [Google Scholar] [CrossRef]
  71. Yan, L.; Fu, J.; Dong, X.; Chen, B.; Hong, H.; Cui, Z. Identification of hub genes in the subacute spinal cord injury in rats. BMC Neurosci. 2022, 23, 51. [Google Scholar] [CrossRef]
  72. Hoeffel, G.; Debroas, G.; Roger, A.; Rossignol, R.; Gouilly, J.; Laprie, C.; Chasson, L.; Barbon, P.V.; Balsamo, A.; Reynders, A.; et al. Sensory neuron-derived TAFA4 promotes macrophage tissue repair functions. Nature 2021, 594, 94–99. [Google Scholar] [CrossRef] [PubMed]
  73. Zhu, S.; Hu, X.; Bennett, S.; Mai, Y.; Xu, J. Molecular Structure, Expression and Role of TAFA4 and its Receptor FPR1 in the Spinal Cord. Front. Cell Dev. Biol. 2022, 10, 911414. [Google Scholar] [CrossRef] [PubMed]
  74. Ziff, O.J.; Clarke, B.E.; Taha, D.M.; Crerar, H.; Luscombe, N.M.; Patani, R. Meta-analysis of human and mouse ALS astrocytes reveals multi-omic signatures of inflammatory reactive states. Genome Res. 2022, 32, 71–84. [Google Scholar] [CrossRef] [PubMed]
  75. Filous, A.R.; Schwab, J.M. Determinants of Axon Growth, Plasticity, and Regeneration in the Context of Spinal Cord Injury. Am. J. Pathol. 2018, 188, 53–62. [Google Scholar] [CrossRef]
  76. Martin, J.H. Neuroplasticity of spinal cord injury and repair. Handb. Clin. Neurol. 2022, 184, 317–330. [Google Scholar] [CrossRef]
  77. Auld, D.S.; Robitaille, R. Perisynaptic Schwann cells at the neuromuscular junction: Nerve- and activity-dependent contributions to synaptic efficacy, plasticity, and reinnervation. Neuroscientist 2003, 9, 144–157. [Google Scholar] [CrossRef] [PubMed]
  78. Kalafatakis, I.; Karagogeos, D. Oligodendrocytes and Microglia: Key Players in Myelin Development, Damage and Repair. Biomolecules 2021, 11, 1058. [Google Scholar] [CrossRef]
  79. Guest, J.D.; Rao, A.; Olson, L.; Bunge, M.B.; Bunge, R.P. The ability of human Schwann cell grafts to promote regeneration in the transected nude rat spinal cord. Exp. Neurol. 1997, 148, 502–522. [Google Scholar] [CrossRef]
  80. Jensen, S.K.; Michaels, N.J.; Ilyntskyy, S.; Keough, M.B.; Kovalchuk, O.; Yong, V.W. Multimodal Enhancement of Remyelination by Exercise with a Pivotal Role for Oligodendroglial PGC1α. Cell Rep. 2018, 24, 3167–3179. [Google Scholar] [CrossRef]
  81. Badner, A.; Siddiqui, A.M.; Fehlings, M.G. Spinal cord injuries: How could cell therapy help? Expert. Opin. Biol. Ther. 2017, 17, 529–541. [Google Scholar] [CrossRef]
  82. Sharma, R.; Grover, A. Myocilin-associated Glaucoma: A Historical Perspective and Recent Research Progress. Mol. Vis. 2021, 27, 480–493. [Google Scholar] [PubMed]
  83. Hasel, P.; Cooper, M.L.; Marchildon, A.E.; Rufen-Blanchette, U.A.; Kim, R.D.; Ma, T.C.; Kang, U.J.; Chao, M.V.; Liddelow, S.A. Defining the molecular identity and morphology of glia limitans superficialis astrocytes in mouse and human. bioRxiv 2023. [Google Scholar] [CrossRef]
  84. Torii, T.; Miyamoto, Y.; Yamauchi, J. Cellular Signal-Regulated Schwann Cell Myelination and Remyelination. Adv. Exp. Med. Biol. 2019, 1190, 3–22. [Google Scholar] [CrossRef]
  85. Louit, A.; Beaudet, M.J.; Pépin, R.; Berthod, F. Differentiation of Human Induced Pluripotent Stem Cells into Mature and Myelinating Schwann Cells. Tissue Eng. Part. C Methods 2023, 29, 134–143. [Google Scholar] [CrossRef]
  86. Chelyshev, Y.A.; Muhamedshina, Y.O.; Povysheva, T.V.; Shaymardanova, G.F.; Rizvanov, A.A.; Nigmetzyanova, M.V.; Tiapkina, O.V.; Bondarenko, N.I.; Nikolskiy, E.E.; Islamov, R.R. Characterization of spinal cord glial cells in a model of hindlimb unloading in mice. Neuroscience 2014, 280, 328–339. [Google Scholar] [CrossRef]
  87. Wang, I.H.; Huang, T.T.; Chen, J.L.; Chu, L.W.; Ping, Y.H.; Hsu, K.W.; Huang, K.H.; Fang, W.L.; Lee, H.C.; Chen, C.F.; et al. Mevalonate Pathway Enzyme HMGCS1 Contributes to Gastric Cancer Progression. Cancers 2020, 12, 1088. [Google Scholar] [CrossRef]
  88. Saher, G.; Brügger, B.; Lappe-Siefke, C.; Möbius, W.; Tozawa, R.; Wehr, M.C.; Wieland, F.; Ishibashi, S.; Nave, K.A. High cholesterol level is essential for myelin membrane growth. Nat. Neurosci. 2005, 8, 468–475. [Google Scholar] [CrossRef]
  89. Chen, G.; Fang, X.; Yu, M. Regulation of gene expression in rats with spinal cord injury based on microarray data. Mol. Med. Rep. 2015, 12, 2465–2472. [Google Scholar] [CrossRef]
  90. Breuer, S.; Pech, K.; Buss, A.; Spitzer, C.; Ozols, J.; Hol, E.M.; Heussen, N.; Noth, J.; Schwaiger, F.W.; Schmitt, A.B. Regulation of stearoyl-CoA desaturase-1 after central and peripheral nerve lesions. BMC Neurosci. 2004, 5, 15. [Google Scholar] [CrossRef]
  91. Lu, X.; Jia, D.; Zhao, C.; Wang, W.; Liu, T.; Chen, S.; Quan, X.; Sun, D.; Gao, B. Recombinant adenovirus-mediated overexpression of 3β-hydroxysteroid-Δ24 reductase. Neural Regen. Res. 2014, 9, 504–512. [Google Scholar] [CrossRef]
  92. Hasegawa, S.; Kume, H.; Iinuma, S.; Yamasaki, M.; Takahashi, N.; Fukui, T. Acetoacetyl-CoA synthetase is essential for normal neuronal development. Biochem. Biophys. Res. Commun. 2012, 427, 398–403. [Google Scholar] [CrossRef] [PubMed]
  93. Smith, C.M.; Cooksey, E.; Duncan, I.D. Myelin Loss Does Not Lead to Axonal Degeneration in a Long-Lived Model of Chronic Demyelination. J. Neurosci. 2013, 33, 2718–2727. [Google Scholar] [CrossRef] [PubMed]
  94. McPhail, L.T.; Stirling, D.P.; Tetzlaff, W.; Kwiecien, J.M.; Ramer, M.S. The contribution of activated phagocytes and myelin degeneration to axonal retraction/dieback following spinal cord injury. Eur. J. Neurosci. 2004, 20, 1984–1994. [Google Scholar] [CrossRef] [PubMed]
  95. Berton, F.; Iborra, C.; Boudier, J.A.; Seagar, M.J.; Marquèze, B. Developmental regulation of synaptotagmin I, II, III, and IV mRNAs in the rat CNS. J. Neurosci. 1997, 17, 1206–1216. [Google Scholar] [CrossRef]
  96. Williams, A.C.; Brophy, P.J. The function of the Periaxin gene during nerve repair in a model of CMT4F. J. Anat. 2002, 200, 323–330. [Google Scholar] [CrossRef]
  97. Jeong, J.; McMahon, A.P. Growth and pattern of the mammalian neural tube are governed by partially overlapping feedback activities of the hedgehog antagonists patched 1 and Hhip1. Development 2005, 132, 143–154. [Google Scholar] [CrossRef]
  98. Tang, F.; Yang, C.; Li, F.P.; Yu, D.H.; Pan, Z.Y.; Wang, Z.F.; Li, Z.Q. Palmitoyl transferases act as potential regulators of tumor-infiltrating immune cells and glioma progression. Mol. Ther. Nucleic Acids 2022, 28, 716–731. [Google Scholar] [CrossRef]
  99. Tian, L.; McClafferty, H.; Knaus, H.G.; Ruth, P.; Shipston, M.J. Distinct acyl protein transferases and thioesterases control surface expression of calcium-activated potassium channels. J. Biol. Chem. 2012, 287, 14718–14725. [Google Scholar] [CrossRef]
  100. Fehlings, M.G.; Tetreault, L.A.; Wilson, J.R.; Kwon, B.K.; Burns, A.S.; Martin, A.R.; Hawryluk, G.; Harrop, J.S. A Clinical Practice Guideline for the Management of Acute Spinal Cord Injury: Introduction, Rationale, and Scope. Glob. Spine J. 2017, 7, 84s–94s. [Google Scholar] [CrossRef]
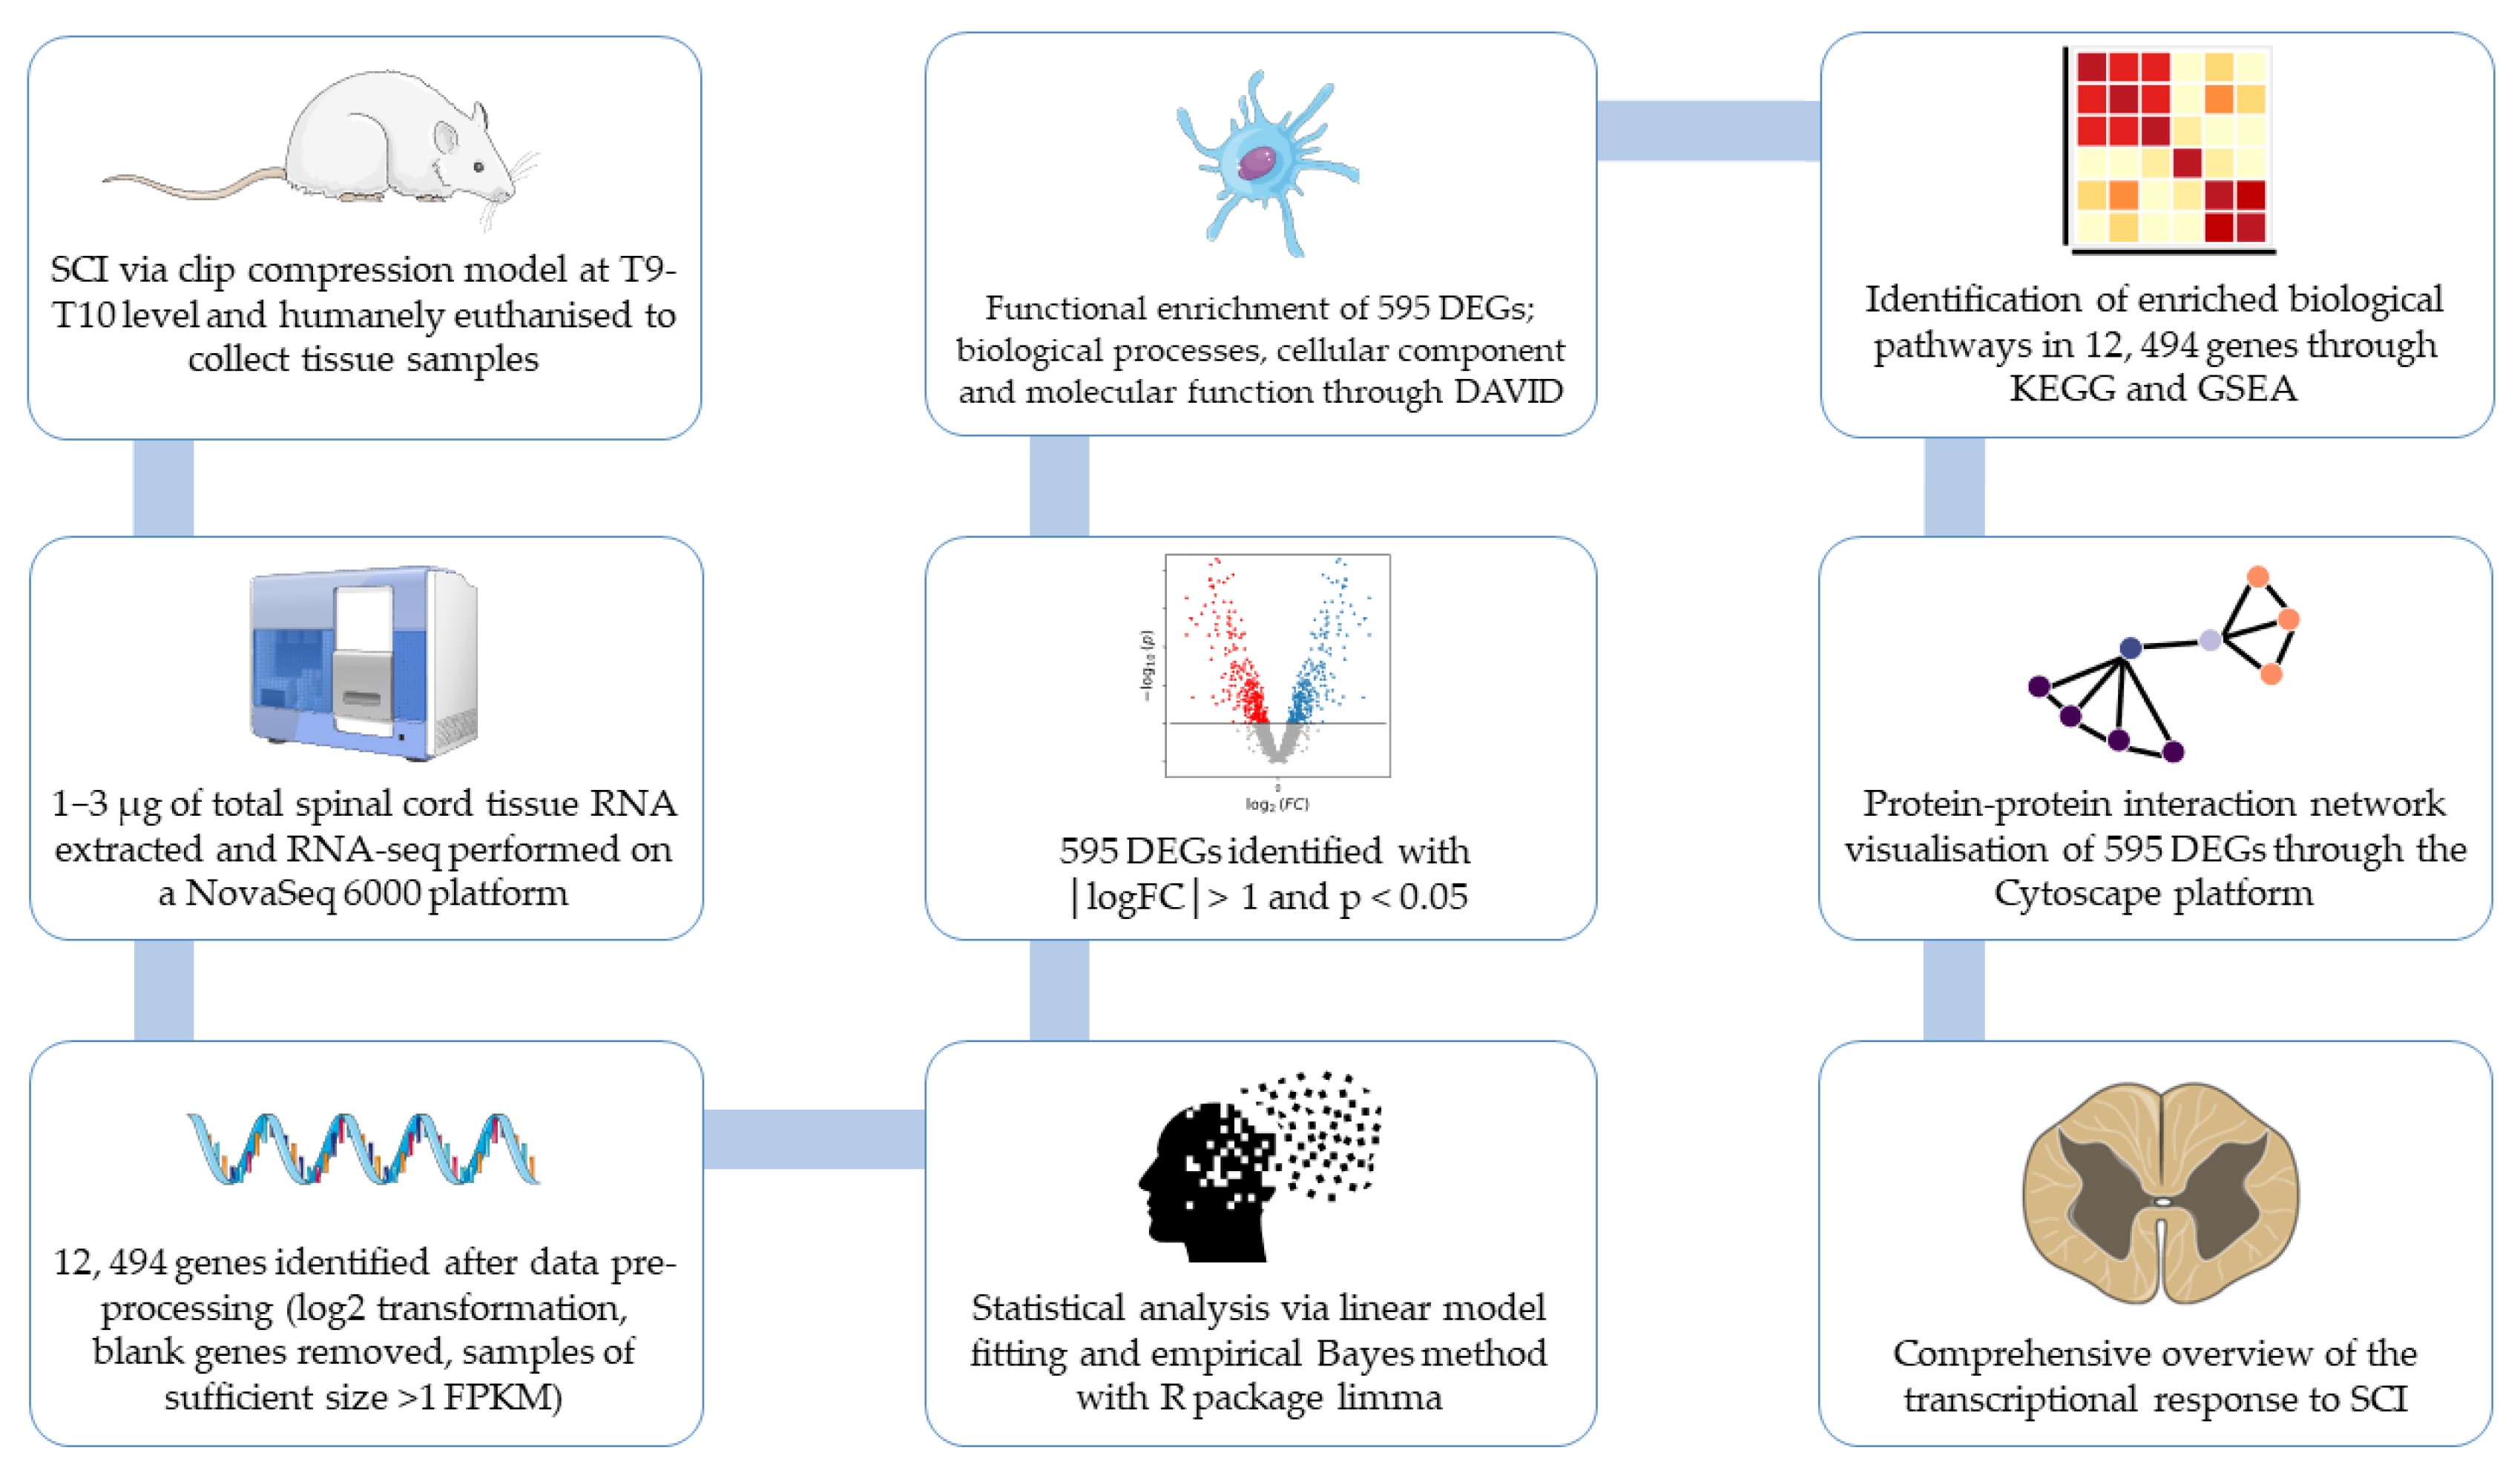
Figure 1. Analytical pipeline and overview of our study design.
Genes 16 00514 g001
Figure 2. Volcano plot representing temporal gene expression at (a) 1 dpi (b) 21 dpi.
Genes 16 00514 g002
Figure 3. Heatmap based on the hierarchical clustering of the top 30 DEGs ranked according to the 21 dpi log FC in the (a) upregulated group and (b) downregulated group.
Genes 16 00514 g003
Figure 4. Paired t-test analysis of DEGs between 21 dpi and 1 dpi for the (a) upregulated DEGs and (b) downregulated DEGs.
Genes 16 00514 g004
Figure 5. Temporal RNA expression changes confirming established genes in the literature, as well as novel targets in the downregulated group: (a) BCL2A1, (b) LGALS3, (c) SOCS3, (d) TNF, (e) TNFRSF1A, (f) CCL2, (g) C1QA, (h) FCGR2A, (i) AACS, (j) DHCR24, (k) HHIP, (l) HMGCS1, (m) MPZ, (n) MYOC, (o) PRX, (p) SCD, (q) SYT2, and (r) ZDHHC22.
Genes 16 00514 g005aGenes 16 00514 g005bGenes 16 00514 g005c
Figure 6. Gene ontology analysis with the top 10 enrichment terms plotted on bubble plots for the upregulated group (ac) and the downregulated group (df).
Genes 16 00514 g006aGenes 16 00514 g006bGenes 16 00514 g006c
Figure 7. The top KEGG pathways enriched in (a) upregulated gene sets and (b) downregulated gene sets.
Genes 16 00514 g007
Figure 8. Enrichment plots for key KEGG pathways highlighted in the upregulated group, including (a) systemic lupus erythematosus (b) cytokine–cytokine receptor interaction (c) complement and coagulation cascades (d) natural killer cell-mediated cytotoxicity. Pathways enriched in the downregulated group include (e) terpenoid backbone synthesis (f) axon guidance (g) calcium signaling pathway (h) steroid biosynthesis.
Genes 16 00514 g008aGenes 16 00514 g008b
Figure 9. Visual representation of associated protein networks of identified gene clusters. Upregulated DEGs are visualized in (a) Cluster 1, (b) Cluster 2, and (c) Cluster 3. Downregulated DEGs are visualized in (d) Cluster 1, (e) Cluster 2, and (f) Cluster 3.
Genes 16 00514 g009aGenes 16 00514 g009b
Disclaimer/Publisher’s Note: The statements, opinions and data contained in all publications are solely those of the individual author(s) and contributor(s) and not of MDPI and/or the editor(s). MDPI and/or the editor(s) disclaim responsibility for any injury to people or property resulting from any ideas, methods, instructions or products referred to in the content.