Abstract
Background/Objectives: North African catfish (Clarias gariepinus) and bighead catfish (Clarias macrocephalus) play crucial roles in Thai aquaculture. Although significant growth disparities exist among these species, the genetic factors underlying these differences are still unknown. This study aimed to identify GH1 gene polymorphisms, in North African and bighead catfish populations across Thailand and Laos. Methods: Sequencing, phylogenetic, and clustering analyses were performed to assess genetic diversity, selection patterns, and lineage differentiation of catfish partial GH1 fragment. Results: Six alleles of the studied fragment of GH1 gene were identified; they differed at 33 variable sites within intron 2, located between the conserved regions at the 3′ end of exon 2 and the 5′ end of exon 3. At the population-level, GH1 exhibited low heterozygosity (mean Ho = 0.043 ± 0.023; He = 0.059 ± 0.028). Bayesian clustering analyses identified two distinct genetic clusters, corresponding to North African and bighead catfish, apart from the bighead population in Laos, indicating their distinct genetic origins. Evidence of purifying selection was observed in both species. Phylogenetic analysis indicated the presence of lineage-specific alleles in the GH1 gene. Conclusions: These findings provide valuable insights into GH1 polymorphisms in commercially important catfish species and may help to develop future breeding programs aimed at enhancing aquaculture productivity.
1. Introduction
Fish are economically important as a source of animal protein and other valuable products. Consequently, owing to rising consumer demand and declining natural fish stocks, aquaculture has become a driving force in global food production. In Thailand, aquaculture is the cornerstone of the fisheries sector, contributing approximately 1 million tons annually to the national economy as of 2023 [1]. Among the contributors to this success in Thailand, a key component of domestic consumption is clariid catfish, which generates an annual value of THB 4353 billion (USD 128.87 billion) (15.41% of global aquaculture) being ranked in the top ten producers [1].
North African catfish (C. gariepinus) is originally native to various countries across the African continent. The fish, which has four pairs of thick-based barbels and an elongated head with a concave profile sloping downward from the snout to the nape, is described in the following manner. The head’s top is rough-textured, and three curved ridges, with the central one being the longest, mark the nape. The long, slender body has extended dorsal and anal fins. The upper body shows a marbled pattern of dark brownish-yellow, while the cheeks and belly are lighter. A pale vertical stripe is found at the caudal fin’s base, with fins darker and sometimes tinged with red at the edges. This species was introduced to Thailand in late 1987 [2] and is known for its strong adaptability and resistance to varying water conditions. These traits have led to this species widespread cultivation in Africa and other regions [3,4]. Thai consumers, however, do not favor North African catfish because of its unfavorable color and texture [4,5].
The bighead catfish (C. macrocephalus) is a freshwater species native to Thailand. The fish, characterized by an elongated, scaleless body and four pairs of barbels, exhibits coloration ranging from yellow to brown with black spots along the sides. It is described as yellowish and oily. The body shape is blunt, with a rounded occipital bone and a smooth skull. Sharp, rigid spines and long fin rays are present on the pectoral fins, while the underside from the chest to pelvic fins is white to yellow [4,5].
The hybrids of the mentioned two species currently dominate the market, accounting for a market share of over 90% in Thailand [6,7,8,9]. The technology was developed in 1987 to improve productivity and meat quality of catfish: hybrid catfish, produced via the artificial crossbreeding of male North African catfish and female bighead catfish (C. macrocephalus). Females of the hybrids, however, are partially sterile, whereas the hybrid males are completely sterile [4,10,11]. This necessitates the preparation of parental genetic stocks and resources for breeding. Nevertheless, the national production of hybrid catfish in Thailand has decreased from 124,463 tons in 2013 to 89,525 tons in 2023 [12]. The total production value is now estimated at approximately THB 3500–4000 million (USD 103–118 million), reflecting a 10.9% decline since 2022. The decline is attributed to issues such as low genetic stock quality, heat stress and climate effects, poor hatchery and water management, and high feed costs [13]. Additionally, the size of hybrid catfish gradually decreases with each generation, resulting in an extended growth period, from about 120 days to 150 days, to reach a marketable size [14,15,16,17]. Such declines in the survival, growth, conception, and fertility rates of North African and bighead catfish, as observed in their cultured populations, are attributed to uncontrolled management of breeding stock.
Growth performance is a crucial economic trait in aquaculture; it has the potential to enhance productivity and reduce costs. Accordingly, the difference in growth rates among North African, bighead, and hybrid catfish has been emphasized [4], and the difference has also been observed between ecotypes of North African catfish [18]. Various extrinsic factors, such as variations in feeding regimes and feeding durations, affect fish body weight gain by influencing the expression of muscle growth-related genes [19]. Thus, growth variations have a genetic basis owing to genetic polymorphisms associated with body size changes [19,20]. The growth in fish is regulated by a group of genes such as growth hormone (GH), growth hormone receptor (GHR), insulin-like growth factor (IGF1), myogenic regulatory factors (MRFs), and myostatin (MSTN) [19,21,22,23].
The GH gene is a key regulator of metamorphosis in fish and is associated with linear growth, feed utilization, and fasting metabolism, and plays a crucial role in the development of muscles and bones, as well as in other essential physiological processes [24]. GH, a 20.5 kDa polypeptide secreted by somatotrophs, is thus essential for growth and development in vertebrates and regulates cellular division, muscular growth, reproduction, osmoregulation, and food conversion in fish [24,25]. The GH gene is not structurally conserved among teleosts; carp (Cyprinus carpio) has five exons, whereas other teleosts, such as gilthead seabream (Sparus aurata), pacu (Piaractus mesopotamicus), and salmonine fishes, have six exons [26,27,28]. Additionally, the gene is duplicated as GH1 and GH2 in some fish such as salmonids, common carp, and tilapia [29,30]. Intraspecific polymorphisms in the GH1 gene have been identified in several fish species, and these variations may affect growth and survival rates by altering the structure and function of GH [27,31,32]. Certain alleles of the GH1 gene in tilapia and salmonids are associated with growth rate and adaptability to varying environmental conditions [33,34]. Among the clariid catfish species, the GH1 gene of North African catfish (accession number: AF416488) contains five exons and four introns [35]. Furthermore, the amino acids of growth hormone tend to be conserved among clariid catfish species [36]. However, information pertaining to the correlation between GH1 polymorphisms and growth performance in catfish is limited.
Given the significant difference in growth rate performance between North African and bighead catfish, we herein hypothesize that the alleles of the GH1 gene may differ between the two species. Additionally, large-scale studies of genetic diversity using microsatellite genotyping have revealed high genetic variations in North African and bighead catfish in Thailand [9,37,38,39,40,41]. This suggests a high likelihood of GH1 polymorphisms in catfish populations. Identification of polymorphisms of the GH1 gene by complete or partial sequencing in various catfish species or ecotypes contributes to the development of effective tools, such as marker-assisted selection, for enhancing breeding programs. The findings can thus contribute to the advancement in catfish genetics and the development of effective selection strategies. Hence, this study aimed to identify interspecific or even intraspecific GH1 gene polymorphisms.
2. Materials and Methods
2.1. Ethic Statement
The catfish included in this study were sourced from private farms or natural habitats. Caudal fin clip samples were obtained with prior authorization from fish farm owners or relevant governing authorities, and all individuals were immediately released back to their respective habitats after sampling. The Animal Experiment Committee at Kasetsart University reviewed and approved the animal use protocols for this study (Approval Nos. ACKU65-SCI-003, ACKU66-SCI-006, and ACKU66-SCI-014). The study was conducted in accordance with the ARRIVE guidelines (https://arriveguidelines.org) and complied with Kasetsart University’s Regulations on Animal Experiments.
2.2. Specimen Collection and DNA Extraction
A total of 589 captive and wild catfish specimens were collected from 16 locations in Thailand and Laos: research was conducted in three farmed North African catfish populations, four farmed bighead catfish populations, eight wild bighead catfish populations from Thailand, and one farmed bighead catfish population from Laos. Here we will briefly describe these samples, which included 3 North African (N = 256) and 13 bighead catfish populations (N = 333), and provide an additional information regarding sampling in Table S1. Tissue samples were collected from caudal fins (approximately 0.3 × 0.3 cm) of each individual, transferred into 1.5 mL tube containing 95% ethanol, and stored at 4 °C until use. Genomic DNA was isolated using the standard salting-out protocol, and its quality was assessed as described by Supikamolseni Et Al. [42].
2.3. PCR Amplification and IlluminaTM Short-Read Sequencing
Newly designed primers GH1_Catfish_F1 (5′-GAGCCTCGATAGAGTCCGA GT-3′) and GH1_Catfish_R1 (5′-TGTTACGACTTTGGCATTTCA-3′) were designed based on the sequences of North African catfish chromosome 28 (accession number: NC071127) targeting partial fragment of exon 2 to exon 3 of the GH1 gene. SNPs within this region were found to be related to growth traits in fish [43]. The forward primer was modified by adding 8 bp sample-specific barcode tag sequences at its 5′-end (Macrogen Inc., Seoul, Korea). The PCR was performed using the Apsalagen PCR kit (Apsalagen Co., Ltd., Bangkok, Thailand) with 50 ng of genomic DNA under the following cycling conditions: initial denaturation at 95 °C for 10 min; 40 cycles of 95 °C for 30 s, 60 °C for 30 s, and 72 °C for 30 s; and a final extension at 72 °C for 5 min. Successful amplification was assessed by 1.5% agarose gel electrophoresis. A total of 589 samples were analyzed, which were processed in seven sequencing sets, each comprising 92 uniquely barcoded samples. These pooled libraries were sent for paired-end short-read (2 × 250 bp) sequencing on an Illumina NovaSeq™ 6000 platform at Novogene Co., Ltd. (Singapore). A single, clearly defined band corresponding to the expected amplicon size was observed, confirming specific amplification of the target GH1 fragment. No nonspecific or additional bands, such as pseudogene or paralogous sequences, were detected.
2.4. Sequence Quality Control and Read Processing
Illumina paired-end reads were quality-assessed using FastQC v0.11.9 [44], retaining only reads with a Phred quality score (q) > 20. The AmpliSAS v1.0 pipeline [45] was employed for allele determination under the following parameters: minimum amplicon depth of 100, maximum of two alleles per individual, and degree of change criterion (DOC) based on sequencing depth. Remaining parameters followed default configurations as described by Lighten Et Al. [46]. Genotypes were classified as homozygous if a single dominant allele exceeded 80% frequency, or heterozygous if two distinct alleles were detected. Validated alleles were confirmed Via BLASTn (https://blast.ncbi.nlm.nih.gov/Blast.cgi) (accessed on 2 December 2024) tool in the Center for Biotechnology Information (NCBI) database. Sequences were aligned to the North African catfish GH1 reference gene (accession number: AF416488) using Geneious Prime v2023.0.4 (https://www.geneious.com). The aligned sequences were then translated into amino acid sequences to detect any premature stop codons. Given that some Clarias species can exhibit segmental polyploidy or gene duplication [47], allelic assignment and filtering parameters in AmpliSAS were adjusted to minimize possible artifacts arising from paralogous sequences, ensuring that only true alleles of the GH1 locus were retained.
2.5. Genetic Diversity and Data Analysis
Genetic diversity was evaluated by analyzing allelic frequency, number of alleles (Na), number of effective alleles (Ne), observed heterozygosity (Ho), expected heterozygosity (He), and fixation index within populations (F) using GenAlEx version 6.5 [48] and allelic richness (AR) was calculated in FSTAT version 2.9.3 [49]. Nucleotide diversity (π) was calculated using DnaSP version 6.12 [50]. To further explore the genetic structure, F-statistics (FIS and FST) for the GH1 gene were computed using FSTAT version 2.9.3 [51], as previously performed in Budi et al. [52,53]. Analysis of molecular variance (AMOVA) was carried out with Arlequin version 3.5.2.2 [54]. To visualize clusters of genetically related individuals, and discriminant analysis of principal components (DAPC) was performed in R version 4.3.2 [55] using the ADEGENET 2.0 package [56].
2.6. Phylogenetic Analysis
The GH1 gene sequences obtained in this study were combined with Siluriform catfish sequences retrieved from NCBI using the BLASTn tool (https://blast.ncbi.nlm.nih.gov/Blast.cgi). BLASTn searches were performed using thresholds of >70% sequence identity and >85% query coverage. The optimal substitution model was determined with ModelFinder [57] based on the lowest Bayesian Information Criterion value. A maximum likelihood phylogenetic tree was then constructed using IQ-TREE version 1.6.12 [58] to visualize the evolutionary relationships among GH1 gene alleles. Branch support was assessed Via ultrafast bootstrap analysis with 10,000 replicates, employing the Kimura 2-parameter (K2P) model for the GH1 dataset. The phylogenetic tree topology was visualized using Interactive Tree of Life v5 [59].
2.7. Selection Analysis
The type of selection acting on the catfish GH1 gene was assessed using the ratio of non-synonymous to synonymous substitution rates (dN/dS, ω). The dN/dS was calculated using the Nei–Gojobori method [60] with the Jukes–Cantor correction, implemented in Molecular Evolutionary Genetics Analysis version 11 (MEGA 11) [61]. An ω value close to 1 indicates neutral selection, a value greater than 1 suggests positive selection, and a value less than 1 reflects purifying selection. In addition, neutrality tests including Tajima’s D, Fu and Li’s F*, and Fu and Li’s D* were performed using DnaSP version 6.12 [50] to further characterize the selection mode. To investigate potential selective sweeps, expected heterozygosity (He) and the inbreeding coefficient (FIS) for the GH1 gene were plotted based on genotyping data; a high FIS combined with low He suggests a selective sweep or purifying selection, while a low FIS with high He indicates neutral or balanced selection [62].
2.8. Multiple Sequence Alignment of GH1 Amino Acid Residues
Reference sequences of the GH1 genes of different catfish species, Lanzhou catfish (Silurus lanzhouensis) (accession no. KM215221), blind catfish (Rhamdia quelen) (EF101341), yellowhead catfish (Tachysurus fulvidraco) (KU323395), channel catfish (Ictalurus punctatus) (AF267989 and S69215), iridescent shark catfish (Pangasianodon hypophthalmus) (JF303888 and HM137287), North African catfish (AF416488), Valencienne’s clariid (Clarias dussumieri) (HM485574), mudfish (Clarias anguillaris) (HM485573), and walking catfish (Clarias batrachus) (AF416486)], were retrieved from the NCBI using BLASTp (https://blast.ncbi.nlm.nih.gov/Blast.cgi). BLASTp analysis was performed in condition with thresholds of >60% sequence identity and >85% query coverage thresholds [63,64]. The amino acid residues of the GH1 gene alleles identified in this study and reference sequences of other catfish species were aligned using ClustalW in Geneious Prime version 2023.0.4 (https://www.geneious.com). The alignment was then trimmed to 35 residues, and a maximum likelihood phylogenetic tree was constructed with 10,000 ultrafast bootstraps, as previously described.
3. Results
3.1. Genetic Diversity and Population Structure of Catfish Based on GH1 Gene
The 210 bp partial fragments of the GH1 gene, ranging from the 3′ terminal region of exon 2 to the 5′ initial region of exon 3, were obtained from 589 individuals in three North African catfish and 13 bighead catfish populations (Table 1). The Cochrane-Armitage trend test (CATT) was employed, accounting for the relative frequencies within each category. The exact CATT has been demonstrated to be suitable for unbalanced sample sizes in 2 × C contingency tables. Thirty-three variable sites defining five newly identified alleles were observed in comparison to North African catfish GH1 reference sequence (accession number: AF416488) (Table S2). One allele (CFGH*06) was shared with previously reported North African catfish sequences (accession numbers AF416488 and JAQMYH010000021). Allele CFGH*01 was the most common allele in North African and bighead catfish populations. All variable sites were positioned within intron 2; therefore, these changes did not affect the amino acid composition of the GH1 gene. The mean Na value per population was 1.625 ± 0.221, and the mean π value was 0.044 (Table 1). Positive F-values were observed for NYK-CG-C, KSN1-CG-C, KSN2-CG-C, SNK1-CM-W, and SNK2-CM-W, whereas SNK3-CM-W and LAO-CM-C exhibited negative F values. The mean Ho and He values were 0.043 ± 0.023 and 0.059 ± 0.028, respectively. Among North African catfish populations examined, the highest He value (0.378) was expected and highest Ho value (0.273) was observed in KSN1-CG, whereas NYK-CG-C showed the lowest He and Ho values (0.179 and 0.129, respectively). In bighead catfish populations, the highest He value was observed in SNK2-CM-W, and the lowest value was observed in SNK3-CM-W. The overall mean pairwise comparison of Ho and He values was statistically significant (p < 0.05). However, a pairwise comparison of the Ho and He in each population could not be performed because of the absence of diversity (Ho = 0) in several populations and the use of a single locus in this study (Tables S3–S5). All populations conformed to Hardy–Weinberg equilibrium, excepted (KSN1-CG-C, SNK2-CM-W, SNK1-CM-W) were show significant ** (p < 0.01) and *** (p < 0.001), respectively. The mean AR value was 1.625 ± 0.221, and the mean Nea value was 1.082 ± 0.043. The mean FIS value was 0.271 ± 0.178, and the FST values ranged from −0.110 to 0.899 (Table S6). The pairwise FST values between populations were not significantly different. Interpretation of population genetic parameters (F, He, Ho, FIS, π, HWE) requires caution for populations with small sample sizes—SPB1-CM-W (N = 5), SPB2-CM-W (N = 3), NPT1-CM-W (N = 2), NPT2-CM-W (N = 2), NST1-CM-W (N = 3), and NST2-CM-C (N = 10) or limited genetic variability, such as SNK4-CM-C (N = 25), STN-CM-C (N = 25), and NST2-CM-C (N = 10) (Table 1).

Table 1.
Nucleotide sequence diversity in catfish populations in Thailand and Laos based on GH1 sequences.
Phylogenetic analysis based on maximum likelihood revealed well-supported clustering of GH1 alleles within the Clarias genus. The alleles derived from C. gariepinus and C. macrocephalus grouped with other Clarias species such as C. batrachus and C. dussumieri, distinct from outgroup taxa of other genera (e.g., Pangasianodon, Ictalurus, Silurus). This pattern indicates that GH1 alleles are genus-specific and supports the separation of the Clarias lineage from other Siluriformes. The tree topology (Figure 1) therefore reflects expected phylogenetic relationships based on previous nuclear and mitochondrial gene studies.
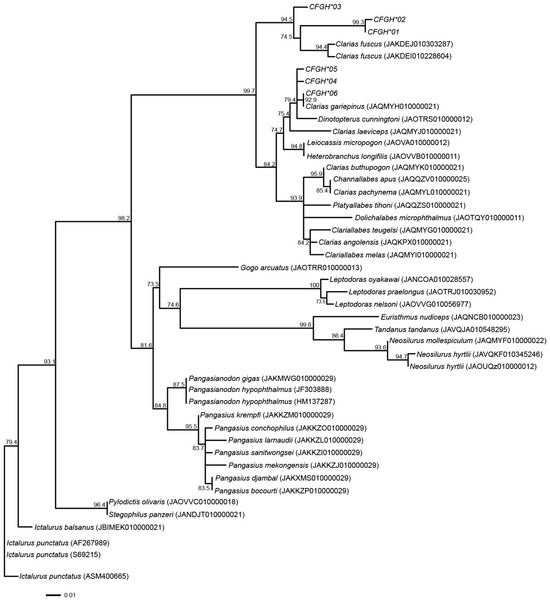
Figure 1.
Maximum likelihood phylogenetic tree based on GH1 gene alleles in catfish species. Values above branches represent bootstrap values.
3.2. Selection and Selective-Sweep Analyses of Catfish Species
Evidence of predominantly purifying selection was found in the GH1 gene in North African and bighead catfish populations. Selective-sweep analysis revealed balanced selection, in which relatively high He over FIS values in the KSN1-CG-C, KSN2-CG-C, and SNK3-CM-W populations are reflected. By contrast, the NYK-CG-C, SNK1-CM-W, and SNK2-CM-W populations exhibited higher FIS values than He, indicating that there were potential selective sweeps or purifying selection (Figure 2). However, a selective-sweep analysis could not be performed in most populations because FIS values were not determined in several populations. Neutrality tests of GH1 alleles revealed variations in Tajima’s D, Fu and Li’s D*, and Fu and Li’s F* values in North African and bighead catfish populations. Tajima’s D values ranged from −2.427 to 1.392 and were significant for the KSN1-CG-C, SNK1-CM-W, and SNK2-CM-W populations, whereas the values were not significant for the NYK-CG-C, KSN2-CG-C, SNK3-CM-W, SPB1-CM-W, and LAO-CM-C populations. The Fu and Li’s D* values ranging from −5.751 to 0.927 were insignificant for all populations except KSN1-CG-C and SNK1-CM-W. The Fu and Li’s F* values ranged from −5.170 to 1.038 and were insignificant for all populations except for KSN1-CG-C and SNK1-CM-W (Table 2). The GH1 gene had an average ω value of 1.024, ranging from 0.300 to 1.189), indicating the presence of weak purifying selection in Kalasin 1 (KSN1-CG-C) population. The minimum ω value (0.3) was observed in Laos (LAO-CM-C) population. The maximum ω value (0.189) was observed in Kalasin 1 (KSN1-CG-C) population. However, in some populations the value could not be calculated for GH1 sequences of North African and bighead catfish in Thailand and Laos, as no synonymous or nonsynonymous substitutions were observed in the regions of exons 2 and 3 examined (Table 3).
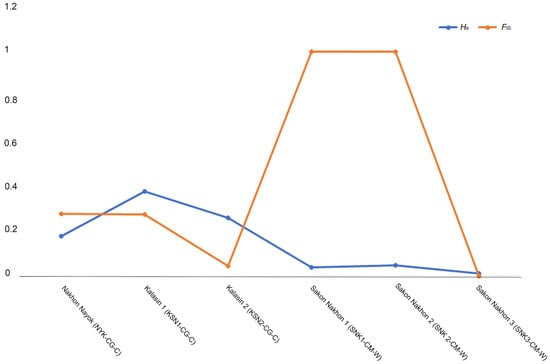
Figure 2.
Mapping of expected heterozygosity (He) against inbreeding coefficients (FIS) based on GH1 gene for catfish populations.
Table 2.
The results of neutrality test for the GH1 gene sequences in the North African and bighead catfish populations in Thailand and the bighead catfish population in Laos.
Table 3.
Rates of synonymous (dS) and nonsynonymous (dN) substitutions in nucleotide sequences of GH1 gene in Catfish populations.
3.3. Multiple Sequence Alignment of GH1 Amino Acid Residues and Prediction
The sequence identities of 35 amino acids of the GH1 gene with those of six alleles found in North African and bighead catfish populations examined in this study were 97.1% for blind catfish (R. quelen) (EF101341), yellowhead catfish (T. fulvidraco) (KU323395), and 100% for other seven catfish species, Lanzhou catfish (S. lanzhouensis) (accession no. KM215221), channel catfish (I. punctatus) (AF267989 and S69215), iridescent shark catfish (P. hypophthalmus) (JF303888 and HM137287), North African catfish (AF416488), Valencienne’s clariid (Clarias dussumieri) (HM485574), mudfish (Clarias anguillaris) (HM485573), and walking catfish (Clarias batrachus) (AF416486)] (Figure S2). This result indicates that the 35 amino acids are highly conserved in bighead catfish, North African catfish, and other catfish species. Similarly, maximum likelihood phylogenetic analysis based on amino acid residues revealed a monophyletic pattern of GH1 amino acid residues within seven catfish species (Figures S3 and S4).
4. Discussion
Forty-two alleles were identified in the exon 2-intron-exon 3 region of GH1 in 38 catfish species within Siluriform family, based on the number of species that could be matched using the BLASTn tool with the nucleotide sequences. Five new alleles that have not been observed in other fish species were identified in North African and bighead catfish population examined in this study. The GH1 genes in both North African and bighead catfish populations exhibited low genetic diversity, and the diversity was lower in the bighead catfish populations. This suggests that the long-term adaptability and persistence of the GH1 alleles should be considered in these catfish populations [65,66]. Potential selective sweeps were observed in the Nakhon Nayok population of North African catfish and in the Sakon Nakhon 1 and 2 populations of bighead catfish, which exhibited relatively higher FIS values than He values. Selective sweeps explain how neutral polymorphisms are pulled near advantageous mutations, leading to reduced genetic diversity [67]. Our previous study using microsatellite genotyping, however, did not reveal any evidence of selective sweeps in these populations [40]. Therefore, selection pressure in the GH1 gene may have affected allelic diversity in these three populations, resulting in an increase in their suitability to the environment. This is consistent with the highly conserved sequences found in partial exons 2 and 3 of GH1 in the present study. Similar results could be seen in the NYK-CG-C population, which exhibited only one allele. The small sample sizes of some catfish populations may have been biased in estimating genetic diversity and understanding selective sweeps, warranting cautious interpretation. Nevertheless, the sample sizes used in this study fall within the minimally acceptable range for assessing genetic diversity and population structure in animal studies [68,69]. A framework is provided indicating that the sampling effort is sufficient to yield reliable insights into genetic diversity and population structure. Given the logistical and ethical considerations, fish populations are typically clustered based on small nuclear genome fragments, with population genomics or phylogenetics methods used to describe the methodology or present case studies for population structure analysis [70]. Neutrality tests using Tajima’s D and Fu and Li’s D* showed mostly positive values, suggesting that the variations in catfish populations may not be solely attributable to selection [71].
Phylogenetic analysis indicated that the alleles identified in this study formed a clade with the alleles from different clariid catfish species, including Hong Kong catfish (C. fuscus) and Singa (Dinotopterus cunningtoni). This aligned with the species phylogenetic trees based on other nuclear gene markers, such as RAG1 and RAG2, and mitochondrial genome sequences [72,73]. This suggests the presence of lineage-specific alleles of GH1, although this result may have obtained by chance. Clustering analyses indicated that North African and bighead catfish populations were separated into different clusters across all K-values, except for the bighead catfish population from Laos. AMOVA revealed that the genetic variability of the GH1 gene between populations was greater than that within populations. This strongly suggests that the two clusters have distinct genetic origins based on the partial sequence of GH1. The bighead population from Laos, however, exhibited a gene pool pattern similar to that of North African catfish populations, in contrast to the bighead population examined in Thailand. The existence of gene pools shared between North African and bighead catfish indicate that breeding and artificial selection during domestication or natural selection may not have fully driven the divergence of gene pools. Alternatively, genetic admixture or introgression of North African catfish might have occurred in the bighead population of Laos, although DNA barcoding and morphological evidence are likely to indicate otherwise. The samples of the Laos population were sourced from the market, raising the possibility of misidentification or contamination of hybrid catfish, because of uncertainty in morphological classification of hybrids [74]. Further analysis, using additional samples collected from different populations in various countries, is required to confirm the selection mode and correlation of North African and bighead catfish with growth traits. This will also help determine whether the distinctive gene pool is lineage-specific or a result of chance.
GH1 expression is regulated by the pituitary-expressed transcription factor PIT1, which binds to the GH1 proximal promoter and several introns [75]. In cattle and fish, genetic variations in the GH1 intronic region are associated with productive traits [33,76,77]. An SNP in the first intron of the Nile tilapia GH1 gene is considered to be related to growth rate [33]. In humans, the GH1 gene consists of five exons and four introns, with relatively weak splice sites across introns 2 and 3, which potentially produce small amounts of smaller GH isoforms [78]. It remains unclear whether this intronic SNPs play a functional role in GH1 expression or whether they undergo linkage disequilibrium with another functional SNPs. The SNP clusters associated with high growth rates is based on the concept of haplotype blocks defined as functional SNP sites grouped into blocks [78]. Such haplotype blocks of functional SNPs are considered to have been derived from a common ancestor. These structures can be carefully organized into distinct blocks of haplotype diversity. A small fraction of SNPs in each block, known as tag SNPs, represents a significant portion of haplotypes, thereby the screening of these fractions reducing the need to genotype all SNPs in association studies and fine-scale mapping of complex traits [79]. The present populations of North African and bighead catfish examined in this study have been formed through their own genetic drift and artificial and natural selections during the process of domestication of captive individuals, resulting in their shared yet distinct haplotype blocks and gene pool patterns. Identifying such lineage-specific haplotypes is hence essential for characterizing and maintaining chromosomal region-specific gene pools. This haplotype analysis may also be used for estimating the variance for quantitative traits among closely related individuals in genome-wide association studies [79,80,81]. Genetic variations in the GH1 gene have been reported to be highly correlated with growth performance in fish species such as Nile tilapia, common carp, and Chinese lake gudgeons [32,76,82,83,84,85]. Gene interaction analyses in the current study, however, revealed no direct evidence that growth traits are linked to the intronic region of the GH1 gene in North African and bighead catfish populations [27].
Genetic improvements have been achieved in classical breeding by using phenotypic culling and pedigree information. Molecular-assisted breeding enhances the efficiency of improvement by QTL mapping or marker-assisted selection with polymorphic DNA markers, leading to the expedition of outcomes and enabling the precise and early identification of superior phenotypes [86]. Sequencing of full length GH1 gene containing five exons and four introns (approximately 1400 bp) poses challenges for short-read sequencing because short DNA fragments may underestimate genetic variation [87]. Sequence analysis using long-read sequencing technologies, such as Oxford Nanopore or PacBio, in larger cohort of catfish populations may validate these findings and enhance our understanding of GH1 gene polymorphisms and their effects on growth traits.
5. Conclusions
Polymorphisms of the GH1 genes of different catfish populations that are potentially related to growth performance were identified in this study. Six polymorphic alleles of the GH1 gene, which are potentially related to growth performance, were identified in North African and bighead catfish populations examined in this study. The GH1 gene, however, exhibited low diversity in the populations of both species. Two distinct genetic clusters, corresponding to North African and bighead catfish lineages, were identified, suggesting independent evolutionary origins of the species, except for the bighead catfish population in Laos. Furthermore, evidence of purifying selection was observed in some populations of both species. The finding of GH1 polymorphism in North African and bighead catfish populations in Thailand serves as an initial step in understanding the genetic basis of growth rates between the species. It facilitates the identification of selective markers for breeding programs and effective genetic management of breeding stock. The highly conserved exonic regions and highly variable intronic regions observed in both species, nonetheless, pose challenges. Therefore, further study focusing on the association of growth traits with the polymorphic intronic regions of the GH1 gene is required in North African and bighead catfish populations. Understanding the genetic basis of the GH1 gene on growth rates in catfish provides valuable insights for developing molecular breeding methods to improve the growth rate of the locally favored bighead catfish.
Supplementary Materials
The following supporting information can be downloaded at https://www.mdpi.com/article/10.3390/genes16111266/s1: Figure S1: Discriminant analysis of principal components (DAPC) of three North African catfish and 12 bighead catfish populations in Thailand and one bighead catfish population in Laos. Each population is plotted by different color; Figure S2: Alignment of partial amino acid sequences of the GH1 gene (35 amino acids), covering the 3′ terminal region of exon 2 and the 5′ initial region of exon 3, among six allelic sequences found for 16 catfish populations (Clarias gariepinus and C. macrocephalus) in Thailand and Laos and reference sequences of nine catfish species; Figure S3: GH1 protein secondary structure production in North African and bighead catfish species in Thailand and Laos; Figure S4: Maximum likelihood phylogenetic tree based on GH1 gene amino acid residues in catfish species. The length of bars represents substitution per site value; Table S1: Details of the catfish specimens used in this study; Table S2: Variable sites in the sequences of six GH1 alleles of North African and bighead catfish populations in Thailand and Laos; Table S3: Comparison of observed (Ho) and expected heterozygosity (He) of the GH1 gene in catfish populations; Table S4: Comparison of expected heterozygosity (He) of the GH1 gene between catfish populations; Table S5: Comparison of observed heterozygosity (Ho) of the GH1 gene between catfish populations; Table S6: Genetic differentiation between catfish populations in Thailand and Laos based on the GH1 sequences; Table S7: The results of Analysis of Molecular Variance (AMOVA) for 16 catfish populations in Thailand and Laos.
Author Contributions
Conceptualization: P.T., W.S., T.B. and K.S. (Kornsorn Srikulnath); data curation: P.T., P.C., C.P., W.J., W.S., T.B. and K.S. (Kornsorn Srikulnath); formal analysis: P.T., P.C., C.P., W.J., W.S., T.P., T.B., P.S., N.M., P.D., U.N.-N. and K.S. (Kornsorn Srikulnath); funding acquisition: K.S. (Kornsorn Srikulnath); investigation: P.T., T.B., O.S., A.A., Y.M. and K.S. (Kornsorn Srikulnath); methodology: P.T., P.C., C.P., W.J., T.B., K.S. (Kednapat Sriphairoj), S.H., P.S., N.M., O.S., D.K.G., A.A., P.D., U.N.-N., Y.M. and K.S. (Kornsorn Srikulnath); project administration; U.N.-N. and K.S. (Kornsorn Srikulnath); resource: K.S. (Kednapat Sriphairoj) and S.H.; supervision: P.S., U.N.-N., Y.M. and K.S. (Kornsorn Srikulnath); visualization: P.T., W.S., T.P., T.B. and K.S. (Kornsorn Srikulnath); writing—original draft; P.T., T.B. and K.S. (Kornsorn Srikulnath); writing—review and editing: P.T., P.C., C.P., W.J., W.S., T.P., T.B., K.S. (Kednapat Sriphairoj), S.H., P.S., N.M., O.S., D.K.G., A.A., P.D., U.N.-N., Y.M. and K.S. (Kornsorn Srikulnath). All authors have read and agreed to the published version of the manuscript.
Funding
This research has received funding support from the following: The Program Management Unit for Human Resources and Institutional Development and Innovation (PMU-B) (Contract No. B13F670053), awarded to W.S., T.P., N.M., P.D., and K.S.; the National Research Council of Thailand (NRCT): High-Potential Research Team Grant Program (contract number: N42A660605), awarded to W.S., T.P., N.M., P.D., and K.S.; the National Research Council of Thailand (NRCT) (Contract number: N42A650233), awarded to K.S.; grants from Betagro Group (no. 6501.0901.1/68), awarded to K.S.; a Postdoctoral Fellowship from Kasetsart University, awarded to T.P.; a grant from Kasetsart University Research and Development Institute (FF(S-KU)17.66, FF(KU)51.67, and FF(KU)61.69), awarded to W.S. and K.S.; the Office of the Ministry of Higher Education, Science, Research and Innovation; the Thailand Science Research and Innovation (TSRI) through the Kasetsart University Reinventing University Program 2025 (No. RUP_Climate68_No.9), awarded to W.S. and A.A.; and support from the International SciKU Branding (ISB), Faculty of Science, Kasetsart University, awarded to W.S. and K.S. No funding source was involved in the study design, collection, analysis, and interpretation of the data, writing of the report, or decision to submit the article for publication.
Institutional Review Board Statement
The animal study protocol was approved by the Institutional Review Board or Ethics Committee of Kasetsart University reviewed and approved (Approval Nos: ACKU65-SCI-003 (Comparative genomic of Clarias gariepinus and C. macrocephalus reveal the narrow position of economic gene trait for breeding programs; approval Date 2 February 2022), ACKU66-SCI-006 (Comparative genomic of Clarias gariepinus and C. macrocephalus reveal the narrow position of economic gene trait for breeding programs) (approval Date 7 April 2023), and ACKU66-SCI-014 (Enhanced breeding potential of catfish group (bighead catfish (Clarias macro-cephalus), North African catfish (Clarias gariepinus) and hybrid catfish (C. macrocephalus × C. gariepinus) can improve productivity and innovation as sustainable aquaculture; approval Date 30 May 2023).
Informed Consent Statement
Not applicable. This study does not involve human subjects or human-derived materials.
Data Availability Statement
The full dataset and metadata in this study are available from the Dryad Digital Repository (https://doi.org/10.5061/dryad.sbcc2frhz) (registered in the database on 15 January 2025). All sequences were deposited in the National Center for Biotechnology Information (NCBI) (https://www.ncbi.nlm.nih.gov/; accession number: PQ877069–PQ877074 (deposited on 14 January 2025).
Acknowledgments
The authors would like to thank Phu Sing Research and Training Center at Kalasin University and Betagro Fish Breeding Farm for helping us with sample collection. The authors thank the Center for Agricultural Biotechnology (CAB) at Kasetsart University, Kamphaeng Saen Campus and the National Science and Technology Development Agency (NSTDA) Supercomputer Center (ThaiSC) for supporting us with server analysis services. The authors also thank the Faculty of Science of Kasetsart University (no.6501.0901.1/336), and the Betagro Public Company Limited for providing research facilities.
Conflicts of Interest
The authors declare no conflicts of interest.
References
- Department of Fisheries. Fisheries Statistic of Thailand 2023; Department of Fisheries: Bangkok, Thailand, 2024; Available online: https://www4.fisheries.go.th/local/file_document/20240819161939_1_file.pdf (accessed on 20 January 2025).
- Wachirachaikarn, A.; Rungsin, W.; Srisapoome, P.; Na-Nakorn, U. Crossing of African catfish, Clarias gariepinus (Burchell, 1822), strains based on strain selection using genetic diversity data. Aquaculture 2009, 290, 53–60. [Google Scholar] [CrossRef]
- Chaivichoo, P.; Koonawootrittriron, S.; Chatchaiphan, S.; Srimai, W.; Na-Nakorn, U. Genetic components of growth traits of the hybrid between ♂ North African catfish (Clarias gariepinus Burchell, 1822) and ♀ bighead catfish (C. macrocephalus Günther, 1864). Aquaculture 2020, 521, 735082. [Google Scholar] [CrossRef]
- Lisachov, A.; Nguyen, D.H.M.; Panthum, T.; Ahmad, S.F.; Singchat, W.; Ponjarat, J.; Jaisamut, K.; Srisapoome, P.; Duengkae, P.; Hatachote, S.; et al. Emerging importance of bighead catfish (Clarias macrocephalus) and North African catfish (C. gariepinus) as a bioresource and their genomic perspective. Aquaculture 2023, 573, 739585. [Google Scholar] [CrossRef]
- Na-Nakorn, U.; Brummett, R.E. Use and exchange of aquatic genetic resources for food and aquaculture: Clarias catfish. Rev. Aquac. 2009, 1, 214–223. [Google Scholar] [CrossRef]
- Nukwan, S.; Tangtrongpiros, M.; Lawanyawut, K.; Veerasidth, P. Cross breeding between Clarias macrocephalus and Clarias gariepinus. In Proceedings of the 28th Kasetsart University Conference, Bangkok, Thailand, 30 January–2 February 1990; Ministry of Science, Technology and Energy: Bangkok, Thailand; pp. 553–567. [Google Scholar]
- Nukwan, S.; Lawanyawut, K.; Tangtrongpiros, M.; Veerasidth, P. Backcrossing experiment of hybrid between Clarias macrocephalus and Clarias gariepinus. In Proceedings of the 28th Kasetsart University Conference, Bangkok, Thailand, 30 January–2 February 1990; pp. 529–544. [Google Scholar]
- Na-Nakorn, U.; Kamonrat, W.; Ngamsiri, T. Genetic diversity of walking catfish, Clarias macrocephalus, in Thailand and evidence of genetic introgression from introduced farmed C. gariepinus. Aquaculture 2004, 240, 145–163. [Google Scholar] [CrossRef]
- Patta, C.; Panthum, T.; Thatukan, C.; Wongloet, W.; Chalermwong, P.; Wattanadilokchatkun, P.; Thong, T.; Srikampa, P.; Singchat, W.; Ahmad, S.F.; et al. Questioning inbreeding: Could outbreeding affect productivity in the North African catfish in Thailand? PLoS ONE 2024, 19, e0302584. [Google Scholar] [CrossRef]
- Ponjarat, J.; Singchat, W.; Monkheang, P.; Suntronpong, A.; Tawichasri, P.; Sillapaprayoon, S.; Ogawa, S.; Muangmai, N.; Baicharoen, S.; Peyachoknagul, S.; et al. Evidence of dramatic sterility in F1 male hybrid catfish [male Clarias gariepinus (Burchell, 1822) × female C. macrocephalus (Günther, 1864)] resulting from the failure of homologous chromosome pairing in meiosis I. Aquaculture 2019, 505, 84–91. [Google Scholar] [CrossRef]
- Dedukh, D.; Lisachov, A.; Panthum, T.; Singchat, W.; Matsuda, Y.; Imai, Y.; Janko, K.; Srikulnath, K. Meiotic deviations and endoreplication lead to diploid oocytes in female hybrids between bighead catfish (Clarias macrocephalus) and North African catfish (Clarias gariepinus). Front. Cell Dev. Biol. 2024, 12, 1465335. [Google Scholar] [CrossRef]
- Office of Agricultural Economics. The Ministry of Agriculture Approved the Forecast of Agricultural Production in the Year 2023/24; Office of Agricultural Economics: Bangkok, Thailand, 2024; Available online: https://www.oae.go.th/ (accessed on 20 January 2025).
- Na-Nakorn, U. A perspective on breeding and genetics of walking catfish in Thailand. Sustain. Aquac. 2004, 9, 10–12. [Google Scholar]
- Senanan, W.; Kapuscinski, A.R.; Na-Nakorn, U.; Miller, L.M. Genetic impacts of hybrid catfish farming (Clarias macrocephalus × C. gariepinus) on native catfish populations in central Thailand. Aquaculture 2004, 235, 167–184. [Google Scholar] [CrossRef]
- Chalermwong, P.; Panthum, T.; Singchat, W.; Budi, T.; Tanglertpaibul, N.; Muangmai, N.; Chaiyes, A.; Duengkae, P.; Srikulnath, K. Is it correct that “Hybrid catfish” only produced by hybridization between bighead and North African catfish. Sarawit Sar. 2024, 133, 55–60. Available online: https://waa.inter.nstda.or.th/stks/pub/ebook/sarawit-pdf/Sarawit-Issue133.pdf (accessed on 23 December 2024).
- Rey, J.; Singchat, W.; Jaito, W.; Punthum, T.; Lisachov, A.; Pongsanarm, T.; Thatukan, C.; Wongloet, W.; Budi, T.; Chalermwong, P.; et al. Near-stop in spermatogonia progression and reduced sperm motility in two testis forms of captive North African catfish in Kalasin, Thailand. Aquaculture 2024, 595, 741646. [Google Scholar] [CrossRef]
- FAO. Clarias gariepinus Burchell, 1822. In Fisheries and Aquaculture; Food and Agriculture Organization of the United Nations: Rome, Italy, 2024; Available online: https://www.fao.org/fishery/en/aqspecies/2982/en (accessed on 13 January 2025).
- Aboukila, R.S.; Hemeda, S.A.E.; El Nahas, A.F.; Abd El Naby, W.S.H. Molecular characterization of GHR1 gene and expression analysis of some growth-related genes in Oreochromis niloticus. Adv. Anim. Vet. Sci. 2021, 9, 1025–1033. [Google Scholar] [CrossRef]
- Nebo, C.; Portella, M.C.; Carani, F.R.; de Almeida, F.L.A.; Padovani, C.R.; Carvalho, R.F.; Dal-Pai-Silva, M. Short periods of fasting followed by refeeding change the expression of muscle growth-related genes in juvenile Nile tilapia (Oreochromis niloticus). Comp. Biochem. Physiol. B 2013, 164, 268–274. [Google Scholar] [CrossRef]
- Fuentes, E.N.; Valdés, J.A.; Molina, A.; Björnsson, B.T. Regulation of skeletal muscle growth in fish by the growth hormone–insulin-like growth factor system. Gen. Comp. Endocrinol. 2013, 192, 136–148. [Google Scholar] [CrossRef]
- Dias, M.A.D.; Reis Neto, R.V.; Bueno Filho, J.S.d.S.; Jaser, S.K.K.; de Lago, A.; Hilsdorf, A.W.S. Growth hormone gene polymorphism associated with grow-out performance of Oreochromis niloticus strains. Aquaculture 2019, 503, 105–110. [Google Scholar] [CrossRef]
- Teng, T.; Zhao, X.; Li, C.; Guo, J.; Wang, Y.; Pan, C.; Liu, E.; Ling, Q. Cloning and expression of IGF-I, IGF-II, and GHR genes and the role of their single-nucleotide polymorphisms in the growth of pikeperch (Sander lucioperca). Aquac. Int. 2020, 28, 1547–1561. [Google Scholar] [CrossRef]
- Vélez, E.J.; Nasri, A.; Unniappan, S. Nesfatin-1 and nesfatin-1-like peptide suppress basal and TRH-induced expression of prolactin and prolactin regulatory element-binding protein mRNAs in rat GH3 somatolactotrophs. Mol. Cell. Endocrinol. 2021, 529, 111269. [Google Scholar] [CrossRef]
- Vélez, E.J.; Unniappan, S. A comparative update on the neuroendocrine regulation of growth hormone in vertebrates. Front. Endocrinol. 2021, 11, 614981. [Google Scholar] [CrossRef]
- Ho, W.K.K.; Wong, M.W.; Chan, A.P.Y. Cloning and sequencing of the grass carp (Ctenopharyngodon idellus) growth hormone gene. Biochim. Biophys. Acta 1991, 1090, 245–248. [Google Scholar] [CrossRef]
- Almuly, R.; Cavari, B.; Ferstman, H.; Kolodny, O.; Funkenstein, B. Genomic structure and sequence of the gilthead seabream (Sparus aurata) growth hormone-encoding gene: Identification of minisatellite polymorphism in intron I. Genome 2000, 43, 836–845. [Google Scholar] [CrossRef] [PubMed]
- Pinheiro, J.S.; Wolff, J.L.C.; Araújo, R.C.; Hilsdorf, A.W.S. Molecular cloning and sequence analysis of growth hormone cDNA of Neotropical freshwater fish pacu (Piaractus mesopotamicus). Genet. Mol. Biol. 2008, 31, 381–384. [Google Scholar] [CrossRef]
- McKay, S.J.; Trautner, J.; Smith, M.J.; Koop, B.F.; Devlin, R.H. Evolution of duplicated growth hormone genes in autotetraploid salmonid fishes. Genome 2004, 47, 714–723. [Google Scholar] [CrossRef] [PubMed]
- Figueroa, J.; Martin, R.S.; Flores, C.; Grothusen, H.; Kausel, G. Seasonal modulation of growth hormone mRNA and protein levels in carp pituitary: Evidence for two expressed genes. J. Comp. Physiol. B 2005, 175, 185–192. [Google Scholar] [CrossRef]
- Kocour, M.; Kohlmann, K. Growth hormone gene polymorphisms in tench, Tinca tinca L. Aquaculture 2011, 310, 298–304. Aquaculture 2011, 310, 298–304. [Google Scholar] [CrossRef]
- Ali, R.A.R.S.; Attee, R.S.; Radhi, A.G. Association between the growth hormone gene GH-1 and growth indicators of common carp Cyprinus carpio L. in three different ecosystems. IOP Conf. Ser. Earth Environ. Sci. 2023, 1225, 012033. [Google Scholar] [CrossRef]
- Blanck, D.V.; Gasparino, E.; Ribeiro, R.P.; Marques, D.S. Polymorphism in the GH1-PstI gene associated to corporal characteristics in Nile tilapia strains. Pesqui. Agropecu. Bras. 2009, 44, 599–604. [Google Scholar] [CrossRef]
- Leggatt, R.A.; Biagi, C.A.; Smith, J.L.; Devlin, R.H. Growth of growth hormone transgenic coho salmon Oncorhynchus kisutch is influenced by construct promoter type and family line. Aquaculture 2012, 356, 193–199. [Google Scholar] [CrossRef]
- Nasaruddin, K.; Majumdar, K.C. Clarias gariepinus Growth Hormone Gene (Genomic) Complete CDS. National Center for Biotechnology Information. Available online: https://www.ncbi.nlm.nih.gov/nuccore/AF416488 (accessed on 13 February 2025).
- Poen, S.; Pornbanlualap, S. Growth hormone from striped catfish (Pangasianodon hypophthalmus): Genomic organization, recombinant expression and biological activity. Gene 2013, 518, 316–324. [Google Scholar] [CrossRef]
- Duong, T.Y.; Scribner, K.T. Regional variation in genetic diversity between wild and cultured populations of bighead catfish (Clarias macrocephalus) in the Mekong Delta. Fish. Res. 2018, 207, 118–125. [Google Scholar] [CrossRef]
- Wachirachaikarn, A.; Na-Nakorn, U. Genetic diversity of the North African catfish, Clarias gariepinus (Burchell, 1822) hatchery stocks in Thailand. Sci. Asia 2019, 45, 301. [Google Scholar] [CrossRef]
- Nazia, A.K.; Tam, B.M.; Jamaluddin, J.A.F.; Mohd Nor, S.A. High genetic structure between natural populations of bighead catfish Clarias macrocephalus (Günther, 1864) from the Mekong Delta and Peninsular Malaysia. Fish. Res. 2021, 241, 105993. [Google Scholar] [CrossRef]
- Nguyen, D.H.M.; Ponjarat, J.; Laopichienpong, N.; Panthum, T.; Singchat, W.; Ahmad, S.F.; Kraichak, E.; Muangmai, N.; Duengkae, P.; Peyachoknagul, S.; et al. Genome-wide SNP analysis of hybrid clariid fish reflects the existence of polygenic sex determination in the lineage. Front. Genet. 2022, 13, 789573. [Google Scholar] [CrossRef]
- Patta, C.; Sriphairoj, K.; Budi, T.; Quanoo, D.K.; Nguyen, T.H.D.; Jaito, W.; Chalermwong, P.; Pongsanarm, T.; Thatukan, C.; Wongloet, W.; et al. Genetic structural changes while maintaining effective population size of bighead catfish in Nong Han Lake: Implications of metapopulation dynamics or release activities. Fish. Manag. Ecol. 2024, 31, 11–25. [Google Scholar] [CrossRef]
- Supikamolseni, A.; Ngaoburanawit, N.; Sumontha, M.; Chanhome, L.; Suntrarachun, S.; Peyachoknagul, S.; Srikulnath, K. Molecular barcoding of venomous snakes and species-specific multiplex PCR assay to identify snake groups for which antivenom is available in Thailand. Genet. Mol. Res. 2015, 14, 13981–13997. [Google Scholar] [CrossRef] [PubMed]
- Wringe, B.F.; Devlin, R.H.; Ferguson, M.M.; Moghadam, H.K.; Sakhrani, D.; Danzmann, R.G. Growth-related quantitative trait loci in domestic and wild rainbow trout (Oncorhynchus mykiss). BMC Genet. 2010, 11, 63. [Google Scholar] [CrossRef] [PubMed]
- Andrews, S. FastQC: A Quality Control Tool for High Throughput Sequence Data; 2010. Available online: http://www.bioinformatics.babraham.ac.uk/projects/fastqc/ (accessed on 15 July 2024).
- Sebastian, A.; Herdegen, M.; Migalska, M.; Radwan, J. Amplisas: A web server for multilocus genotyping using next--generation amplicon sequencing data. Mol. Ecol. Resour. 2016, 16, 498–510. [Google Scholar] [CrossRef]
- Lighten, J.; van Oosterhout, C.; Bentzen, P. Critical review of NGS analyses for de novo genotyping multigene families. Mol. Ecol. 2014, 23, 3957–3972. [Google Scholar] [CrossRef]
- Peakall, R.; Smouse, P.E. GenAlEx 6.5: Genetic analysis in Excel. Population genetic software for teaching and research—An update. Bioinformatics 2012, 28, 2537–2539. [Google Scholar] [CrossRef]
- Normala, J.; Okomoda, V.T.; Mohd, A.A.; Nur, A.A.; Abol-Munafi, A.B.; Md Sheriff, S. Genetic Variation between Triploid and Diploid Clarias gariepinus (Burchell, 1822) Using RAPD Markers. Vet. Sci. 2021, 8, 75. [Google Scholar] [CrossRef]
- Goudet, J. FSTAT (version 1.2): A computer program to calculate F-statistics. J. Hered. 1995, 86, 485–486. [Google Scholar] [CrossRef]
- Rozas, J.; Ferrer-Mata, A.; Sánchez-DelBarrio, J.C.; Guirao-Rico, S.; Librado, P.; Ramos-Onsins, S.E.; Sánchez-Gracia, A. DnaSP 6: DNA sequence polymorphism analysis of large data sets. Mol. Biol. Evol. 2017, 34, 3299–3302. [Google Scholar] [CrossRef] [PubMed]
- Budi, T.; Kumnan, N.; Singchat, W.; Chalermwong, P.; Thong, T.; Wongloet, W.; Faniriharisoa Maxime Toky, R.; Pathomvanich, P.; Panthum, T.; Wattanadilokchatkun, P.; et al. Weak purifying selection in allelic diversity of the ADSL gene in indigenous and local chicken breeds and red junglefowl in Thailand. Gene 2024, 923, 148587. [Google Scholar] [CrossRef] [PubMed]
- Budi, T.; Singchat, W.; Tanglertpaibul, N.; Wongloet, W.; Chaiyes, A.; Ariyaraphong, N.; Thienpreecha, W.; Wannakan, W.; Mungmee, A.; Thong, T.; et al. Thai local chicken breeds, Chee Fah and Fah Luang, originated from Chinese black-boned chicken with introgression of red junglefowl and domestic chicken breeds. Sustainability 2023, 15, 6878. [Google Scholar] [CrossRef]
- Excoffier, L.; Lischer, H.E.L. Arlequin suite ver 3.5: A new series of programs to perform population genetics analyses under Linux and Windows. Mol. Ecol. Resour. 2010, 10, 564–567. [Google Scholar] [CrossRef]
- Pritchard, J.K.; Stephens, M.; Donnelly, P. Inference of population structure using multilocus genotype data. Genetics 2000, 155, 945–959. [Google Scholar] [CrossRef]
- Li, Y.L.; Liu, J.X. StructureSelector: A web-based software to select and visualize the optimal number of clusters using multiple methods. Mol. Ecol. Resour. 2018, 18, 176–177. [Google Scholar] [CrossRef]
- R Core Team. R: A Language and Environment for Statistical Computing; R Foundation for Statistical Computing: Vienna, Austria, 2023. [Google Scholar]
- Jombart, T.; Devillard, S.; Dufour, A.B.; Pontier, D. Revealing cryptic spatial patterns in genetic variability by a new multivariate method. Heredity 2008, 101, 92–103. [Google Scholar] [CrossRef]
- Kalyaanamoorthy, S.; Minh, B.Q.; Wong, T.K.F.; von Haeseler, A.; Jermiin, L.S. ModelFinder: Fast model selection for accurate phylogenetic estimates. Nat. Methods 2017, 14, 587–589. [Google Scholar] [CrossRef]
- Trifinopoulos, J.; Nguyen, L.T.; von Haeseler, A.; Minh, B.Q. W-IQ-TREE: A fast online phylogenetic tool for maximum likelihood analysis. Nucleic Acids Res. 2016, 44, W232–W235. [Google Scholar] [CrossRef]
- Letunic, I.; Bork, P. Interactive Tree of Life (iTOL) v5: An online tool for phylogenetic tree display and annotation. Nucleic Acids Res. 2021, 49, W293–W296. [Google Scholar] [CrossRef]
- Nei, M.; Gojobori, T. Simple methods for estimating the numbers of synonymous and nonsynonymous nucleotide substitutions. Mol. Biol. Evol. 1986, 3, 418–426. [Google Scholar] [CrossRef]
- Tamura, K.; Stecher, G.; Kumar, S. MEGA11: Molecular evolutionary genetics analysis version 11. Mol. Biol. Evol. 2021, 38, 3022–3027. [Google Scholar] [CrossRef] [PubMed]
- Reddy, U.K.; Abburi, L.; Abburi, V.L.; Saminathan, T.; Cantrell, R.; Vajja, V.G.; Reddy, R.; Tomason, Y.R.; Levi, A.; Wehner, T.C.; et al. A genome-wide scan of selective sweeps and association mapping of fruit traits using microsatellite markers in watermelon. J. Hered. 2015, 106, 166–176. [Google Scholar] [CrossRef] [PubMed]
- Pearson, W.R. BLAST and FASTA similarity searching for multiple sequence alignment. In Methods in Molecular Biology; Humana Press: New York, NY, USA, 2014; pp. 75–101. [Google Scholar]
- Meiklejohn, K.A.; Damaso, N.; Robertson, J.M. Assessment of BOLD and GenBank—Their accuracy and reliability for the identification of biological materials. PLoS ONE 2019, 14, e0217084. [Google Scholar] [CrossRef] [PubMed]
- Gulisija, D.; Kim, Y. Emergence of long-term balanced polymorphism under cyclic selection of spatially variable magnitude: Balanced polymorphism under cyclic selection. Evolution 2015, 69, 979–992. [Google Scholar] [CrossRef]
- Yeaman, S. Evolution of polygenic traits under global vs local adaptation. Genetics 2022, 220, iyab134. [Google Scholar] [CrossRef]
- Stephan, W. Selective sweeps. Genetics 2019, 211, 5–13. [Google Scholar] [CrossRef]
- Li, H.; Qu, W.; Obrycki, J.J.; Meng, L.; Zhou, X.; Chu, D.; Li, B. Optimizing sample size for population genomic study in a global invasive lady beetle, Harmonia axyridis. Insects 2020, 11, 290. [Google Scholar] [CrossRef]
- McLaughlin, J.F.; Winker, K. An empirical examination of sample size effects on population demographic estimates in birds using single nucleotide polymorphism (SNP) data. PeerJ 2020, 8, e9939. [Google Scholar] [CrossRef]
- Ward, R.D.; Zemlak, T.S.; Innes, B.H.; Last, P.R.; Hebert, P.D.N. DNA barcoding Australia’s fish species. Philos. Trans. R. Soc. Lond. B Biol. Sci. 2005, 360, 1847–1857. [Google Scholar] [CrossRef]
- Weigand, H.; Leese, F. Detecting signatures of positive selection in non-model species using genomic data. Zool. J. Linn. Soc. 2018, 184, 528–583. [Google Scholar] [CrossRef]
- Sullivan, J.P.; Lundberg, J.G.; Hardman, M. A phylogenetic analysis of the major groups of catfishes (Teleostei: Siluriformes) using rag1 and rag2 nuclear gene sequences. Mol. Phylogenet. Evol. 2006, 41, 636–662. [Google Scholar] [CrossRef] [PubMed]
- Kappas, I.; Vittas, S.; Pantzartzi, C.N.; Drosopoulou, E.; Scouras, Z.G. A time-calibrated mitogenome phylogeny of catfish (Teleostei: Siluriformes). PLoS ONE 2016, 11, e0166988. [Google Scholar] [CrossRef] [PubMed]
- Bohling, J.H.; Adams, J.R.; Waits, L.P. Evaluating the ability of Bayesian clustering methods to detect hybridization and introgression using an empirical red wolf data set. Mol. Ecol. 2013, 22, 74–86. [Google Scholar] [CrossRef] [PubMed]
- Millar, D.S.; Lewis, M.D.; Horan, M.; Newsway, V.; Rees, D.A.; Easter, T.E.; Pepe, G.; Rickards, O.; Norin, M.; Scanlon, M.F.; et al. Growth hormone (GH1) gene variation and the growth hormone receptor (GHR) exon 3 deletion polymorphism in a West-African population. Mol. Cell. Endocrinol. 2008, 296, 18–25. [Google Scholar] [CrossRef]
- Jaser, S.K.K.; Dias, M.A.D.; Lago, A.A.; Reis Neto, R.V.; Hilsdorf, A.W.S. Single nucleotide polymorphisms in the growth hormone gene of Oreochromis niloticus and their association with growth performance. Aquac. Res. 2017, 48, 5835–5845. [Google Scholar] [CrossRef]
- Saleh, A.A.; Hassan, T.G.M.; El-Hedainy, D.K.A.; El-Barbary, A.S.A.; Sharaby, M.A.; Hafez, E.E.; Rashad, A.M.A. IGF-I and GH genes polymorphism and their association with milk yields, composition and reproductive performance in Holstein-Friesian dairy cattle. BMC Vet. Res. 2024, 20, 341. [Google Scholar] [CrossRef]
- Ryther, R.C.C.; Flynt, A.S.; Harris, B.D.; Phillips, J.A.; Patton, J.G. GH1 splicing is regulated by multiple enhancers whose mutation produces a dominant-negative GH isoform that can be degraded by allele-specific small interfering RNA (siRNA). Endocrinology 2004, 145, 2988–2996. [Google Scholar] [CrossRef]
- Zhang, K.; Qin, Z.S.; Liu, J.S.; Chen, T.; Waterman, M.S.; Sun, F. Haplotype block partitioning and tag SNP selection using genotype data and their applications to association studies. Genome Res. 2004, 14, 908–916. [Google Scholar] [CrossRef]
- Ong, R.T.H.; Liu, X.; Poh, W.T.; Sim, X.; Chia, K.S.; Teo, Y.Y. A method for identifying haplotypes carrying the causative allele in positive natural selection and genome-wide association studies. Bioinformatics 2011, 27, 822–828. [Google Scholar] [CrossRef] [PubMed]
- Ao, X.; Rong, Y.; Han, M.; Wang, X.; Xia, Q.; Shang, F.; Liu, Y.; Lu, Q.; Wang, Z.; Su, R.; et al. Combined genome-wide association study and haplotype analysis identifies candidate genes affecting growth traits of Inner Mongolian cashmere goats. Vet. Sci. 2024, 11, 428. [Google Scholar] [CrossRef] [PubMed]
- Bu, L.; Wang, Y.; Tan, L.; Wen, Z.; Hu, X.; Zhang, Z.; Zhao, Y. Haplotype analysis incorporating ancestral origins identified novel genetic loci associated with chicken body weight using an advanced intercross line. Genet. Sel. Evol. 2024, 56, 78. [Google Scholar] [CrossRef] [PubMed]
- Tanamati, F.; da Silva, S.C.C.; Rodriguez, M.D.P.R.; Schuroff, G.P.; Nascimento, C.S.D.; Del Vesco, A.P.; Gasparino, E. GHR and IGF-I gene expression and production characteristics associated with GH gene polymorphism in Nile tilapia. Aquaculture 2015, 435, 195–199. [Google Scholar] [CrossRef]
- Hu, X.; Li, C.; Luan, P.; Ge, Y.; Jia, Z.; Zhang, Q.; Shi, L. A novel diplotype in the GH gene associated with body weight traits around the first overwintering period in common carp (Cyprinus carpio L.) cultured in Northeast China. Aquaculture 2019, 511, 734214. [Google Scholar] [CrossRef]
- Zhu, C.; Pan, Z.; Chang, G.; Wang, H.; Ding, H.; Wu, N.; Qiang, X.; Yu, X.; Wang, L.; Zhang, J. Polymorphisms of the growth hormone gene and their association with growth traits and sex in Sarcocheilichthys sinensis. Mol. Genet. Genom. 2020, 295, 1477–1488. [Google Scholar] [CrossRef]
- Yu, X.; Joshi, R.; Gjøen, H.M.; Lv, Z.; Kent, M. Construction of genetic linkage maps from a hybrid family of large yellow croaker (Larimichthys crocea). Front. Genet. 2021, 12, 792666. [Google Scholar] [CrossRef]
- Mukherjee, K.; Storici, F. A mechanism of gene amplification driven by small DNA fragments. PLoS Genet. 2019, 13, e1003119. [Google Scholar] [CrossRef]
Disclaimer/Publisher’s Note: The statements, opinions and data contained in all publications are solely those of the individual author(s) and contributor(s) and not of MDPI and/or the editor(s). MDPI and/or the editor(s) disclaim responsibility for any injury to people or property resulting from any ideas, methods, instructions or products referred to in the content. |
© 2025 by the authors. Licensee MDPI, Basel, Switzerland. This article is an open access article distributed under the terms and conditions of the Creative Commons Attribution (CC BY) license (https://creativecommons.org/licenses/by/4.0/).