
Maximal Fat Oxidation During Exercise in Healthy Individuals: Lack of Genetic Association with the FTO rs9939609 Polymorphism

 ,
,  and
and 
Abstract

1. Introduction
2. Materials and Methods
2.1. Participants
2.2. Sample Size Calculation
2.3. Experimental Design
2.4. Experimental Protocol
2.5. Statistical Analysis
3. Results
3.1. Whole Group
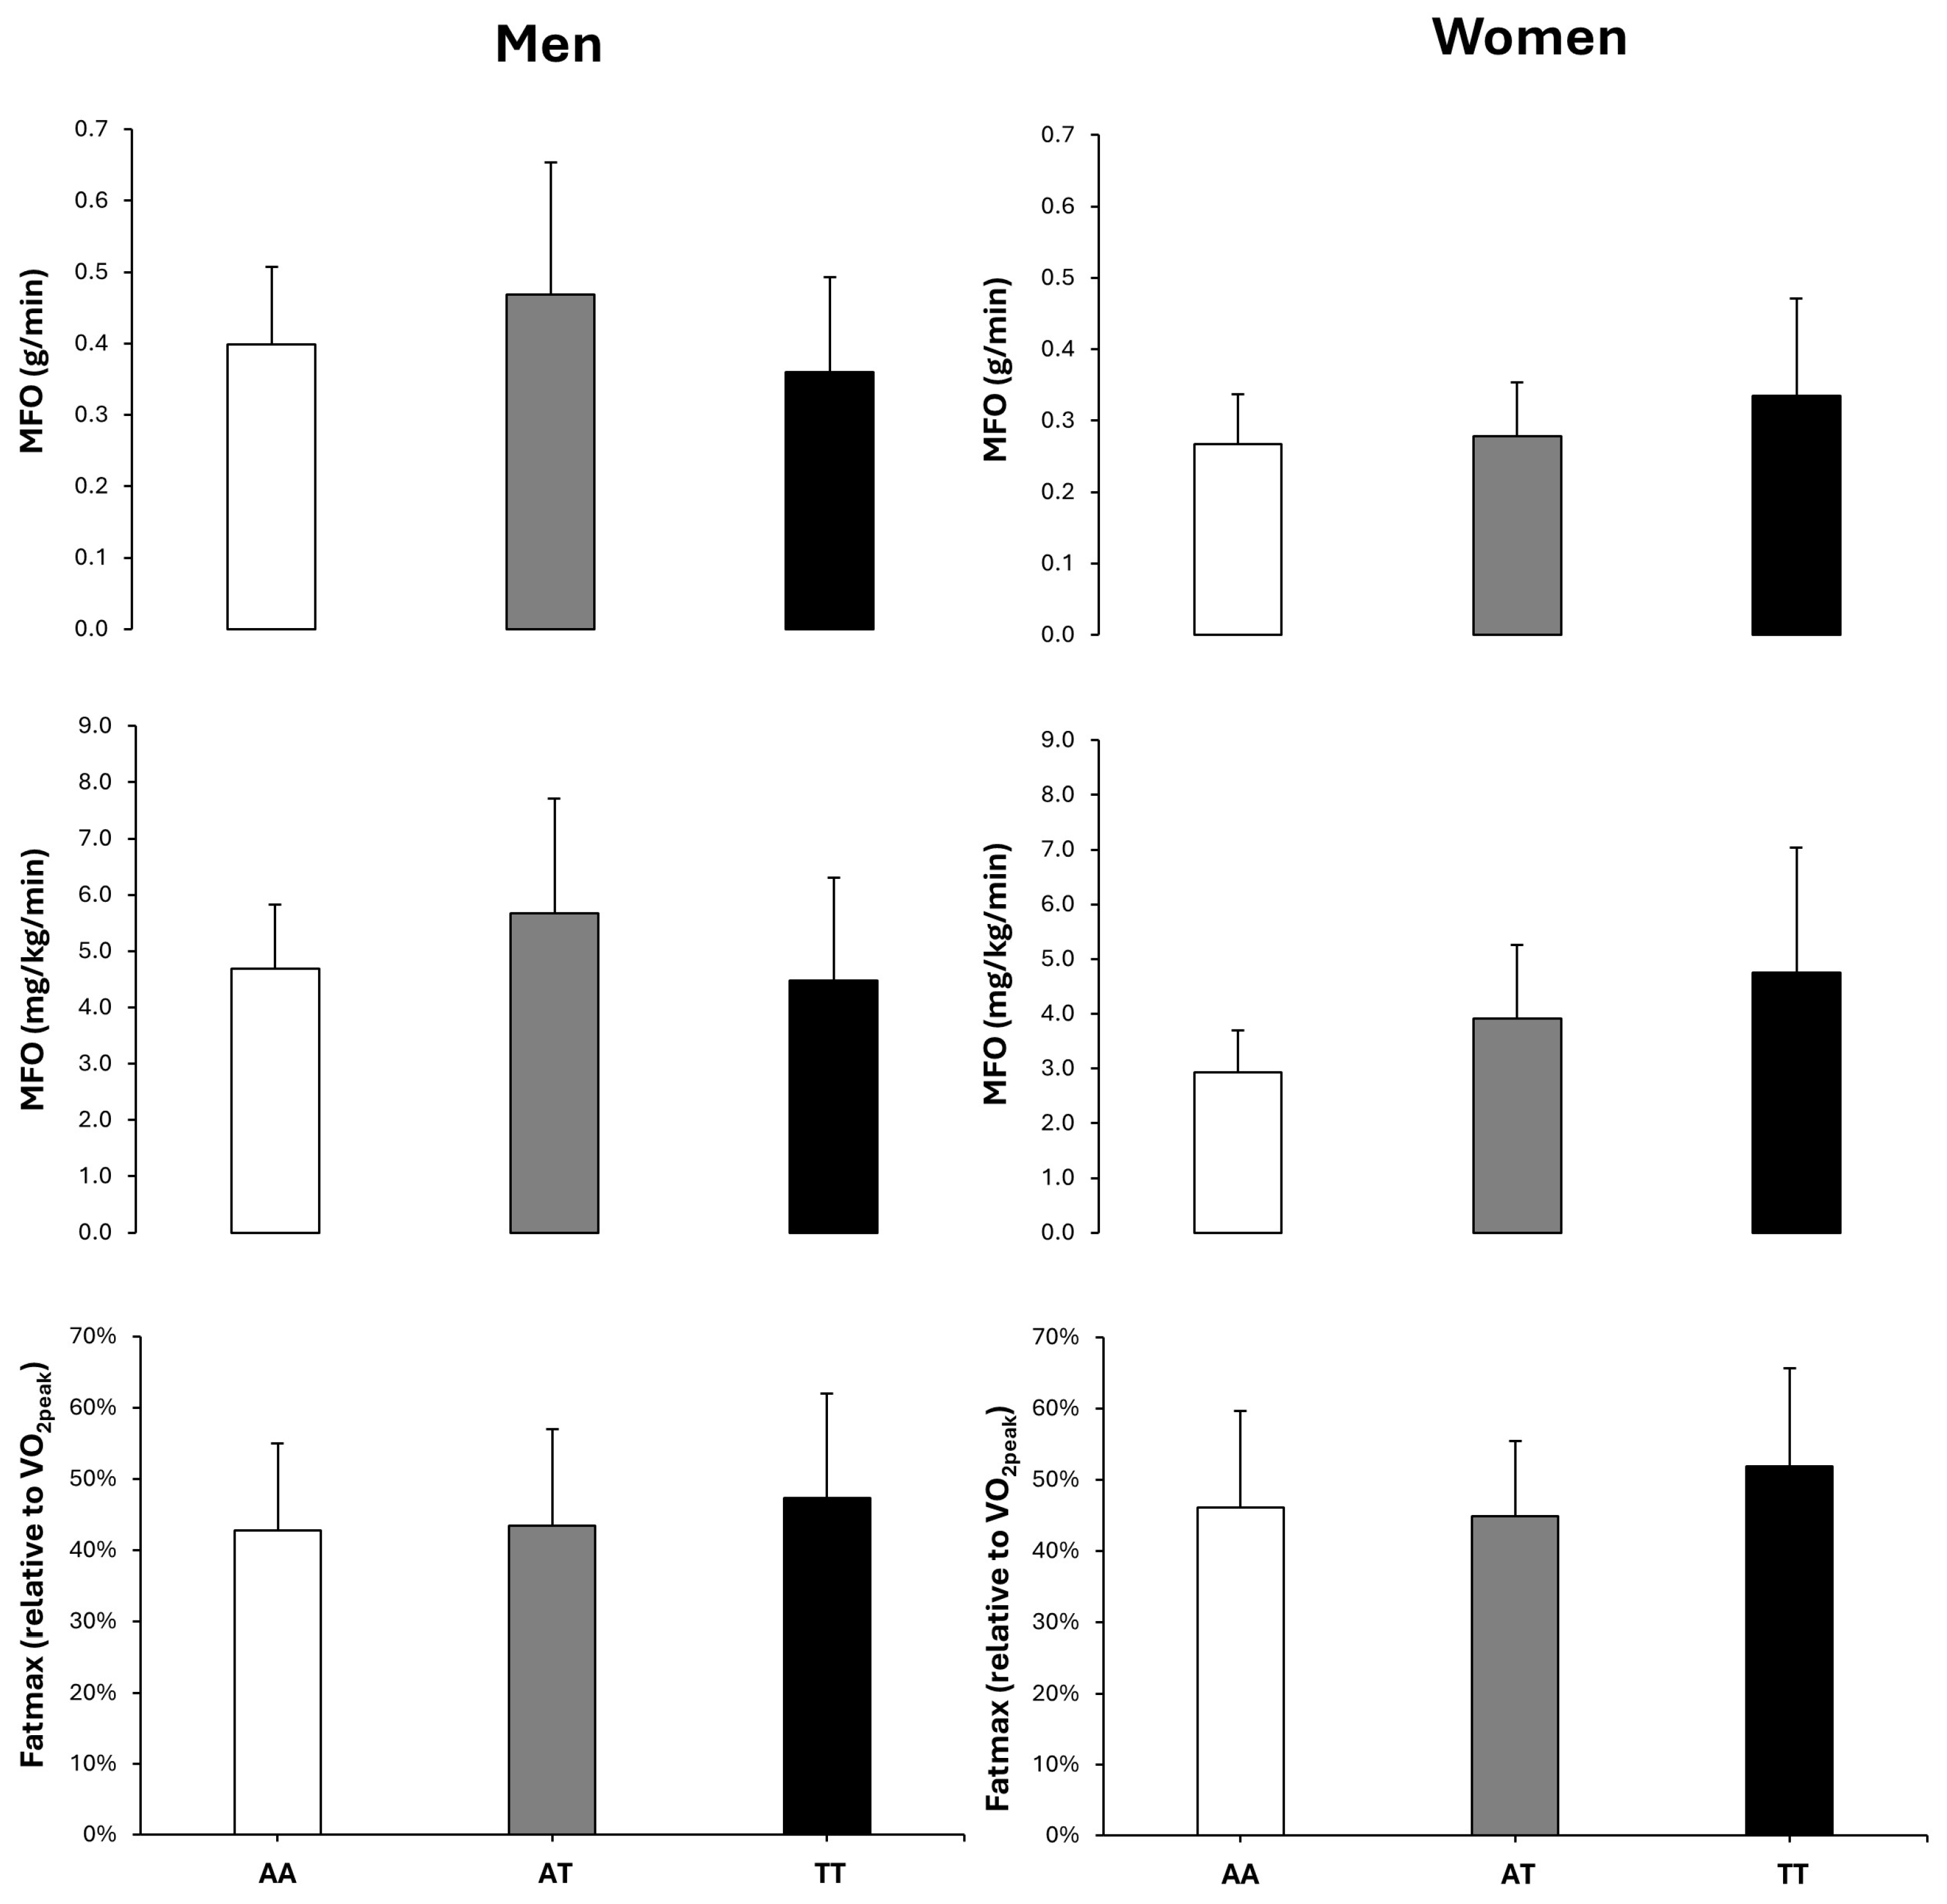
3.2. Sex × Genotype Interaction
4. Discussion
5. Conclusions
Author Contributions
Funding
Institutional Review Board Statement
Informed Consent Statement
Data Availability Statement
Acknowledgments
Conflicts of Interest
References
- The Challenge of Obesity. Available online: https://www.who.int/europe/news-room/fact-sheets/item/the-challenge-of-obesity?utm_source=chatgpt.com (accessed on 1 December 2024).
- Bozkurt, B.; Aguilar, D.; Deswal, A.; Dunbar, S.B.; Francis, G.S.; Horwich, T.; Jessup, M.; Kosiborod, M.; Pritchett, A.M.; Ramasubbu, K.; et al. Contributory Risk and Management of Comorbidities of Hypertension, Obesity, Diabetes Mellitus, Hyperlipidemia, and Metabolic Syndrome in Chronic Heart Failure: A Scientific Statement from the American Heart Association. Circulation 2016, 134, e535–e578. [Google Scholar] [CrossRef] [PubMed]
- Petkeviciene, J.; Smalinskiene, A.; Klumbiene, J.; Petkevicius, V.; Kriaucioniene, V.; Lesauskaite, V. Physical Activity, but Not Dietary Intake, Attenuates the Effect of the FTO Rs9939609 Polymorphism on Obesity and Metabolic Syndrome in Lithuanian Adult Population. Public Health 2016, 135, 23–29. [Google Scholar] [CrossRef] [PubMed]
- Archer, E.; Lavie, C.J.; Hill, J.O. The Contributions of “Diet”, “Genes”, and Physical Activity to the Etiology of Obesity: Contrary Evidence and Consilience. Prog。 Cardiovasc. Dis. 2018, 61, 89–102. [Google Scholar] [CrossRef] [PubMed]
- Schutz, Y.; Tremblay, A.; Weinsier, R.L.; Nelson, K.M. Role of Fat Oxidation in the Long-Term Stabilization of Body Weight in Obese Women. Am. J. Clin. Nutr. 1992, 55, 670–674. [Google Scholar] [CrossRef]
- Ranneries, C.; Bülow, J.; Buemann, B.; Christensen, N.J.; Madsen, J.; Astrup, A. Fat Metabolism in Formerly Obese Women. Am. J. Physiol. Endocrinol. Metab. 1998, 274, E155–E161. [Google Scholar] [CrossRef]
- Lanzi, S.; Codecasa, F.; Cornacchia, M.; Maestrini, S.; Salvadori, A.; Brunani, A.; Malatesta, D. Fat Oxidation, Hormonal and Plasma Metabolite Kinetics during a Submaximal Incremental Test in Lean and Obese Adults. PLoS ONE 2014, 9, e88707. [Google Scholar] [CrossRef]
- Maunder, E.; Plews, D.J.; Kilding, A.E. Contextualising Maximal Fat Oxidation During Exercise: Determinants and Normative Values. Front. Physiol. 2018, 9, 599. [Google Scholar] [CrossRef]
- Goodpaster, B.H.; Wolfe, R.R.; Kelley, D.E. Effects of Obesity on Substrate Utilization during Exercise. Obes. Res. 2002, 10, 575–584. [Google Scholar] [CrossRef]
- Corpeleijn, E.; Petersen, L.; Holst, C.; Saris, W.H.; Astrup, A.; Langin, D.; MacDonald, I.; Martinez, J.A.; Oppert, J.M.; Polak, J.; et al. Obesity-Related Polymorphisms and Their Associations with the Ability to Regulate Fat Oxidation in Obese Europeans: The NUGENOB Study. Obesity 2010, 18, 1369–1377. [Google Scholar] [CrossRef]
- Ponce-Gonzalez, J.G.; Martínez-Ávila, Á.; Velázquez-Díaz, D.; Perez-Bey, A.; Gómez-Gallego, F.; Marín-Galindo, A.; Corral-Pérez, J.; Casals, C. Impact of the FTO Gene Variation on Appetite and Fat Oxidation in Young Adults. Nutrients 2023, 15, 2037. [Google Scholar] [CrossRef]
- Scuteri, A.; Sanna, S.; Chen, W.M.; Uda, M.; Albai, G.; Strait, J.; Najjar, S.; Nagaraja, R.; Orrú, M.; Usala, G.; et al. Genome-Wide Association Scan Shows Genetic Variants in the FTO Gene Are Associated with Obesity-Related Traits. PLoS Genet. 2007, 3, 1200–1210. [Google Scholar] [CrossRef] [PubMed]
- Peng, S.; Zhu, Y.; Xu, F.; Ren, X.; Li, X.; Lai, M. FTO Gene Polymorphisms and Obesity Risk: A Meta-Analysis. BMC Med. 2011, 9, 71. [Google Scholar] [CrossRef] [PubMed]
- Frayling, T.M.; Timpson, N.J.; Weedon, M.N.; Zeggini, E.; Freathy, R.M.; Lindgren, C.M.; Perry, J.R.B.; Elliott, K.S.; Lango, H.; Rayner, N.W.; et al. A Common Variant in the FTO Gene Is Associated with Body Mass Index and Predisposes to Childhood and Adult Obesity. Science 2007, 316, 889–894. [Google Scholar] [CrossRef]
- Speakman, J.R. The “Fat Mass and Obesity Related” (FTO) Gene: Mechanisms of Impact on Obesity and Energy Balance. Curr. Obes. Rep. 2015, 4, 73–91. [Google Scholar] [CrossRef]
- Graff, M.; Scott, R.A.; Justice, A.E.; Young, K.L.; Feitosa, M.F.; Barata, L.; Winkler, T.W.; Chu, A.Y.; Mahajan, A.; Hadley, D.; et al. Genome-Wide Physical Activity Interactions in Adiposity—A Meta-Analysis of 200,452 Adults. PLoS Genet. 2017, 13, e1006528. [Google Scholar] [CrossRef]
- Montes-de-Oca-García, A.; Perez-Bey, A.; Corral-Pérez, J.; Velázquez-Díaz, D.; Opazo-Díaz, E.; Fernandez-Santos, J.R.; Rebollo-Ramos, M.; Amaro-Gahete, F.J.; Cuenca-García, M.; Ponce-González, J.G. Maximal Fat Oxidation Capacity Is Associated with Cardiometabolic Risk Factors in Healthy Young Adults. Eur. J. Sport Sci. 2021, 21, 907–917. [Google Scholar] [CrossRef]
- Warburton, D.E.R.; Bredin, S.S.D.; Jamnik, V.K.; Gledhill, N. Validation of the PAR-Q+ and EPARmed-X+. Health Fit. J. Can. 2011, 4, 38–46. [Google Scholar] [CrossRef]
- Ruíz-Moreno, C.; Gutiérrez-Hellín, J.; González-García, J.; GiráLdez-Costas, V.; Brito de Souza, D.; Del Coso, J. Effect of Ambient Temperature on Fat Oxidation during an Incremental Cycling Exercise Test. Eur. J. Sport Sci. 2021, 21, 1140–1147. [Google Scholar] [CrossRef]
- Muñoz, A.; Aguilar-Navarro, M.; Ruiz-Moreno, C.; Varillas-Delgado, D.; Amaro-Gahete, F.J.; Gutiérrez-Hellín, J.; Del Coso, J.; López-Samanes, Á. Influence of the Time of Day in the Effect of Caffeine on Maximal Fat Oxidation during Exercise in Women: A Randomized, Crossover, Double-Blind, and Placebo-Controlled Study. Eur. J Appl. Physiol. 2024, 124, 849–859. [Google Scholar] [CrossRef]
- Papaioannou, T.G.; Protogerou, A.D.; Vrachatis, D.; Konstantonis, G.; Aissopou, E.; Argyris, A.; Nasothimiou, E.; Gialafos, E.J.; Karamanou, M.; Tousoulis, D.; et al. Mean Arterial Pressure Values Calculated Using Seven Different Methods and Their Associations with Target Organ Deterioration in a Single-Center Study of 1878 Individuals. Hypertens. Res. 2016, 39, 640–647. [Google Scholar] [CrossRef]
- Matthews, D.R.; Hosker, J.P.; Rudenski, A.S.; Naylor, B.A.; Treacher, D.F.; Turner, R.C. Homeostasis Model Assessment: Insulin Resistance and Beta-Cell Function from Fasting Plasma Glucose and Insulin Concentrations in Man. Diabetologia 1985, 28, 412–419. [Google Scholar] [CrossRef] [PubMed]
- Sambrook, J.; Russell, D.W. Molecular Cloning: A Laboratory Manual; Cold Spring Harbor Laboratory Press: Cold Spring Harbor, NY, USA, 2001; ISBN 0879693738. [Google Scholar]
- Marfell-Jones, M.; Olds, T.; Stewart, A.; Carter, J. International Standards for Anthropometric Assessment; International Society for the Advancement of Kinanthropometry (ISAK): Potchefstroom, South Africa, 2006. [Google Scholar]
- Carter, J.E.L. Part 1: The Heath-Carter Anthropometric Somatotype-Instruction Manual; TeP and ROSSCRAFT: Surrey, BA, Canada, 2002. [Google Scholar]
- Brouwer, E. On Simple Formulae for Calculating the Heat Expenditure and the Quantities of Carbohydrate and Fat Oxidized in Metabolism of Men and Animals, from Gaseous. Acta Physiol. Pharmacol. Neerl. 1957, 6, 795–802. [Google Scholar] [PubMed]
- Borg, G. Psychophysical Scaling with Applications in Physical Work and the Perception of Exertion Scand. J. Work Environ. Health 1990, 16, 55–58. [Google Scholar] [CrossRef] [PubMed]
- Edvardsen, E.; Hem, E.; Anderssen, S.A. End Criteria for Reaching Maximal Oxygen Uptake Must Be Strict and Adjusted to Sex and Age: A Cross-Sectional Study. PLoS ONE 2014, 9, e85276. [Google Scholar] [CrossRef]
- rs9939609 (SNP)—Population Genetics—Homo_sapiens—Ensembl Genome Browser 113. Available online: https://www.ensembl.org/Homo_sapiens/Variation/Phenotype?r=16:53786115-53787115;v=rs9939609;vdb=variation;vf=923521178 (accessed on 18 October 2024).
- Prakash, J.; Mittal, B.; Srivastava, A.; Awasthi, S.; Srivastava, N. Association of FTO Rs9939609 SNP with Obesity and Obesity- Associated Phenotypes in a North Indian Population. Oman. Med. J. 2016, 31, 99–106. [Google Scholar] [CrossRef]
- Gayoso-Diz, P.; Otero-González, A.; Rodriguez-Alvarez, M.X.; Gude, F.; García, F.; De Francisco, A.; Quintela, A.G. Insulin Resistance (HOMA-IR) Cut-off Values and the Metabolic Syndrome in a General Adult Population: Effect of Gender and Age: EPIRCE Cross-Sectional Study. BMC Endocr. Disord. 2013, 13, 47. [Google Scholar] [CrossRef]
- Liguori, R.; Labruna, G.; Alfieri, A.; Martone, D.; Farinaro, E.; Contaldo, F.; Sacchetti, L.; Pasanisi, F.; Buono, P. The FTO Gene Polymorphism (Rs9939609) Is Associated with Metabolic Syndrome in Morbidly Obese Subjects from Southern Italy. Mol. Cell. Probes. 2014, 28, 195–199. [Google Scholar] [CrossRef]
- Sonestedt, E.; Roos, C.; Gullberg, B.; Ericson, U.; Wirfält, E.; Orho-Melander, M. Fat and Carbohydrate Intake Modify the Association between Genetic Variation in the FTO Genotype and Obesity. Am. J. Clin. Nutr. 2009, 90, 1418–1425. [Google Scholar] [CrossRef]
- Hofker, M.; Wijmenga, C. A Supersized List of Obesity Genes. Nat. Genet. 2009, 41, 139–140. [Google Scholar] [CrossRef]
- Gao, Z.; Zha, X.; Li, M.; Xia, X.; Wang, S. Insights into the M6A Demethylases FTO and ALKBH5: Structural, Biological Function, and Inhibitor Development. Cell Biosci. 2024, 14, 108. [Google Scholar] [CrossRef]
- Yin, D.; Li, Y.; Liao, X.; Tian, D.; Xu, Y.; Zhou, C.; Liu, J.; Li, S.; Zhou, J.; Nie, Y.; et al. FTO: A Critical Role in Obesity and Obesity-Related Diseases. Br. J. Nutr. 2023, 130, 1657–1664. [Google Scholar] [CrossRef] [PubMed]
- Abdella, H.M.; Farssi, H.O.E.; Broom, D.R.; Hadden, D.A.; Dalton, C.F. Eating Behaviours and Food Cravings; Influence of Age, Sex, BMI and FTO Genotype. Nutrients 2019, 11, 377. [Google Scholar] [CrossRef] [PubMed]
- Ruiz, J.R.; Labayen, I.; Ortega, F.B.; Legry, V.; Moreno, L.A.; Dallongeville, J.; Martínez-Gómez, D.; Bokor, S.; Manios, Y.; Ciarapica, D.; et al. Attenuation of the Effect of the FTO Rs9939609 Polymorphism on Total and Central Body Fat by Physical Activity in Adolescents: The HELENA Study. Arch. Pediatr. Adolesc. Med. 2010, 164, 328–333. [Google Scholar] [CrossRef] [PubMed]
- Kilpeläinen, T.O.; Qi, L.; Brage, S.; Sharp, S.J.; Sonestedt, E.; Demerath, E.; Ahmad, T.; Mora, S.; Kaakinen, M.; Sandholt, C.H.; et al. Physical Activity Attenuates the Influence of FTO Variants on Obesity Risk: A Meta-Analysis of 218,166 Adults and 19,268 Children. PLoS Med. 2011, 8, e1001116. [Google Scholar] [CrossRef]
- Kalantari, N.; Doaei, S.; Keshavarz-Mohammadi, N.; Gholamalizadeh, M.; Pazan, N. Review of Studies on the Fat Mass and Obesity-Associated (FTO) Gene Interactions with Environmental Factors Affecting on Obesity and Its Impact on Lifestyle Interventions. ARYA Atheroscler. 2016, 12, 281–290. [Google Scholar]
- Claussnitzer, M.; Dankel, S.N.; Kim, K.-H.; Quon, G.; Meuleman, W.; Haugen, C.; Glunk, V.; Sousa, I.S.; Beaudry, J.L.; Puviindran, V.; et al. FTO Obesity Variant Circuitry and Adipocyte Browning in Humans. N. Engl. J. Med. 2015, 373, 895–907. [Google Scholar] [CrossRef]
- Loos, R.J.F.; Yeo, G.S.H. The Bigger Picture of FTO: The First GWAS-Identified Obesity Gene. Nat. Rev. Endocrinol. 2014, 10, 51–61. [Google Scholar] [CrossRef]

| Variable (Units) | All | Men | Women | p Value |
|---|---|---|---|---|
| Age (years) | 33.36 (7.67) | 33.29 (7.68) | 33.44 (7.75) | 0.939 |
| Body mass (kg) | 81.81 (16.71) | 85.22 (14.05) | 78.23 (18.62) | 0.194 |
| Height (cm) | 170.11 (8.57) | 179.06 (6.65) | 163.82 (5.20) * | <0.001 |
| Body mass index (kg/m2) | 28.37 (6.12) | 27.53 (4.74) | 29.25 (7.26) | 0.476 |
| Body fat (%) | 20.16 (9.23) | 14.02 (5.43) | 26.61 (7.92) * | <0.001 |
| Systolic blood pressure (mmHg) | 114 (13) | 119 (12) | 109 (12) | 0.235 |
| Diastolic blood pressure (mmHg) | 75 (10) | 75 (10) | 76 (10) | 0.824 |
| Mean arterial blood pressure (mmHg) | 88.20 (10.11) | 89.47 (9.92) | 86.87 (10.26) | 0.721 |
| Blood glucose concentration (mg/dL) | 87.43 (10.52) | 88.40 (11.22) | 86.44 (9.79) | 0.558 |
| Serum HDL concentration (mg/dL) | 51.96 (12.79) | 48.70 (11.82) | 55.31 (13.03) * | 0.030 |
| Serum LDL concentration (mg/dL) | 102.31 (29.86) | 101.08 (30.23) | 103.54 (29.83) | 0.755 |
| Serum triglycerides concentration (mg/dL) | 89.69 (57.23) | 98.26 (65.56) | 81.13 (46.77) | 0.905 |
| VO2peak (mL/kg/min) | 32.49 (10.83) | 37.62 (10.15) | 27.09 (8.78) * | <0.001 |
| Peak heart rate (beat/min) | 186 (6) | 186 (6) | 186 (6) | 0.772 |
| Variable (Units) | TT | AT | AA | p Value |
|---|---|---|---|---|
| Men/women (number) | 17/15 | 15/16 | 9/8 | 0.920 |
| Age (years) | 32.56 (7.34) | 33.06 (7.34) | 35.41 (8.23) | 0.453 |
| Body mass (kg) | 78.71 (17.06) | 81.02 (16.23) | 89.07 (15.57) | 0.111 |
| Height (cm) | 170.78 (7.55) | 169.44 (9.41) | 170.02 (9.18) | 0.827 |
| Body mass index (kg/m2) | 27.07 (6.20) | 28.19 (5.30) | 31.16 (6.82) | 0.081 |
| Body Fat (%) | 18.30 (8.58) | 20.45 (8.60) | 23.12 (11.08) | 0.216 |
| Systolic blood pressure (mmHg) | 113 (13) | 116 (12) | 114 (13) | 0.681 |
| Diastolic blood pressure (mmHg) | 73 (8) | 76 (10) | 78 (13) | 0.199 |
| Mean arterial blood pressure (mmHg) | 86.30 (8.45) | 89.17 (10.53) | 90.04 (12.08) | 0.376 |
| Blood glucose concentration (mg/dL) | 85.29 (6.58) | 87.65 (14.14) | 90.94 (7.81) | 0.205 |
| Serum HDL concentration (mg/dL) | 54.29 (13.18) | 50.90 (12.62) | 49.65 (12.43) | 0.413 |
| Serum LDL concentration (mg/dL) | 106.19 (33.87) | 97.93 (24.63) | 102.94 (31.24) | 0.561 |
| Serum triglycerides concentration (mg/dL) | 77.29 (29.69) | 99.10 (79.30) | 95.71 (47.01) | 0.297 |
| Serum CRP concentration (mg/dL) | 3.16 (4.94) | 2.50 (3.31) | 2.97 (3.48) | 0.807 |
| Serum IL-6 concentration (pg/mL) | 2.03 (1.41) | 2.26 (2.33) | 2.61 (2.02) | 0.622 |
| Serum insulin concentration (μU/mL) | 8.62 (6.91) * | 7.19 (4.18) * | 13.45 (10.77) | 0.015 |
| HOMA-IR | 1.85 (1.60) * | 1.58 (0.98) * | 3.16 (2.82) | 0.010 |
| VO2peak (mL/kg/min) | 31.99 (8.92) | 33.22 (10.68) | 32.08 (14.46) | 0.893 |
| MFO (g/min) | 0.35 (0.13) | 0.37 (0.11) | 0.33 (0.11) | 0.702 |
| MFO/lean body mass (mg/kg/min) | 4.61 (2.01) | 4.73 (1.90) | 3.85 (1.31) | 0.275 |
| Fatmax (%VO2peak) | 49.47 (14.23) | 44.16 (11.94) | 44.19 (12.54) | 0.210 |
| Heart rate at Fatmax | 110 (17) | 107 (17) | 111 (15) | 0.707 |
| Dominant Model | Recessive Model | |||||
|---|---|---|---|---|---|---|
| Variable (Units) | TT | A Allele | p Value | T Allele | AA | p Value |
| Men/women (number) | 17/15 | 24/24 | 0.784 | 32/31 | 9/8 | 0.875 |
| Age (years) | 32.56 (7.34) | 33.90 (7.91) | 0.449 | 32.81 (7.48) | 35.41 (8.23) | 0.216 |
| Body mass (kg) | 78.71 (17.06) | 83.88 (16.31) | 0.177 | 79.85 (16.57) | 89.07 * (15.57) | 0.042 |
| Height (cm) | 170.78 (7.55) | 169.65 (9.24) | 0.565 | 170.13 (8.48) | 170.02 (9.18) | 0.967 |
| Body mass index (kg/m2) | 27.07 (6.20) | 29.24 (5.99) | 0.121 | 27.62 (5.75) | 31.16 (6.82) | 0.033 |
| Body Fat (%) | 18.30 (8.58) | 21.40 (9.52) | 0.142 | 19.36 (8.59) | 23.12 (11.08) | 0.136 |
| Systolic blood pressure (mmHg) | 113 (13) | 115 (15) | 0.478 | 115 (13) | 114 (13) | 0.865 |
| Diastolic blood pressure (mmHg) | 73 (8) | 77 (11) | 0.103 | 75 (9) | 78 (13) | 0.166 |
| Mean arterial blood pressure (mmHg) | 86.30 (8.45) | 89.48 (10.98) | 0.169 | 87.71 (9.56) | 90.04 (12.08) | 0.403 |
| Blood glucose concentration (mg/dL) | 85.29 (6.58) | 88.81 (14.14) | 0.147 | 86.47 (11.00) | 90.94 (7.81) | 0.121 |
| Serum HDL concentration (mmol/L) | 54.29 (13.18) | 50.46 (12.44) | 0.195 | 52.60 (12.91) | 49.65 (12.43) | 0.403 |
| Serum LDL concentration (mmol/L) | 106.19 (33.87) | 99.74 (26.98) | 0.354 | 102.13 (29.73) | 102.94 (31.24) | 0.921 |
| Serum triglycerides concentration (mmol/L) | 77.29 (29.69) | 97.87 (68.82) | 0.120 | 88.02 (60.01) | 95.71 (47.01) | 0.627 |
| Blood CRP concentration (mg/dL) | 3.16 (4.94) | 2.66 (3.35) | 0.595 | 2.83 (4.19) | 2.97 (3.48) | 0.898 |
| Blood IL-6 concentration (pg/mL) | 2.03 (1.41) | 2.39 (2.21) | 0.392 | 2.13 (1.91) | 2.61 (2.02) | 0.360 |
| Blood insulin concentration (μU/mL) | 8.62 (6.91) | 9.41 (7.74) | 0.645 | 7.91 (5.71) | 13.45 (10.77) * | 0.005 |
| HOMA-IR | 1.85 (1.60) | 2.14 (1.97) | 0.501 | 1.72 (1.32) | 3.16 (2.82) * | 0.003 |
| VO2peak (mL/kg/min) | 31.99 (8.92) | 32.82 (12.01) | 0.740 | 32.60 (9.77) | 32.08 (14.46) | 0.863 |
| MFO (g/min) | 0.35 (0.13) | 0.36 (0.15) | 0.747 | 0.36 (0.15) | 0.33 (0.11) | 0.569 |
| MFO/lean body mass (mg/kg/min) | 4.61 (2.01) | 4.42 (1.76) | 0.649 | 4.67 (1.95) | 3.85 (1.31) | 0.111 |
| Fatmax (%VO2peak) | 49.47 (14.23) | 44.18 (12.01) | 0.070 | 46.86 (13.31) | 44.19 (12.54) | 0.471 |
| Heart rate at Fatmax | 110 (17) | 109 (16) | 0.706 | 109 (17) | 111 (15) | 0.601 |
| Variable (Units) | Sex | Genotype | Interaction |
|---|---|---|---|
| Age (years) | 0.982 | 0.450 | 0.425 |
| Body mass (kg) | 0.189 | 0.083 | 0.154 |
| Height (cm) | <0.001 | 0.837 | 0.492 |
| Body mass index (kg/m2) | 0.055 | 0.053 | 0.064 |
| Body Fat (%) | <0.001 | 0.039 | 0.091 |
| Systolic blood pressure (mmHg) | 0.002 | 0.538 | 0.578 |
| Diastolic blood pressure (mmHg) | 0.508 | 0.190 | 0.625 |
| Mean arterial blood pressure (mmHg) | 0.398 | 0.340 | 0.594 |
| Blood glucose concentration (mg/dL) | 0.507 | 0.206 | 0.273 |
| Serum HDL concentration (mg/dL) | 0.013 | 0.398 | 0.159 |
| Serum LDL concentration (mg/dL) | 0.722 | 0.570 | 0.537 |
| Serum triglycerides concentration (mg/dL) | 0.207 | 0.253 | 0.186 |
| Serum CRP concentration (mg/dL) | 0.019 | 0.756 | 0.360 |
| Serum IL-6 concentration (pg/mL) | 0.447 | 0.602 | 0.499 |
| Serum insulin concentration (μU/mL) | 0.932 | 0.018 | 0.999 |
| HOMA-IR | 0.952 | 0.014 | 0.996 |
| VO2peak (mL/kg/min) | <0.001 | 0.730 | 0.054 |
| MFO (g/min) | <0.001 | 0.538 | 0.312 |
| MFO/lean body mass (mg/kg/min) | 0.010 | 0.170 | 0.100 |
| Fatmax (%VO2peak) | <0.001 | 0.890 | 0.268 |
| Heart rate at Fatmax | 0.645 | 0.699 | 0.601 |
Disclaimer/Publisher’s Note: The statements, opinions and data contained in all publications are solely those of the individual author(s) and contributor(s) and not of MDPI and/or the editor(s). MDPI and/or the editor(s) disclaim responsibility for any injury to people or property resulting from any ideas, methods, instructions or products referred to in the content. |
© 2024 by the authors. Licensee MDPI, Basel, Switzerland. This article is an open access article distributed under the terms and conditions of the Creative Commons Attribution (CC BY) license (https://creativecommons.org/licenses/by/4.0/).
Share and Cite
García-Pastor, T.; Muñoz-Puente, I.; Pérez-Pelayo, M.; Púa, I.; Roberts, J.D.; Del Coso, J. Maximal Fat Oxidation During Exercise in Healthy Individuals: Lack of Genetic Association with the FTO rs9939609 Polymorphism. Genes 2025, 16, 4. https://doi.org/10.3390/genes16010004
García-Pastor T, Muñoz-Puente I, Pérez-Pelayo M, Púa I, Roberts JD, Del Coso J. Maximal Fat Oxidation During Exercise in Healthy Individuals: Lack of Genetic Association with the FTO rs9939609 Polymorphism. Genes. 2025; 16(1):4. https://doi.org/10.3390/genes16010004
Chicago/Turabian StyleGarcía-Pastor, Teresa, Iván Muñoz-Puente, Miriam Pérez-Pelayo, Isabel Púa, Justin D. Roberts, and Juan Del Coso. 2025. "Maximal Fat Oxidation During Exercise in Healthy Individuals: Lack of Genetic Association with the FTO rs9939609 Polymorphism" Genes 16, no. 1: 4. https://doi.org/10.3390/genes16010004
APA StyleGarcía-Pastor, T., Muñoz-Puente, I., Pérez-Pelayo, M., Púa, I., Roberts, J. D., & Del Coso, J. (2025). Maximal Fat Oxidation During Exercise in Healthy Individuals: Lack of Genetic Association with the FTO rs9939609 Polymorphism. Genes, 16(1), 4. https://doi.org/10.3390/genes16010004