Article

Identification and Comprehensive Analysis of OFP Genes for Fruit Shape Influence in Mango

1
Institute of Fruit Tree Research, Guangdong Academy of Agricultural Sciences, Key Laboratory of South Subtropical Fruit Biology and Genetic Resource Utilization, Ministry of Agriculture and Rural Affairs, Guangdong Provincial Key Laboratory of Tropical and Subtropical Fruit Tree Research, Guangzhou 510642, China
2
Guangdong Litchi Engineering Research Center, College of Horticulture, South China Agricultural University, Guangzhou 510642, China
*
Authors to whom correspondence should be addressed.
Genes 2024, 15(7), 823; https://doi.org/10.3390/genes15070823
Submission received: 8 May 2024 / Revised: 6 June 2024 / Accepted: 14 June 2024 / Published: 21 June 2024
(This article belongs to the Section Plant Genetics and Genomics)

Abstract

:
OVATE family proteins (OFPs) are a class of plant-specific proteins with a conserved OVATE domain that play fundamental roles in fruit development and plant growth. Mango (Mangifera indica L.) is an economically important subtropical fruit tree characterized by a diverse array of fruit shapes and sizes. Despite extensive research on OFPs across various species, there remains a scarcity of information regarding OFPs in mango. Here, we have successfully identified 25 OFP genes (MiOFPs) in mango, each of which exhibits the conserved OVATE domains. The MiOFP gene exhibit a range of 2–6 motifs, with all genes containing both motif 1 and motif 2. Phylogenetic analysis on 97 OFPs (including 18 AtOFPs, 24 SlOFPs, 25 MiOFPs, and 30 OsOFPs) indicated that MiOFPs could be divided into three main clades: clade I, II, and III. Comparative morphological analysis identified significant variations in fruit longitudinal diameter, fruit transverse diameter, and fruit shape index between two distinct shaped mango cultivars (‘Hongxiangya’ and ‘Jingpingmang’) at DAP5, DAP7, and DAP10 stages. The subsequent examination of paraffin sections revealed distinct patterns of cell elongation. The majority of MiOFP genes exhibited predominantly expressed in developing organs, specifically flowers and immature fruits, while displaying distinct expression patterns. RNA-Seq analysis revealed significant disparities in the expression levels of several OFP genes, including MiOFP5, MiOFP11, MiOFP21, MiOFP22, MiOFP23, and MiOFP25, between the two mango cultivars. These findings suggest that these six genes may play a crucial role for fruit shape in mango, especially the MiOFP22. The findings of this study have established a basis for future investigations into MiOFPs in mango, offering a solid foundation for further research in this field.

1. Introduction

Mango (M. indica L.) is an economically important species whose fruit is regarded as delicious and nutritious. Globally, there are about 26,000 mango accessions including landraces, breeding lines, advanced cultivars, and wild species held in various field gene banks in Australia, Indonesia, Sierra Leone, India, Thailand, United States of America, and other countries [1]. These cultivated mangoes exhibit a diverse range of shapes, such as round, S-shaped, oval, ivory-shaped, rectangular, elongated, and more [2]. Consequently, studying the mechanism behind mango fruit shape formation is advantageous in meeting consumer demands and production processing requirements.
The shape of a fruit is a key trait in horticulture that plays a significant role in determining the commercial value of fruits. Not only does it accommodate various methods of consumption and to meet consumers’ preferences, but it also affects the harvesting methods of fruits. For instance, elongated and blocky tomatoes are preferred for processing purposes, while round and visually appealing fruits are ideal for the fresh market and slicing applications [3,4]. Similarly, regular mango varieties such as round are easier to manage postharvest than other irregular fruit shapes such as ivory-shaped. However, the underlying factors that contribute to the development of diverse fruit shapes and the production system is poorly investigated [5,6].
In recent years, the molecular genetic mechanisms of fruit shape regulation has been preliminarily investigated. Numerous genes and regulatory factors have been identified and characterized for their involvement in this process. Among them, the OFP gene family receives significant attention [7,8,9]. OFP proteins have been found to play pivotal roles in the regulation of various aspects of plant growth and development. These encompass ovule development, vascular development, fruit shape, and other processes [10,11,12]. In Arabidopsis, AtOFP5 is believed to play a role in the early developmental stages of the embryo sac and is essential for female gametophyte development [13]. In rice, it has been confirmed that OsOFP2 is associated with lignin biosynthesis and regulates vascular development [14]. Additionally, OsOFP19 negatively modulates the response to brassinosteroids (BR) and integrates it with the pattern of cell division to influence plant architecture, including grain shape [15]. In tomato, the OVATE (SlOFP1) and SlOFP20 proteins also interact with the TONNEAU1-recruiting motif family of proteins (TRMs) to regulate multicellular growth in plants and subsequently influence fruit shape [16,17]. Studies have already found that the OFP assumes a crucial role in regulating plant growth and fruit shape [18,19,20]. Numerous OFP proteins have been identified in different fruits, including the VvOFPs in grape [21], ZjOFPs in Chinese Jujube [22], and MdOFPs in apple [23], highlighting the essential functions of OFP proteins in various plant species. However, the exploration of OFP proteins in mango remains limited.
In this study, bioinformatic analyses including those involving sequence similarities, gene structures, motif compositions, gene duplications, and chromosome distribution, were conducted. The phylogenetic analysis of 97 OFPs, which included 18 AtOFPs, 24 SlOFPs, 25 MiOFPs, and 30 OsOFPs, revealed that the 25 MiOFPs could be classified into three primary clades: clades I, II, and III. Furthermore, the study discussed the morphological and cellular changes observed during mango fruit development in different fruit varieties, along with the expression variations of MiOFP family members throughout fruit development. The result provides a foundation for the identification and further functional analysis of MiOFPs family members in mango.

2. Materials and Methods

2.1. Plant Materials

In this study, two mango cultivars (‘Hongxiangya’ and ‘Jingpingmang’), were selected as plant materials. ‘HXY’ and ‘JPM’ are two mango varieties that display remarkable difference in fruit shape. HXY exhibits an elongated shape, exemplifying a high fruit shape index ranging from 1.89 to 3.04, whereas ‘JPM’, characterized by a round fruit shape, showcases a fruit shape index spanning from 0.89 to 1.11 after maturity. These cultivars were obtained from the Institute of Fruit Tree Research in Chaozhou, Guangdong, China, and were cultivated in a greenhouse under standardized growth conditions. After flower bud differentiation, different tissue samples were collected, including flower buds, leaves, stems, and fruits. Fruit samples were collected at three different stages of fruit development, specifically at 5, 7, and 10 days after pollination, which were referred to as DAP5, DAP7, and DAP10, respectively.

2.2. Identification, Characterization, and Phylogenetic Analyses of MiOFPs

The GFF sequence file for the mango genome ‘Alphonso’ and the HMM file for the Ovate domain (PF04844) were acquired from Mangobase (https://mangobase.org/ (accessed on 20 December 2023)) and Pfam database (http://pfam.xfam.org/ (accessed on 20 December 2023)), respectively [24]. Subsequently, the local mango protein database was searched using HMMER3 v3.4 (http://hmmer.janelia.org/ (accessed on 20 December 2023)), resulting in the identification of 26 candidate gene family members. Arabidopsis thaliana OFP protein sequences were employed as query sequences and subjected to blastp against the mango protein database using TBtools-Ⅱ [25], with E-values set to 1 × 10⁻⁵. Eventually, 25 members of the MiOFP gene family were identified and further screened to remove any duplicates.
The conserved domain of the OFP protein was predicted using NCBI CD-search (https://www.ncbi.nlm.nih.gov/Structure/cdd (accessed on 22 December 2023)) and Pfam (http://pfam.xfam.org/ (accessed on 22 December 2023)). Furthermore, the conserved motifs were predicted using MEME (http://meme.nbcr.net/meme4-1/cgi-bin/meme.cgi (accessed on 22 December 2023)). The upstream 2 kb sequences relative to the start codon of MiOFP genes were obtained from the mango genome database. The cis-acting regulatory elements in these regions were identified using the PlantCARE database (http://bioinformatics.psb.ugent.be/webtools/plantcare/html/ (accessed on 22 December 2023)) and visualized with TBtools Ⅱ [25].
The sequences of OFP proteins from M. indica, A. thaliana, and Solanum lycopersicum were downloaded from the GenBank database. These sequences were aligned using MAFFT v7.490 [26]. Oryza sativa, A. thaliana, and S. lycopersicum OFP sequences were obtained from the NCBI (https://www.ncbi.nlm.nih.gov/genome/ (accessed on 25 December 2023)). A maximum likelihood (ML) tree was constructed using IQ-TREE v.1.6.12 [27]. The best-fitting nucleotide substitution model, TPM2u+F+G4, was determined using the Akaike Information Criterion (AIC) by ModelFinder [28] in the IQ-TREE package and 1000 bootstrap replicates.

2.3. Phenotypic and Histological Observations

Fruit length and diameter of ‘HXY’ and ‘JPM’ mango fruits were measured at 1, 3, 5, 7, 10, 17, 24 and 31 DAP (days after pollination). To observe the changes of cells in the developed fruit, 0.5-cm-thick samples were cut along longitudinal axes from the mesocarp in the middle of each fruit at DAP5, DAP7, and DAP10. Sliced samples were immediately fixed in the formaldehyde–acetic acid–ethanol Fixative (FAA: 70% ethyl alcohol: 10% formaldehyde: 5% glacial acetic acid = 10:2:1). Subsequently, 4 µm thick microtome sections were prepared and stained with hematoxylin–eosin staining (HE) [29]. After staining, the tissues were observed under a microscope (Nikon, E200, Tokyo, Japan) with micrographs captured by an HQ Image C630 digital camera.

2.4. RNA-Seq Analysis

Samples were collected at three different stages of fruit development, specifically at 5, 7, and 10 days after pollination, named DAP5, DAP7, and DAP10, respectively. Immediately after collection, the samples were flash-frozen and pulverized using a mortar and pestle. Total RNAs were extracted from fruit pulp using the RNAprep Pure Plant Kit (TIANGEN, Beijing, China). RNA-seq libraries were sequenced on an Illumina NovaSeq 6000 instrument (BMK, Beijing, China) with 150-bp paired-end reads. Approximately 6G of raw data were generated for each sample. The raw reads underwent quality control and adapter sequence removal using fastp [30]. The clean data were aligned to the reference genome of mango cultivar A ‘lphonso’ [24] using the STAR 2.7.11b (https://github.com/alexdobin/STAR (accessed on 10 June 2024)). Transcripts were assembled and merged using StringTie v1.3.3b (http://ccb.jhu.edu/software/stringtie/ (accessed on 10 June 2024)). The gene expression level was determined according to the transcripts per kilobase of exon model per million mapped (TPM) method [31] and gene expression profiles were visualized by heatmap via TBtools-II [25]. The DESeq2 Bioconductor package was utilized to identify differentially expressed genes (DEGs: log2FoldChange > 2 and padj < 0.05 or log2FoldChange < −2 and padj < 0.05) between the two cultivars at each ripening stage.

2.5. Total RNA Extraction and RT-qPCR Analysis

Total RNA of 18 samples was extracted by column plant RNAout kit (Tiandz, Beijing, China) according to the manufacturer instructions. First-strand cDNA was synthesized from 1 μg total RNA using the GoScript Reverse Transcriptase (Promega, A5003). Quantitative reverse transcription polymerase chain reaction (RT-qPCR) was performed using THUNDERBIRD qPCR MIX QPS-201 (Toyobo, Shanghai, China) on a LightCycler 480 Thermal Cycler (Roche, Basel, Switzerland). MiActin was used as an internal control for sample normalization during real-time RT-PCR analysis (2−ΔΔCt method) [32,33]. The RT-qPCR primers were designed in Primer3 2.3.7 and listed in Table 1. Each expression profile was independently verified in three biological replicates.

3. Results

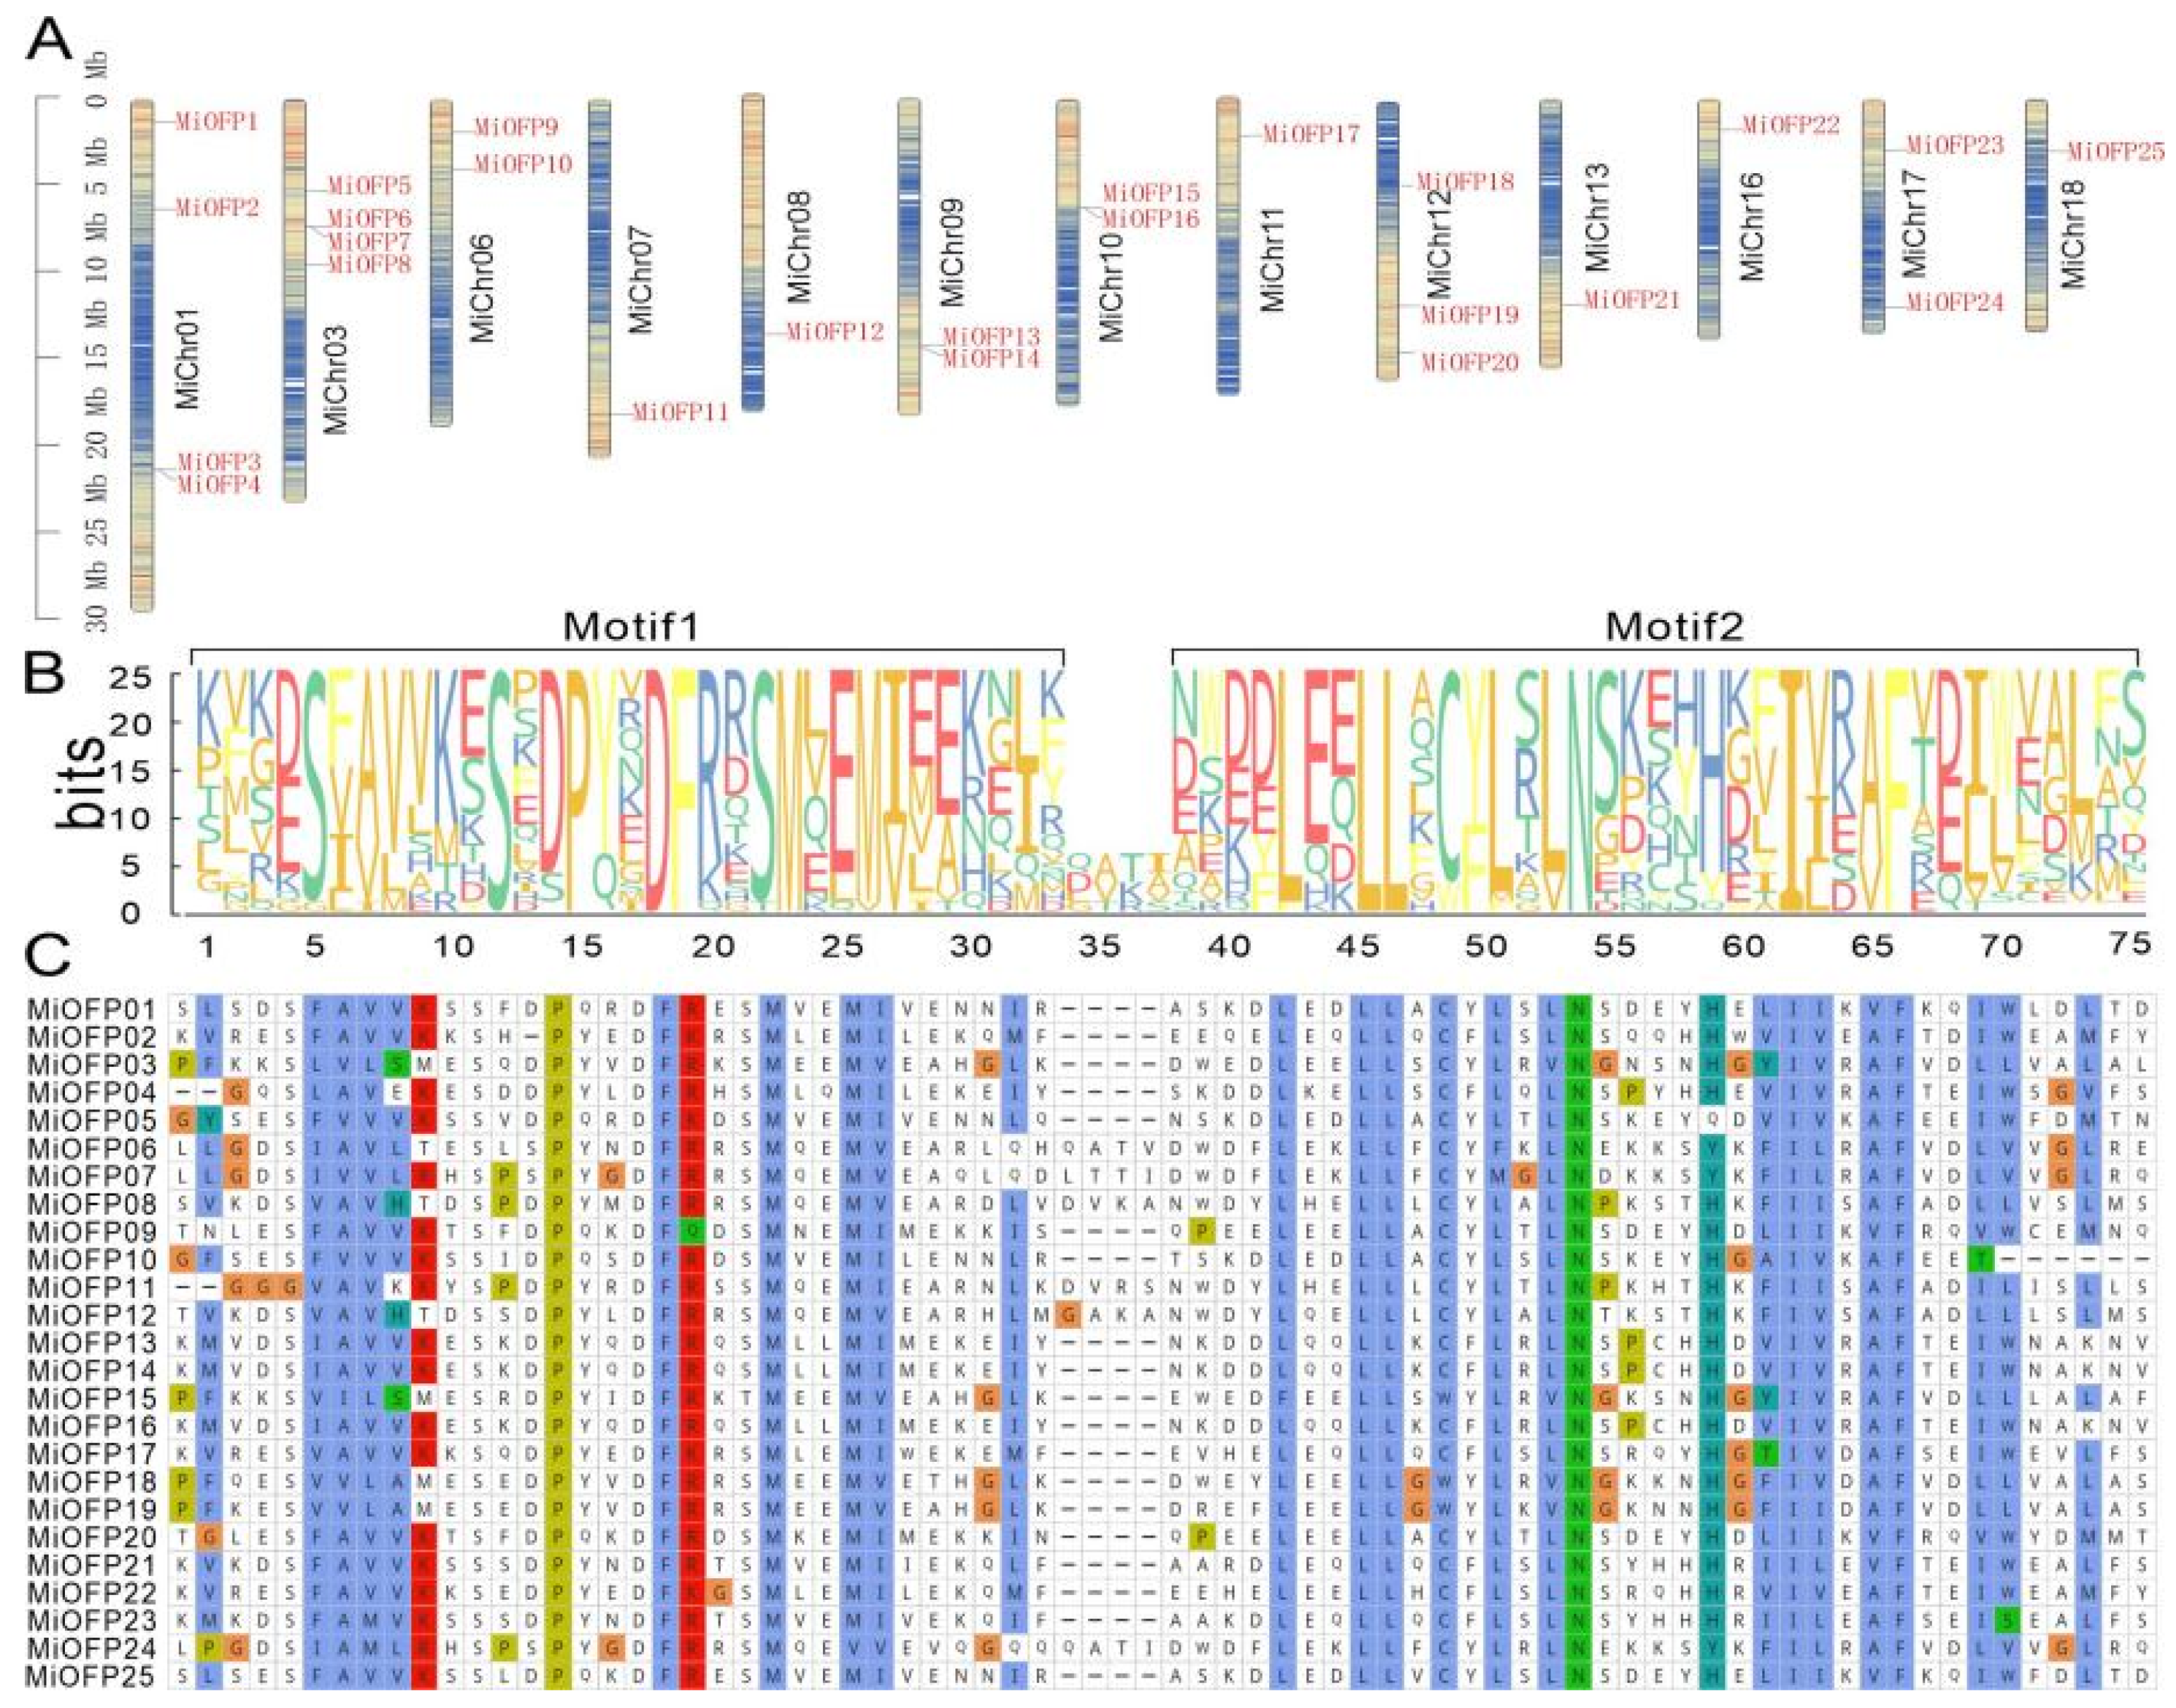
3.1. Identification of OFP Genes in Mango

The sequences of 19 AtOFPs were used as queries for BLASTp searches to identify OFP genes from the genome of “Alphonso” mango. In total, 25 OFP genes were identified and designated as MiOFP1–MiOFP25, based on their respective chromosomal locations (Figure 1A and Table 2). The length of the MiOFP proteins ranged from 178 amino acids (MiOFP16) to 411 amino acids (MiOFP9). The relative molecular mass of these proteins varied from 20,108.71 Da (MiOFP16) to 47,439.15 Da (MiOFP9). Furthermore, their isoelectric points (PIs) ranged from 4.62 (MiOFP18) to 9.71 (MiOFP10). Notably, all of the OFP proteins exhibited negative hydrophobicity values, indicating that these proteins have hydropathicity. For subcellular localization, 17 out of the 25 MiOFPs (68%) were identified to localize in the chloroplast, while only 6 out of the 25 (24%) were in the nucleus (Table 2).

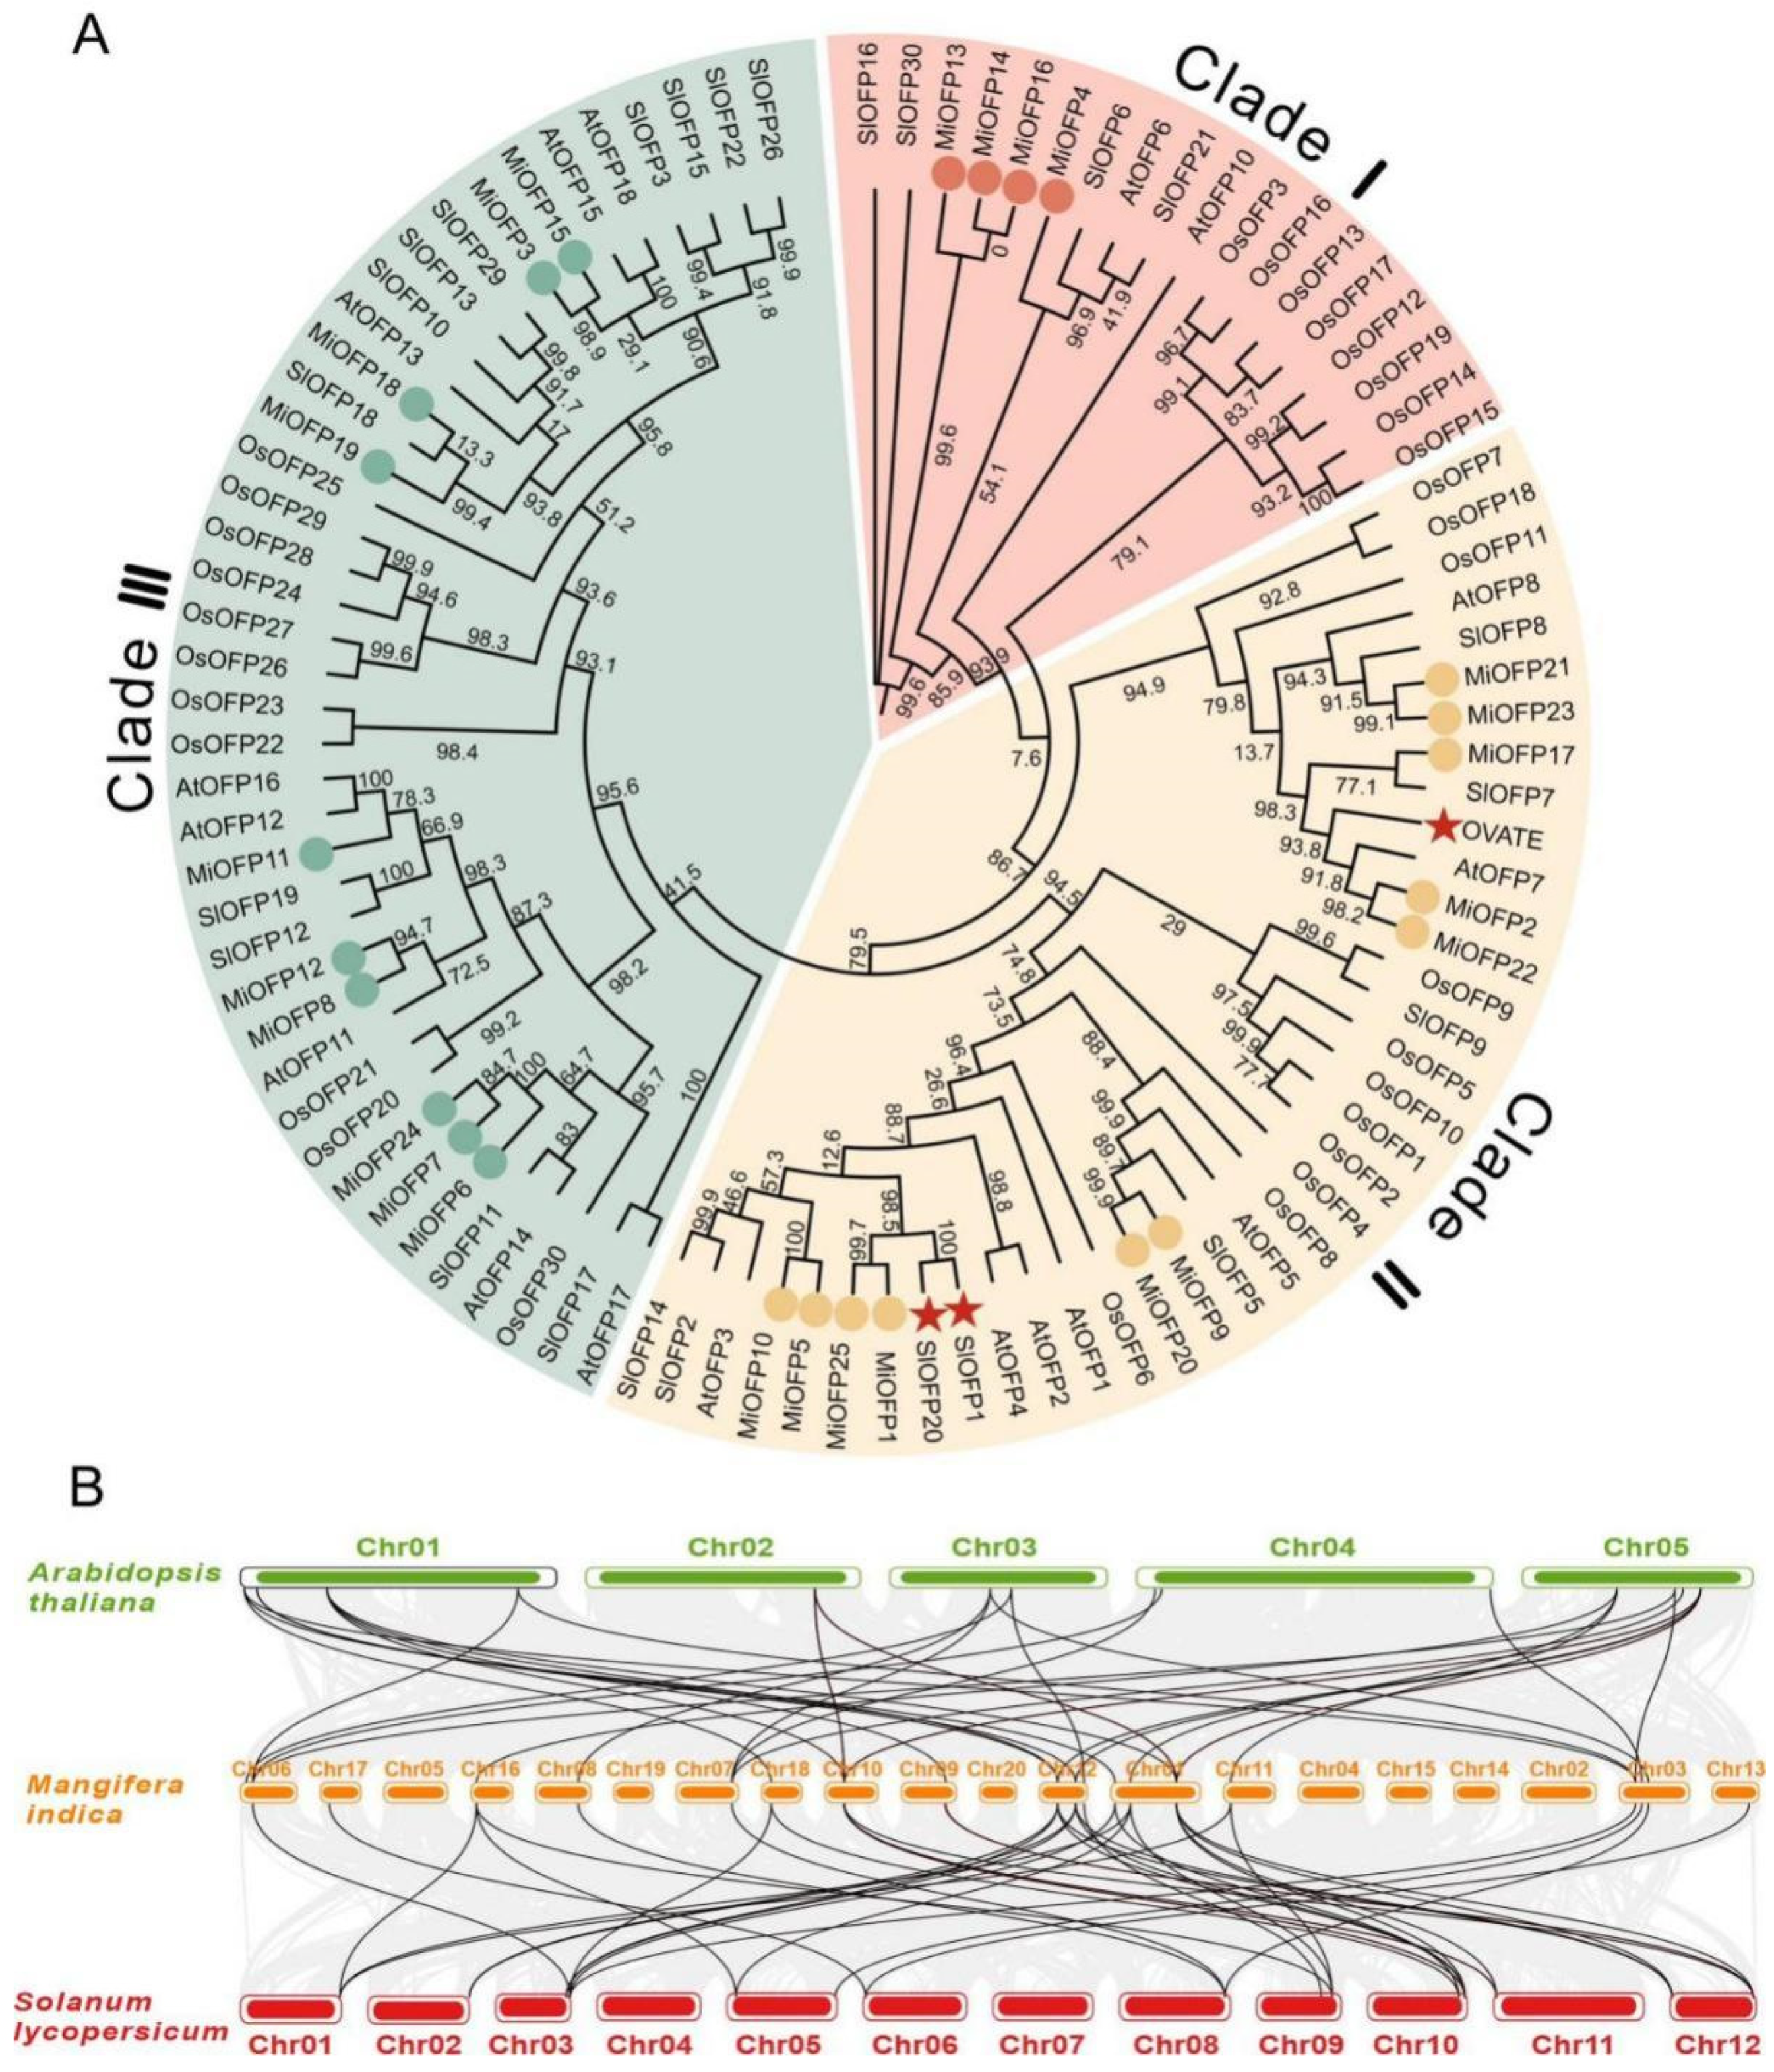
3.2. Sequence Alignment, Structure, and Phylogenetic Analysis of the MiOFPs

To better illustrate the gene structure of MiOFPs, the OVATE domains were displayed by aligning the conserved OVATE regions in mango. To further investigate whether the OVATE domain of MiOFPs are highly conserved, this study aligned 25 MiOFPs in mango by MAFFT v7.490 [26] and identified the conserved motifs via MEME v5.0 (http://meme-suite.org/ (accessed on 28 January 2024)). The results showed that the OVATE domain contained two conserved motifs, in which they shared some conserved amino acid residues (Figure 1B,C). For example, the S12, P15, D18, F19, M23, L45, L46, N53, I61, and F65 amino acid residues in the OVATE domain were conserved in all MiOFPs.
Following this, an analysis of the phylogenetic relationship and conserved domains of MiOFPs revealed that they can be categorized into four distinct classes, all of which exhibit the presence of the ovate superfamily domain. Furthermore, MiOFP1, MiOFP5, MiOFP10, and MiOFP25 were additionally identified to possess the DNA binding 2 domain, as depicted in Figure (Figure 2A,B). Conserved motif analyses showed all MiOFP genes have motif 1 and 2 (Figure 2C).
The analysis of promoter regions has shown that these MiOFP genes bear cis-elements that associate with plant hormone responses, plant growth and development, as well as responses to biotic and abiotic stresses. Hormone response elements encompass various hormones such as abscisic acid, auxin, gibberellin, MeJA, and salicylic acid. Growth and development-related elements consist of meristem-related elements, seed-specific elements, and endosperm expression-related elements. Abiotic stress response elements predominantly involve responses to light and drought. Furthermore, there are also elements associated with circadian responses (Figure 2D).
To further understand the evolutionary relationships of the mango OFP proteins, a phylogenetic tree was generated based on the sequence alignments of 25 full-length OVATE domain-containing proteins and 18 A. thaliana OFPs (AtOFPs), 31 S. lycopersicum OFPs (SlOFPs), and 30 Oryza sativa (OsOFPs). These 97 OFPs were classified into three main groups: Clade I, Clade II, and Clade III, comprising 18, 38, and 41 members, respectively (Figure 3A). Among them, MiOFP21, MiOFP23, MiOFP17, MiOFP2, and MiOFP22, are positioned on the same subbranch of Clade II. This suggests a noteworthy sequence similarity among them. Evolutionary studies on the OFP gene family also suggest that it had already formed before the divergence of monocotyledons and dicotyledons, and the number of OFP members is greater in monocotyledonous plants than in dicotyledonous plants, indicating that the OFP gene family exhibits both functional conservation and specificity during the evolution process. The genomes of Arabidopsis and tomato contain 18 and 26 OFP gene family members, respectively, while mango harbors 25 OFP family members. Comparative synteny analysis demonstrated a relatively stable number of OFP family members across these species, suggesting the preservation of the gene family size without noticeable expansion or contraction (Figure 3B).

3.3. Expression Analysis of MiOFP Genes in Different Tissues

To explore the role of these MiOFP genes, transcriptome analysis was carried out to investigate the expression patterns of 25 MiOFPs in five tissues, including flower buds, leaves, stems, unripe, and ripe fruits (Figure 4). The findings indicated that the expression of MiOFP was primarily observed in flowers, unripe fruits, and stems, whereas its expression level in leaves and ripe fruits was generally limited. In addition, genes have different expression patterns in different tissues, suggesting that functional diversification was present in this subfamily. For example, in Class 2, MiOFP1 was highly expressed in stems and MiOFP5 was highly expressed in unripe fruit. Notably, MiOFP4, MiOFP5, MiOFP11, MiOFP15, MiOFP21, MiOFP22, MiOFP23, and MiOFP25 exhibited a high expression levels in both flowers and unripe fruits, suggesting a potential role of OFP in developing tissues, particularly during the early stages of fruit development, which may influence fruit shape formation.

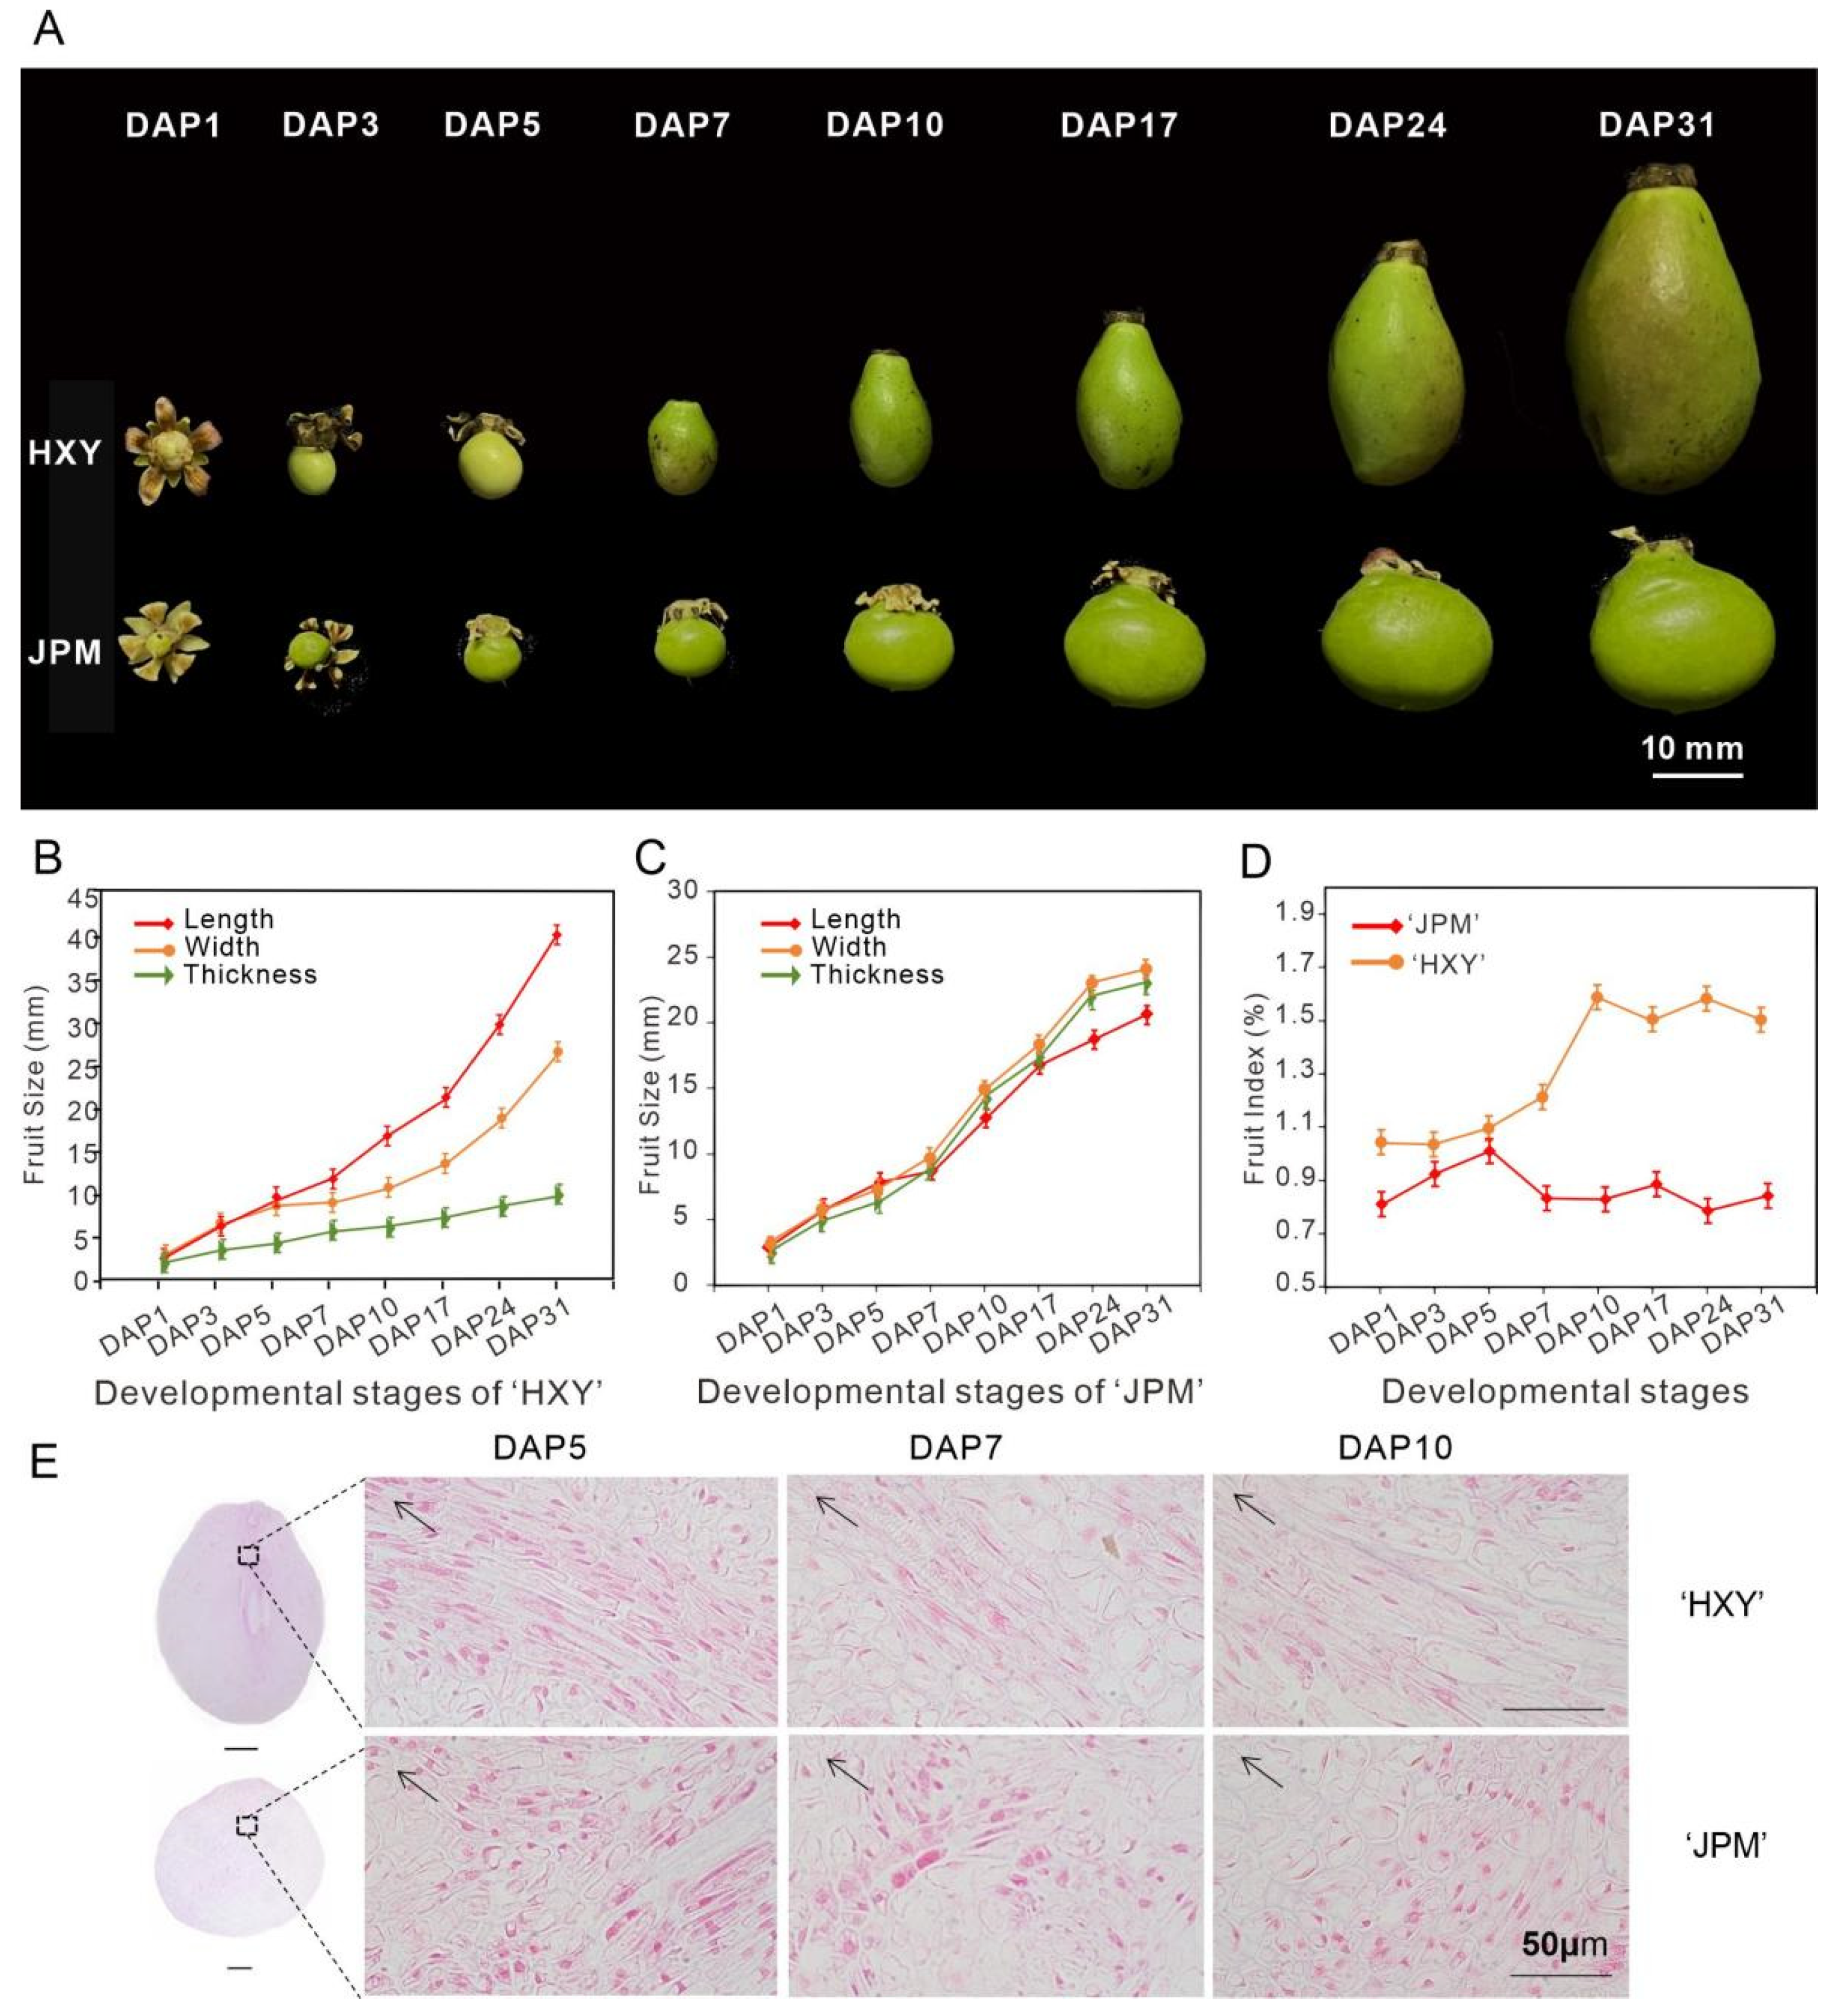
3.4. Morphological Analysis of Fruit Development

In order to investigate the mango fruit development, we recorded the fruit development process of two mango varieties, namely ‘Hongxiangya’ (Ivory-shaped) and ‘Jinpingmang’ (round), with a different fruit shape. The eight stages of the fruit development process were used to closely monitor the growth and development of the fruits within a month after pollination. The findings demonstrated a consistent augmentation in the longitudinal, transverse, and lateral diameters of the fruit starting from the day after pollination (referred to as DAP1, denoting the withering of sepals in the female flower, indicating a successful fruit set) and continuing until 31 days after pollination (referred to as DAP31, when the fruit shape index reaches a stable state) (Figure 5A). Substantial variations in morphological traits were observed between the two varieties starting from DAP5 and the greatest change in fruit shape index occurred at DAP7, the difference in fruit shape index reached its maximum value at DAP10. This observation indicates that the period encompassing DAP5, DAP7, and DAP10 is a critical stage in fruit development.
The longitudinal diameter of ‘HXY’ exhibited a faster rate of increase compared to the transverse and lateral diameters. In contrast, the growth rate of the longitudinal and lateral diameters of ‘JPM’ were similar, with the longitudinal diameter showing a slightly slower growth than the lateral diameter (Figure 5B,C). As a result, the fruit shape index of ‘HXY’ exhibited a rapid increase starting from DAP5, ultimately stabilizing at approximately 1.5 by DAP10. Conversely, the fruit shape index of ‘JPM’ decreased after DAP5 and consistently remained low (<1) thereafter (Figure 5D). This suggests that the variations in the fruit shape index of ‘HXY’ and ‘JPM’ occur during the critical period between DAP5 and DAP10, which is instrumental in determining the eventual development of elongated or round fruit types.
Based on the analysis of these observations, it was obvious that DAP5–DAP10 was a critical period for the development of fruit shape variations. Previous research has suggested that cell division and expansion play a crucial role in regulating the shape and size of plant organs [33,34]. Specifically, the rate, duration, and orientation of cell division, as well as the uniform and non-uniform expansion of cells, greatly contribute to the final morphology of plant organs [35]. Therefore, paraffin sections were conducted on the fruits in these three stages to examine their cellular changes. The findings revealed that, in the ‘HXY’ fruits, the majority of cells underwent longitudinal elongation, whereas in the ‘JPM’ fruits, the cells experienced lateral elongation during the corresponding developmental stages (Figure 5E). This suggests that the differences in fruit shape between ‘HXY’ and ‘JPM’ are likely caused by differences in cell growth or the elongation direction during the early stage of fruit development (DAP5–DAP10). Simultaneously, the quantity of cells exhibiting longitudinal or transverse stretching at DAP5 was greater in the paraffin sections of the same size field, suggesting that the DAP5 stage might be a crucial phase for distinct cell division.

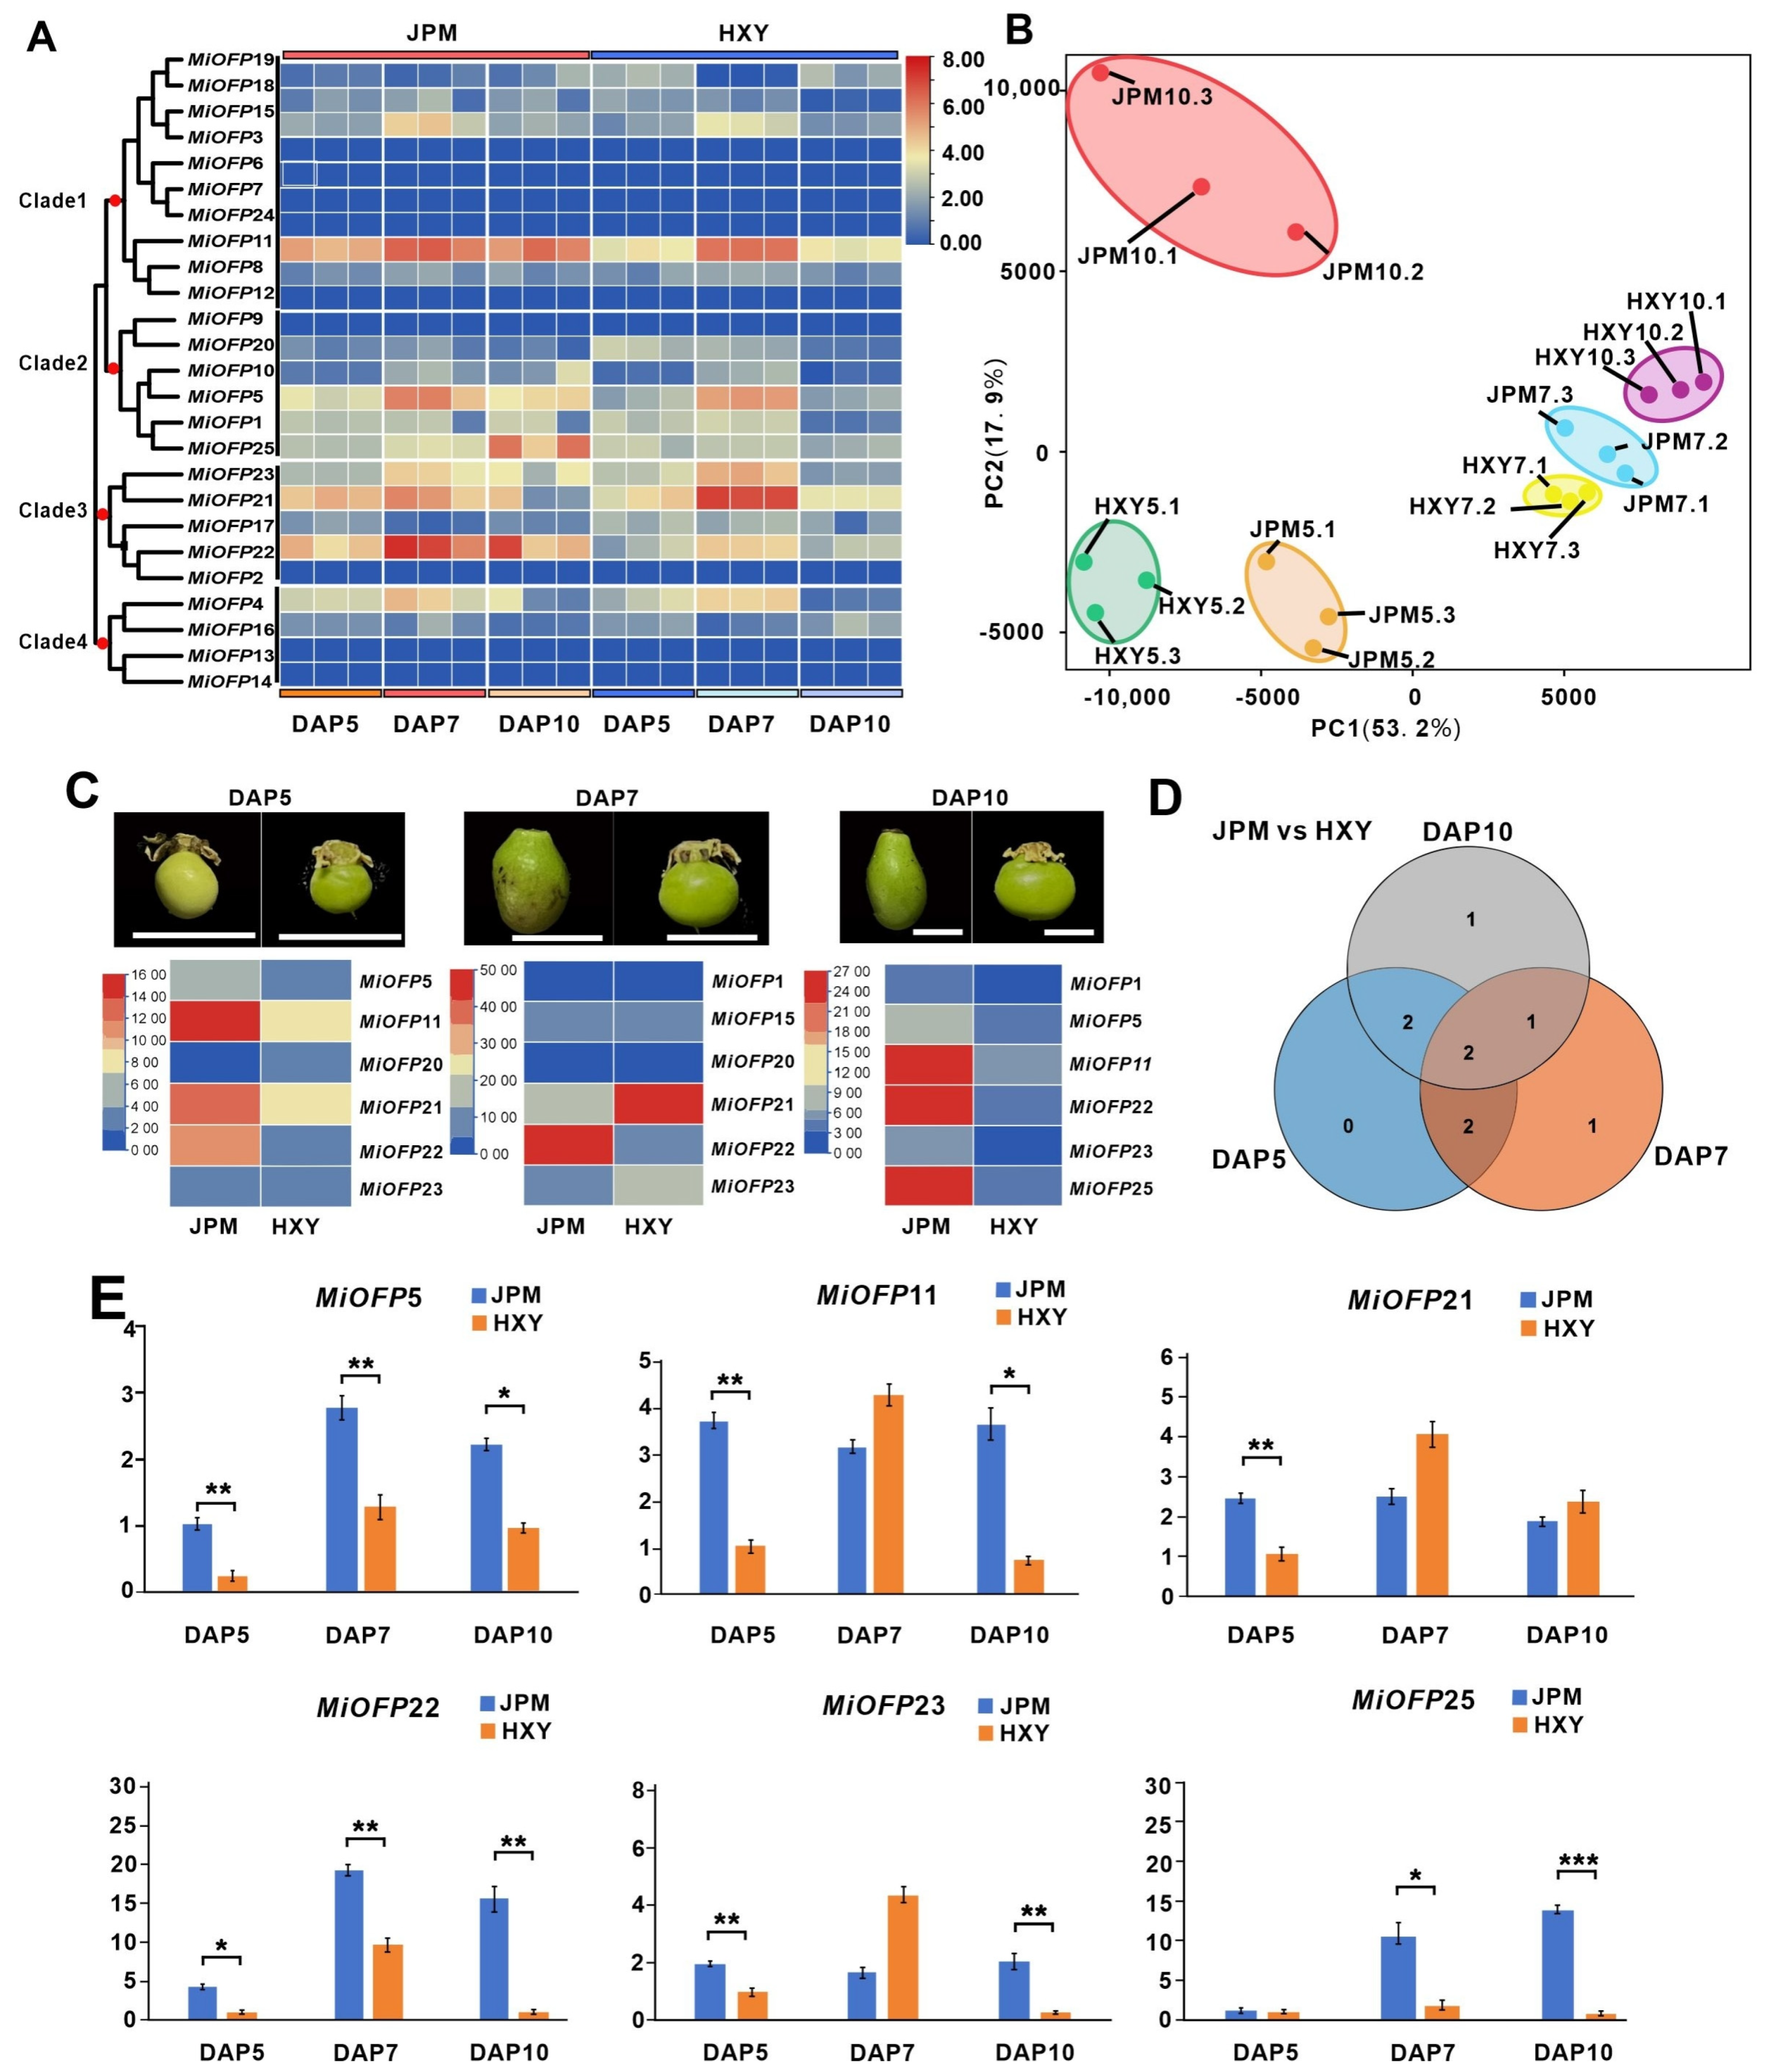
3.5. Expression Profile of MiOFP Genes in Two Varieties with Contrasting Fruit Shape

To explore the character of MiOFPs in the regulation of the three pivotal fruit-shape development (DAP5, DAP7, and DAP10) mentioned by Figure 5E, transcriptome analysis was conducted on two mango cultivars (‘HXY’ and ‘JPM’), with ivory-shaped and round fruit, respectively (Figure 6A). Principal component analysis (PCA) was conducted to evaluate the correlation between biological replicates and the clustering patterns of the samples, and the results showed good reproducibility (Figure 6B). And, the pairwise comparison of the developing stages unmasked the common and exclusive differentially expressed transcripts at 5, 7, and 10 DAP between the two varieties. The analysis revealed that, among the 25 MiOFP genes, 6 MiOFP genes (MiOFP5, MiOFP11, MiOFP20, MiOFP21, MiOFP22, and MiOFP23) exhibited a differential expression at DAP5. Furthermore, six MiOFP genes (MiOFP1, MiOFP15, MiOFP20, MiOFP21, MiOFP22, and MiOFP23) displayed a differential expression at DAP7, and MiOFP1, MiOFP5, MiOFP11, MiOFP22, MiOFP23, and MiOFP25 were observed to have a differential expression at DAP10 in both varieties (Figure 6C). Furthermore, the RT-qPCR expression analysis of the six potential MiOFP genes mentioned above were performed between the two mango cultivars at the DAP5, DAP7, and DAP10 stages, and the results were observed to be consistent with the expression pattern of the transcriptome. Notably, MiOFP5 and MiOFP22 were consistently highly expressed in the round-shape fruit cultivar (‘JPM’) during all three stages (Figure 6C,E), which suggested its potential function in cell lateral elongation development, giving rise to the round fruit of mango. In addition, it was observed that MiOFP11, MiOFP21, and MiOFP23 exhibited notably high expression levels, specifically at DAP5 in JPM, and specifically at DAP7 in HXY, indicating their potential involvement in the early fruit development stage of cell elongation in JPM (Figure 6E).

4. Discussion

Known as the “King of Tropical Fruits”, mangoes are highly versatile and can be enjoyed fresh or utilized in various processed forms such as preserves, juice, and other related products. It is important to note that the shape of mangoes plays a critical role in determining the most suitable mechanical harvesting and processing methods. The OFP gene family has been found to be associated with fruit shape in various fruits. However, the genome-wide identification and comprehensive analysis of this gene family in mango have not been previously reported. This study revealed and comprehensively analyzed OFP family genes based on the whole-genome data for mango.
Recent studies showed that gene duplication played an important role not only in the process of genome rearrangement and expansion, but also in the diversity of gene function and the production of large numbers of gene families [36]. The number of OFP gene family members in different species was significantly different, with 19 AtOFPs in Arabidopsis, 31 SlOFPs in tomato, 35 RsOFPs in radish, 45 ZmOFPs in maize, and 33 OsOFPs in rice. Studies have already found that the average number of OFP genes was 19.91 in dicots, and 31.12 in monocots, indicating that the number of OFP genes in dicots was less than that of the monocots [22]. In this study, 25 MiOFP genes were systematically identified in mango’s Alphonso genome. The results of chromosomal locations analysis showed that 25 MiOFP genes were located on different chromosomes and might be the result of segmental duplication, and MiOFP3/4, MiOFP6/7, MiOFP13/14, and MiOFP15/16 were located in the similar position of the same chromosome, which might be the result of tandem duplication; MiOFP1, MiOFP2, MiOFP5, MiOFP8, MiOFP9, MiOFP10, MiOFP11, MiOFP12, MiOFP17, MiOFP18, MiOFP19, MiOFP20, MiOFP21, MiOFP22, MiOFP23, MiOFP24, and MiOFP25 were located on the different chromosomes and might be the result of segmental duplication. In addition, phylogenetic analysis divided the 25 MiOFPs into three main clades: Clades I, II, and III. Previous work showed that tomato OVATE and SlOFP1 genes that regulate pear-shaped tomato, SlOFP20 that controls tomato fruit shape, and AtOFP7/8 is considered as the candidate gene responsible for the shortening of Arabidopsis cotyledons [15], distributed in Clade Ⅱ, which suggests that the members in this clade including MiOFP1, MiOFP2, MiOFP5, MiOFP9, MiOFP10, MiOFP17, MiOFP20, MiOFP21, MiOFP22, MiOFP23, and MiOFP25 are likely involved in the regulation of the fruit shape and cotyledons elongation.
The Ovate Family Proteins (OFP) family is a ubiquitously expressed transcription factor family in plants, playing diverse functions and roles [37]. The expression pattern analysis of MiOFP genes in different mango tissues revealed that the majority of them were expressed in the reproductive organs, which accordance with other plant [7,12]. In our study, three MiOFP genes (MiOFP6, MiOFP7, and MiOFP24) were undetectable in all tissues, suggesting a trend to degenerate these genes after gene duplication or the loss of gene functions during evolution. Notably, MiOFP4, MiOFP5, MiOFP11, MiOFP15, MiOFP21, MiOFP22, MiOFP23, and MiOFP25 exhibited high expression levels in both flowers and unripe fruits, suggesting a potential role of OFP in developing tissues, particularly during the early stages of fruit development, which may influence fruit shape formation (Figure 4). Previous studies have shown that MiOFP1 is highly expressed in the phloem tissue of the stem in childhood, potentially influencing plant height [38]. At OFP1, the homolog of MiOFP1 was reported to inhibit gibberellic acid (GA) biosynthesis by suppressing AtGA20ox1 activity, resulting in dwarf, rosette-like leaves [39]. In our study, MiOFP1 was specifically highly expressed in stems, which means that they may play a role in stem elongation. These findings suggest that OFP is implicated in the growth and development of diverse plant species, with potential variations in primary functions and expression patterns across different species.
Fruit shape is a complex trait that results from a strict spatial and temporal control and coordination of overlapping and interconnected cellular events, cell division, and cell expansion, occurring with different onsets, rates, and duration [40]. In fruit trees, the members of the OFP gene family regulate the cell expansion and cell division of fruits, thereby affecting the appearance and shape of the fruits [5]. It has been reported that there were four periods of fruit development in mango, a period of initial limited growth (Stage 0: DAP0–4); a period of rapid increase (Stage I: DAP4–47); a period of delayed increase (Stage II: DAP47–53); and a second period of rapid increase and maturity (Stage III: DAP54–47). Size increases mainly occurred during Stage I, attaining 88% of the length at maturity [41]. In our observations of the fruit development process of “HXY” and “JPM”, DAP5–DAP10 is the key period for the change of fruit shape index, which determines the final development of the fruit shape elongated or round fruit type. Simultaneously, cytological analyses indicated a notable disparity in the orientation of cell elongation near the fruit stalk between HXY and JPM fruit at the onset of DAP5, suggesting a potential association between this discrepancy and the divergence in fruit shape formation.
Recent studies revealed that several OFPs negatively control the fruit length. For example, both OVATE and SlOFP20 regulate fruit length in tomato [7,16]. In the Wild Strawberry Fragaria vesca, FvOFP1, FvOFP11, FvOFP12, and FvOFP14 were highly expressed in achene and CaOFP genes may be involved in the formation of fruit type in pepper [42,43]. In our result, the differential expression of MiOFP1, MiOFP5, MiOFP11, MiOFP15, MiOFP20, MiOFP21, MiOFP22, MiOFP23, and MiOFP25 were observed between ‘HXY’ and ‘JPM’ and the RT-qPCR analysis reveals the expression trends of MiOFP5, MiOFP11, MiOFP21, MiOFP22, MiOFP23, and MiOFP25 align with the expression trends observed in the transcriptome data. Furthermore, MiOFP5 and MiOFP22 was consistently highly expressed in round-shape fruit cultivar (‘JPM’) during all three stages (Figure 6C,E), which suggested its potential function in cell lateral elongation development, giving rise to round fruit of mango. As is known, OVATE gene was originally identified in tomato, and a natural mutation in OVATE causes the fruit to change from round to pear shape [7]. Considering the closer phylogenic relationship of MiOFP22 with the tomato OVATE gene, we believe the MiOFP22 is likely be a key gene involved in mango fruit shape formation.

5. Conclusions

The investigation identified 25 OFP genes in mango, with a predominant expression in reproductive organs. Morphological analysis indicated a divergence in fruit shape index at DAP5, with the most notable disparity observed at DAP10. Cytological observations revealed anisotropic growth in H‘XY’ and J‘PM’ cells post DAP5, with H‘XY’ cells exhibiting longitudinal growth and J‘PM’ cells showing lateral growth. The transcriptional analysis of fruit developmental stages unveiled temporal and spatial specificity in the expression patterns of various MiOFP. It is hypothesized that the differential MiOFP expression may be associated with the observed cellular anisotropic elongation, potentially contributing to the variation in fruit shape between H‘XY’ and J‘PM’. The present findings may lay the foundation for further studies to unravel the functions of mango OFP genes in fruit development and plant growth.

Author Contributions

Q.W., R.X. and C.F. designed and supervised the research. Q.W., J.Y. and R.C. collected and identified all plant samples. Q.W. and Z.Z. performed the experiments and analyzed the data. Q.W. drafted the manuscript. Z.Z., R.X. and C.F. revised the manuscript. All authors have read and agreed to the published version of the manuscript.

Funding

This work was supported by grants from the Key Technologies R&D Program of Guangdong Province (2022B0202070002) and Shanwei Municipal Science and Technology Plan Project (2022A003).

Institutional Review Board Statement

Not applicable.

Informed Consent Statement

Not applicable.

Data Availability Statement

The RNA-seq data are obtained from NCBI (https://www.ncbi.nlm.nih.gov/Traces/study/ (accessed on 20 December 2023)), and the accession numbers are SRR27749143, SRR27749144, SRR27749145, SRR27749146, SRR27749147, SRR27749148, SRR27749149, SRR27749150, SRR27749151, SRR27749155, SRR27749153, SRR27749154, SRR27749155, SRR27749156, SRR27749157, SRR27749158, SRR27749159, and SRR27749160. Submitted data will remain private until related manuscript has been accepted. All data generated or analyzed are included within the article.

Conflicts of Interest

The authors declare no conflicts of interest.

References

  1. Zhang, C.; Xie, D.; Bai, T.; Luo, X.; Zhang, F.; Ni, Z.; Chen, Y. Diversity of a Large Collection of Natural Populations of Mango (Mangifera indica Linn.) Revealed by Agro-Morphological and Quality Traits. Diversity 2020, 12, 27. [Google Scholar] [CrossRef]
  2. Kulkarni, M.M.; Burondkar, M.M.; Dalvi, N.V.; Salvi, B.R.; Haldankar, P.M.; Bhattacharyya, T. Mango Fruit Size Diversity found in Konkan. Adv. Agric. Res. Technol. J. 2019, 3, 43–46. [Google Scholar]
  3. Zhu, Q.; Deng, L.; Chen, J.; Rodríguez, G.R.; Sun, C.; Chang, Z.; Yang, T.; Zhai, H.; Jiang, H.; Topcu, Y.; et al. Redesigning the tomato fruit shape for mechanized production. Nat. Plants 2023, 9, 1659–1674. [Google Scholar] [CrossRef] [PubMed]
  4. van der Knaap, E.; Tanksley, S.D. The making of a bell pepper-shaped tomato fruit: Identification of loci controlling fruit morphology in Yellow Stuffer tomato. Theor. Appl. Genet. 2003, 107, 139–147. [Google Scholar] [CrossRef] [PubMed]
  5. Zhou, H.; Ma, R.J.; Gao, L.; Zhang, J.; Zhang, A.; Zhang, X.; Ren, F.; Zhang, W.; Liao, L.; Yang, Q.; et al. A 1.7-Mb chromosomal inversion downstream of a PpOFP1 gene is responsible for flat fruit shape in peach. Plant Biotechnol. J. 2021, 19, 192–205. [Google Scholar] [CrossRef] [PubMed]
  6. Gao, A.; Chen, Y.; Luo, R.; Huang, J.; Zhao, Z.; Wang, W.; Wang, Y.; Dang, Z. Development Status of Chinese Mango Industry in 2018. Adv. Agric. Hortic. Entomol. 2019, 2019, 1–6. [Google Scholar]
  7. Liu, J.; Joyce, V.; Cong, B.; Tanksley, S.D. A new class of regulatory genes underlying the cause of pear-shaped tomato fruit. Proc. Natl. Acad. Sci. USA 2002, 99, 13302–13306. [Google Scholar] [CrossRef] [PubMed]
  8. Gui, B.; Wang, Y. Cloning and Sequence Analysis of ovate Orthologous Gene in Tobacco (Nicotiana tabacum L.). Plant Physiol. Commun. 2007, 43, 1050–1056. [Google Scholar]
  9. Rodríguez, G.R.; Muños, S.; Anderson, C.; Sim, S.C.; Michel, A.; Causse, M.; Gardener, B.B.M.; Francis, D.; van der Knaap, E. Distribution of SUN, OVATE, LC, and FAS in the Tomato Germplasm and the Relationship to Fruit Shape Diversity. Plant Physiol. 2011, 156, 275–285. [Google Scholar] [CrossRef]
  10. Tsaballa, A.; Pasentsis, K.; Darzentas, N.; Tsaftaris, A.S. Multiple evidence for the role of an Ovate-like gene in determining fruit shape in pepper. BMC Plant Biol. 2011, 11, 46. [Google Scholar] [CrossRef]
  11. Wang, S.; Chang, Y.; Guo, J.; Zeng, Q.; Ellis, B.; Chen, J. Arabidopsis Ovate Family Proteins, a Novel Transcriptional Repressor Family, Control Multiple Aspects of Plant Growth and Development. PLoS ONE 2011, 6, e23896. [Google Scholar] [CrossRef] [PubMed]
  12. Huang, Z.; Van, H.; Gonzalez, G.; Xiao, H.; van der Knaap, E. Genome-wide identification, phylogeny and expression analysis of SUN, OFP and YABBY gene family in tomato. Mol. Genet. Genom. 2013, 288, 111–129. [Google Scholar] [CrossRef]
  13. Wang, S.; Chang, Y.; Guo, J.; Chen, J. Arabidopsis Ovate Family Protein 1 is a transcriptional repressor that suppresses cell elongation. Plant J. 2007, 50, 858–872. [Google Scholar] [CrossRef]
  14. Schmitz, A.J.; Begcy, K.; Sarath, G.; Walia, H. Rice Ovate Family Protein 2 (OFP2) alters hormonal homeostasis and vasculature development. Plant Sci. 2015, 241, 177–188. [Google Scholar] [CrossRef]
  15. Yang, C.; Ma, Y.; He, Y.; Tian, Z.; Li, J. OsOFP19 modulates plant architecture by integrating the cell division pattern and brassinosteroid signaling. Plant J. 2018, 93, 489–501. [Google Scholar] [CrossRef]
  16. Wu, S.; Zhang, B.; Keyhaninejad, N.; Rodriguez, G.R.; Kim, H.J.; Chakrabarti, M.; Illa-Berenguer, E.; Taitano, N.K.; Gonzalo, M.J.; Díaz, A.; et al. A common genetic mechanism underlies morphological diversity in fruits and other plant organs. Nat. Commun. 2018, 9, 4734. [Google Scholar] [CrossRef] [PubMed]
  17. Snouffer, A.; Kraus, C.; van der Knaap, E. The shape of things to come: Ovate family proteins regulate plant organ shape. Curr. Opin. Plant Biol. 2020, 53, 98–105. [Google Scholar] [CrossRef] [PubMed]
  18. Wang, Y.; Wang, Q.; Hao, W.; Sun, H.; Zhang, L. Characterization of the OFP Gene Family and its Putative Involvement of Tuberous Root Shape in Radish. Int. J. Mol. Sci. 2020, 21, 1293. [Google Scholar] [CrossRef] [PubMed]
  19. Liu, D.; Sun, W.; Yuan, Y.; Zhang, N.; Hayward, A.; Liu, Y.; Wang, Y. Phylogenetic analyses provide the first insights into the evolution of OVATE family proteins in land plants. Ann. Bot. 2014, 113, 1219–1233. [Google Scholar] [CrossRef] [PubMed]
  20. Yu, H.; Jiang, W.; Liu, Q.; Zhang, H.; Piao, M.; Chen, Z. Expression Pattern and Subcellular Localization of the Ovate Protein Family in Rice. PLoS ONE 2015, 10, e0118966. [Google Scholar] [CrossRef]
  21. Yuan, Y.; Zhang, Y.; Gao, S.; Tao, J. Bioinformatics and Expression of the OVATE Gene Family in Grape. Sci. Agric. Sin. 2016, 49, 3787–3797. [Google Scholar] [CrossRef]
  22. Qi, W.; Luo, Z.; Li, H.; Zhang, Z.; Yan, C.; Wang, J.; Liu, M. Identification and Bioinformatics Analysis of OVATE Gene Family in Chinese Jujube. Mol. Plant Breed. 2021, 19, 2207–2216. [Google Scholar]
  23. Li, H.; Dong, Q.; Zhao, Q.; Ran, K. Genome-wide identification, expression profiling, and protein-protein interaction properties of ovate family proteins in apple. Tree Genet. Genomes 2019, 15, 45. [Google Scholar] [CrossRef]
  24. Wang, P.; Luo, Y.; Huang, J.; Gao, S.; Zhu, G.; Dang, Z.; Gai, J.; Yang, M.; Zhu, M.; Zhang, H.; et al. The genome evolution and domestication of tropical fruit mango. Genome Biol. 2020, 21, 60. [Google Scholar] [CrossRef]
  25. Chen, C.; Wu, Y.; Li, J.; Wang, X.; Zeng, Z.; Xu, J.; Liu, Y.; Feng, J.; Chen, H.; He, Y.; et al. TBtools-II: A “one for all, all for one” bioinformatics platform for biological big-data mining. Mol. Plant 2023, 16, 1733–1742. [Google Scholar] [CrossRef]
  26. Katoh, K.; Standley, D.M. MAFFT Multiple Sequence Alignment Software Version 7: Improvements in Performance and Usability. Mol. Biol. Evol. 2013, 30, 772–780. [Google Scholar] [CrossRef]
  27. Nguyen, L.T.; Schmidt, H.A.; von Haeseler, A.; Minh, B.Q. IQ-TREE: A Fast and Effective Stochastic Algorithm for Estimating Maximum-Likelihood Phylogenies. Mol. Biol. Evol. 2015, 32, 268–274. [Google Scholar] [CrossRef]
  28. Kalyaanamoorthy, S.; Minh, B.Q.; Wong, T.K.F.; von Haeseler, A.; Jermiin, L.S. ModelFinder: Fast model selection for accurate phylogenetic estimates. Nat. Methods 2017, 14, 587–589. [Google Scholar] [CrossRef]
  29. Ada, T.F.; Delia, W. Tissue Processing and Hematoxylin and Eosin Staining. Histopathol. Methods Protoc. Methods Mol. Biol. 2014, 1180, 31–43. [Google Scholar] [CrossRef]
  30. Chen, S.; Zhou, Y.; Chen, Y.; Gu, J. fastp: An ultra-fast all-in-one FASTQ preprocessor. Bioinformatics 2018, 34, 884–890. [Google Scholar] [CrossRef]
  31. Wagner, G.P.; Kin, K.; Lynch, V.J. Measurement of mRNA abundance using RNA-seq data: RPKM measure is inconsistent among samples. Theory Biosci. 2012, 131, 281–285. [Google Scholar] [CrossRef]
  32. Livak, K.J.; Schmittgen, T.D. Analysis of relative gene expression data using real-time quantitative PCR and the 22−ΔΔCt Method. Methods 2001, 25, 402–408. [Google Scholar] [CrossRef]
  33. Gao, H.; Li, P.; Donf, T. Advances in the Study off Actors Influencing Fruit Shape. J. Trop. Biol. 2016, 7, 280–284. [Google Scholar] [CrossRef]
  34. Guo, J.; Cao, K.; Li, Y.; Yao, J.; Deng, C.; Wang, Q.; Zhu, G.; Fang, W.; Chen, C.; Wang, X.; et al. Comparative Transcriptome and Microscopy Analyses Provide Insights into Flat Shape Formation in Peach (Prunus persica). Front. Plant Sci. 2018, 8, 2215. [Google Scholar] [CrossRef]
  35. Gillaspy, G.; Hilla, B.D.; Wilhelm, G. Fruits: A Developmental Perspective. Plant Cell 1993, 5, 1439–1451. [Google Scholar] [CrossRef]
  36. Cannon, S.B.; Mitra, A.; Baumgarten, A.; Young, N.D.; May, G. The roles of segmental and tandem gene duplication in the evolution of large gene families in Arabidopsis thaliana. BMC Plant Biol. 2004, 4, 10. [Google Scholar] [CrossRef]
  37. Wang, S.; Chang, Y.; Ellis, B. Overview of OVATE FAMILY PROTEINS, A Novel Class of Plant-Specific Growth Regulators. Front. Plant Sci. 2016, 7, 417. [Google Scholar] [CrossRef]
  38. Zhang, Y.L.; Zhu, J.W.; Lao, A.; Li, Y.Z.; Xia, L.M.; MO, X.; Hu, W.L.; He, X.H.; Luo, C. Expression and functional analysis of MiOFP1 gene in mango. J. Fruit Sci. 2023, 40, 1099–1108. [Google Scholar] [CrossRef]
  39. Bleckmann, A.; Weidtkamp-Peters, S.; Seidel, C.A.M.; Simon, R. Stem Cell Signaling in Arabidopsis Requires CRN to Localize CLV2 to the Plasma Membrane. Plant Physiol. 2010, 152, 166–176. [Google Scholar] [CrossRef]
  40. Mauxion, J.P.; Chevalier, C.; Gonzalez, N. Complex cellular and molecular events determining fruit size. Trends Plant Sci. 2021, 26, 1023–1038. [Google Scholar] [CrossRef]
  41. Chen, H.B.; Huang, M.Y. Fruit growth and abscission of the mango (Mangifera indica L.) ZiHua. J. South China Agric. Univ. 1995, 16, 73–77. [Google Scholar]
  42. Xu, X.; Wang, X.; Zhou, S.; Huang, X.; Liu, P.; Ma, B.; Chen, X. Genome-Wide Identification and Characterization of the OFP Gene Family in the Wild Strawberry Fragaria vesca. Agronomy 2024, 14, 569. [Google Scholar] [CrossRef]
  43. Luo, Y.; Yang, S.; Luo, X.; Li, J.; Li, T.; Tang, X.; Liu, F.; Zou, X.; Qin, C. Genomewide analysis of OFP gene family in pepper (Capsicum annuum L.). Front. Genet. 2022, 13, 941–954. [Google Scholar] [CrossRef] [PubMed]
Figure 1. Locations, multiple-sequence alignment of MiOFP in mango: (A) Chromosomal locations of mango MiOFP genes. The intensity of the color of the chromosome is directly proportional to the gene density in that particular region; high gene density: red; low gene density: blue; (B) Two conserved motifs in OVATE domain. The overall height of each stack represents the conservation of the sequence at that position, and the height of the letters within each stack indicates the relative frequency of the respective amino acid; (C) The OVATE domain sequence alignment of mango OFPs. Identical or similar amino acids were shaded in same color box.
Genes 15 00823 g001
Figure 2. Phylogenetic relationship, conserved domains, conserved motif and promoter analyses of MiOFPs: (A) Phylogenetic relationship among the mango OFP proteins. Four clusters are labeled as Class 1, Class 2, Class 3, and Class 4; (B) Conserved domains of MiOFPs; (C) Conserved motifs of MiOFPs; (D) Analysis of cis-acting elements in the promoter region of the MiOFP gene family.
Genes 15 00823 g002
Figure 3. Phylogenetic and collinearity analysis of OFPs: (A) Numbers on branches indicate bootstrap values carried out with 1000 bootstrap replicates. Red star, OVATE, SlOFP1, and SlOFP20 of tomato (S. lycopersicum); circle, mango (M. indica). AtOFP, A. thaliana OFPs; SlOFP, tomato OFPs; OsOFP, rice OFPs; and MiOFP, mango OFPs; (B) Genome collinearity analysis was performed in A. thaliana, M. indica, and Solanum lycoperaicum. Black line represent the conserved OFP pairs between genomes.
Genes 15 00823 g003
Figure 4. Heatmap of mango MiOFPs gene expression in four tissues (five samples). The color key represents the relative transcript abundance of the MiOFP genes mango tissues.
Genes 15 00823 g004
Figure 5. Morphological changes in the fruit shape of elongated and round mango throughout fruit development: (A) Fruit shapes at different developmental stages. Fruits of elongated mango ‘HXY’ and round mango ‘JPM’ are present in the top and bottom rows, respectively. DAP1, one day after pollination. Bar = 10 mm; (B) Fruit longitudinal length, transverse width, and lateral thickness of ‘HXY’; (C) Fruit longitudinal length, transverse width, and lateral thickness of ‘JPM’; (D) Fruit shape index of ‘JPM’ and ‘HXY’; (E) Paraffin sections of the fruit pulp were examined at developmental stages DAP5, DAP7, and DAP10. The black arrow represents the direction of the fruit stalk. The scale bar represents 50 μm. Sections were stained with hematoxylin–eosin staining (HE).
Genes 15 00823 g005
Figure 6. Expression pattern analysis of MiOFPs in mango: (A) Heat map of 25 OFP genes from three developmental stages in ‘HXY’ and ‘JPM’; (B) PCA of global gene expression levels of all 18 samples data; (C) Differentially expressed genes between elongated and round-shaped fruits at the DAP5, DAP7, and DAP10 stages; (D) Venn diagram showing number of differentially expressed MiOFP genes (log2FC > 2; padj < 0.05); (E) RT-qPCR validation of MiOFP5, MiOFP11, MiOFP15, MiOFP21, MiOFP22, MiOFP23, and MiOFP25 in the development of different mango fruit. Error bar represents standard deviation from three replicates. Different stars number above the bars represent significant differences (p < 0.05, LSD) among two varieties.* = p < 0.05, ** = p < 0.01, *** = p < 0.001.
Genes 15 00823 g006
Table 1. Primers sequences used in MiOFPs in this study.
PrimerForward Primer (5′–3′)Reverse Primer (5′–3′)Amplicon Size
MiOFP5TCCGAAAGTTGTGGTCATCGAACCACCACAAAGCTCTCCG342
MiOFP11TCGCCACCATTTTCGCCTCCCGCCTCCTTTGAGTGG227
MiOFP21ACAGCACCACCGTTACCGTCACCACCGCAAAGCTGT251
MiOFP22CCCTCCACTCTCCCGTCAATCGCGGAGGAAACGTGG357
MiOFP23GATGCCCAGAAGCCAGCACGATATGGGCGAGGCAGG246
MiOFP25TAGCTGCCGTGCCACAATAGAGTCACCGGCAGCAAC391
MiActinATCTGCTGGAAGGTGCTGAGCCAAGCAGCATGAAGATCAA377
Table 2. Properties of OFPs identified from mango genome.
Gene NameGene IDChromosome LocationSize/aaMolecular Weight/DapIHydro-
Pathicity
Subcellular
Localization
MiOFP1LOC123225041Chr01:1286519–128790639244,485.469.55−0.744Chloroplast
MiOFP2LOC123195071Chr01:6284252–628549535640,684.179.47−0.658Chloroplast
MiOFP3LOC123193314Chr01:21257006–2125810028030,946.094.99−0.542Nucleus
MiOFP4LOC123192493Chr01:21271282–2127205618620,802.659.66−0.594Chloroplast
MiOFP5LOC123211132Chr03:5224343–522584534239,396.619.33−0.82Chloroplast
MiOFP6LOC123210957Chr03:7301842–730257924528,217.856.96−0.66Chloroplast
MiOFP7LOC123210960Chr03:7306821–731115524627,779.894.72−0.496Nucleus
MiOFP8LOC123212208Chr03:9478321–947926523426,334.214.85−0.468Chloroplast
MiOFP9LOC123219021Chr06:1870688–187220241147,439.159.41−0.944Chloroplast
MiOFP10LOC123219408Chr06:3989550–399091531735,881.419.71−0.874Chloroplast
MiOFP11LOC123221257Chr07:18070119–1807149922725,157.935.46−0.512Nucleus
MiOFP12LOC123223125Chr08:13809269–1381032123426,385.335.68−0.476Chloroplast
MiOFP13LOC123226435Chr09:14142901–1414387718320,445.096.08−0.652Chloroplast
MiOFP14LOC123226449Chr09:14365554–1436653018320,445.096.08−0.652Chloroplast
MiOFP15LOC123228213Chr10:6211065–621226628831,890.434.94−0.453Nucleus
MiOFP16LOC123228223Chr10:6224341–622511917820,108.719.37−0.626Chloroplast
MiOFP17LOC123230016Chr11:2215612–221694431836,541.549.54−0.828Mitochondrion
MiOFP18LOC123192669Chr12:5878219–587943923926,570.414.62−0.339Nucleus
MiOFP19LOC123193551Chr12:11701597–1170263723526,093.094.92−0.298Nucleus
MiOFP20LOC123192568Chr12:14354392–1435587839445,728.229.52−0.962Chloroplast
MiOFP21LOC123194383Chr13:11784106–1178538130335,157.899.67−0.795Chloroplast
MiOFP22LOC123199657Chr16:1741505–174279135740,800.539.43−0.642Chloroplast
MiOFP23LOC123200363Chr17:2891367–289251429633,965.459.53−0.758Mitochondrion
MiOFP24LOC123200256Chr17:11932352–1193325825528,843.275.77−0.64Chloroplast
MiOFP25LOC123202271Chr18:2977275–297879439144,206.979.56−0.8Chloroplast
Disclaimer/Publisher’s Note: The statements, opinions and data contained in all publications are solely those of the individual author(s) and contributor(s) and not of MDPI and/or the editor(s). MDPI and/or the editor(s) disclaim responsibility for any injury to people or property resulting from any ideas, methods, instructions or products referred to in the content.

