Article

Intraspecific and Intrageneric Genomic Variation across Three Sedum Species (Crassulaceae): A Plastomic Perspective

1
Anhui Provincial Key Laboratory of the Conservation and Exploitation of Biological Resources, Wuhu 241000, China
2
Suzhou Polytechnic Institute of Agriculture, Suzhou 215000, China
3
School of Basic Medical Sciences, Wannan Medical College, Wuhu 241002, China
4
School of Food and Bioengineering, Wuhu Institute of Technology, Wuhu 241003, China
5
Anhui Academy of Medical Sciences, Anhui Medical College, Hefei 230061, China
6
The Institute of Bioinformatics, College of Life Sciences, Anhui Normal University, Wuhu 241000, China
*
Authors to whom correspondence should be addressed.
Genes 2024, 15(4), 444; https://doi.org/10.3390/genes15040444
Submission received: 5 March 2024 / Revised: 29 March 2024 / Accepted: 29 March 2024 / Published: 31 March 2024
(This article belongs to the Special Issue Advances in Evolution of Plant Organelle Genome (Volume II))

Abstract

:
Sedum is the largest succulent genus in Crassulaceae. Because of predominant maternal inheritance, little recombination, and slow evolution, plastomes can serve as powerful super barcodes for inter- or intra-species phylogenetic analyses. While previous research has focused on plastomes between Sedum species, intra-species studies are scarce. Here, we sequenced plastomes from three Sedum species (Sedum alfredii, Sedum plumbizincicola, and Sedum japonicum) to understand their evolutionary relationships and plastome structural evolution. Our analyses revealed minimal size and GC content variation across species. However, gene distribution at IR boundaries, repeat structures, and codon usage patterns showed diversity at both inter-specific and intra-specific levels. Notably, an rps19 gene expansion and a bias toward A/T-ending codons were observed. Codon aversion motifs also varied, potentially serving as markers for future studies. Phylogenetic analyses confirmed the non-monophyly of Sedum and divided the Acre clade into two groups. Individuals from the same species clustered together, with strong support for the relationships between S. alfredii, S. tricarpum, and S. plumbizincicola. Additionally, S. japonicum clearly affiliates with the Acre clade. This study provides valuable insights into both intra-specific and intra-generic plastome variation in Sedum, as well as overall plastome evolution within the genus.

1. Introduction

Sedum, the largest genus of the family Crassulaceae, is a widely cultivated and diverse ornamental plant used in horticulture. It has various applications, such as those in medicine, ecology, and landscapes [1,2]. One of the most notable applications of the genus is a roof garden [3,4], which provides several benefits, including air filtration [5], temperature regulation [6], rainwater detention [7], and noise reduction [8]. According to World Flora Online (http://www.worldfloraonline.org/, accessed 1 February 2024), the genus Sedum currently consists of 476 accepted species. However, the phylogeny within the genus remains poorly understood and complex, and Sedum has been confirmed as non-monophyletic in previous studies [9,10,11]. Crassulaceae, also known as the stonecrop family, is a large family of succulent plants that contains over 1400 species across 33 genera. This family contains three subfamilies (Crassuloideae, Kalanchoideae, and Sempervivoideae), and the subfamily Sempervivoideae includes five clades, i.e., Telephium, Sempervivum, Aeonium, Leucosedum, and Acre. With approximately 73% of species assigned within the Acre clade, the remaining Sedum species are surprisingly intermingled with other Sempervivoideae clades [11]. This confusion may be due to insufficient data, limited resolution, or weak branch support [11,12,13]. To clarify the phylogenetic relationships within Sedum, further sampling and improved classification methods are needed.
With the advent of next-generation sequencing technology and the development of genome assembly software, plastomes are becoming easier to obtain. Because of maternal inheritance, little recombination, and slow evolution, plastomes can serve as powerful super barcodes for inter- or intra-species phylogenetic analyses [14,15,16]. Since the pioneering work by Shinozaki et al. [17] in reporting the first tobacco plastome, about 30,000 plastomes are now publicly available in NCBI (as of February 2024). Typically, these plastomes of higher plants can split into four distinct regions—large and small single-copy regions (LSCs and SSCs) and two inverted repeats (IRa and IRb), 120–160 kb in size [3]. These regions contain key genes responsible for photosynthesis and other metabolic functions. Furthermore, the IR regions are particularly important for maintaining the stability of the plastid genome and facilitating homologous recombination events. Moreover, the IR regions possess a distinct sequence composition that enables them to interact complementarily with one another. The typical plastome in the family Crassulaceae has a typical quadripartite structure, and it consists of 85 protein-coding genes (PCGs), 36–37 tRNA genes, 8 rRNA genes, and 4 pseudogenes. Therefore, investigating the structure and gene composition of plastomes is necessary for conducting comparative genomic studies and unraveling the mechanisms of plastid genome evolution.
While inter-species plastomic analyses have been conducted on various Crassulaceae genera (e.g., Crassula [10], Aeonium and Monanthes [18], Kalanchoe [19], Rhodiola [20,21,22], Telephium clade [16], and others [23,24,25]), research on intra-species diversity within Crassulaceae plastomes is lacking. Within a species, intra-species diversity describes the genetic differences found among individuals. The analysis of intra-species diversity can offer valuable insights into both evolutionary adaption and biodiversity conservation. Accordingly, further investigation in this field is required.
Codon usage bias (CUB), a phenomenon where synonymous codons (those coding for the same amino acid) are used unevenly within a genome, offers a powerful tool to investigate the evolutionary history of both taxa and genes [26,27]. The examination of CUB can offer valuable insights into genome evolution, including mutational preferences, translation efficiency, and the impact of selective pressures on various genes and genomic regions. Relative synonymous codon usage (RSCU) values are determined by dividing the observed occurrence of a codon by its expected frequency of that codon. They are used to quantify codon usage bias, which is the non-random use of synonymous codons. By examining RSCU patterns and codon preferences, we can infer the molecular mechanisms that influence codon usage, which may vary between various organisms, tissues, or developmental stages. Additionally, codon aversion motifs (CAMs), presented as the nonuse of codons in genes, have recently been proposed to be a novel marker for phylogenetic studies [16,18,28]. Compared to traditional alignment-based techniques, this CAM-based approach has several advantages, such as quicker computation and reduced complexity.
In this study, we present newly sequenced plastomes from sixteen individuals of three Sedum species (S. alfredii, S. plumbizincicola, and S. japonicum) belonging to the Acre clade. By combining these new data with existing plastome sequences retrieved from NCBI, we aim to address the following: (1) intraspecific and intrageneric plastomic variation across the three species and (2) the phylogeny of the Acre clade. Our findings provide valuable insights into both intraspecific and intrageneric plastome variation in Sedum, as well as overall plastome evolution within the genus.

2. Materials and Methods

2.1. Sample Collection and Plastome Sequencing

Sixteen samples from three Sedum species were collected in Eastern China, with five each from S. alfredii and S. japonicum and six from S. plumbizincicola. This ensured a good representation of the genetic variation within each species. Total DNA was extracted using the CTAB method [29]. In this approach, cetyltrimethylammonium bromide was employed to lyse cells, followed by the addition of organic solvents and alcohol precipitation to isolate DNA. In the next step, we used the TruSeq® DNA PCR-Free Library Prep Kit [30] to create a sequencing library, which is specifically designed to produce libraries that are high-quality and uniform. The resulting library was then sequenced on the Illumina Hiseq X Ten [31]. This is a high-throughput sequencing platform that allows for the parallel sequencing of millions of DNA fragments simultaneously. For this sequencing run, 150 paired ends and a 350 bp insert size were employed. Paired-end reads provide more accurate sequence data compared to single-end reads.

2.2. Plastome Assembly, Annotation, and Nucleotide Compositions Analysis

For this study, a multi-step process was used to examine the plastome sequences of the collected three Sedum species. This process included assembly, annotation, and comparative analysis. In the beginning, raw sequencing data were processed and assembled using GetOrganelle 1.7.5 [32], a pipeline created especially for the efficient assembly of organelle genomes from whole-genome sequencing data. The automated annotation program GeSeq [33], which identifies protein-coding and tRNA and rRNA genes in chloroplast genomes, was then used to annotate the genomes. The plastomes of S. sarmentosum (NC_023085), S. oryzifolium (NC_027837), and S. lineare (NC_052707) served as references, guaranteeing precise gene identification and boundary determination. In order to improve annotation results, manual correction was then carried out.
For further analysis, the only available plastome sequence of S. alfredii (NC_064359) was selected, providing additional context and a valuable basis for comparison. Each plastome was drawn individually using Chloroplot [34], a visualization tool that generates graphical representations of the circular chloroplast genome structure.
To better understand the structural features and junction sites of the plastome sequence, IRscope [35] was employed. This tool visualizes the features of genome structure, illustrating the proportional representation of plastome sequences on their respective junction sites. Nucleotide composition analysis was performed to assess the relative abundance of each nucleotide in the plastome sequences. This provided insights into the genomic composition and potential functional implications of the observed patterns.

2.3. Analyses of Dispersed and Simple Sequence Repeats

The online programs REPuter [36] and Misa [37] were used for identifying and comparing repeat sequences among the three species. These tools allowed for a comprehensive exploration of dispersed and simple sequence repeats, providing useful insights into the genomic composition. REPuter was used to search for dispersed repeats, with the following settings: all types of match direction, a hamming distance of 3, and a size limit of 30 to 300 bp. The hamming distance parameter allowed for a certain degree of sequence variation in the detected repeats, while the size limit ensured the identification of both short and moderately-sized dispersed repeats. By encompassing various match directions, this analysis captured a wide range of potential dispersed repeats across the genomes. In addition to dispersed repeats, Misa was employed to predict the number of simple sequence repeats (SSRs) within the examined genomes. The default search parameters were used, which include six groups of motif lengths (mono- to hexa-nucleotide motifs), a minimum number of repetitions, and a maximum interval length of 100 bp.

2.4. Codon Usage Analysis of the Plastome

To investigate the RSCU of the plastome, CodonW v.1.4.4 [38] was applied to calculate the values, excluding the termination codons. The RSCU is a value calculated to judge the usage frequency of different codons coding the same amino acid with the equation [39] as follows:
R S C U i j = x i j 1 n i j = 1 n i x i j
A codon usage frequency value greater than 1 indicates that the codon is used more often than the typical usage of the synonymous codons. Conversely, a value less than 1 indicates the opposite. Additionally, a heatmap was generated using the software TBtools [40] to visualize the codon usage frequencies with color shades. This visualization allows for a quick and easy identification of codons with biased usage patterns. Furthermore, CAM [28] was conducted to explore codon aversion in coding DNA sequence (CDS) with a length over 300 bp among the 18 plastomes.

2.5. Phylogenetic Analysis

To better understand the relationships among the three Sedum species, we conducted a phylogenetic analysis within the Acre clade of Sempervivoideae, using Rosularia alpestris as the outgroup (Table S1). A total of 36 plastomes were used, and 79 CDS were extracted from each. The multiple sequences were aligned by MAFFT 7.520 [41] to obtain an aligned CDS dataset, which was then concatenated using PhyloSuite 1.2.3 [42]. Both maximum likelihood (ML) and Bayesian inference (BI) methods were performed to reconstruct evolutionary trees.
For the ML analysis, RAxML 8.0.0 [43] was employed based on the concatenated sequences, using 1000 bootstrap replicates and the GTRCAT model. Convergence was checked under the autoMRE criteria. For the BI inference, the processing files were created by SequenceMatrix 1.9 [44], and the best model was selected by ModelTest-NG 0.1.7 [45] among the split CDSs. MrBayes 3.2.7 [46] was then run for 10 million generations, sampling every 1000th generation. All Markov chain Monte Carlo (MCMC) simulations were repeated twice, and Tracer v.1.7.1 [47] was used to verify convergence.

3. Results

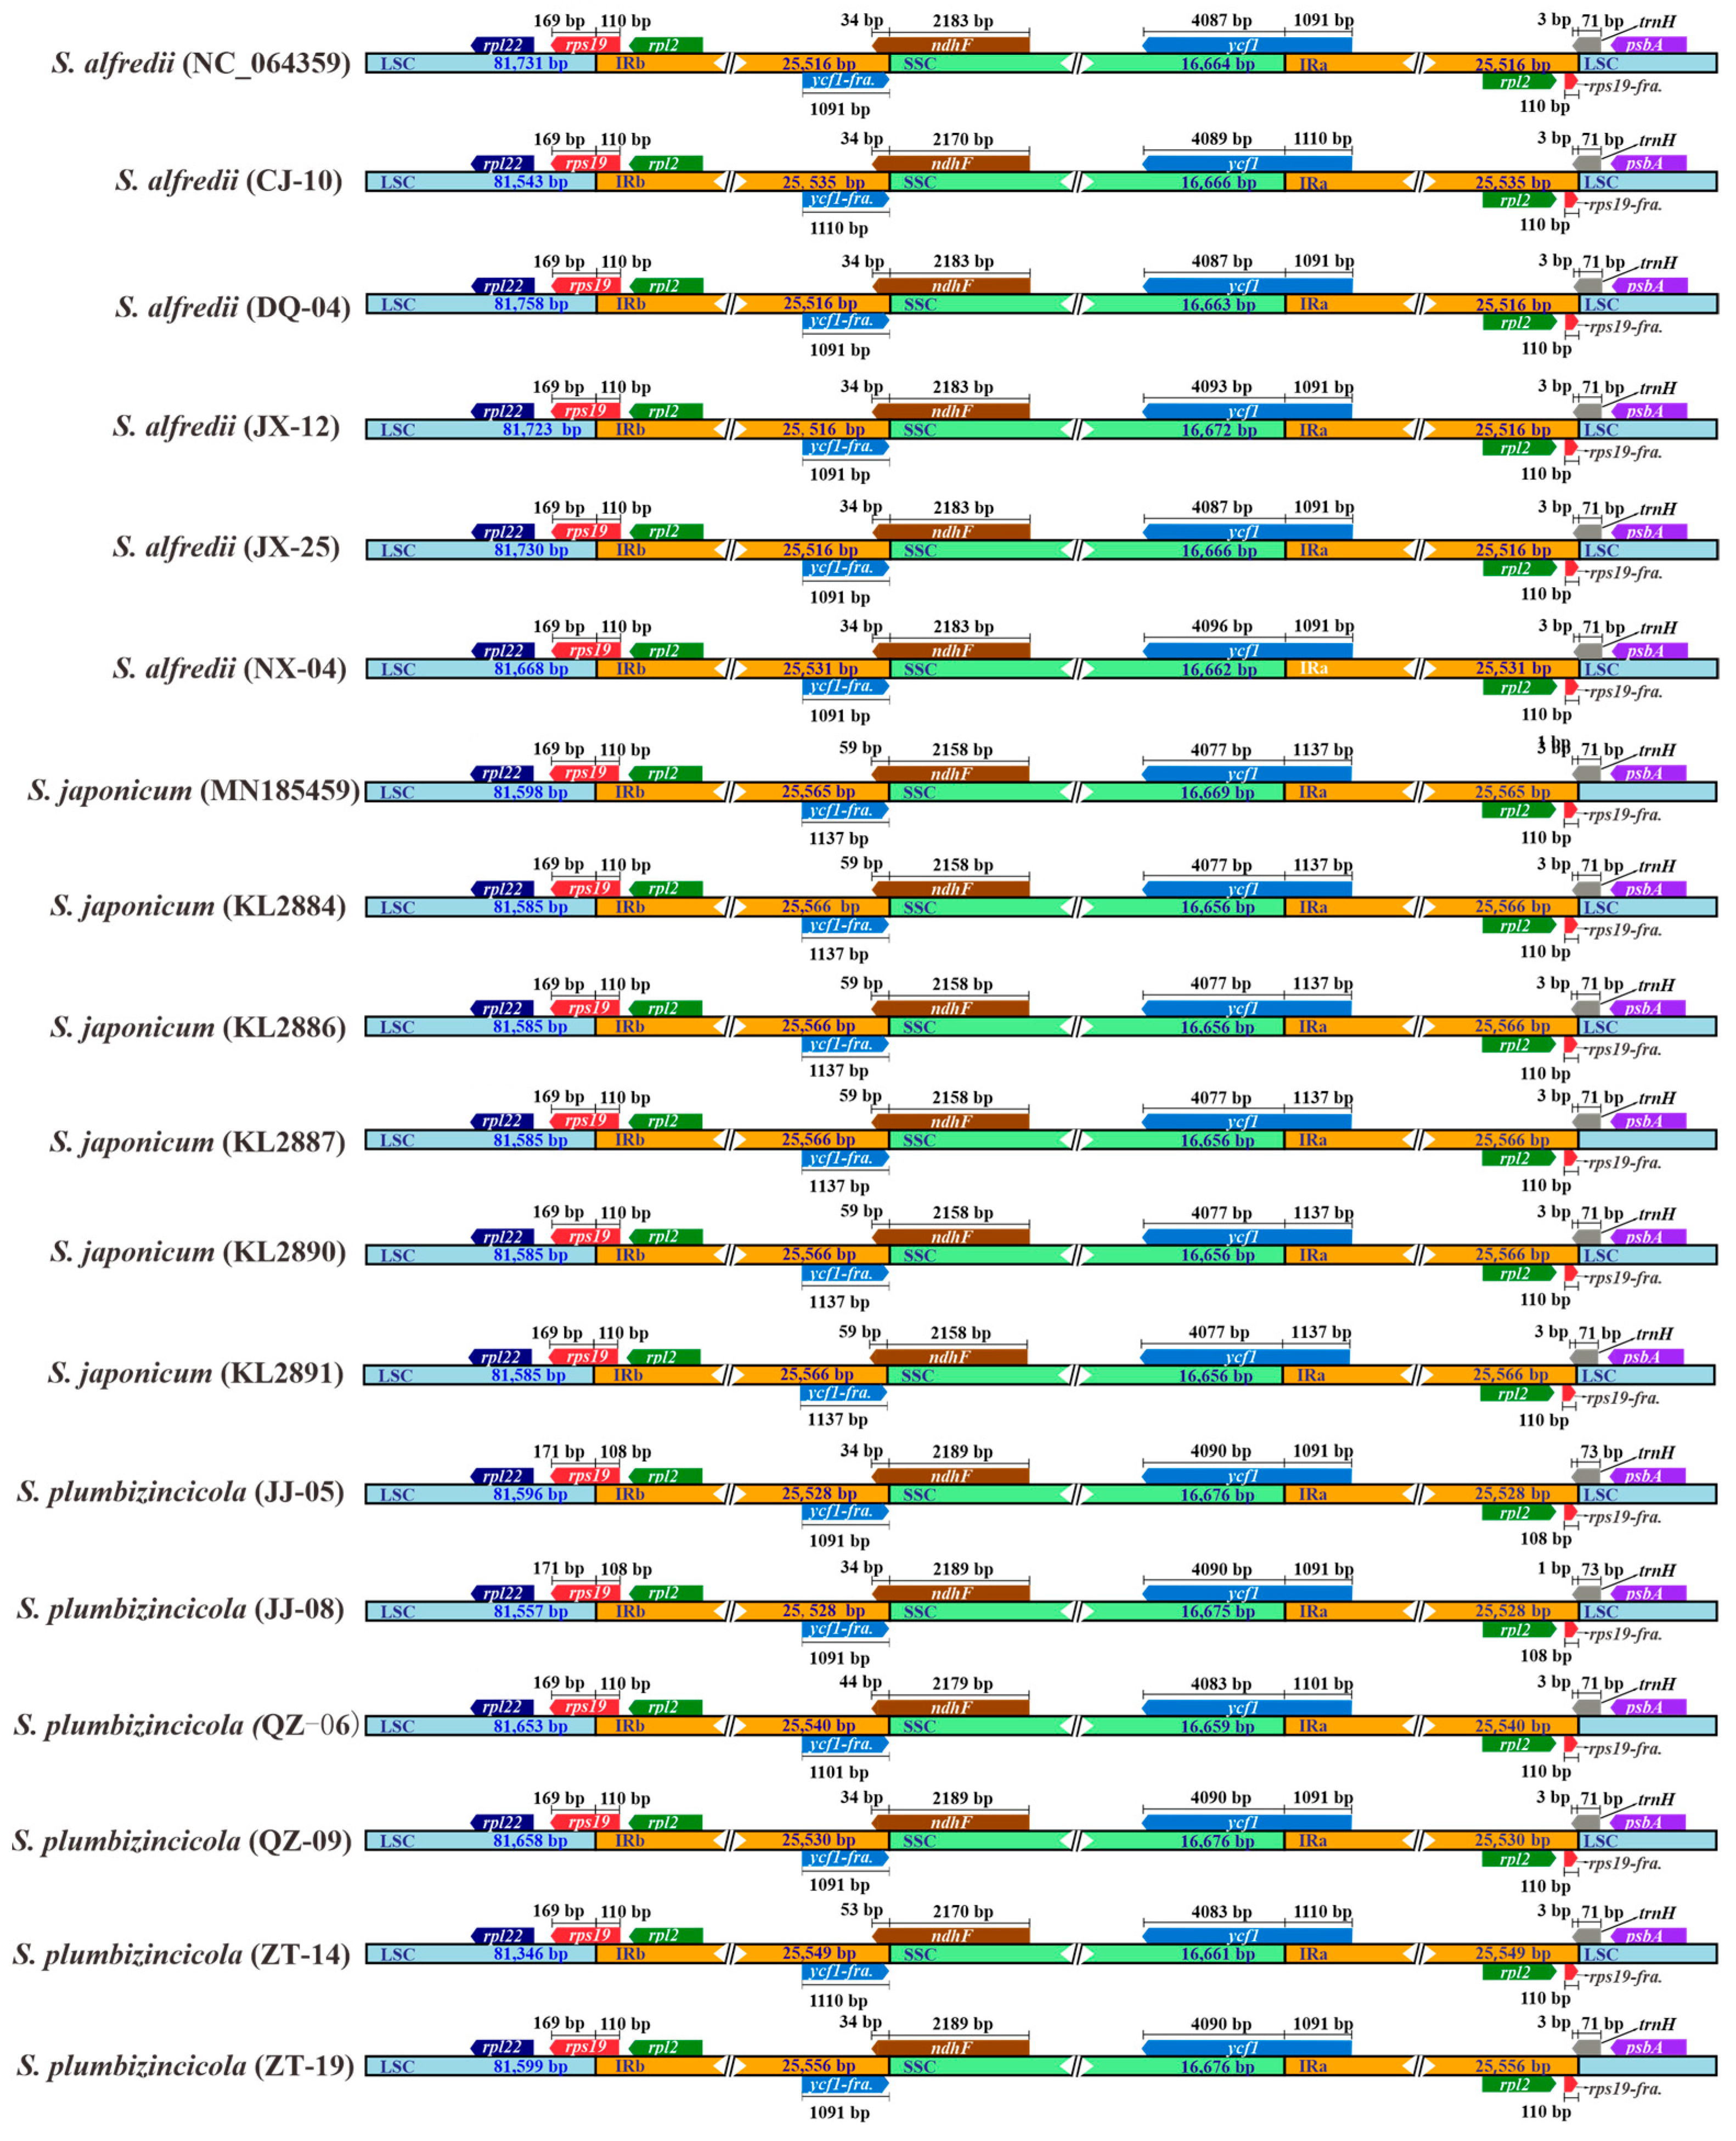
3.1. Comparative Analysis of Composition and Structure

Based on the assembled 16 plastomes, the estimated read coverage all reached 100% (Table S2, Supplementary Materials). Analysis of plastome size and GC content revealed no significant variations among the three investigated Sedum species. The length of the sequences ranged from 149,105 to 149,394 bp in S. plumbizincicola, with a maximal difference of 289 bp. In S. alfredii, the length ranged from 149,279 to 149,453 bp, while in S. japonicum, the range was 149,373 to 149,397 bp, with a minimum difference of 24 bp. Notably, the GC content for all individuals across the three species was highly similar, with a narrow range of 37.7% to 37.8% (Figure 1, Table 1).
Comparative analysis of all plastomes of the three species revealed a conserved model within the IR regions and the gene structures flanking the four distinct junction sites. The genes rps19, ndhF, ycf1, and trnH, located at the IR junctions, share a portion of their sequence with the inverted repeats of all the plastomes. Additionally, our study demonstrates a consistent gene order and a high degree of similarity in the length of IR regions. However, some contrasts still exist in the IR-boundary distribution of genes between species and even within the same species. For example, S. plumbizincicola exhibits the highest length variations across all genes or regions, as shown in Figure 1. Conversely, S. japonicum displays the lowest variations based on standard deviation (StDev) calculations (Table 1). Furthermore, the length of the ndhF gene extending into the IRb region can be used to distinguish S. japonicum from the other two species. For all S. japonicum samples, their lengths reach 59 bp, while those of the other two species are 34, 44, or 53 bp. The extended lengths of the samples in S. plumbizincicola fall in between with variations (Figure 2, Table S3).

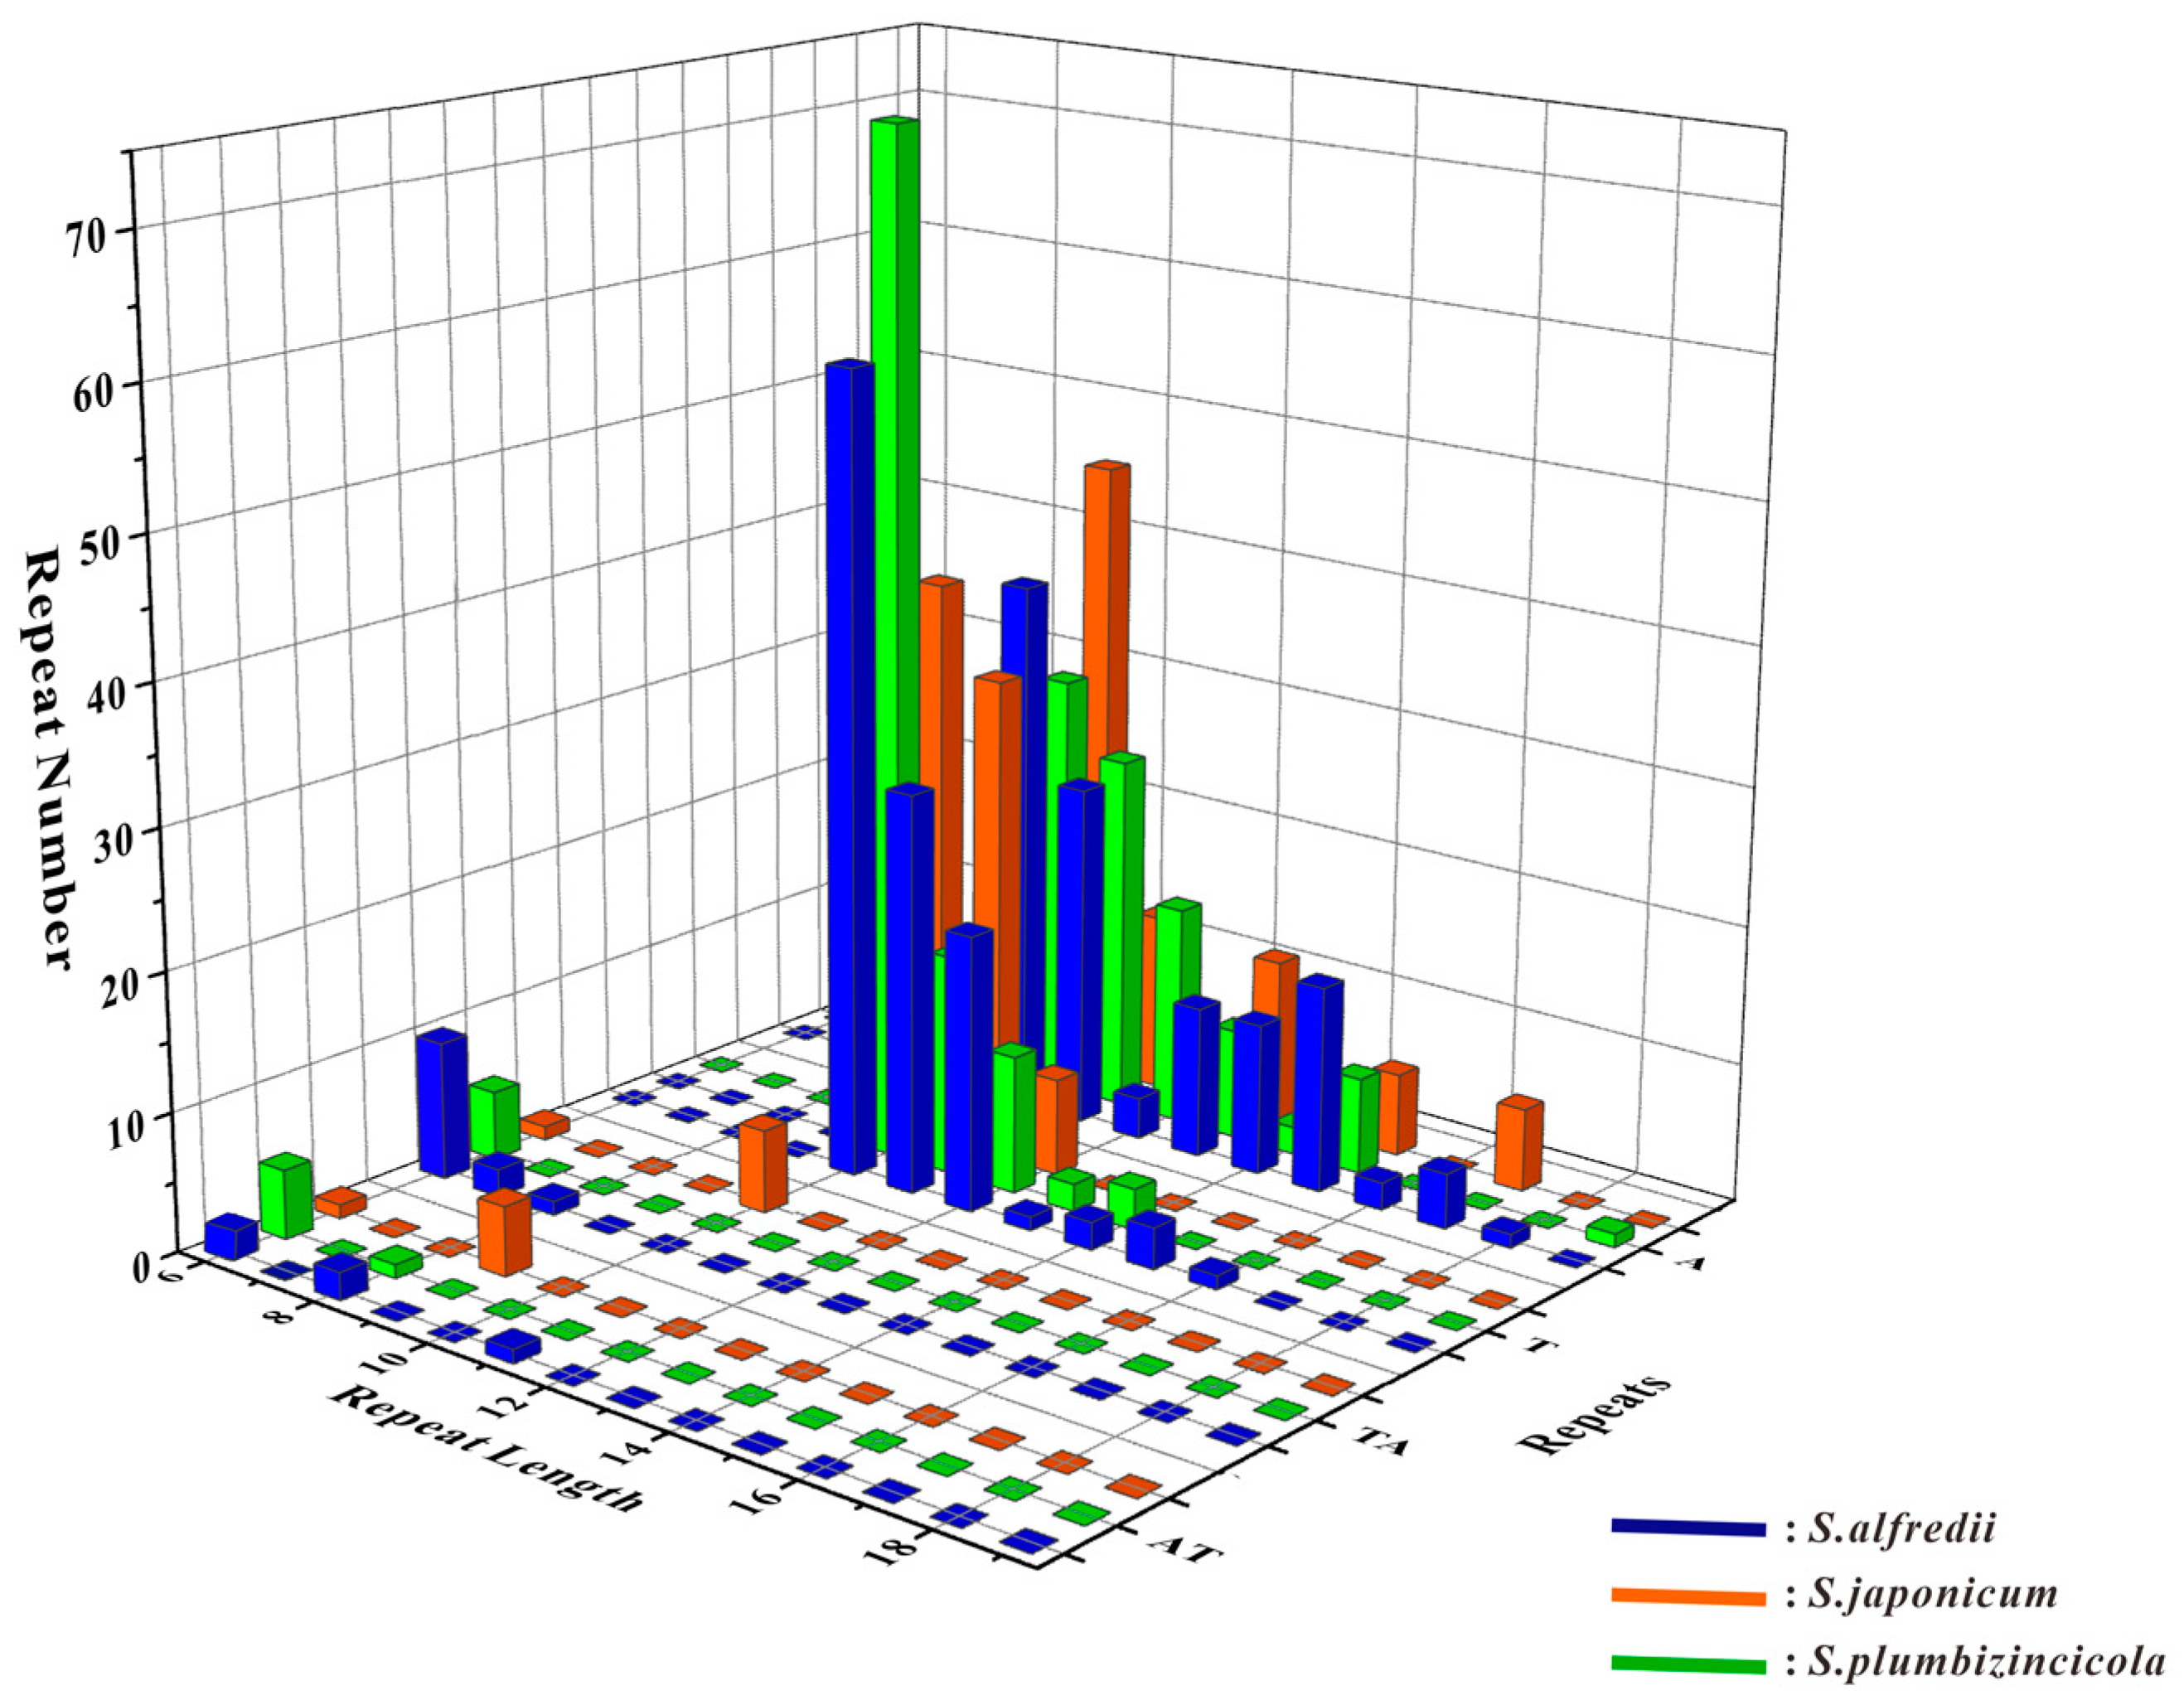
3.2. Analysis of Repeats in Three Sedum Species

This study identified 110, 120, and 134 dispersed repeat members in S. plumbizincicola, S. alfredii, and S. japonicum, respectively. We analyzed these repeats based on both type and length (Figure 3, Table S4). The results showed that most repeats were 30–39 bp in length, forward, and palindromic, which is the main source of variation between the species. Notably, the number of repeats with 40–49 bp and 50–59 bp remained stable across all three species. Interestingly, the 40–49 bp repeats even can be used to distinguish S. alfredii because of the unique presence of five such repeats. Furthermore, reverse dispersed repeats were observed in S. japonicum, but with very low probability (only one instance in an individual).
For the SSR analysis, only mononucleotides and dinucleotides repeats were discovered in the three Sedum species. These species shared the same types of SSRs: A, AT, T, and TA. Most of these SSRs were mononucleotides (A/T), covering over 90% of all identified repeats. However, some variations in number were observed. S. japonicum had the least number of SSRs, with only 180, while S. alfredii had the most, with 243 (Table S5). The distributions of these SSRs showed relatively distinct differences, as illustrated in Figure 4.

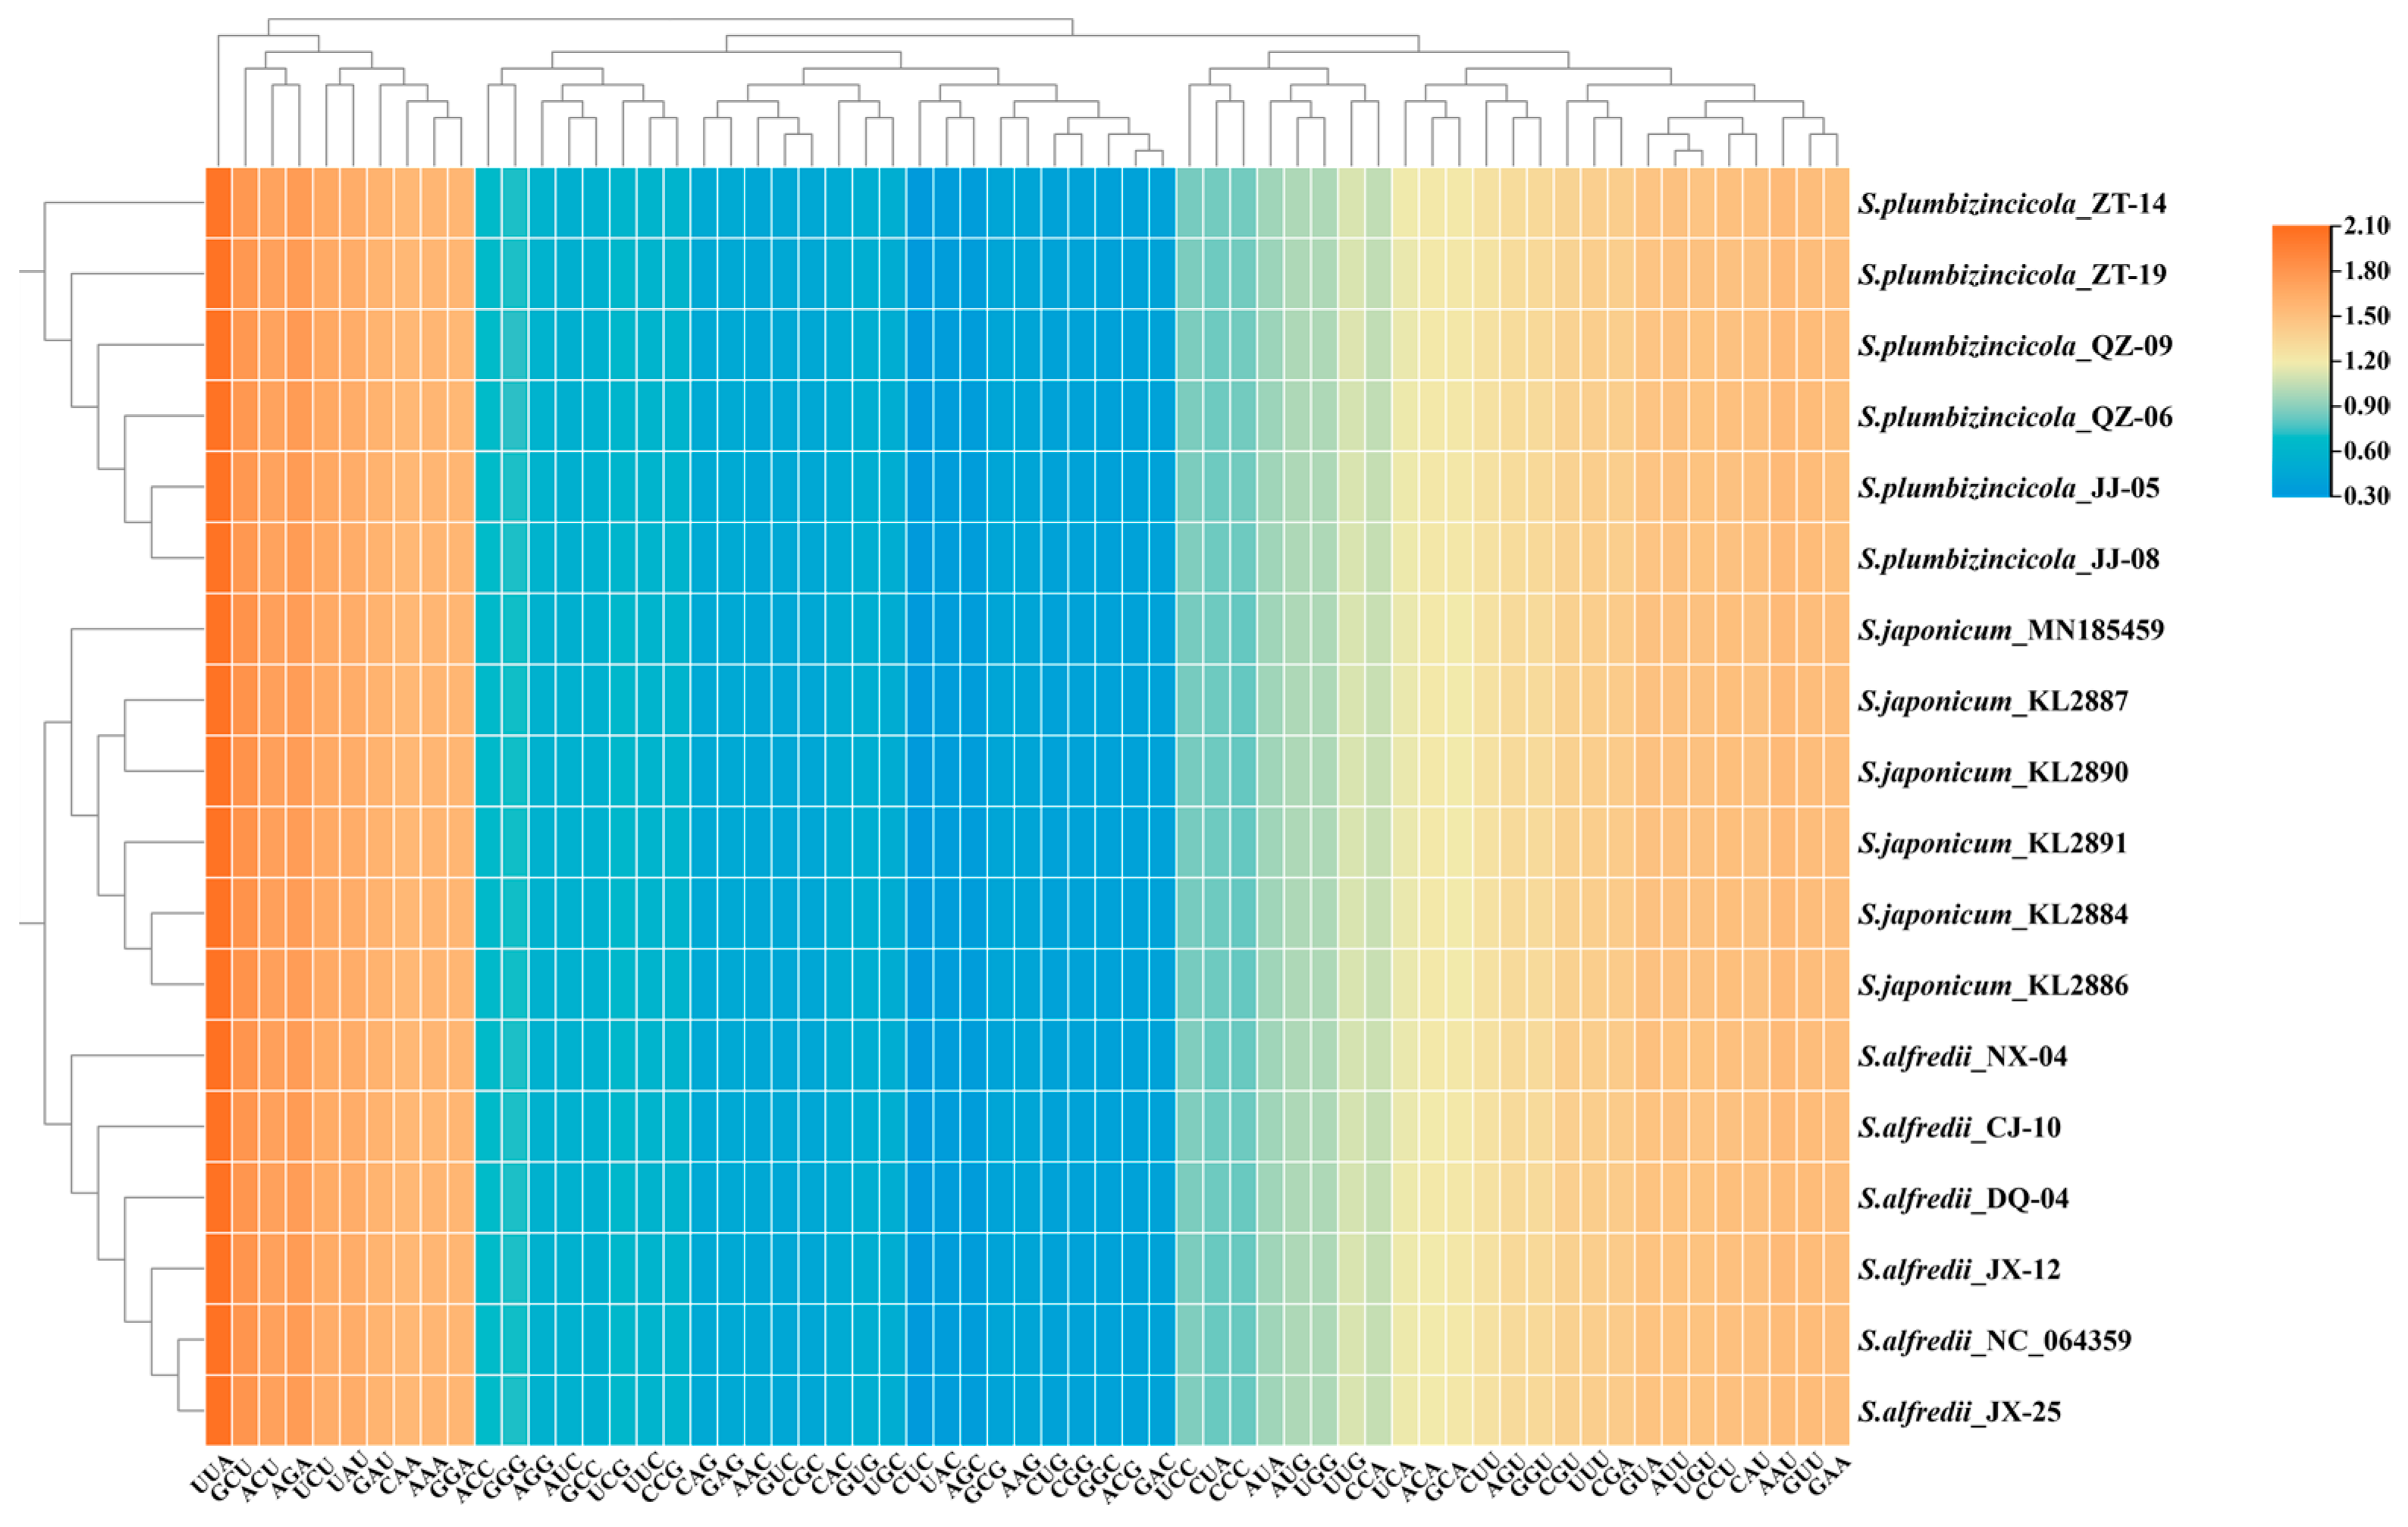
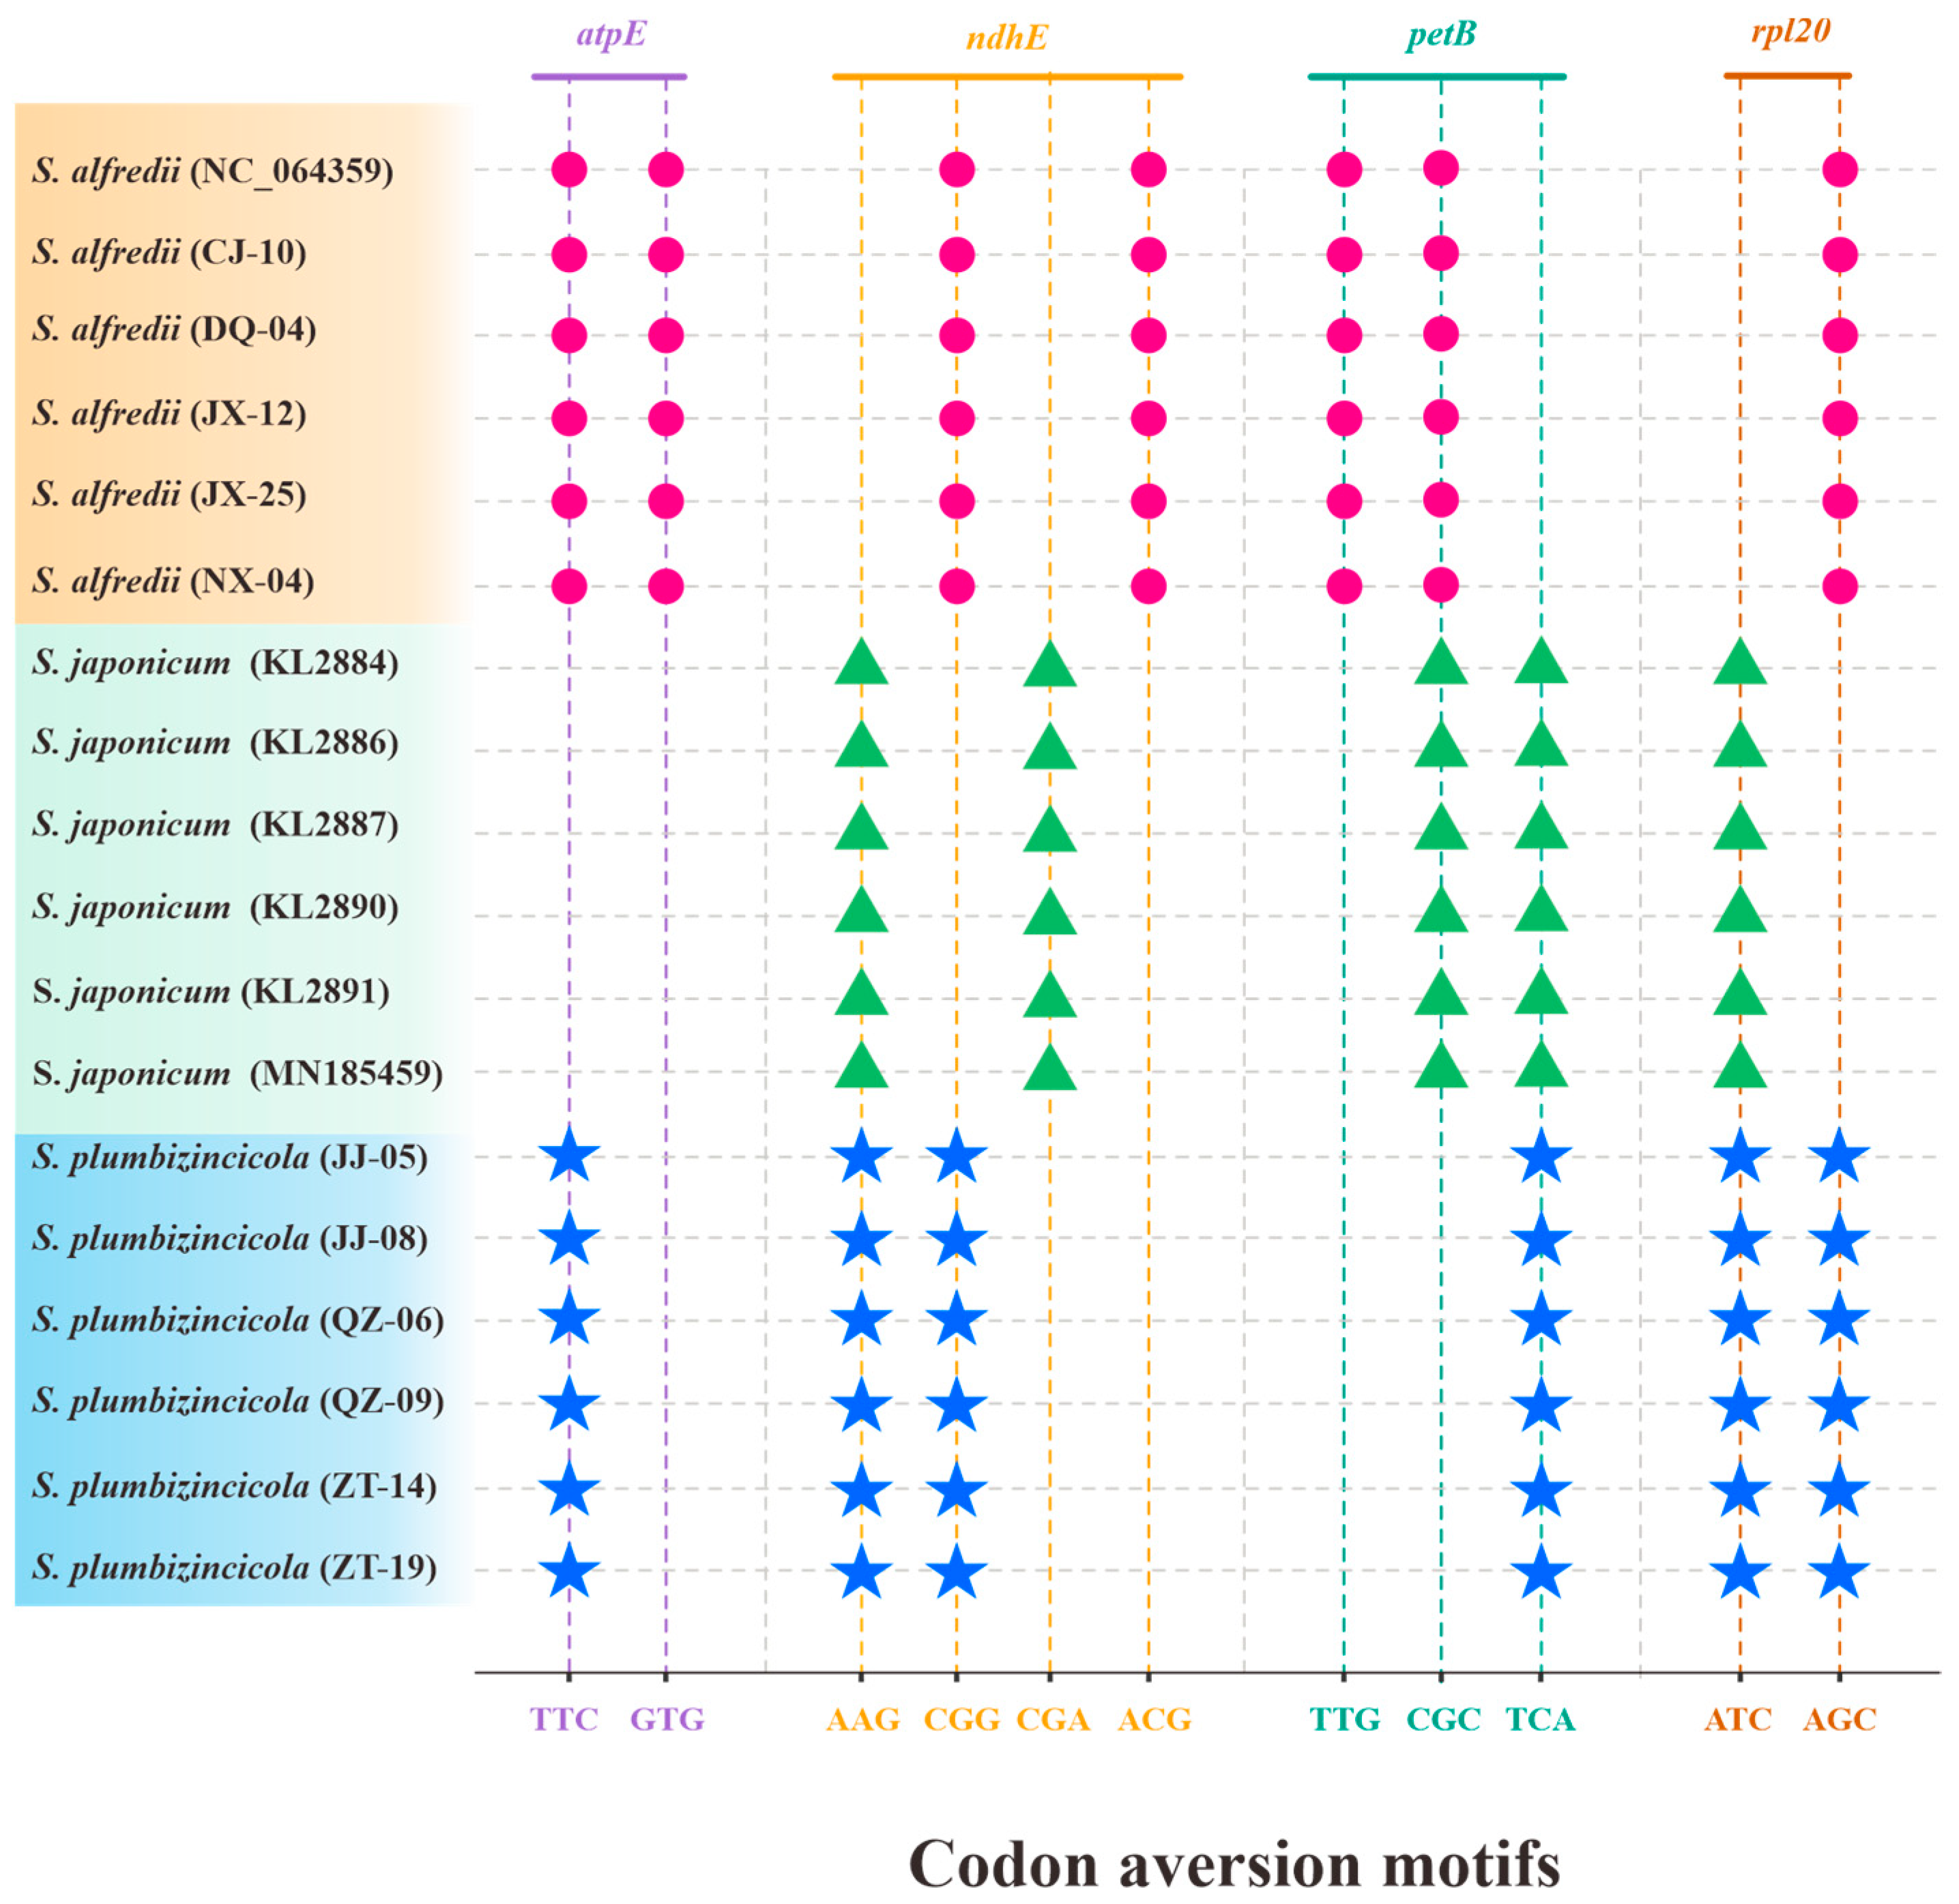
3.3. Codon Usage and Aversion Patterns

A total of 53 genes were investigated for codon usage and aversion. In our study, all RSCU values exhibited a highly similar pattern among the 18 plastomes, with the lowest values (0.32) observed for CUC and the highest value (2.07) found for UUA (Figure 5, Table S6). Interestingly, both extreme values occurred for the same amino acid, leucine. This suggests a strong codon bias for leucine in these plastomes. Six codons were overrepresented (RSCU > 1.6), while 21 codons were underrepresented (RSCU < 0.6). Notably, a significant preference for A/T-ending codons was observed across all species. Variations in RSCU values (Table S6) existed at the intraspecies level. In S. plumbizincicola, only 22 of 61 (excluding stop codons) had the same RSCU values as the average across all individuals. S. alfredii showed even fewer consistent codons (16). Conversely, S. japonicum exhibited consistency in most codons (59).
Regarding codon aversion motifs, our work revealed both similarities and variations across the three species. Aversion patterns were present in most of the genes, with only five exceptions: rpoB, rpoC1, rpoC2, ycf1, and ycf2. Notably, these patterns could effectively distinguish the species. Four genes (atpE, ndhE, petB, and rpl20) completely separated the three species (Figure 6), while an additional 11 genes differentiated S. alfredii and S. plumbizincicola (Table S7). Similar to RSCU values, individual variations were also observed in codon aversion motifs. Thirteen genes displayed individual-specific aversion patterns, with 10 in S. plumbizincicola, 6 in S. alfredii, and none in S. japonicum. Interestingly, matK, ndhJ, and rps3 genes exhibited variations in both S. plumbizincicola and S. alfredii (Table S8).

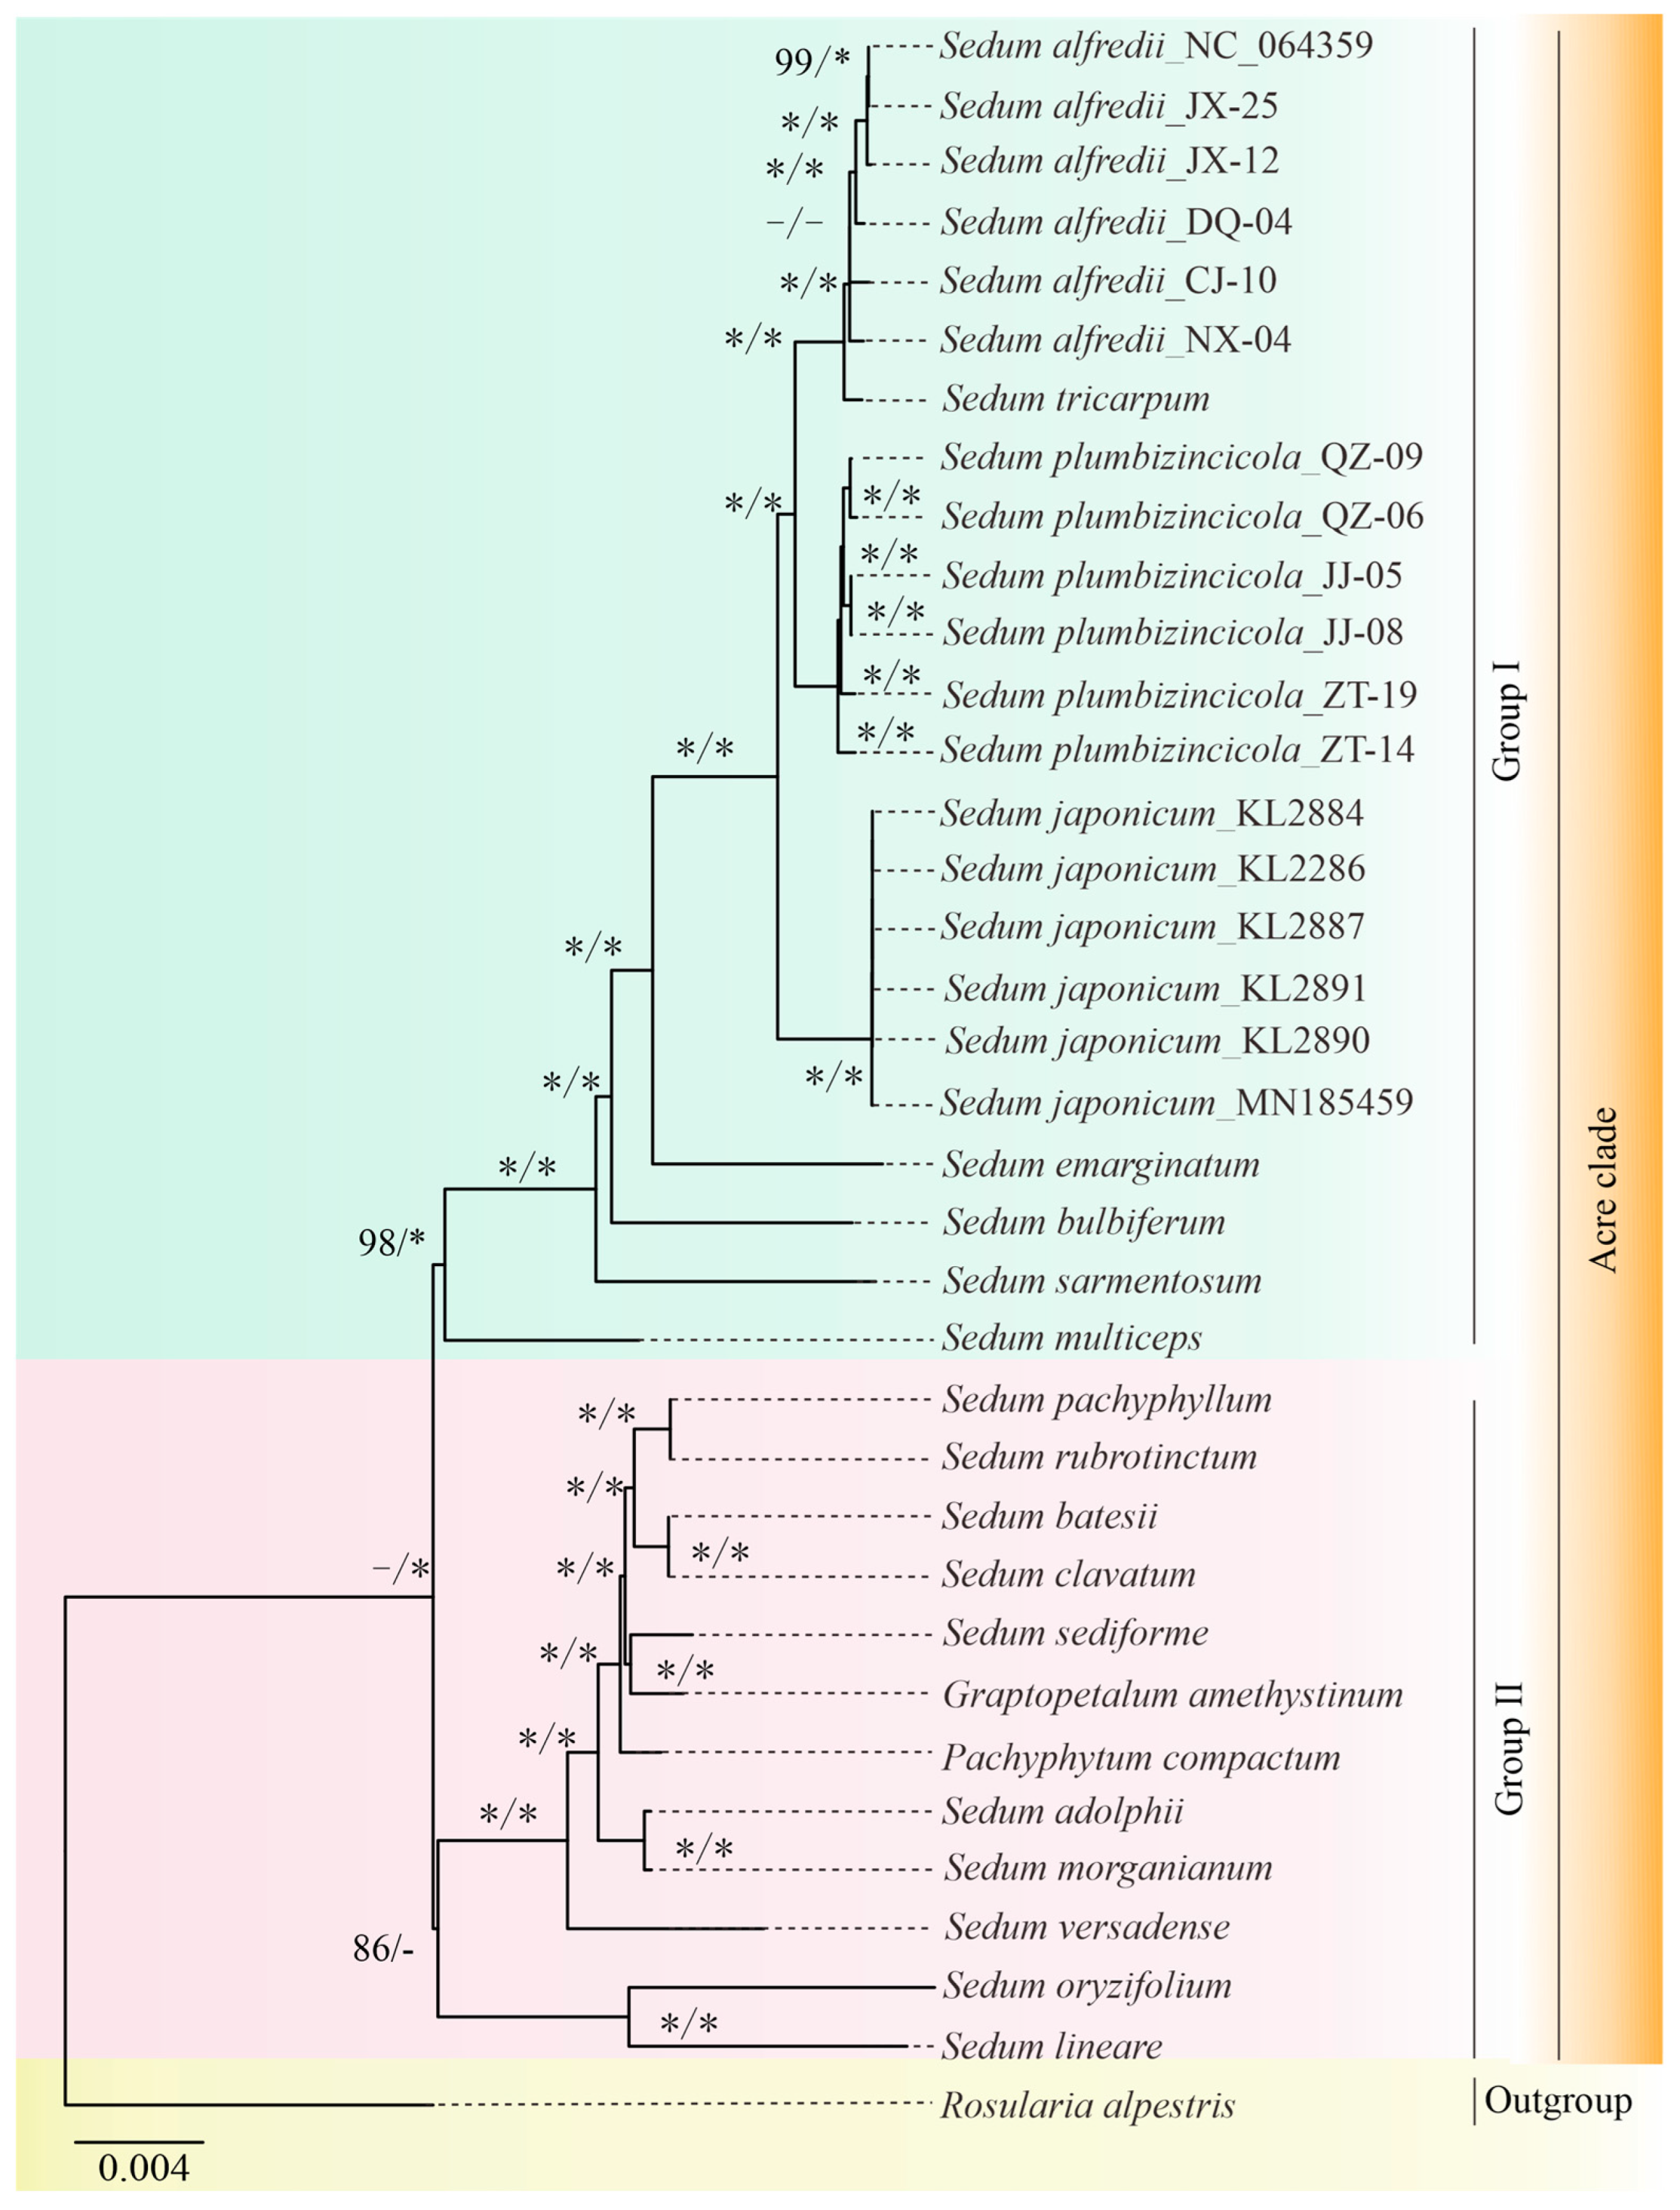
3.4. Phylogenetic Analysis

The ML and BI inferences were obtained using a 68,382-bpPCG matrix. Our ML analysis revealed that the genus Sedum is non-monophyletic, and the Acre clade could be further divided into two groups (Figure 7). Group I contains 23 plastomes from seven species ([BS] = 98), all belonging to Sedum. The remaining 12 plastomes belong to Group II ([BS] = 86), comprising individuals from three genera: Sedum, Pachyphytum, and Graptopetalum. Notably, Group II lacked support from our BI analysis.
Although the tree topologies constructed by the two methods were slightly different, our phylogenetic analyses successfully inferred both inter- and intra-specific relationships within and among the three studied Sedum species (S. japonicum, S. alfredii, and S. plumbizincicola), except for S. japonicum specimen. Individuals from the same species were grouped, and all eighteen individuals formed distinct clusters with high support in both trees with strong support values ([BS] = 100, [PP] = 1.00). Furthermore, S. alfredii and S. tricarpum share a close relationship and form a sister group with S. plumbizincicola ([BS] = 100, [PP] = 1.00). These three species, along with S. japonicum, together constitute a clade ([BS] = 100, [PP] = 1.00).

4. Discussion

In this study, we report the plastome sequences of S. japonicum for the first time and augment the plastome data for S. alfredii and S. plumbizincicola. In total, we contribute 16 new plastome datasets, addressing the data gap [11] on Sedum and providing additional molecular evidence for species identification. Through comparative analysis of sequence composition, structure, and codon usage bias, we surprisingly found diversities at both interspecific and intraspecific levels.
The expansion and contraction events in IR regions are common in plastomes and are closely related to the evolutionary history of species [48]. For instance, the 110 bp expansion of the rps19 gene was identified as a specific marker because of its universality in Aeonium, Monanthes, and some other genera [10,18]. While most sequences share this feature, there are still exceptions in S. plumbizincicola individuals, with lengths of 108 and 109 bp. Therefore, we propose that this approximately 110 bp expansion can serve as a potential marker for phylogenetic studies within the Crassulaceae family.
Mononucleotide SSRs are consistently abundant in plastomes [49,50], with some studies reporting them as the most common type of SSR [51]. Among these mononucleotide repeats, while C/G type SSRs may be prevalent in specific species [5,52], A/T types are more commonly observed in land plants [53,54,55,56,57]. Our research confirms this pattern, showing an A/T proportion of over 90%, significantly exceeding other types. Furthermore, because of their high diversity, SSRs are widely used to study phylogenetic relationships, genetic variation, and evolutionary mechanisms [58]. Though variability in SSR numbers is common above genus level (minimal among close relatives) [51], our study of three Sedum species reveals detectable differences in number, length, and motif distribution.
Like other Crassulaceae species [10,16,18], A/T-ending codons are favored in S. alfredii, S. japonicum, and S. plumbizincicola. As previous studies have shown, a close association exists between RSCU values and species phylogeny [59,60,61]. Consistent with this, our heatmap analysis reveals three distinct clusters, reflecting a closer relationship between S. japonicum and S. alfredii. This further supports the notion that RSCU may harbor considerable phylogenetic implications. However, this finding contradicts our phylogenetic results, which need further exploration.
To date, research on specific codon aversion analysis remains limited. However, several studies have demonstrated the effectiveness of codon aversion motifs in distinguishing different lineages based on specific characteristics [9,16,18]. Interestingly, our investigation focused on the species level and revealed that individuals within the same species can exhibit diverse codon aversions.
Despite significant morphological similarities, heavy metal enrichment capacity, and some molecular features, S. alfredii and S. plumbizincicola exhibit distinct characteristics [62,63,64,65]. This study provides more specific molecular evidence to support their independent status. Phylogenetic trees clearly separate the 12 individuals into three lineages, with S. tricarpum and S. alfredii forming a sister clade to S. plumbizincicola. Furthermore, S. japonicum, whose plastome sequences were first reported in this study, showed high similarities to S. alfredii and S. plumbizincicola in nucleotide composition, structure, and codon usage motifs. Moreover, phylogenetic trees consistently place S. japonicum within a clade containing S. alfredii, S. plumbizincicola, and S. tricarpum, with strong statistical support. This suggests a potential affiliation of S. japonicum is assigned to the Acre clade.

Supplementary Materials

The following supporting information can be downloaded at https://www.mdpi.com/article/10.3390/genes15040444/s1: Table S1: Additional species included for phylogenetic tree; Table S2: Reads coverage and depth of 16 Sedum samples that are mapped to the assembled plastomes; Table S3: Sizes of plastomic quadripartite regions and boundary-located genes in three Sedum species; Table S4: Distributions of the dispersed repeats classified by type and length; Table S5: Distributions of the SSRs classified by type and length; Table S6: RSCU values of 18 investigated plastomes; Table S7: Specific codon aversion motifs only separate S. alfredii and S. plumbizincicola; Table S8: Variable codon aversion motifs at intra-specific level.

Author Contributions

Conceptualization, X.K.; methodology, S.H.; software, S.Z., J.Y. and Y.Y.; validation, D.B. and W.G.; formal analysis, S.Z. and S.H.; investigation, J.G.; resources, S.Z.; data curation, S.Z. and S.H.; writing—original draft, S.Z.; writing—review and editing, X.K.; supervision, C.D. and X.K.; project administration, X.K.; funding acquisition, C.D. and X.K. All authors have read and agreed to the published version of the manuscript.

Funding

This research was funded by the Basic Research Program of Natural Science Foundation of Jiangsu Province of China (Grant no. BK20211078), the Opening Foundation of National Engineering Laboratory of Soil Pollution Control and Remediation Technologies, and Key Laboratory of Heavy Metal Pollution Prevention & Control, Ministry of Agriculture and Rural Affairs (Grant no. NEL&MARA-003).

Institutional Review Board Statement

Not applicable.

Informed Consent Statement

Not applicable.

Data Availability Statement

The 16 plastomes sequences data generated in this study are available in GenBank of the National Center for Biotechnology Information (NCBI) (https://www.ncbi.nlm.nih.gov/nuccore accessed 1 February 2024) under the access numbers: PP234488–PP234498 and PP234500–PP234504.

Conflicts of Interest

The authors declare no conflicts of interest. The funders had no role in the design of the study; in the collection, analyses, or interpretation of data; in the writing of the manuscript; or in the decision to publish the results.

References

  1. Baskin, J.M.; Baskin, C.C. Germination ecology of Sedum pulchellum Michx.(Crassulaceae). Am. J. Bot. 1977, 64, 1242–1247. [Google Scholar] [CrossRef]
  2. Debabrata, D.; Gupta, J.; Anindya, B. Medicinal exploitation of the plants belonging to the family: Crassulaceae. Nat. Prod. I 2007, 15, 127–135. [Google Scholar]
  3. Durhman, A.K. Evaluation of Crassulacean Species for Extensive Green Roof Applications; Michigan State University: East Lansing, MI, USA, 2005. [Google Scholar]
  4. Villarreal, E.L.; Bengtsson, L. Response of a Sedum green-roof to individual rain events. Ecol. Eng. 2005, 25, 1–7. [Google Scholar] [CrossRef]
  5. Liu, S.; Wang, Z.; Su, Y.; Wang, T. Comparative genomic analysis of Polypodiaceae chloroplasts reveals fine structural features and dynamic insertion sequences. BMC Plant Biol. 2021, 21, 31. [Google Scholar] [CrossRef]
  6. Peron, F.; De Maria, M.; Spinazzè, F.; Mazzali, U. An analysis of the urban heat island of Venice mainland. Sustain. Cities Soc. 2015, 19, 300–309. [Google Scholar] [CrossRef]
  7. Gong, Y.; Yin, D.; Fang, X.; Zhai, D.; Li, J. Rainwater retention effect of extensive green roofs monitored under natural rainfall events–a case study in Beijing. Hydrol. Res. 2018, 49, 1773–1787. [Google Scholar] [CrossRef]
  8. Azkorra, Z.; Pérez, G.; Coma, J.; Cabeza, L.F.; Burés, S.; Álvaro, J.E.; Erkoreka, A.; Urrestarazu, M. Evaluation of green walls as a passive acoustic insulation system for buildings. Appl. Acoust. 2015, 89, 46–56. [Google Scholar] [CrossRef]
  9. Bi, D.; Han, S.; Zhou, J.; Zhao, M.; Zhang, S.; Kan, X. Codon Usage Analyses Reveal the Evolutionary Patterns among Plastid Genes of Saxifragales at a Larger-Sampling Scale. Genes 2023, 14, 694. [Google Scholar] [CrossRef]
  10. Ding, H.; Han, S.; Ye, Y.; Bi, D.; Zhang, S.; Yi, R.; Gao, J.; Yang, J.; Wu, L.; Kan, X. Ten plastomes of Crassula (Crassulaceae) and phylogenetic implications. Biology 2022, 11, 1779. [Google Scholar] [CrossRef]
  11. Messerschmid, T.F.E.; Klein, J.T.; Kadereit, G.; Kadereit, J.W. Linnaeus’s folly—Phylogeny, evolution and classification of Sedum (Crassulaceae) and Crassulaceae subfamily Sempervivoideae. Taxon 2020, 69, 892–926. [Google Scholar] [CrossRef]
  12. Carrillo-Reyes, P.; Sosa, V.; Mort, M.E. Molecular phylogeny of the Acre clade (Crassulaceae): Dealing with the lack of definitions for Echeveria and Sedum. Mol. Phylogenetics Evol. 2009, 53, 267–276. [Google Scholar] [CrossRef] [PubMed]
  13. Deng, Z.; Huang, K.; Xie, P.; Xie, S.; Zhang, N.; Yin, H.; Ping, M.; Wang, Y. The complete chloroplast genome sequence of Sedum bulbiferum (Crassulaceae). Mitochondrial DNA Part B 2023, 8, 598–602. [Google Scholar] [CrossRef] [PubMed]
  14. Li, X.; Yang, Y.; Henry, R.J.; Rossetto, M.; Wang, Y.; Chen, S. Plant DNA barcoding: From gene to genome. Biol. Rev. 2015, 90, 157–166. [Google Scholar] [CrossRef] [PubMed]
  15. Parks, M.; Cronn, R.; Liston, A. Increasing phylogenetic resolution at low taxonomic levels using massively parallel sequencing of chloroplast genomes. BMC Biol. 2009, 7, 84. [Google Scholar] [CrossRef] [PubMed]
  16. Yang, J.; Ye, Y.; Yi, R.; Bi, D.; Zhang, S.; Han, S.; Kan, X. A new perspective on codon usage, selective pressure, and phylogenetic implications of the plastomes in the Telephium clade (Crassulaceae). Gene 2024, 892, 147871. [Google Scholar] [CrossRef] [PubMed]
  17. Shinozaki, K.; Ohme, M.; Tanaka, M.; Wakasugi, T.; Hayashida, N.; Matsubayashi, T.; Zaita, N.; Chunwongse, J.; Obokata, J.; Yamaguchi-Shinozaki, K.J.T.E.J.; et al. The complete nucleotide sequence of the tobacco chloroplast genome: Its gene organization and expression. EMBO J. 1986, 5, 2043–2049. [Google Scholar] [CrossRef]
  18. Han, S.; Bi, D.; Yi, R.; Ding, H.; Wu, L.; Kan, X. Plastome evolution of Aeonium and Monanthes (Crassulaceae): Insights into the variation of plastomic tRNAs, and the patterns of codon usage and aversion. Planta 2022, 256, 35. [Google Scholar] [CrossRef] [PubMed]
  19. Tian, X.; Guo, J.; Zhou, X.; Ma, K.; Ma, Y.; Shi, T.; Shi, Y. Comparative and evolutionary analyses on the complete plastomes of five Kalanchoe horticultural plants. Front. Plant Sci. 2021, 12, 705874. [Google Scholar] [CrossRef]
  20. Yu, X.; Wei, P.; Chen, Z.; Li, X.; Zhang, W.; Yang, Y.; Liu, C.; Zhao, S.; Li, X.; Liu, X. Comparative analysis of the organelle genomes of three Rhodiola species provide insights into their structural dynamics and sequence divergences. BMC Plant Biol. 2023, 23, 156. [Google Scholar] [CrossRef]
  21. Zhao, D.-N.; Ren, C.-Q.; Zhang, J.-Q. Can plastome data resolve recent radiations Rhodiola (Crassulaceae) as a case study. Bot. J. Linn. Soc. 2021, 197, 513–526. [Google Scholar] [CrossRef]
  22. Zhao, D.-N.; Ren, Y.; Zhang, J.-Q. Conservation and innovation: Plastome evolution during rapid radiation of Rhodiola on the Qinghai-Tibetan Plateau. Mol. Phylogenetics Evol. 2020, 144, 106713. [Google Scholar] [CrossRef]
  23. Chang, H.; Zhang, L.; Xie, H.; Liu, J.; Xi, Z.; Xu, X. The conservation of chloroplast genome structure and improved resolution of infrafamilial relationships of Crassulaceae. Front. Plant Sci. 2021, 12, 631884. [Google Scholar] [CrossRef] [PubMed]
  24. Liu, X.Y.; Zhang, D.Q.; Zhang, J.Q. Plastomic data shed new light on the phylogeny, biogeography, and character evolution of the family Crassulaceae. J. Syst. Evol. 2023, 61, 990–1003. [Google Scholar] [CrossRef]
  25. Han, S.; Ding, H.; Bi, D.; Zhang, S.; Yi, R.; Gao, J.; Yang, J.; Ye, Y.; Wu, L.; Kan, X. Structural Diversities and Phylogenetic Signals in Plastomes of the Early-Divergent Angiosperms: A Case Study in Saxifragales. Plants 2022, 11, 3544. [Google Scholar] [CrossRef] [PubMed]
  26. Hershberg, R.; Petrov, D.A. Selection on Codon Bias. Annu. Rev. Genet. 2008, 42, 287–299. [Google Scholar] [CrossRef]
  27. Yang, J.; Ding, H.; Kan, X. Codon usage patterns and evolution of HSP60 in birds. Int. J. Biol. Macromol. 2021, 183, 1002–1012. [Google Scholar] [CrossRef]
  28. Miller, J.B.; McKinnon, L.M.; Whiting, M.F.; Ridge, P.G. CAM: An alignment-free method to recover phylogenies using codon aversion motifs. PeerJ 2019, 7, e6984. [Google Scholar] [CrossRef] [PubMed]
  29. Aboul-Maaty, N.A.-F.; Oraby, H.A.-S. Extraction of high-quality genomic DNA from different plant orders applying a modified CTAB-based method. Bull. Natl. Res. Cent. 2019, 43, 25. [Google Scholar] [CrossRef]
  30. McCoy, R.C.; Taylor, R.W.; Blauwkamp, T.A.; Kelley, J.L.; Kertesz, M.; Pushkarev, D.; Petrov, D.A.; Fiston-Lavier, A.S. Illumina TruSeq synthetic long-reads empower de novo assembly and resolve complex, highly-repetitive transposable elements. PLoS ONE 2014, 9, e106689. [Google Scholar] [CrossRef]
  31. Nair, S.S.; Luu, P.-L.; Qu, W.; Maddugoda, M.; Huschtscha, L.; Reddel, R.; Chenevix-Trench, G.; Toso, M.; Kench, J.G.; Horvath, L.G. Guidelines for whole genome bisulphite sequencing of intact and FFPET DNA on the Illumina HiSeq X Ten. Epigenetics Chromatin 2018, 11, 24. [Google Scholar] [CrossRef]
  32. Jin, J.-J.; Yu, W.-B.; Yang, J.-B.; Song, Y.; DePamphilis, C.W.; Yi, T.-S.; Li, D.-Z. GetOrganelle: A fast and versatile toolkit for accurate de novo assembly of organelle genomes. Genome Biol. 2020, 21, 241. [Google Scholar] [CrossRef] [PubMed]
  33. Tillich, M.; Lehwark, P.; Pellizzer, T.; Ulbricht-Jones, E.S.; Fischer, A.; Bock, R.; Greiner, S. GeSeq–versatile and accurate annotation of organelle genomes. Nucleic Acids Res. 2017, 45, W6–W11. [Google Scholar] [CrossRef] [PubMed]
  34. Zheng, S.; Poczai, P.; Hyvönen, J.; Tang, J.; Amiryousefi, A. Chloroplot: An online program for the versatile plotting of organelle genomes. Front. Genet. 2020, 11, 576124. [Google Scholar] [CrossRef] [PubMed]
  35. Amiryousefi, A.; Hyvönen, J.; Poczai, P. IRscope: An online program to visualize the junction sites of chloroplast genomes. Bioinformatics 2018, 34, 3030–3031. [Google Scholar] [CrossRef]
  36. Kurtz, S.; Choudhuri, J.V.; Ohlebusch, E.; Schleiermacher, C.; Stoye, J.; Giegerich, R. REPuter: The manifold applications of repeat analysis on a genomic scale. Nucleic Acids Res. 2001, 29, 4633–4642. [Google Scholar] [CrossRef]
  37. Beier, S.; Thiel, T.; Münch, T.; Scholz, U.; Mascher, M. MISA-web: A web server for microsatellite prediction. Bioinformatics 2017, 33, 2583–2585. [Google Scholar] [CrossRef]
  38. Peden, J.F. Analysis of Codon Usage. Ph.D. Thesis, University of Nottingham, Nottingham, UK, 2000. [Google Scholar]
  39. Sharp, P.M.; Li, W.-H. An evolutionary perspective on synonymous codon usage in unicellular organisms. J. Mol. Evol. 1986, 24, 28–38. [Google Scholar] [CrossRef] [PubMed]
  40. Chen, C.; Chen, H.; Zhang, Y.; Thomas, H.R.; Frank, M.H.; He, Y.; Xia, R. TBtools: An integrative toolkit developed for interactive analyses of big biological data. Mol. Plant 2020, 13, 1194–1202. [Google Scholar] [CrossRef]
  41. Katoh, K.; Standley, D.M. MAFFT multiple sequence alignment software version 7: Improvements in performance and usability. Mol. Biol. Evol. 2013, 30, 772–780. [Google Scholar] [CrossRef]
  42. Zhang, D.; Gao, F.; Jakovlić, I.; Zou, H.; Zhang, J.; Li, W.X.; Wang, G.T. PhyloSuite: An integrated and scalable desktop platform for streamlined molecular sequence data management and evolutionary phylogenetics studies. Mol. Ecol. Resour. 2020, 20, 348–355. [Google Scholar] [CrossRef]
  43. Kozlov, A.M.; Darriba, D.; Flouri, T.; Morel, B.; Stamatakis, A. RAxML-NG: A fast, scalable and user-friendly tool for maximum likelihood phylogenetic inference. Bioinformatics 2019, 35, 4453–4455. [Google Scholar] [CrossRef]
  44. Vaidya, G.; Lohman, D.J.; Meier, R. SequenceMatrix: Concatenation software for the fast assembly of multi-gene datasets with character set and codon information. Cladistics 2011, 27, 171–180. [Google Scholar] [CrossRef]
  45. Darriba, D.; Posada, D.; Kozlov, A.M.; Stamatakis, A.; Morel, B.; Flouri, T. ModelTest-NG: A new and scalable tool for the selection of DNA and protein evolutionary models. Mol. Biol. Evol. 2020, 37, 291–294. [Google Scholar] [CrossRef]
  46. Ronquist, F.; Teslenko, M.; Van Der Mark, P.; Ayres, D.L.; Darling, A.; Höhna, S.; Larget, B.; Liu, L.; Suchard, M.A.; Huelsenbeck, J.P. MrBayes 3.2: Efficient Bayesian phylogenetic inference and model choice across a large model space. Syst. Biol. 2012, 61, 539–542. [Google Scholar] [CrossRef]
  47. Rambaut, A.; Drummond, A.J.; Xie, D.; Baele, G.; Suchard, M.A. Posterior summarization in Bayesian phylogenetics using Tracer 1.7. Syst. Biol. 2018, 67, 901–904. [Google Scholar] [CrossRef] [PubMed]
  48. Cauz-Santos, L.A.; da Costa, Z.P.; Callot, C.; Cauet, S.; Zucchi, M.I.; Berges, H.; van den Berg, C.; Vieira, M.L.C. A Repertory of Rearrangements and the Loss of an Inverted Repeat Region in Passiflora Chloroplast Genomes. Genome Biol. Evol. 2020, 12, 1841–1857. [Google Scholar] [CrossRef] [PubMed]
  49. George, B.; Bhatt, B.S.; Awasthi, M.; George, B.; Singh, A.K. Comparative analysis of microsatellites in chloroplast genomes of lower and higher plants. Curr. Genet. 2015, 61, 665–677. [Google Scholar] [CrossRef] [PubMed]
  50. Liang, C.; Wang, L.; Lei, J.; Duan, B.; Ma, W.; Xiao, S.; Qi, H.; Wang, Z.; Liu, Y.; Shen, X. A comparative analysis of the chloroplast genomes of four Salvia medicinal plants. Engineering 2019, 5, 907–915. [Google Scholar] [CrossRef]
  51. Zhu, M.; Feng, P.; Ping, J.; Li, J.; Su, Y.; Wang, T. Phylogenetic significance of the characteristics of simple sequence repeats at the genus level based on the complete chloroplast genome sequences of Cyatheaceae. Ecol. Evol. 2021, 11, 14327–14340. [Google Scholar] [CrossRef]
  52. Gao, R.; Wang, W.; Huang, Q.; Fan, R.; Wang, X.; Feng, P.; Zhao, G.; Bian, S.; Ren, H.; Chang, Y. Complete chloroplast genome sequence of Dryopteris fragrans (L.) Schott and the repeat structures against the thermal environment. Sci. Rep. 2018, 8, 16635. [Google Scholar] [CrossRef]
  53. Alawfi, M.S.; Albokhari, E.J. Comparative chloroplast genomics reveals a unique gene inversion in two Cordia trees (Cordiaceae). Forests 2023, 14, 1778. [Google Scholar] [CrossRef]
  54. Huang, X.; Tan, W.; Li, F.; Liao, R.; Guo, Z.; Shi, T.; Gao, Z. The chloroplast genome of Prunus zhengheensis: Genome comparative and phylogenetic relationships analysis. Gene 2021, 793, 145751. [Google Scholar] [CrossRef] [PubMed]
  55. Ren, F.; Wang, L.; Li, Y.; Zhuo, W.; Xu, Z.; Guo, H.; Liu, Y.; Gao, R.; Song, J. Highly variable chloroplast genome from two endangered Papaveraceae lithophytes Corydalis tomentella and Corydalis saxicola. Ecol. Evol. 2021, 11, 4158–4171. [Google Scholar] [CrossRef] [PubMed]
  56. Vieira, L.d.N.; Faoro, H.; Rogalski, M.; Fraga, H.P.d.F.; Cardoso, R.L.A.; de Souza, E.M.; de Oliveira Pedrosa, F.; Nodari, R.O.; Guerra, M.P. The complete chloroplast genome sequence of Podocarpus lambertii: Genome structure, evolutionary aspects, gene content and SSR detection. PLoS ONE 2014, 9, e90618. [Google Scholar] [CrossRef]
  57. Yermagambetova, M.; Abugalieva, S.; Turuspekov, Y.; Almerekova, S. Illumina sequencing data of the complete chloroplast genome of rare species Juniperus seravschanica (Cupressaceae) from Kazakhstan. Data Brief 2023, 46, 108866. [Google Scholar] [CrossRef]
  58. Ebert, D.; Peakall, R. Chloroplast simple sequence repeats (cpSSRs): Technical resources and recommendations for expanding cpSSR discovery and applications to a wide array of plant species. Mol. Ecol. Resour. 2009, 9, 673–690. [Google Scholar] [CrossRef]
  59. Chen, L.; Liu, X.; Wang, Z.; Wu, X.; Hong, K.; Xie, C. Comparative Chloroplast Genome Analyses of Six Hemlock Trees in East Asia: Insights into Their Genomic Characterization and Phylogenetic Relationship. Forests 2023, 14, 2136. [Google Scholar] [CrossRef]
  60. Shi, W.; Song, W.; Liu, J.; Shi, C.; Wang, S. Comparative chloroplast genome analysis of Citrus (Rutaceae) species: Insights into genomic characterization, phylogenetic relationships, and discrimination of subgenera. Sci. Hortic. 2023, 313, 111909. [Google Scholar] [CrossRef]
  61. Wang, Z.; Cai, Q.; Wang, Y.; Li, M.; Wang, C.; Wang, Z.; Jiao, C.; Xu, C.; Wang, H.; Zhang, Z. Comparative analysis of codon Bias in the chloroplast genomes of Theaceae species. Front. Genet. 2022, 13, 824610. [Google Scholar] [CrossRef]
  62. Dai, Y.; Cui, K.; Duan, M.; Nie, Y.; Jiang, H.; Deng, Y.; He, A.; Chen, J. Differences of Cadmium Extraction Characteristics between Sedum alfredii H. and Sedum plumbizincicola. Res. Sq. 2023. preprint. [Google Scholar]
  63. Huangrong, Z.; Lianghua, Z.; Feng, Y.; Shiqi, L.; Qiuxiang, Z. Phytoremediation effects and contrast of Sedum alfredii and Sedum plumbizincicola on Cd/Zn contaminated soil. Ecol. Environ. Sci. 2019, 28, 403–410. [Google Scholar]
  64. Song, W.; Wang, J.; Zhai, L.; Ge, L.; Hao, S.; Shi, L.; Lian, C.; Chen, C.; Shen, Z.; Chen, Y. A meta-analysis about the accumulation of heavy metals uptake by Sedum alfredii and Sedum plumbizincicola in contaminated soil. Int. J. Phytoremediation 2022, 24, 744–752. [Google Scholar] [CrossRef] [PubMed]
  65. Yang, X.e.; Long, X.; Ni, W.; Fu, C. Sedum alfredii H: A new Zn hyperaccumulating plant first found in China. Chin. Sci. Bull. 2002, 47, 1634–1637. [Google Scholar] [CrossRef]
Figure 1. Plastome annotation map for 18 individuals of S. alfredii, S. japonicum, and S. plumbizincicola. Genes within the circle are transcribed clockwise, while outside genes are counterclockwise. Dark gray and light gray regions in the inner ring showed the ratio of G+C and A+T.
Genes 15 00444 g001
Figure 2. Comparative analysis of IR junctions among 18 individuals focused on gene length. IRa and IRb are reciprocal inverted repeat sequences. LSC is the abbreviation for long single copy, and SSC means short single copy. Different colors are used to represent different regions and genes, and “fra” represents fragment.
Genes 15 00444 g002
Figure 3. Dispersed repeats in S. plumbizincicola, S. alfredii, and S. japonicum, calculated for different length regions (left) and repeat types (right) for a total of 18 individuals.
Genes 15 00444 g003
Figure 4. Statistic of simple sequence repeats in S. alfredii, S. japonicum, and S. plumbizincicola. The coordinate system is built with repeat length as the X-axis, repeat types as the Y-axis, and the number of repeats as the Z-axis. Different colors represent different species in the 3D bar chart.
Genes 15 00444 g004
Figure 5. Heat map of 53 CDSs (length > 300 bp) concatenated together for 18 plastomes. The colors change with the frequency of codon usage. A value of 1 is the boundary of bias (positive bias if the value > 1 and vice versa).
Genes 15 00444 g005
Figure 6. Species-specific codon aversion motifs of the three Sedum species. The same color of imaginary lines and codons reflects that they are in the same gene, and the dots with the same shape and color represent the same species.
Genes 15 00444 g006
Figure 7. Phylogenetic tree for 36 plastomes, including 35 plastomes in the Acre clade and 1 in the Leucosedum clade as the outgroup, using both ML and BI methods. The values on the left are [BS], while those on the right represent [pp]. The symbol “−“ denotes low support values or the lack of the values, and “*” represents 100 or 1.00 support values.
Genes 15 00444 g007
Table 1. The sample information and genomic features of the investigated species.
SpeciesSource/VoucherAccession
Number
LocalityGC
Content
(%)
Length
(bp)
S. alfrediiCJ-10PP234500 *Chunjian, Hangzhou, China37.77149,279
(149,401 ± 63 bp)DQ-04PP234501 *Dongqiao, Hangzhou, China37.75149,453
JX-12PP234502 *Jiuxi, Hangzhou, China37.76149,427
JX-25PP234503 *Jiuxi, Hangzhou, China37.76149,428
NX-04PP234504 *Ningxi, Taizhou, China37.77149,392
Shaocui et al. (2022)NC_064359Daqiao, Hangzhou, China37.76149,427
S. japonicumKL2884PP234494 *Dashan, Chizhou, China37.71149,373
(149,377 ± 10 bp)KL2886PP234495 *Dashan, Chizhou, China37.71149,373
KL2887PP234496 *Dashan, Chizhou, China37.71149,373
KL2890PP234497 *Dashan, Chizhou, China37.71149,373
KL2891PP234498 *Dashan, Chizhou, China37.71149,373
Ding et al. (2019)MN185459Dashan, Chizhou, China37.71149,397
S. plumbizincicolaJJ-05PP234493 *Jiangjia, Hangzhou, China37.77149,328
(149,316 ± 112 bp)JJ-08PP234488 *Jiangjia, Hangzhou, China37.77149,288
QZ-06PP234489 *Shangfang, Quzhou, China37.78149,392
QZ-09PP234490 *Shangfang, Quzhou, China37.77149,394
ZT-14PP234491 *Zitong, Hangzhou, China37.79149,105
ZT-19PP234492 *Zitong, Hangzhou, China37.78149,387
* These new plastomes were generated in this study.
Disclaimer/Publisher’s Note: The statements, opinions and data contained in all publications are solely those of the individual author(s) and contributor(s) and not of MDPI and/or the editor(s). MDPI and/or the editor(s) disclaim responsibility for any injury to people or property resulting from any ideas, methods, instructions or products referred to in the content.

