Abstract
Leaf rust (LR) caused by Puccinia recondita f. sp. secalis (Prs) is a highly destructive disease in rye. However, the genetic mechanisms underlying the rye immune response to this disease remain relatively uncharacterised. In this study, we analysed the expression of four genes in 12 rye inbred lines inoculated with Prs at 20 and 36 h post-treatment (hpt): DXS (1-deoxy-D-xylulose 5-phosphate synthase), Glu (β-1,3-glucanase), GT (UDP-glycosyltransferase) and PR-1 (pathogenesis-related protein 1). The RT-qPCR analysis revealed the upregulated expression of the four genes in response to Prs in all inbred lines and at both time-points. The gene expression data were supported by microscopic and macroscopic examinations, which revealed that eight lines were susceptible to LR and four lines were highly resistant to LR. A relationship between the infection profiles and the expression of the analysed genes was observed: in the resistant lines, the expression level fold changes were usually higher at 20 hpt than at 36 hpt, while the opposite trend was observed in the susceptible lines. The study results indicate that DXS, Glu, GT and PR-1 may encode proteins crucial for the rye defence response to the LR pathogen.
1. Introduction
Rye (Secale cereale L.), which is an economically important crop mainly grown in Central and Eastern Europe, is highly tolerant to abiotic and biotic stresses, but it is still affected by 36 fungal and 2 bacterial diseases (https://www.apsnet.org/edcenter/resources/commonnames/Pages/Rye.aspx; accessed on 15 December 2023). Among these fungal diseases, rusts, including leaf rust (LR), stem rust and yellow rust caused by the obligate, biotrophic basidiomycetous fungi Puccinia recondita f. sp. secalis (Prs), Puccinia graminis f. sp. secalis and Puccinia striiformis var. striiformis, respectively, can reduce rye yields by up to 70% [1]. Yield losses due to LR alone can reach 40% under natural conditions [2]. To date, 16 dominant Pr genes (Pr1-5, Pr-d–f, Pr-i–l, Pr-n, Pr-p, Pr-r and Pr-t) distributed on five of the seven rye chromosomes (1R, 2R, 4R, 6R and 7R) in blocks of linked genes responsible for the resistance to Prs clones have been identified using Mendelian methods [3,4,5]. Most of the Pr genes (Pr1-5, Pr-d–f, Pr-n and Pr-r) confer resistance to a broad range of single-pustule isolates, with Pr1, Pr2, Pr-d and Pr-r reportedly being very useful for rye breeding [3]. The recent publication of two rye genome sequences (Lo7 and Weining) [6,7] enabled Vendelbo et al. [8,9] to precisely characterise LR-related genes at the molecular level. Specifically, five LR resistance-associated quantitative trait loci (QTLs) were mapped on chromosome arms 1RS, 1RL, 2RL, 5RL and 7RS on the basis of a genome-wide association study. Two QTLs located on chromosome arms 1RS and 7RS were revealed to be crucial for LR resistance. The most important resistance-associated marker on chromosome arm 1RS is physically co-localised with molecular markers delimiting the previously characterised Pr3 gene. The second region on 7RS comprises many nucleotide-binding leucine-rich repeat (NLR) genes, one of which, provisionally named Pr6, is similar (in terms of the encoded protein) to the wheat gene (Lr1) conferring LR resistance located on chromosome arm 5DL. Unfortunately, these earlier studies did not investigate the expression of the identified genes. A previous study by Święcicka et al. [10] examined the expression of rye genes affected by LR and determined these genes control the benzoxazinoid biosynthesis pathway in three inbred lines (D33, D39 and L318; the last one was also included in this study). In this earlier study, the expression of one of the examined genes, ScBx4, which encodes a cytochrome P450 monooxygenase, was induced in infected plants at all time-points (8, 17, 24 and 48 h post-treatment). The single-nucleotide polymorphism in this gene (ScBx4_1583) is stably associated with the field resistance of adult plants to LR, which is consistent with the findings of another study [11]. Accordingly, this gene contributes to non-race-specific resistance in adult plants and seedlings.
By conducting an RNA-seq analysis, we recently identified hundreds of differentially expressed genes following a Prs infection [12]. We selected four of these genes, namely SECCE1Rv1G0055210, SECCE6Rv1G0429310, SECCE7Rv1G0520220 and SECCE7Rv1G0464120, which respectively encode 1-deoxy-D-xylulose 5-phosphate synthase (DXS), β-1,3-glucanase (Glu), UDP-glycosyltransferase (GT) and pathogenesis-related protein 1 (PR-1); these genes are characterised by high BaseMean values and fold-change (FC) values. The expression levels of all of the selected genes are upregulated by a Prs infection.
Although DXS affects the resistance to various diseases, such as late blight in potatoes [13] or downy mildew in spinach [14], whether it mediates resistance to rusts is unclear. In contrast, the involvement of the following three genes in plant immune responses to rusts, including LR, has been confirmed by many studies: Glu [15,16,17], GT [10,18,19,20] and PR1 [15,17,21,22,23]. However, whether DXS, Glu, GT and PR-1 protect rye against LR (or other fungal diseases) remains unknown. Therefore, in this study, we examined the expression of these genes by performing a quantitative real-time PCR (RT-qPCR) analysis to assess their potential role in the rye immune response to LR.
2. Materials and Methods
2.1. Plant Materials
The plant materials used in this study consisted of 12 rye inbred lines (Table 1).

Table 1.
Plant materials used in the experiments.
2.2. Experimental Design
Seeds from the 12 rye inbred lines were germinated on tissue/filter paper moistened with distilled water in Petri dishes and incubated at 22 °C for 2 days in the dark. All seedlings were transferred to 12 cm diameter plastic pots (10 seedlings per pot) filled with sterilised peat substrate and then incubated in a growth chamber at 22 °C with a 16 h light (illumination intensity of 60 µmol m−2 s−1)/8 h dark photoperiod, 50% humidity, for 10 days. Experiments were conducted with three biological replicates, each comprising one pot with 10 plants and two time-points [20 and 36 h post-treatment (hpt)] that were the same as in our previous work [24].
2.3. Inoculation of Rye Seedlings with Prs and the Mock Control
To inoculate 12-day-old rye seedlings, Prs isolate 1.1.6 derived from a single urediniospore (selected based on a preliminary experiment involving detached-leaf inoculations with 30 isolates; [10]) was re-suspended in Novec-7100 (3M, St. Paul, MN, USA) engineered fluid (at a density of 1 mg cm−3). Plants were inoculated using brown glass diffusers (Roth, Basel, Switzerland). The same method and equipment were used for the mock inoculation of the control plants with Novec-7100 engineered fluid alone. The inoculated plants were incubated for 24 h in black boxes at 18 °C with 100% humidity, after which they were incubated under the same conditions as before the inoculation as previously described by Dmochowska-Boguta et al. [25].
2.4. Microscopic Analysis
Three days after plants were inoculated with Prs, the infected leaves were harvested, transferred to a fixative solution consisting of ethanol–dichloromethane (POCH, Gliwice, Poland), (3:1) and 0.15% trichloroacetic acid (ROTH, Karlsruhe, Germany) and incubated for 24 h. The whole leaf samples were stained with calcofluor white (Fluorescent brightener 28; Sigma F-6259, Milwaukee, WI, USA) as described by Orczyk et al. [26] and then transferred to a glycerol solution containing lactophenol [phenol (POCH, Gliwice, Poland): glycerol (ROTH, Karlsruhe, Germany): lactic acid (POCH, Gliwice, Poland); 1:1:1 v/v/v]. A Diaphot fluorescence microscope (Nikon Diaphot, Aizu, Japan, epifluorescence optics with excitation 340–380 nm, barrier filter 420 nm and dichroic mirror 400 m) was used to examine the stained whole leaves for the presence of the following infection profiles: (i) appressorium + haustorium mother cell (HMC); (ii) appressorium + HMC + micronecrosis; and (iii) appressorium + micronecrosis.
2.5. Macroscopic Analysis
Ten days after the Prs inoculation, a macroscopic examination was completed to evaluate the infection types using the following 0–4 Murphy Scale [27]: 0 = immune (no visible reaction); 1 = resistant (minute uredinia surrounded by chlorosis or necrosis); 2 = moderately resistant (small pustules surrounded by chlorosis); 3 = moderately susceptible (moderately large pustules surrounded by chlorosis); and 4 = susceptible (moderately large to large pustules with little or no chlorosis).
2.6. Total RNA Extraction and cDNA Synthesis
Total RNA was isolated from 100 mg of the aerial parts of the Prs- and mock-inoculated (control) rye seedlings using the GeneMATRIX Universal RNA Purification Kit (Eurx, Gdańsk, Poland). The isolated RNA was eluted using 50 μL RNase-free water and stored at −80 °C. The quality of the extracted RNA was assessed using an ND-2000 spectrophotometer (NanoDrop; Thermo Fisher Scientific, Waltham, MA, USA) to calculate two wavelength ratios (A260/230 and A260/280 nm). The integrity of the RNA was checked by 1.5% agarose gel electrophoresis. The RNA was treated with Turbo DNase (Thermo Fisher Scientific, Waltham, MA, USA) to eliminate any DNA contaminants. The first cDNA strand was synthesised from 1 μg total RNA using the RevertAid First Strand cDNA Synthesis Kit (Thermo Fisher Scientific, Waltham, MA, USA).
2.7. Quantitative Real-Time PCR Analysis
The DXS, Glu, GT and PR-1 genes respectively encoding 1-deoxy-D-xylulose 5-phosphate synthase, β-1,3-glucanase, UDP-glycosyltransferase and pathogenesis-related protein 1 were selected on the basis of the results of RNA-seq analyses [12] employing three rye inbred lines: D33, D39 and L318. The two first lines were infected with the same Prs isolate (1.1.6) as in this work, so they are not included here. However, the third line was infected with a different isolate, and therefore, it was used in the current analysis. The sequencing data were deposited in the SRA database (http://www.ncbi.nlm.nih.gov/bioproject/888031 (accessed on 25 January 2024); BioProject accession number: PRJNA888031). These four genes were selected because of their high BaseMean and FC values as well as their consistent upregulated expression levels in most cases. The details of RNA-seq analysis are described by Krępski et al. [24].
The relative expression levels of these genes were determined by an RT-qPCR analysis, which was completed using a 96-well plate, with three biological replicates and two technical replicates. Each experimental setup contained two of the four target genes and two reference genes, namely Act and ADP respectively encoding actin and ADP-ribosylation factor 1-like protein (Table 2). The RT-qPCR analysis was performed using a LightCycler 96 Real Time System (Roche, Basel, Switzerland). Each 20 μL reaction volume consisted of 8 μL cDNA (20 ng), 1 μL each gene-specific primer (10 mM) (Table 2) and 10 μL FastStart Essential DNA Green Master (Roche). The PCR program was as follows: 95 °C for 600 s; 35 cycles of 95 °C for 10 s, 57 °C for 10 s and 72 °C for 15 s; 95 °C for 10 s, 55 °C for 60 s and melting curve analysis (95 °C for 10 s, 65 °C for 60 s and 97 °C for 1 s). Gene expression levels were normalised against the expression levels of the two reference genes Act and ADP according to the 2−ΔΔCt method [28]. The statistical analysis of differentially expressed genes was performed using the REST software [29], with p ≤ 0.05 set as the threshold for significance. Graphs were prepared using the OriginPro® 2023 software.
Table 2.
Sequences of the RT-qPCR primers.
3. Results
3.1. Microscopic and Macroscopic Analyses of LR Symptom Development
Microscopic evaluation at 3 days post-inoculation allows us to see the most differences between susceptible and resistant lines, which would not yet be visible at 20 and 36 h post-inoculation and would no longer be visible at later days post-inoculation. Three infection profiles were used to describe the rye–LR interaction. In lines Ot1-3, L310, 541, L9, L318, SE180 and SE104, the infection sites mainly contained HMCs; profile i was detected at 93.07–99.47% of the infection sites. In contrast, necrosis was observed at more infection sites in line SE31; profile ii was detected at 38.69% of the infection sites of SE31. In the remaining lines, necrosis was detected at most of the infection sites (profiles ii and iii). In line SE133, profiles ii and iii were detected at 83.84% and 10.17% of the infection sites, respectively. In lines, SE8, SE212 and SE118, profile iii (i.e., necrosis without HMCs) was the most common profile at the infection sites (53.01%, 72.12% and 77.44%, respectively). The results of the microscopic examination are presented in Figure 1.
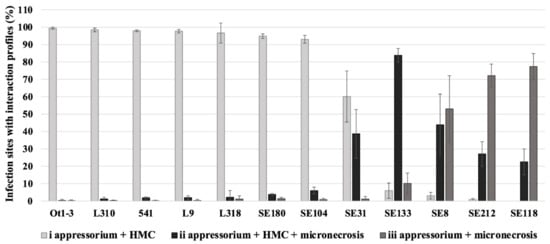
Figure 1.
Microscopic examination of rye seedlings—Prs 1.1.6 isolate interactions at 3 days post-inoculation. The results show the average percentage of infection sites with profiles i–iii, with standard deviation. Observations were made for an average of 105 infection sites per leaf sample in three–four replicates. Bar colours: light grey—profile i (appressorium + HMC); black—profile ii (appressorium + HMC + micronecrosis); dark grey—profile iii (appressorium + micronecrosis).
The results of the microscopic examination were supported by the macroscopic analysis (Figure 2; Table S2). This analysis was performed 10 days post-inoculation when macroscopic differences were already visible. Specifically, the infection profiles determined using the microscope were in accordance with the observed symptoms 10 days after plants were inoculated with Prs; the only exception was line SE31.
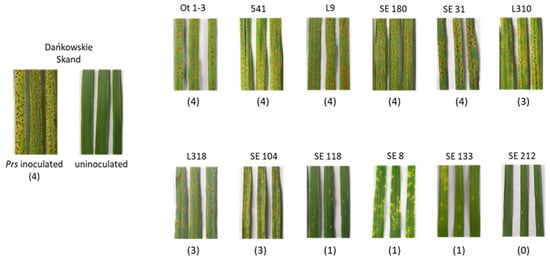
Figure 2.
Macroscopic examination of LR symptoms 10 days after the inoculation with isolate 1.1.6. Macroscopic evaluation of LR symptoms, 10 days after inoculation with 1.1.6 isolate. In brackets—infection types based on the 0–4 Murphy Scale [27]: 0 = immune (no visible reaction); 1 = resistant (minute uredinia surrounded by chlorosis or necrosis); 3 = moderately susceptible (moderately large pustules surrounded by chlorosis); and 4 = susceptible (moderately large to large pustules with little or no chlorosis). The infection type 2 = moderately resistant (small pustules surrounded by chlorosis) was not observed. Dańkowskie Skand—susceptible control inoculated with Prs and uninoculated.
3.2. Analysis of DXS, Glu, GT and PR-1 Expression
Following the Prs infection, the expression of all four analysed genes (DXS, Glu, GT and PR-1) increased compared to the mock-treated plants (Figure 3). Their expression patterns varied among the rye genotypes and time-points (20 or 36 hpt). Almost all lines responded in a genotype-specific manner. The exceptions were line SE118, in which the expression of all genes was induced at 20 hpt, and line L9, in which the expression of all genes was induced only at 36 hpt. Specific details regarding the expression of each gene are provided below and in Table S1.
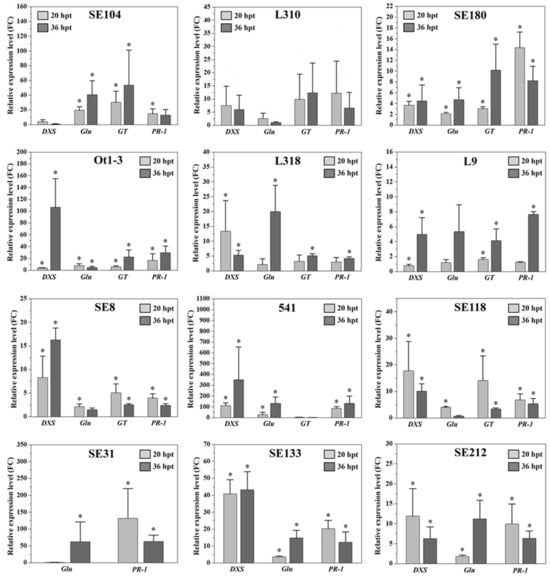
Figure 3.
Relative DXS, Glu, GT and PR-1 expression levels (fold change; FC) in 12 rye inbred lines inoculated with Prs or the mock control at 20 and 36 hpt. The target gene expression levels were normalised against the Act (actin) and ADP (ADP-ribosylation factor 1-like protein) expression levels at both time-points. The gene expression analysis was performed using three biological replicates, with the 2−∆∆Ct method used to calculate the FC value (compared with the control). Data are presented as the mean ± standard error of the mean (SEM) from three independent experiments. The asterisk indicates a significant difference compared with the control as revealed by REST [29], (p < 0.05).
3.3. DXS Gene
The expression of DXS was detected in all inbred lines, except for SE31. In lines SE104, L310, L318, SE118 and SE212, DXS was more highly expressed at 20 hpt than at 36 hpt. However, significant increases in expression (relative to the expression in the mock-inoculated control) were detected only in lines L318, SE118 and SE212. The expression of this gene increased significantly between 20 and 36 hpt in lines SE180, Ot1-3, L9, SE8, 541 and SE133. At both time-points, DXS expression peaked in inbred line 541, with 112.72 FC at 20 hpt and 350.00 FC at 36 hpt. The lowest DXS expression levels were observed in L9 (0.79 FC) at 20 hpt and in SE104 (0.77 FC) at 36 hpt. Relatively large increases in DXS expression between 20 and 36 hpt were detected in Ot1-3 (3.53 to 106 FC), L9 (0.79 to 4.98 FC), 541 (112.72 to 350.00 FC) and SE8 (8.30 to 16.29 FC). A sharp decrease in DXS expression between 20 and 36 hpt was observed in lines L318 (13.34 to 5.33 FC) and SE118 (17.72 to 10.05 FC). Relatively minor changes in DXS expression between the two time-points were detected in lines SE180 and SE133 (slight increase) as well as in line L310 (slight decrease).
3.4. Glu Gene
The increase in the Glu expression level was greater at 20 hpt than at 36 hpt in lines L310, Ot1-3, SE8 and SE118, whereas it was greater at 36 hpt than at 20 hpt in lines SE104, SE180, L318, L9, 541, SE31, SE133 and SE212. At both time-points, Glu expression was highest in inbred line 541, with 27.42 FC at 20 hpt and 130.89 FC at 36 hpt. In contrast, the lowest Glu expression levels were detected in SE31 and SE118, with 0.65 FC at 20 hpt and 0.71 FC at 36 hpt, respectively. A considerable increase in Glu expression between 20 and 36 hpt was detected in L318 (2.15 to 19.93 FC), L9 (1.2 to 5.37 FC), 541 (27.42 to 130.89 FC), SE104 (19.47 to 40.59 FC), SE133 (3.68 to 14.76 FC), SE31 (0.65 to 62.33 FC) and SE212 (1.79 to 11.22 FC), but a sharp decrease in Glu expression between the two time-points was observed in SE118 (3.99 to 0.7 FC). Relatively small changes in Glu expression levels between 20 and 36 hpt were observed in line SE180 (slight increase) as well as in lines Ot1-3, L310 and SE8 (slight decrease).
3.5. GT Gene
The GT gene was expressed in all inbred lines, except for SE31, SE133 and SE212. Additionally, GT was more highly expressed at 20 hpt than at 36 hpt in SE8, 541 and SE118, whereas it was more highly expressed at 36 hpt than at 20 hpt in SE104, L310, SE180, Ot1-3, L318 and L9. Inbred line SE104 had the highest GT expression level at both time-points, with 30.25 FC at 20 hpt and 53.44 FC at 36 hpt. Conversely, the lowest GT expression level was observed in 541 at 36 hpt (1.13 FC). The GT expression level increased between 20 and 36 hpt in several inbred lines, including Ot1-3 (5.81 to 22.14 FC), SE180 (3.03 to 10.17 FC) and SE104 (30.25 to 53.44 FC). In contrast, there was a marked decrease in GT expression between the two time-points in SE118 (14.06 to 3.33 FC). Relatively minor changes in GT expression between 20 and 36 hpt were detected in lines L318, L9 and L310 (slight increase) as well as in lines 541 and SE8 (slight decrease).
3.6. PR-1 Gene
The PR-1 expression level was higher at 20 hpt than at 36 hpt in inbred lines SE104, L310, SE180, SE8, SE118, SE31, SE133 and SE212, while it was higher at 36 hpt than at 20 hpt in Ot1-3, L318, L9 and 541. The highest PR-1 expression levels were observed in SE31 at 20 hpt (132.09 FC) and 541 at 36 hpt (130.42 FC). The lowest PR-1 expression levels were detected in L9 and SE8 at 20 hpt (1.25 FC) and 36 hpt (2.39 FC), respectively. Sharp increases in PR-1 expression were detected between 20 and 36 hpt in Ot1-3 (16.58 to 29.63 FC), L9 (1.25 to 7.64 FC) and 541 (85.43 to 130.42 FC), whereas considerable decreases in expression between the first and second time-points were observed in SE180 (14.35 to 8.23 FC), L310 (12.25 to 6.53 FC), SE133 (20.20 to 12.14 FC) and SE31 (132.09 to 63.25 FC). Small changes in the PR-1 expression level occurred between 20 and 36 hpt in line L318 (slight increase) as well as in lines SE8, SE104, SE118 and SE212 (slight decrease).
All studied genes were upregulated during infection with Prs, but only in the case of the PR-1 gene, the expression level at 36 hpt compared with the mock-treated plants was significantly correlated with infection type (Table S3).
4. Discussion
Plant disease resistance is associated with the activation of various defence mechanisms that delay or prevent infections at specific stages of the host–pathogen interaction. In plants, extracellular receptors act as gatekeepers, detecting incoming pathogen-associated molecular patterns (PAMPs) [30]. The recognition of PAMPs triggers a basal defence mechanism known as pattern-triggered immunity (PTI) [30,31,32], which can confer broad-spectrum resistance through a basal defence network. However, the co-evolution of pathogens and their host plants has enabled pathogens to overcome the basal defence barrier by secreting effectors that are transported into the host cells [30,33]. Plant resistance (R) genes provide resistance against specific strains or races of pathogens by encoding proteins that recognise specific effector molecules.
In this study, four candidate genes conferring resistance to Prs (DXS, Glu, GT and PR-1) were selected for an RT-qPCR analysis. According to a global transcriptome analysis [12], these genes are differentially expressed after a Prs infection. We analysed whether these genes provide protection against LR using a relatively large set of inbred lines (which included the three above-mentioned lines). Additionally, a microscopic examination was performed to comprehensively investigate plant–pathogen interactions.
First, we demonstrated that the expression of all four genes was upregulated in response to the Prs infection in almost all of the inbred lines. We were unable to detect the expression of one or two genes in only three lines. More specifically, DXS and GT were not expressed in line SE31, whereas GT expression was undetectable in lines SE133 and SE212. The observed lack of expression suggests these genes are relatively unaffected by the Prs infection or their transcription is inhibited by various unknown regulatory mechanisms. These possibilities will need to be experimentally verified. With the exception of DXS, the roles of the other genes in the immune response to LR have been confirmed.
The first of the analysed genes, Glu, encodes a β-1,3-glucanase, which is an “antifungal hydrolase” that belongs to the PR-2 family of pathogenesis-related proteins. One of its major roles in plants involves defence responses to pathogens. It degrades the cell walls of fungal pathogens by hydrolysing the β-1,3-D-glycosidic bonds, thereby weakening the pathogen structure and impeding its growth and ability to invade the plant host [34]. The role of this enzyme in wheat plant defences against LR was revealed by Gao et al. [15] and Neugebauer et al. [17]. The RT-qPCR analysis by Gao et al. [15] indicated that the expression of a Glu-encoding gene (TcLr19Glu) is induced by Puccinia triticina during compatible interactions, but more so during incompatible interactions, with peak expression levels between 24 and 48 hpt. This is consistent with the results of the current study, in which the upregulated expression of Glu in the plants infected with Prs (compared with the mock-inoculated plants) was greater at 36 hpt than at 20 hpt in most lines. However, because the opposite expression dynamics were detected in 5 of the 12 inbred lines, the relationship between the changes in Glu expression over time and the defence response of Prs-infected plants cannot be conclusively determined. Neugebauer et al. [17] infected wheat cultivar Thatcher with six P. triticina races and detected a gradual increase in the expression of Glu and genes encoding PR-1 and PR-5 thaumatin-like protein between 1 and 3 dpi, which was followed by a decrease in expression at 5 dpi and then another increase in expression at 6 dpi. The authors suggested that such changes in Glu expression may help protect plants from LR. To determine whether this possibility also applies to rye infected with LR, research over a longer post-infection period will need to be conducted.
The next gene, GT, encodes a UDP-glycosyltransferase belonging to the multigenic superfamily of enzymes found in all living organisms. GTs are associated with plant resistance to various diseases, including LR. Bolton et al. [19] identified two GT-encoding genes in wheat that are associated with Lr34-mediated resistance; the expression levels of both genes were revealed to be highly upregulated after a 3-day infection with P. triticina. A GT-encoding gene (Ta.90050) may be involved in the late resistance response of wheat to stem rust [20]. Amo and Soriano [18] recently identified five upregulated genes encoding GTs by conducting a meta-QTL analysis. Among these genes, TraesCS7D02G217700 has been proposed as a candidate gene conferring resistance to LR. Furthermore, Kumar et al. [35] used high-confidence meta-QTLs to identify three GT-encoding genes (TraesCS2B02G012000, TraesCS5A02G305000 and TraesCS5A02G305100) in wheat that may be linked to stripe rust resistance. In a previous study [10], we showed that in rye inoculated with a semi-compatible Prs isolate, the protective role of GT may be related to the conversion of DIBOA to DIBOA glucoside, the content of which increased at 24 hpt and then decreased at 48 hpt. It is worth noting that in our studies described here, the expression of this gene increased over time—it was higher at 36 hpt than at 20 hpt in susceptible lines (SE104, L310, SE180, Ot1-3, L318, L9) and decreased over time in two resistant lines (SE8 and SE118).
The third of the examined genes, PR-1, encodes the PR-1 protein, which inhibits the development of diseases (e.g., rusts) caused by many fungal pathogens [23]. In wheat, LR induces the expression of PR-1-encoding genes, namely TcLr19PR1 [15], TaLr35PR1 [21], PR-1 [17] and TaPR1 [36], which may be useful for characterising the infection type. The PR-1 expression profiles described herein reflect the involvement of this gene in the rye immune response to LR; moreover, similarly to the GT gene, its expression increased over time in most susceptible lines and decreased over time in resistant lines.
The last one, the DXS gene, encodes the first and rate-limiting enzyme in the plastidial methylerythritol phosphate pathway, which produces isopentenyl diphosphate and its isoform dimethylallyl diphosphate as terpenoid biosynthesis precursors and plays essential roles in many physiological processes, including defence responses to pathogens [37,38]. However, there are no reports describing a relationship between DXS genes and plant responses to LR infections. The increased expression of this gene in 12 rye lines with different origins implies DXS may be important for the rye immune response to LR.
Based on macroscopic and microscopic observations, the analysed lines were divided into two groups: susceptible and resistant. Eight lines were designated as susceptible (Ot1-3, L310, 541, L9, L318, SE180, SE104 and SE31), with profile i (HMCs without micronecrosis) revealed as the most common profile, and infection types assessed as 4 and 3. Among these lines, L318 was previously identified as the most susceptible line under field conditions [11] and after an infection by Prs isolate 1.1.6 [10], which was also used in the current study.
Four lines (SE133, SE8, SE212 and SE118) were assessed as resistant because their infection types were 1 and 0, and the extent of micronecrosis at the infection sites was very high (profile ii and iii). Profile iii is indicative of the effective inhibition of pathogen growth. These observations are consistent with the results of a previous study by Orczyk et al. [26], in which micronecrosis was undetectable in susceptible wheat lines infected with P. triticina (Thatcher and TcLr34). In the same study, the infection sites in the most resistant lines at 3 and 4 dpi had necrotic lesions but lacked HMCs (TcLr9, TcLr19 and TcLr26).
We observed a relatively pronounced relationship between the infection profiles and the expression of the analysed genes. In the resistant lines, the FC values were usually higher at 20 hpt than at 36 hpt, while the opposite trend was observed in the susceptible lines. This suggests the resistant lines may respond to the fungal pathogen earlier than the susceptible lines via the induced expression of a set of defence-related genes. Another interesting observation was that even though all studied genes were upregulated during infection with Prs, the expression level at 36 hpt was significantly correlated with infection type only in the case of the PR-1 gene. Therefore, the PR-1 gene may be useful as a resistance marker for determining the type of infection.
The analysis of the expression of four R gene candidates (DXS, Glu, GT and PR-1) demonstrated their importance for the rye immune response to Prs, which is the fungus responsible for one of the most damaging rye diseases (i.e., LR). The highly upregulated expression of these genes during the early disease development stage may reflect their critical role in PTI.
The research findings presented herein have expanded our current understanding of the genetic basis of rye resistance to LR as well as plant–pathogen interactions at the molecular level. The study data may be useful for improving agronomic practices to control fungal diseases and for developing molecular diagnostic tools facilitating germplasm selection according to the expression of LR resistance-related genes. Specifically, the GT and PR-1 expression levels during the early stage of disease development (20–36 hpt) may be a good predictor of the defence potential of a given rye genotype in pre-breeding studies. Of course, it would be necessary to verify the function of these genes in field conditions, especially being aware of climate changes and the specificity of local cultivation regimes as recently highlighted by Paraschivu et al. [39].
Supplementary Materials
The following supporting information can be downloaded at https://www.mdpi.com/article/10.3390/genes15030275/s1: Table S1: Mean values of fold changes (Prs vs. mock-treated) in expression of target genes in 12 rye inbred lines; Table S2: Spearman correlations between infection type and infection profile; Table S3: Spearman correlations between infection type and Prs-induced increase in gene expression level.
Author Contributions
Conceptualization, M.R.-T.; methodology, M.M., M.D.-B. and R.A.; validation, M.R.-T. and M.M.; formal analysis, M.R.-T. and M.M.; investigation, R.A., T.K., M.O., B.B., M.Ś. and M.D.-B.; resources, M.R.-T. and M.Ś.; data curation, M.R.-T., M.M. and R.A.; writing—original draft preparation, M.R.-T. and R.A.; writing—review and editing, M.R.-T., M.M., T.K., M.D.-B. and R.A.; supervision, M.R.-T.; project administration, M.R.-T.; funding acquisition, M.R.-T. All authors have read and agreed to the published version of the manuscript.
Funding
This study was financially supported by the National Science Centre (Narodowe Centrum Nauki), grant No. 2018/31/B/NZ9/00439.
Institutional Review Board Statement
Not applicable.
Informed Consent Statement
Not applicable.
Data Availability Statement
All relevant data are within the paper and in the Supporting Information file. The data of RNA-seq (in fastq format) have been deposited in NCBI (http://www.ncbi.nlm.nih.gov/bioproject/888031 (accessed on 25 January 2024); BioProject accession number: PRJNA888031).
Conflicts of Interest
The authors declare that they have no competing interests. The authors bear all the ethical responsibilities of this manuscript. They declare that the research was conducted in the absence of any commercial or financial relationship that could be construed as a potential conflict of interest and that it does not include any animal and/or human trials.
References
- Chaves, M.S.; Martinelli, J.A.; Wesp, C.D.L.; Graichen, F.A.S. The cereal rusts: An overview. Pest Technol. 2008, 2, 38–55. [Google Scholar]
- Wehling, P.; Linz, A.; Hackauf, B.; Roux, S.R.; Ruge, B.; Klocke, B. Leaf-rust resistance in rye (Secale cereale L.). 1. Genetic analysis and mapping of resistance genes Pr1 and Pr2. Theor. Appl. Genet. 2003, 107, 432–438. [Google Scholar] [CrossRef]
- Roux, S.R.; Hackauf, B.; Linz, A.; Ruge, B.; Klocke, B.; Wehling, P. Leaf-rust resistance in rye (Secale cereale L.). 2. Genetic analysis and mapping of resistance genes Pr3, Pr4 and Pr5. Theor. Appl. Genet. 2004, 110, 192–201. [Google Scholar] [CrossRef] [PubMed]
- Roux, S.R.; Wehling, P. Nature of mixed infection type 2 (5) observed in rye (Secale cereale L.) plants carrying the Pr1 leaf-rust resistance gene. J. Kult. 2010, 62, 29–34. [Google Scholar]
- Solodukhina, O.V. Genetic characterization of rye accessions with regard to leaf rust resistance. Russ. J. Genet. 2002, 38, 399–407. [Google Scholar] [CrossRef]
- Rabanus-Wallace, M.T.; Hackauf, B.; Mascher, M.; Lux, T.; Wicker, T.; Gundlach, H.; Baez, M.; Houben, A.; Mayer, K.F.; Guo, L.; et al. Chromosome-scale genome assembly provides insights into rye biology, evolution and agronomic potential. Nat. Genet. 2021, 53, 564–573. [Google Scholar] [CrossRef] [PubMed]
- Li, G.; Wang, L.; Yang, J.; He, H.; Jin, H.; Li, X.; Ren, T.; Ren, Z.; Li, F.; Han, X.; et al. A high-quality genome assembly highlights rye genomic characteristics and agronomically important genes. Nat. Genet. 2021, 53, 574–584. [Google Scholar] [CrossRef] [PubMed]
- Vendelbo, N.M.; Mahmood, K.; Sarup, P.; Hovmøller, M.S.; Justesen, A.F.; Kristensen, P.S.; Orabi, J.; Jahoor, A. Discovery of a Novel Leaf Rust (Puccinia recondita) Resistance Gene in Rye (Secale cereale L.) Using Association Genomics. Cells 2021, 11, 64. [Google Scholar] [CrossRef]
- Vendelbo, N.M.; Mahmood, K.; Steuernagel, B.; Wulff, B.B.H.; Sarup, P.; Hovmøller, M.S.; Justesen, A.F.; Kristensen, P.S.; Orabi, J.; Jahoor, A. Discovery of Resistance Genes in Rye by Targeted Long-Read Sequencing and Association Genetics. Cells 2022, 11, 1273. [Google Scholar] [CrossRef]
- Święcicka, M.; Dmochowska-Boguta, M.; Orczyk, W.; Grądzielewska, A.; Stochmal, A.; Kowalczyk, M. Changes in benzoxazinoid contents and the expression of the associated genes in rye (Secale cereale L.) due to brown rust and the inoculation procedure. PLoS ONE 2020, 15, e0233807. [Google Scholar] [CrossRef] [PubMed]
- Rakoczy-Trojanowska, M.; Krajewski, P.; Bocianowski, J.; Schollenberger, M.; Wakuliński, W.; Milczarski, P.; Masojć, P.; Targońska-Karasek, M.; Banaszak, Z.; Banaszak, K.; et al. Identification of single nucleotide polymorphisms associated with brown rust resistance, α-amylase activity and pre-harvest sprouting in rye (Secale cereale L.). Plant Mol. Biol. Report. 2017, 35, 366–378. [Google Scholar] [CrossRef] [PubMed]
- Krępski, T.; Piasecka, A.; Święcicka, M.; Kańczurzewska, M.; Sawikowska, A.; Dmochowska-Boguta, M.; Rakoczy-Trojanowska, M.; Matuszkiewicz, M. Leaf rust (Puccinia recondita f. sp. secalis) triggers substantial changes in rye (Secale cereale L.) at the transcriptome and metabolome levels. BMC Plant Biol. 2024, 24, 107. [Google Scholar]
- Henriquez, M.A.; Soliman, A.; Li, G.; Hannoufa, A.; Ayele, B.T.; Daayf, F. Molecular cloning, functional characterization and expression of potato (Solanum tuberosum) 1-deoxy-d-xylulose 5-phosphate synthase 1 (StDXS1) in response to Phytophthora infestans. Plant Sci. 2016, 243, 71–83. [Google Scholar] [CrossRef] [PubMed]
- Kandel, S.L.; Hulse-Kemp, A.M.; Stoffel, K.; Koike, S.T.; Shi, A.; Mou, B.; Van Deynze, A.; Klosterman, S.J. Transcriptional analyses of differential cultivars during resistant and susceptible interactions with Peronospora effusa, the causal agent of spinach downy mildew. Sci. Rep. 2020, 10, 6719. [Google Scholar] [CrossRef] [PubMed]
- Gao, L.; Wang, S.; Li, X.Y.; Wei, X.J.; Zhang, Y.J.; Wang, H.Y.; Liu, D.Q. Expression and functional analysis of a pathogenesis-related protein 1 gene, TcLr19PR1, involved in wheat resistance against leaf rust fungus. Plant Mol. Biol. Report. 2015, 33, 797–805. [Google Scholar] [CrossRef]
- Liu, B.; Lu, Y.; Xin, Z.; Zhang, Z. Identification and antifungal assay of a wheat β-1, 3-glucanase. Biotechnol. Lett. 2009, 31, 1005–1010. [Google Scholar] [CrossRef] [PubMed]
- Neugebauer, K.A.; Bruce, M.; Todd, T.; Trick, H.N.; Fellers, J.P. Wheat differential gene expression induced by different races of Puccinia triticina. PLoS ONE 2018, 13, e0198350. [Google Scholar] [CrossRef] [PubMed]
- Amo, A.; Soriano, J.M. Unravelling consensus genomic regions conferring leaf rust resistance in wheat via meta-QTL analysis. Plant Genome 2022, 15, e20185. [Google Scholar] [CrossRef]
- Bolton, M.D.; Kolmer, J.A.; Garvin, D.F. Wheat leaf rust caused by Puccinia triticina. Mol. Plant Pathol. 2008, 9, 563–575. [Google Scholar] [CrossRef]
- Pujol, V.; Robles, J.; Wang, P.; Taylor, J.; Zhang, P.; Huang, L.; Tabe, L.; Lagudah, E. Cellular and molecular characterization of a stem rust resistance locus on wheat chromosome 7AL. BMC Res. Notes 2016, 9, 502. [Google Scholar] [CrossRef]
- Li, X.; Zhang, Y.; Zhang, W.; Zhang, J.; Wang, H.; Liu, D. Expression profiles of pathogenesis-related gene, TaLr35PR1, as it relate to Lr35-mediated adult plant leaf rust resistance. Plant Mol. Biol. Report. 2016, 34, 1127–1135. [Google Scholar] [CrossRef]
- Van Loon, L.C.; Rep, M.; Pieterse, C.M. Significance of inducible defense-related proteins in infected plants. Annu. Rev. Phytopathol. 2006, 44, 135–162. [Google Scholar] [CrossRef]
- Muthukrishnan, S.; Liang, G.H.; Trick, H.N.; Gill, B.S. Pathogenesis-related proteins and their genes in cereals. Plant Cell Tissue Organ Cult. 2001, 64, 93–114. [Google Scholar] [CrossRef]
- Krępski, T.; Olechowski, M.; Samborska-Skutnik, I.; Święcicka, M.; Grądzielewska, A.; Rakoczy-Trojanowska, M. Identification and characteristics of wheat Lr orthologs in three rye inbred lines. PLoS ONE 2023, 18, e0288520. [Google Scholar] [CrossRef]
- Dmochowska-Boguta, M.; Alaba, S.; Yanushevska, Y.; Piechota, U.; Lasota, E.; Nadolska-Orczyk, A.; Karlowski, W.M.; Orczyk, W. Pathogen-regulated genes in wheat isogenic lines differing in resistance to brown rust Puccinia triticina. BMC Genom. 2015, 16, 742. [Google Scholar] [CrossRef]
- Orczyk, W.; Dmochowska-Boguta, M.; Czembor, H.J.; Nadolska-Orczyk, A. Spatiotemporal patterns of oxidative burst and micronecrosis in resistance of wheat to brown rust infection. Plant Pathol. 2010, 59, 567–575. [Google Scholar] [CrossRef]
- Murphy, H.C. Physiologic specialization in Puccinia coronata f. sp. avenae. US Dep. Agric. Tech. Bull. 1935, 433, 48. [Google Scholar]
- Livak, K.J.; Schmittgen, T.D. Analysis of relative gene expression data using real-time quantitative PCR and the 2(-Delta Delta C(T)) method. Methods 2001, 25, 402–408. [Google Scholar] [CrossRef] [PubMed]
- Pfaffl, M.W. A new mathematical model for relative quantification in real-time RT–PCR. Nucleic Acids Res. 2001, 29, e45. [Google Scholar] [CrossRef]
- Jones, J.D.; Dangl, J.L. The plant immune system. Nature 2006, 444, 323–329. [Google Scholar] [CrossRef] [PubMed]
- Dodds, P.N.; Rathjen, J.P. Plant immunity: Towards an integrated view of plant–pathogen interactions. Nat. Rev. Genet. 2010, 11, 539–548. [Google Scholar] [CrossRef]
- Zhang, Y.; Lubberstedt, T.; Xu, M. The genetic and molecular basis of plant resistance to pathogens. J. Genet. Genom. 2013, 40, 23–35. [Google Scholar] [CrossRef] [PubMed]
- Bent, A.F.; Mackey, D. Elicitors, effectors and R genes: The new paradigm and a lifetime supply of questions. Annu. Rev. Phytopathol. 2007, 45, 399–436. [Google Scholar] [CrossRef]
- Balasubramanian, V.; Vashisht, D.; Cletus, J.; Sakthivel, N. Plant β-1, 3-glucanases: Their biological functions and transgenic expression against phytopathogenic fungi. Biotechnol. Lett. 2012, 34, 1983–1990. [Google Scholar] [CrossRef]
- Kumar, S.; Saini, D.K.; Jan, F.; Jan, S.; Tahir, M.; Djalovic, I.; Latkovic, D.; Khan, M.A.; Kumar, S.; Vikas, V.K.; et al. Comprehensive meta-QTL analysis for dissecting the genetic architecture of stripe rust resistance in bread wheat. BMC Genom. 2023, 24, 259. [Google Scholar] [CrossRef] [PubMed]
- Liu, R.; Lu, J.; Xing, J.; Xue, L.; Wu, Y.; Zhang, L. Characterization and functional analyses of wheat TaPR1 genes in response to stripe rust fungal infection. Sci. Rep. 2023, 13, 3362. [Google Scholar] [CrossRef]
- Okada, A.; Shimizu, T.; Okada, K.; Kuzuyama, T.; Koga, J.; Shibuya, N.; Nojiri, H.; Yamane, H. Elicitor induced activation of the methylerythritol phosphate pathway toward phytoalexins biosynthesis in rice. Plant Mol. Biol. 2007, 65, 177–187. [Google Scholar] [CrossRef] [PubMed]
- Tian, L.; Shi, J.; Yang, L.; Wei, A. Molecular Cloning and Functional Analysis of DXS and FPS Genes from Zanthoxylum bungeanum Maxim. Foods 2022, 11, 1746. [Google Scholar] [CrossRef]
- Paraschivu, M.; Matei, G.; Cotuna, O.; Paraschivu, M.; Drăghici, R. Reaction of rye cultivars to leaf rust (P. recondita f. sp. secalis) in the context of climate change in dry area in southern Romania. Sci. Pap. Ser. A Agron. 2021, 64, 500–507. [Google Scholar]
Disclaimer/Publisher’s Note: The statements, opinions and data contained in all publications are solely those of the individual author(s) and contributor(s) and not of MDPI and/or the editor(s). MDPI and/or the editor(s) disclaim responsibility for any injury to people or property resulting from any ideas, methods, instructions or products referred to in the content. |
© 2024 by the authors. Licensee MDPI, Basel, Switzerland. This article is an open access article distributed under the terms and conditions of the Creative Commons Attribution (CC BY) license (https://creativecommons.org/licenses/by/4.0/).