Article

Exploration of Key Regulatory Factors in Mesenchymal Stem Cell Continuous Osteogenic Differentiation via Transcriptomic Analysis

1
Department of Orthopedic Surgery, The Affiliated People’s Hospital of Jiangsu University, Zhenjiang 212002, China
2
School of Medicine, Jiangsu University, Zhenjiang 2012013, China
3
Department of Orthopedic Surgery, Southwest Hospital Jiangbei Area (The 958th Hospital of Chinese People’s Liberation Army), Chongqing 400020, China
4
School of Medicine, Tongji University, Shanghai 201619, China
5
Computer Science School, Jiangsu University of Science and Technology, Zhenjiang 212003, China
*
Authors to whom correspondence should be addressed.
These authors contributed equally to this work.
Genes 2024, 15(12), 1568; https://doi.org/10.3390/genes15121568
Submission received: 17 October 2024 / Revised: 24 November 2024 / Accepted: 29 November 2024 / Published: 4 December 2024
(This article belongs to the Section Molecular Genetics and Genomics)

Abstract

:
Background/Objectives: Mesenchymal stem cells (MSCs) possess the remarkable ability to differentiate into various cell types, including osteoblasts. Understanding the molecular mechanisms governing MSC osteogenic differentiation is crucial for advancing clinical applications and our comprehension of complex disease processes. However, the key biological molecules regulating this process remain incompletely understood. Methods: In this study, we conducted systematic re-analyses of published high-throughput transcriptomic datasets to identify and validate key biological molecules that dynamically regulate MSC osteogenic differentiation. Our approach involved a comprehensive analysis of gene expression patterns across human tissues, followed by the rigorous experimental validation of the identified candidates. Results: Through integrated analytical and experimental approaches, we utilized high-throughput transcriptomics to identify four critical regulators of MSC osteogenic differentiation: PTBP1, H2AFZ, BCL6, and TTPAL (C20ORF121). Among these, PTBP1 and H2AFZ functioned as positive regulators, while BCL6 and TTPAL acted as negative regulators in osteogenesis. The regulatory roles of these genes in osteogenesis were further validated via overexpression experiments. Conclusions: Our findings advance our understanding of MSC differentiation fate determination and open new therapeutic possibilities for bone-related disorders. The identification of these regulators provides a foundation for developing targeted interventions in regenerative medicine.

1. Introduction

Mesenchymal stem cells (MSCs) possess the ability to differentiate into diverse cell lineages [1,2], rendering them indispensable for maintaining physiological homeostasis, as well as promoting tissue regeneration and repair [3,4]. MSCs are ubiquitously distributed across multiple tissues and constitute a multipotent progenitor cell population with clonogenic potential [5,6]. Consequently, MSCs have garnered significant attention owing to their immense therapeutic potential in regenerative medicine [7,8]. The fate determination of MSCs is tightly regulated by intricate interactions among numerous cell factors derived from the tissue microenvironment [9], which act as molecular switches for lineage differentiation through specific activation or dysfunction mechanisms [10,11]. Understanding the molecular mechanisms that determine the MSC fate is essential for implementing targeted strategies to correct abnormal lineage distribution, particularly in conditions such as osteoporosis and bone aging [12,13].
Previous studies have identified several cellular factors, such as Runx2 [14,15] and Osterix [16,17], as the key regulators of MSC differentiation, particularly in promoting osteogenic lineage differentiation [18,19,20]. Genomics has furthered research conducted in the field of genome-wide dynamics of transcription factor binding and epigenome programming during preosteoblast differentiation [21,22]. However, further research is required to elucidate the dynamics of chromosome structure and enhancer activity during osteogenesis in MSC lineage studies [23,24]. To date, no studies have systematically explored the cellular factors that continuously regulate MSC differentiation into the osteogenic lineage across different time points, hindering a comprehensive evaluation of osteoporosis [25,26]. Therefore, it is crucial to conduct systematic investigations into the cellular factors governing MSC lineage fate to identify key elements that influence MSC differentiation [27,28].
In this study, we performed a systematic analysis of differentially expressed genes (DEGs) by integrating high-throughput sequencing data related to human MSC differentiation into the osteogenic lineage [29]. Subsequently, we identified DEGs with significant differential expression across multiple time points and validated the candidate genes exhibiting high expression in bone marrow tissue under screening conditions by comparing them to 45 human tissues from the HUMAN PROTEIN ATLAS database. Finally, we performed biological experiments to verify the ability of the selected candidates to continuously regulate the osteogenic induction of MSCs. Our study established a foundational framework for identifying candidates with enhanced clinical relevance for the treatment of osteoporosis and bone fracture healing.

2. Materials and Methods

2.1. Cell Culture

Primary Mouse bone marrow mesenchymal stem cells (mBMSCs) were isolated from the femur bone marrow of 2-month-old wild-type C57BL/6J mice. The isolated cells were stored in a BMSC medium (DMEM medium containing 20% heat-inactivated FBS) for 1 day. On the second day, the supernatant (including osteoclasts) was removed, and the adherent hematopoietic cells were removed by intensive washing with phosphate-buffered saline (PBS) three times. The culture was continued with a fresh BMSC medium. After 2 weeks, the growth colonies were collected by trypsinization for further passage and differentiation. All the experimental and control group mice were derived from the same cage. Each replicate was derived from a different mouse. The experiments were conducted in triplicate.
Mycoplasma screening was performed on the BMSC cell line using the highly sensitive Mycoplasma PCR Detection Kit (Catalog# K0103, HUABIO, Hangzhou, China). The results confirmed the absence of mycoplasma contamination, thereby ensuring the integrity and reliability of our experimental system.

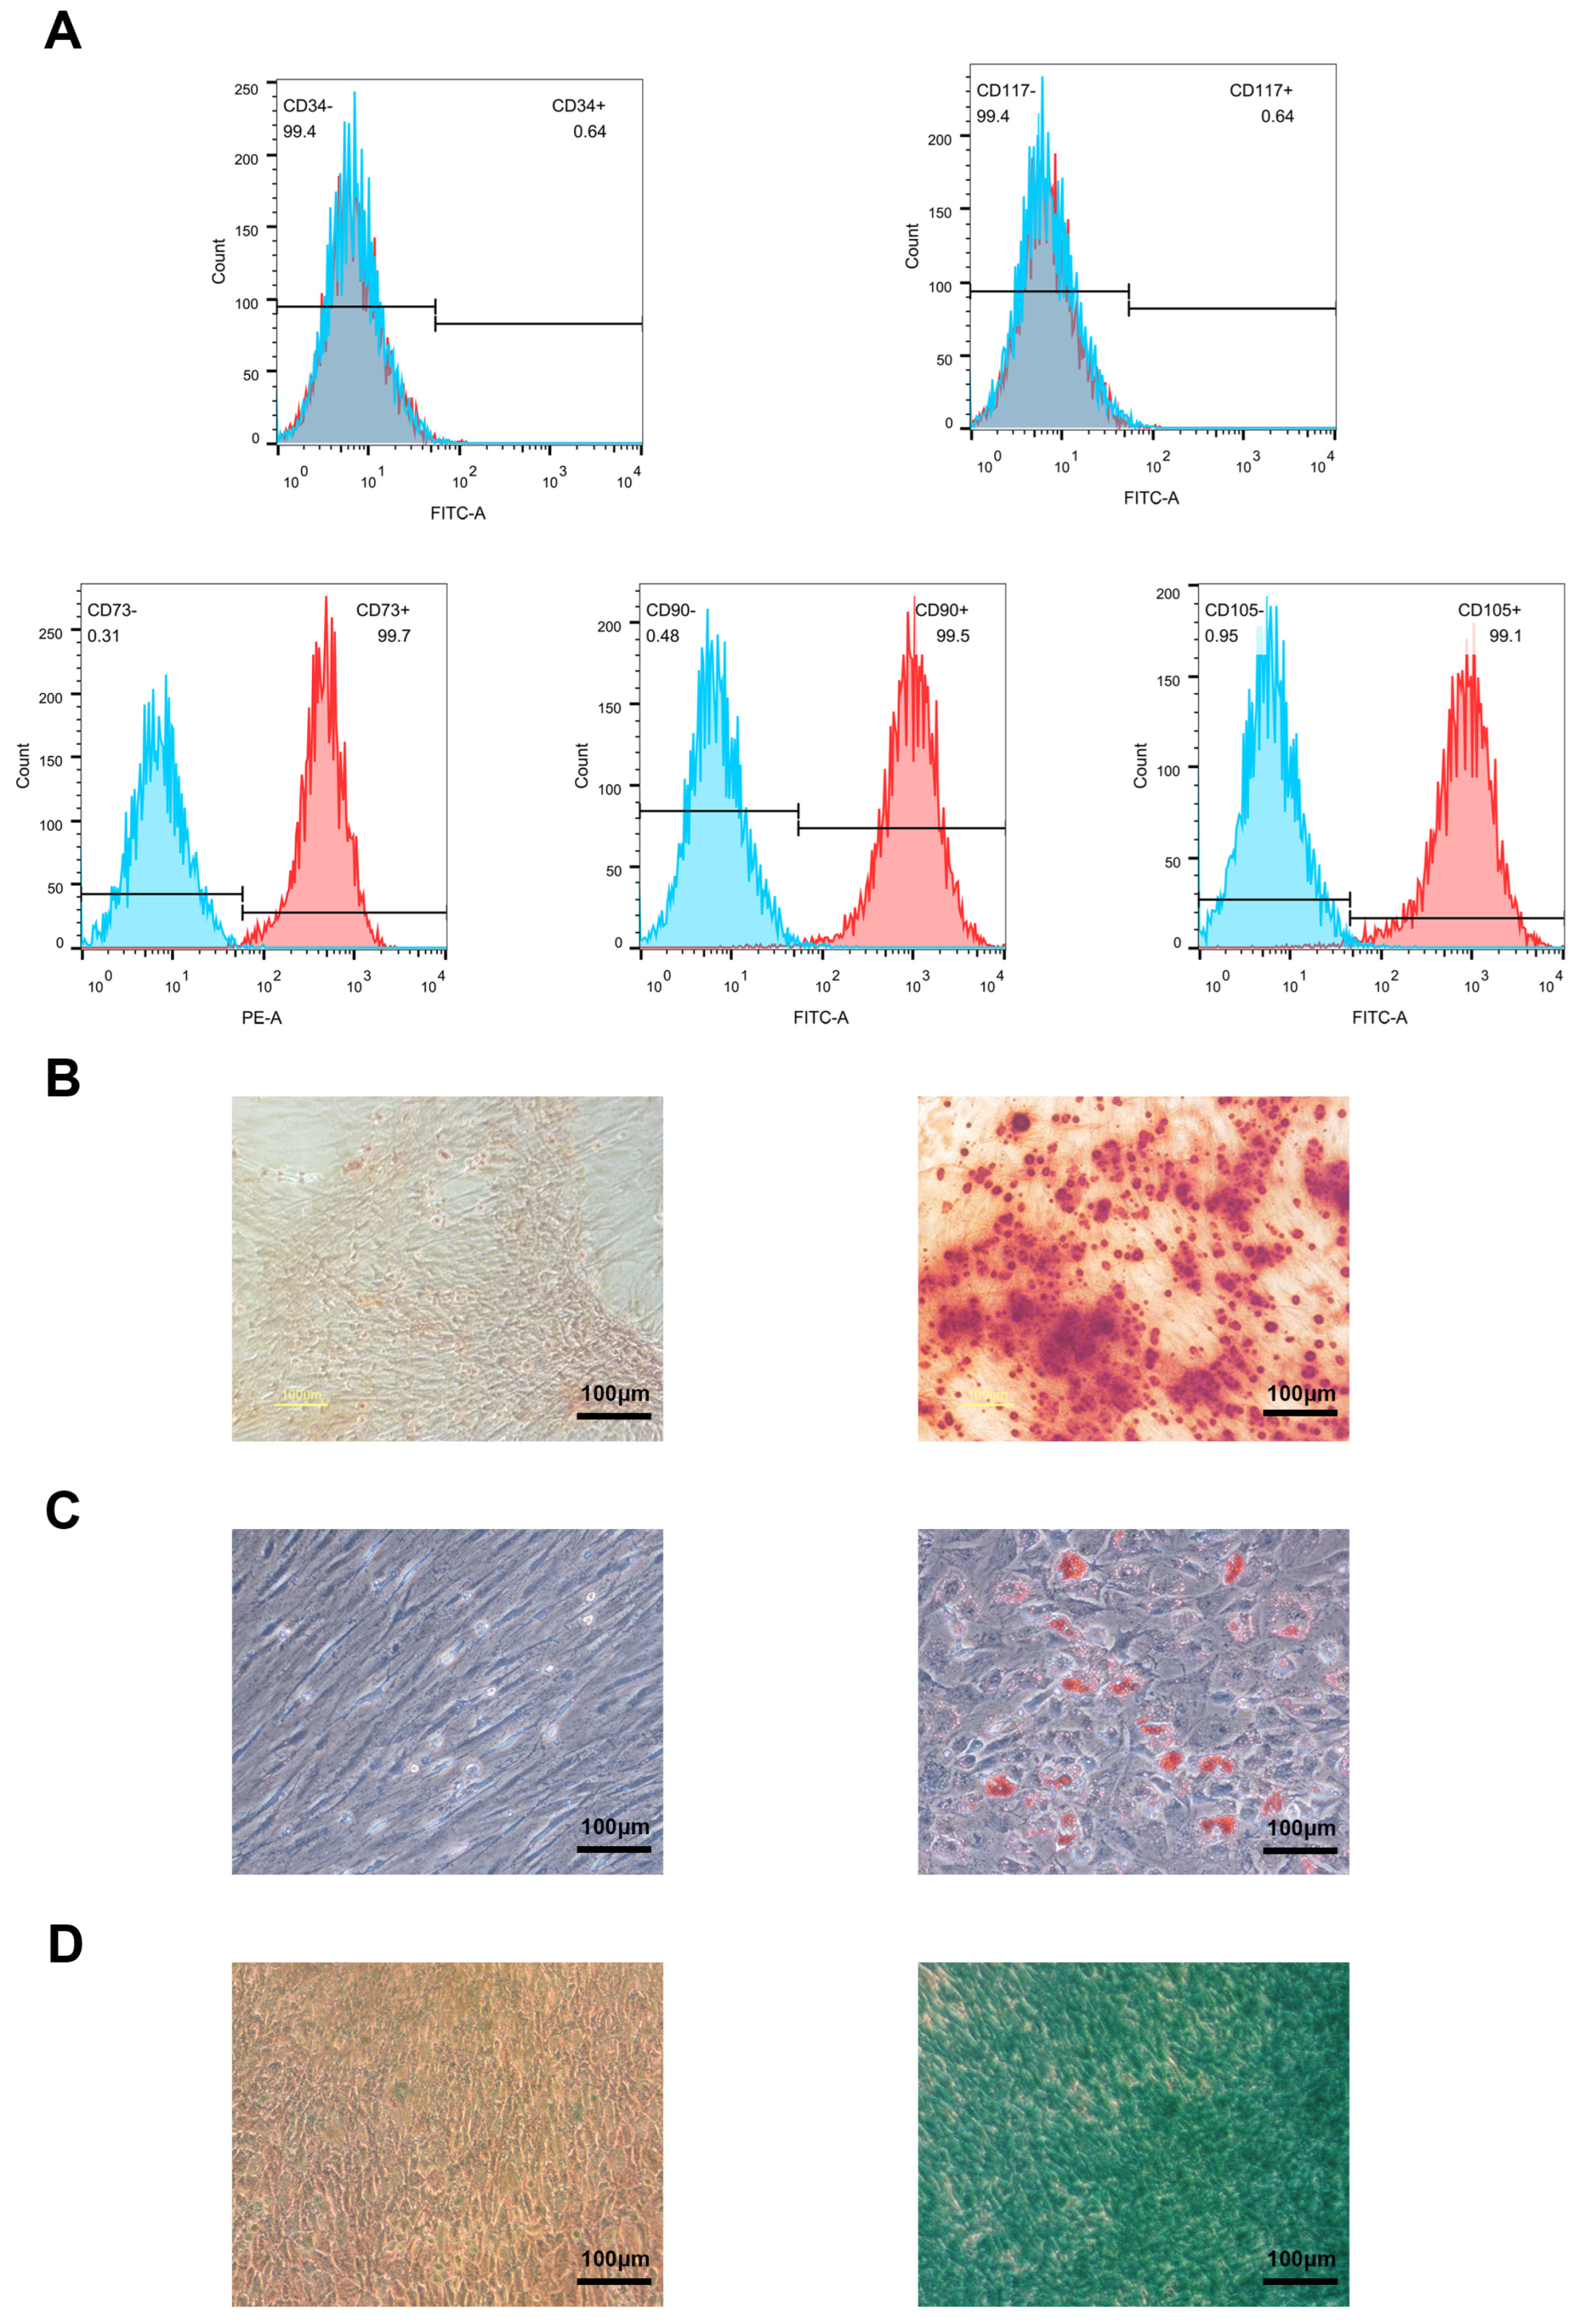
2.2. Flow Cytometry Analysis

Passage four mBMSCs isolated from the C57BL/6J mice were characterized by flow cytometry analysis. A total of 1 × 10⁶ cells were washed with 10% FBS/PBS and centrifuged at 1000 rpm for 5 min. The cell pellets were incubated at 4 °C with FITC-conjugated mice anti-CD90, CD73, CD105, CD34, and CD117. The cells were examined by flow cytometry with 10,000 events recorded for each condition, and data were analyzed using FlowJo (v10.8.1).

2.3. Cell Differentiation

BMSCs were cultured in α-modified Eagle’s minimum essential medium supplemented with 10% FBS, 200 mM L-glutamine (25030081, Gibco, Thermo Fisher, Waltham, MA, USA), and nonessential amino acids (NEAA, 11140050, Gibco).
Osteogenic differentiation: 100 mM ascorbic acid, 2 mM b-glycerophosphate, and 10 nM dexamethasone (D4902; Sigma–Aldrich, Merck KGaA, Darmstadt, Germany).
For adipogenic differentiation, 0.5 mM isobutylmethylxanthine (IBMX, HY-12318, MedChemExpress, Monmouth Junction, NJ, USA), 0.5 mM hydrocortisone (803146, Sigma–Aldrich, Germany), and 60 mM indomethacin (I7378, Sigma–Aldrich, Germany) were used.
Media were changed every 2 days.

2.4. Lentivirus Transduction

Lentiviral transduction: Lentivirus-overexpressing genes were purchased from Genomeditech (Shanghai, China).
BMSCs were infected with the virus. After 48 h transfection, the cells underwent osteogenic-induced differentiation.

2.5. Quantitative Real-Time PCR

Total RNA from the cultured cells was isolated during TRlzolTM reagent (lnvitrogenTM, Thermo Fisher, Waltham, MA, USA) following the manufacturer’s protocol [30,31]. Subsequently, cDNA synthesis was performed using the PrimeScriptTM RT Reagent Kit (cat. no. RR0114A, Takara Bio Inc., Kusatsu, Japan) according to the manufacturer’s instructions. Finally, a qPCR analysis was conducted on a LightCycler® 96 system (Roche, Basel, Switzerland). The experiment was repeated three times. All the data were normalized to those of GAPDH. The relative expression levels of the target genes were calculated using the 2−ΔΔCT method. All the data are presented as means ± SD from three independent experiments [32]. The sequences of the primers used are listed in Table S1.

2.6. Alizarin Red Staining (ARS)

The cell-abandoned medium was immersed in alizarin red S staining solution for 30 min. The cells were quickly rinsed with distilled water and then studied under a microscope.

2.7. Alcian Blue Staining

The cells were washed with PBS three times for 3 min each and then fixed with 4% paraformaldehyde. Next, the cells were washed with PBS again and incubated with 1% of alcian blue for 30 min. Then, the cells were rinsed in water for 2 min and dehydrated with 95% ethanol for 15 s. Ultimately, the slides were observed under a microscope.

2.8. Oil Red O Staining

The cells were immobilized with phosphate buffer containing 10% formaldehyde for 10 min and then rinsed once with PBS for 1 min. Next, the cells were rinsed with 60% isopropyl alcohol for 15 s to promote neutral fat staining. Then, the cells were stained with filtered oil red O working solution at 37 °C for 30 min, treated with 60% isopropyl alcohol for 30 s, and rinsed with PBS three times for 3 min each. Finally, the cells were observed under a microscope.

2.9. ALP Staining

After 7 days of osteogenic induction, the cells were washed with PBS three times and then fixed with 4% paraformaldehyde. Subsequently, the cells were incubated with a solution containing 5-bromo-4-chloro-3-indolyl phosphate/nitro blue tetrazolium. After 15 min of incubation at 37 °C, the cell layer was washed with deionized water three times and observed under a digital camera.

2.10. Bioinformatics Analysis

2.10.1. Data Collection and Processing

Microarray datasets in this study were obtained from the Gene Expression Omnibus (GEO) database. Datasets were included based on the following criteria: (1) the high-throughput sequencing or array-based transcriptome analysis of MSC osteogenic differentiation; (2) total sample size greater than 15; and (3) the availability of raw data with clear experimental annotations. Two datasets meeting these criteria were selected: GSE37558 (12-day osteogenic induction) and GSE28205 (14-day osteogenic induction) [33,34].

2.10.2. Differential Expression Analysis

Raw data preprocessing and normalization were performed using the R/Bioconductor package. A differential expression analysis was conducted using GEO2R with the following parameters: false discovery rate (FDR) ≤ 0.25 and p-value ≤ 0.05. Heatmaps were generated to illustrate the differences between the groups in each dataset. Venn diagram analysis was performed using the VennDiagram R package, and the overlapping differentially expressed genes (DEGs) in the two datasets were identified as common DEGs (co-DEGs). Further refinement of the co-DEGs was achieved by applying an additional threshold of log2(fold change) ≥ 1.5. The final set of DEGs was categorized into up- and down-regulated genes based on their expression patterns for subsequent experimental validation.
To assess the tissue-specific expression profiles of the identified DEGs, we utilized the Human Protein Atlas database [35,36,37]. The expression levels of the candidate genes were systematically evaluated in osteogenic-relevant tissues, specifically bone marrow. Genes exhibiting elevated expression in these tissues, as defined by standardized database parameters, were prioritized for further experimental validation. This tissue-specific filtering approach enabled the identification of DEGs with potentially relevant biological functions in osteogenic contexts.

3. Results

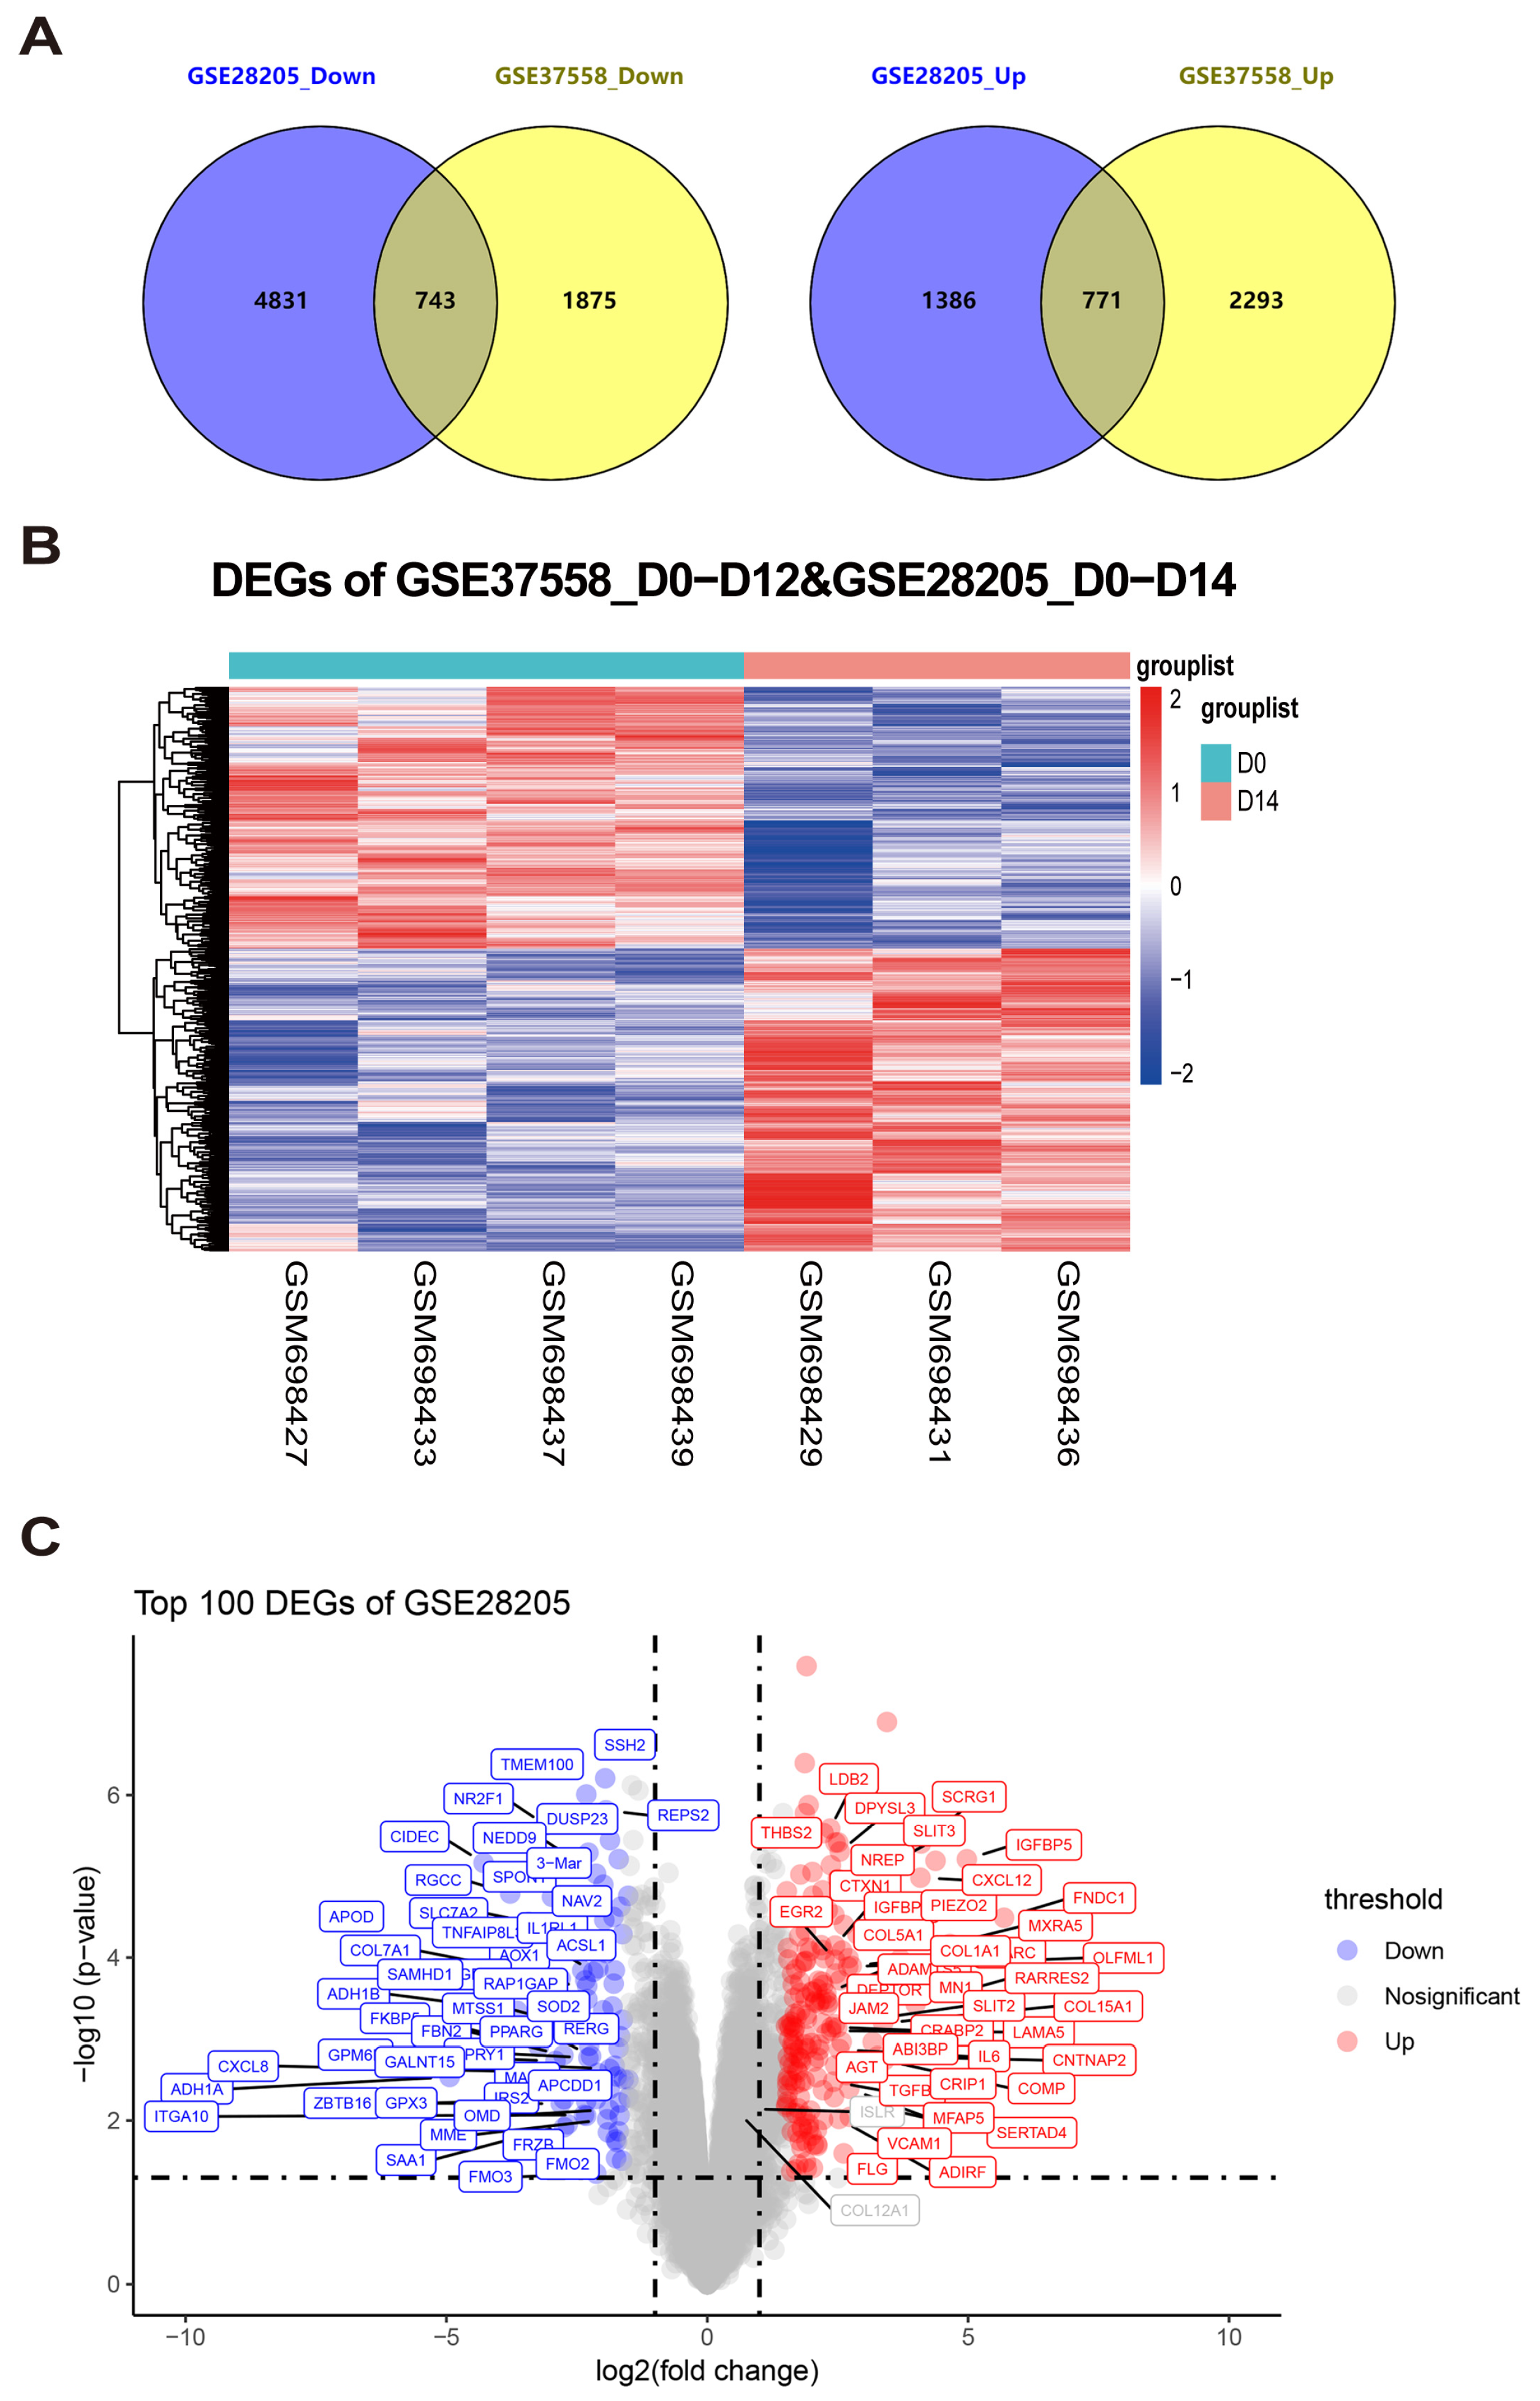
3.1. Integration Analysis of Microarray Datasets to Identify Differentially Expressed Genes in MSC Osteogenic Differentiation

To identify the genes associated with MSC osteogenic differentiation, we performed an integration analysis on two microarray datasets with comparable levels of osteogenic induction. Specifically, the datasets utilized for our analysis were GSE37558 for 12-day osteogenic induction and GSE28205 for 14-day induction. Despite the difference in induction duration, both datasets were considered to have comparable levels of osteogenic activity, making them suitable for a combined analysis.
We employed a flexible threshold with a false discovery rate (FDR) ≤ 0.25 and a p-value ≤ 0.05 to detect DEGs within each dataset. Moreover, a Venn diagram analysis was used to recognize the common DEGs between the two datasets, revealing a total of 1156 shared genes (Figure 1A,B).
To further refine the selection, we applied a cutoff of log2(fold change) ≥ 1.5, which identified 169 DEGs. Among these, 100 were down-regulated, and 69 were up-regulated (Figure 1C). The above genes would be subjected to further experimental validation and analysis for a deeper understanding of their roles in MSC osteogenic differentiation.

3.2. Exploration of Continuously Differentially Expressed Genes During MSC Osteogenic Induction from GSE37558 Dataset

To ensure a comprehensive analysis of transcriptome dynamics during osteogenic differentiation, we integrated microarray data from the GSE37558 dataset over a time course. The dataset enabled us to examine changes in gene expression across multiple time points during the differentiation process.
For our analysis, we performed time points of osteogenic induction as a reference for the subsequent induction time points and analyzed the GSE37558 dataset. Specifically, we compared gene expression changes between Day 0 to 2, Day 2 to 8, and Day 8 to 25. To identify DEGs across these intervals, we applied screening criteria with a false discovery rate (FDR) of ≤0.25 and a p-value of ≤0.05. This approach allowed us to detect 549 DEGs over the course of osteogenic induction(Figure 2A,B).
Delving into our findings, we used a log2(fold change) threshold of ≥1.5, identifying 121 DEGs. Of these, 84 were up-regulated, and 27 were down-regulated (Figure 2C). These genes would undergo additional scientific investigation to further explore their roles in MSC osteogenic differentiation.

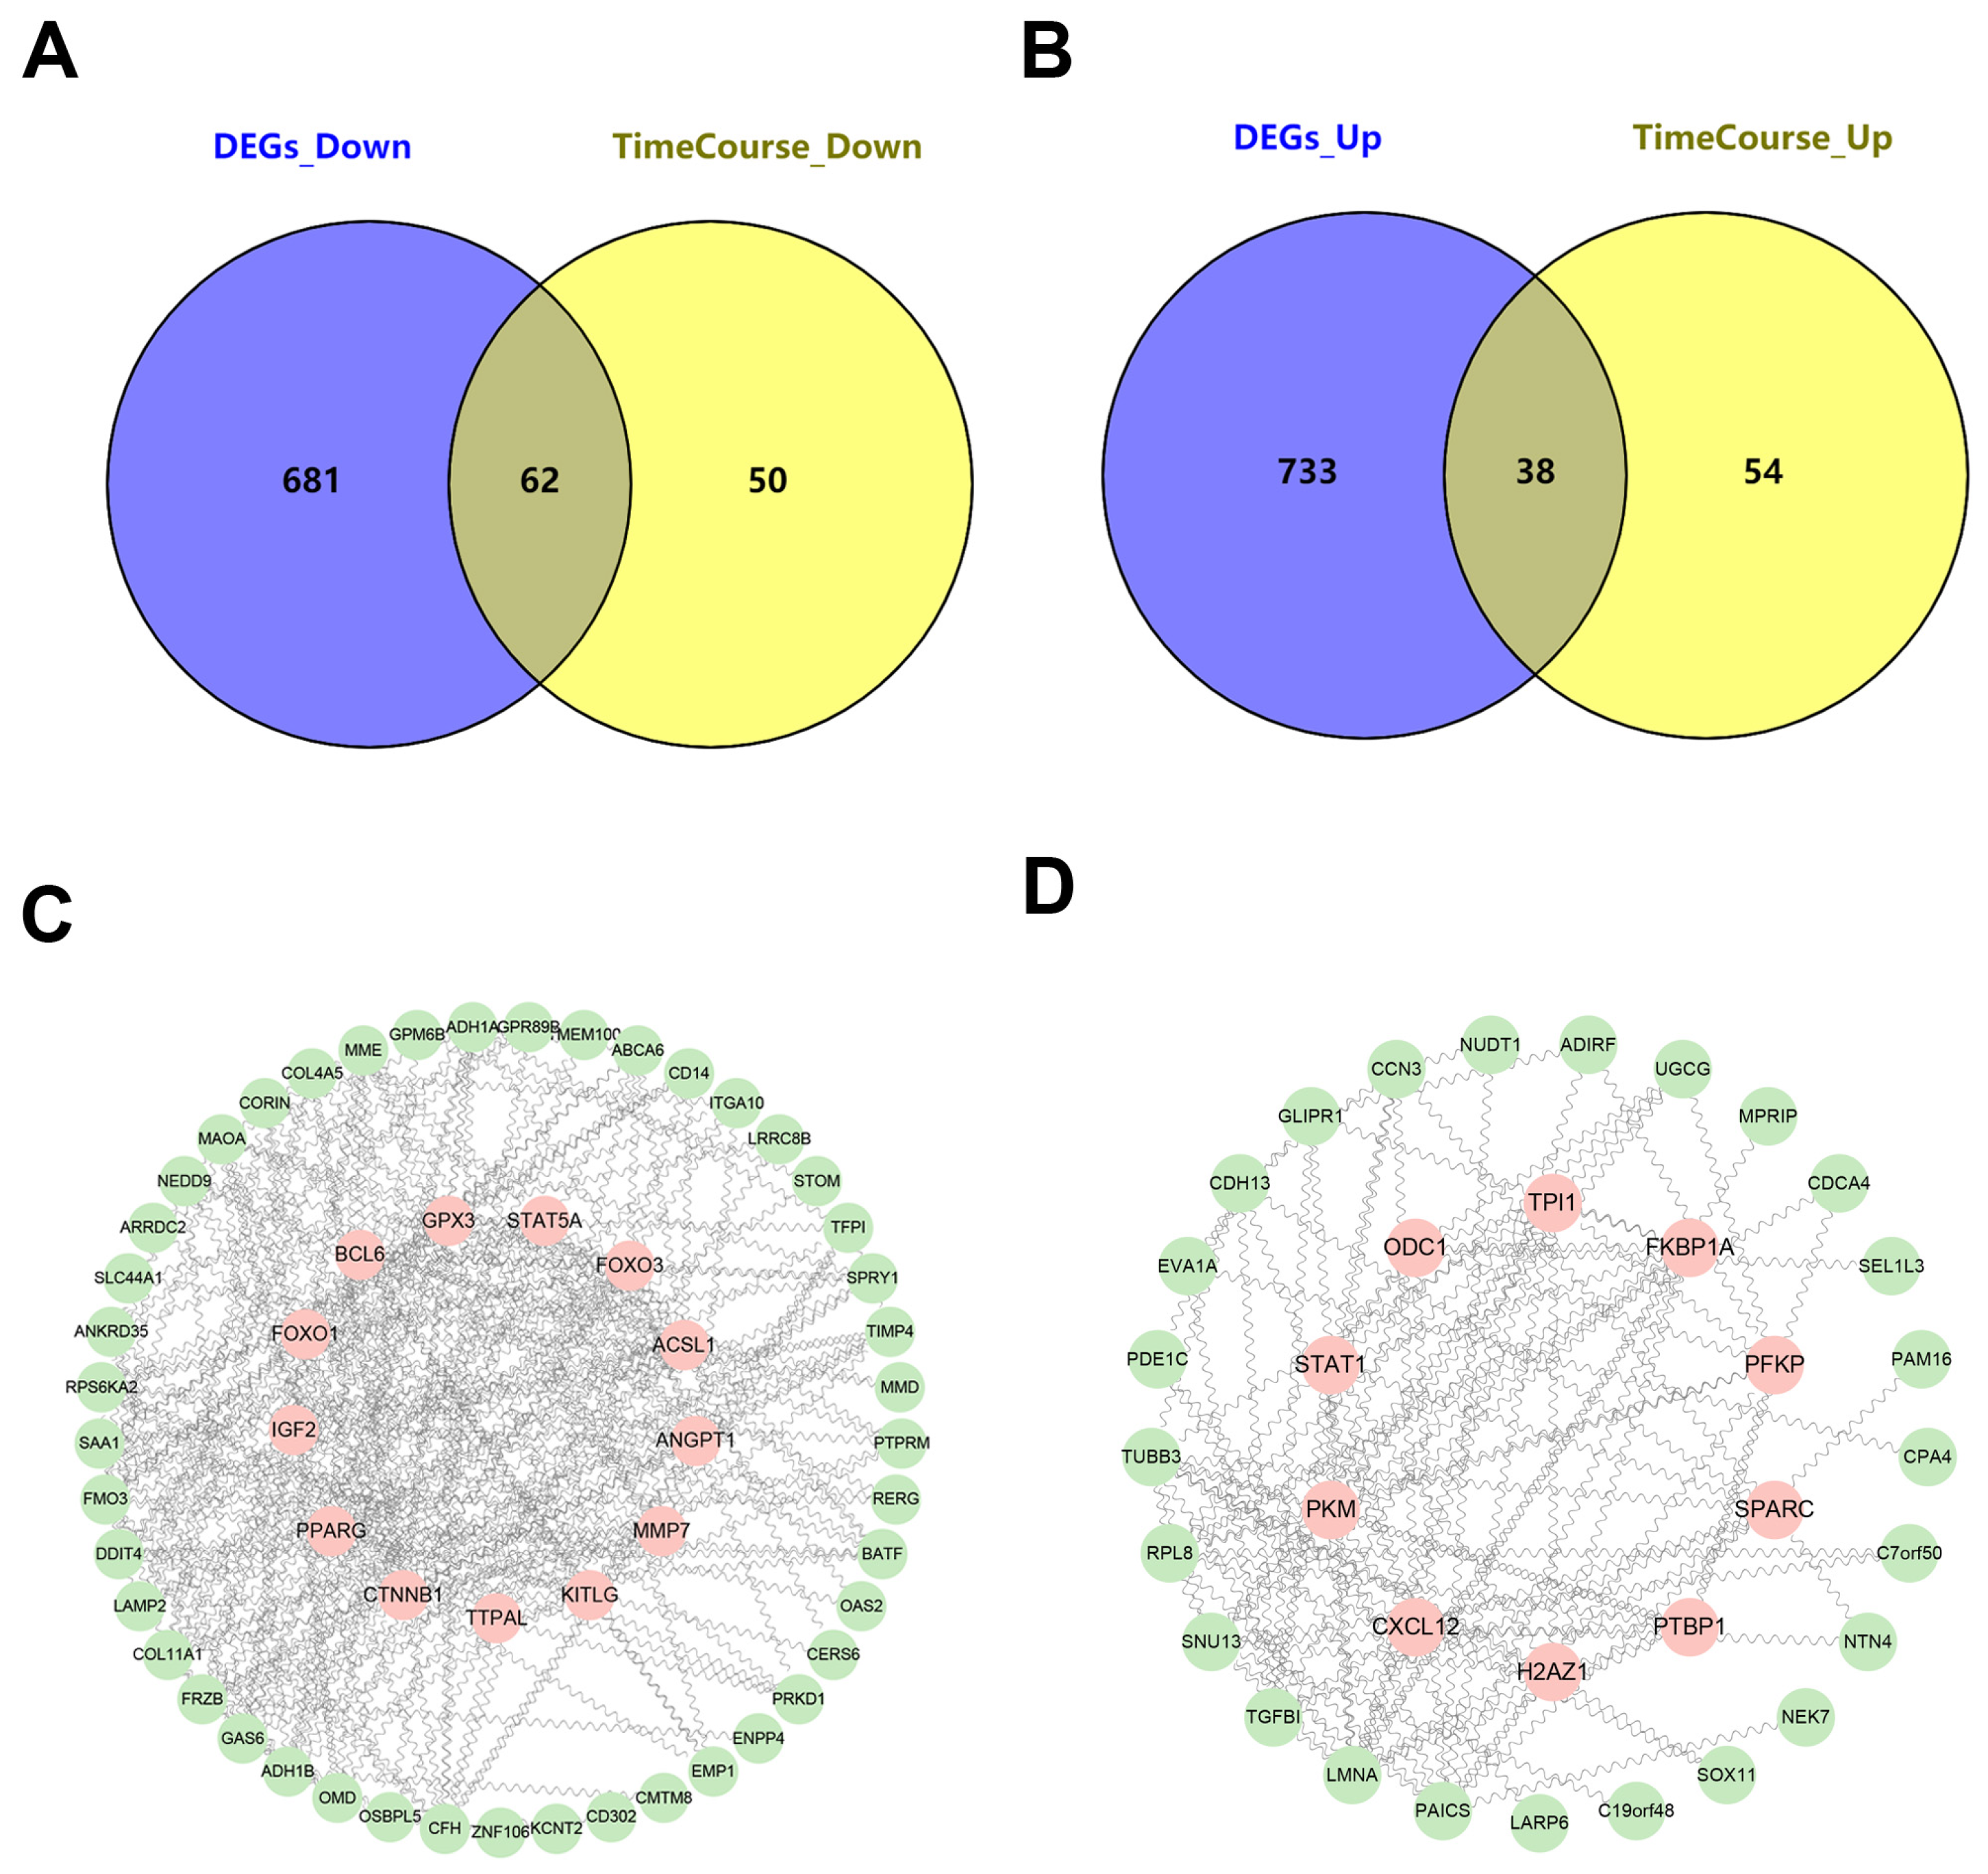
3.3. Integrated Time-Course Analysis of Differentially Expressed Genes During MSC Osteogenic Induction

We conducted an integrated time-course analysis of DEGs both with a single batch of microarray data and across multiple batches from different research groups. The approach optimized the identification of continuously differentially expressed genes during MSC osteogenic induction.
We subsequently applied a log2(fold change) (LOGFC) threshold of ≥1.5, identifying 62 genes that were consistently down-regulated and 38 genes that were consistently up-regulated throughout the osteogenic induction process (Figure 3A,B).
To further investigate the regulatory role of these DEGs, we constructed coexpression networks to highlight potential key regulatory molecules in the STRING database (https://cn.string-db.org/), accessed on 24 November 2024.(Figure 3C,D). The network analysis revealed several hub genes, which exhibited strong coexpression with other DEGs. The results mentioned above suggest that the 49 up-regulated genes may play a crucial role in regulating the dynamics of MSC osteogenic differentiation. Follow-up investigations are currently underway to validate these candidate genes and explore their biological functions in the osteogenic process.

3.4. Identification of Key Regulators Governing MSC Osteogenic Differentiation Through the HUMAN PROTEIN ATLAS Database

We focused on identifying key regulators that influence the dynamic progression of MSC osteogenic differentiation. To achieve this, we integrated the expression levels of candidate genes in human tissues using the HUMAN PROTEIN ATLAS database, which provides comprehensive data on RNA and protein expression across 45 human tissue types.
The candidate genes, previously identified as potential regulators of MSC osteogenic differentiation, were analyzed for their expression in human tissues. We leveraged the HUMAN PROTEIN ATLAS database to assess their expression levels in both RNA and protein forms, allowing us to determine the relevance of these genes in various tissues.
Previous studies have highlighted the pivotal role of bone cells, including mesenchymal stem cells and hematopoietic stem cells, in regulating cellular behavior and maintaining tissue homeostasis within the stem cell lineage [38,39]. The skeletal system contains intricate cell lineages derived from these stem cells, which dictate their differentiation into osteogenic lineage, coupled with maintaining the homeostasis of both skeletal and marrow tissues [40].
Given the importance of hematopoietic tissues in blood and immune system regulation, we examined the expression of the candidate genes in these specific tissues using data from the HUMAN PROTEIN ATLAS. A total of 13 potential key regulators were identified, all of which exhibited high expression in some or all of these tissues. Detailed information is provided in Table 1.
Among the 13 candidates, four genes—PTBP1, H2AFZ, BCL6, and TTPAL (C20ORF121)—were found to have particularly high expression levels in most tissues related to the blood and immune system. Three of these genes were highly expressed across all four tissues, while one showed medium expression. The four genes, PTBP1, H2AFZ, TTPAL, and BCL6, serve as critical regulators of MSC osteogenic differentiation. Their potential roles in controlling this dynamic process make them promising targets for further investigation. We are currently conducting biological experiments to validate their molecular functions and further elucidate their involvement in MSC differentiation.

3.5. Isolation of Bone Mesenchymal Stem Cells and qRT–PCR Identification of Candidate Genes During Osteogenic Induction

mBMSCs are widely used in cell therapy and tissue engineering due to their self-renewal capacity and ability to differentiate into various mesoblastic cell types, including osteoblasts, chondrocytes, and adipocytes [41,42]. They are a type of multilineage progenitor cell that possesses self-renewal capacity and can differentiate into various types of mesoblastic cells, including osteoblasts, chondrocytes, adipocytes, etc. [43]. Given their significance, we isolated BMSCs to validate potential candidate genes identified through bioinformatics analysis.
The isolated mBMSCs expressed high levels of mesenchymal markers CD90 (99.5%), CD73 (99.7%), and CD105 (99.1%), while lacking hematopoietic and myeloid markers CD34 (0.64%) and CD117 (0.64%), as confirmed by flow cytometry (Figure 4A). Their multilineage differentiation potential was demonstrated through osteogenic, adipogenic, and chondrogenic induction, evidenced by Alizarin Red, Oil Red O, and Alcian Blue staining, respectively (Figure 4B–D).
We isolated mBMSCs and confirmed their osteogenic differentiation potential through ALP and ARS assays (Figure 5A).
For osteogenic differentiation, BMSCs were treated with an osteogenic medium, and RNA was collected on Day 1, Day 7, Day 14, and Day 21. To assess osteogenesis, we measured the expression of osteogenesis, including ALP, BGLAP, and RUNX2 (Figure 5B).
Next, we evaluated the expression of four candidate genes—BCL6, TTPAL, PTBP1, and H2AFZ. Using qRT-PCR, we assessed their RNA expression on Day 1, Day 7, Day 14, and Day 21. BCL6 and TTPAL showed high expression throughout the induction (Figure 5C). In contrast, PTBP1 and H2AFZ exhibited a decrease in expression over time (Figure 5D).

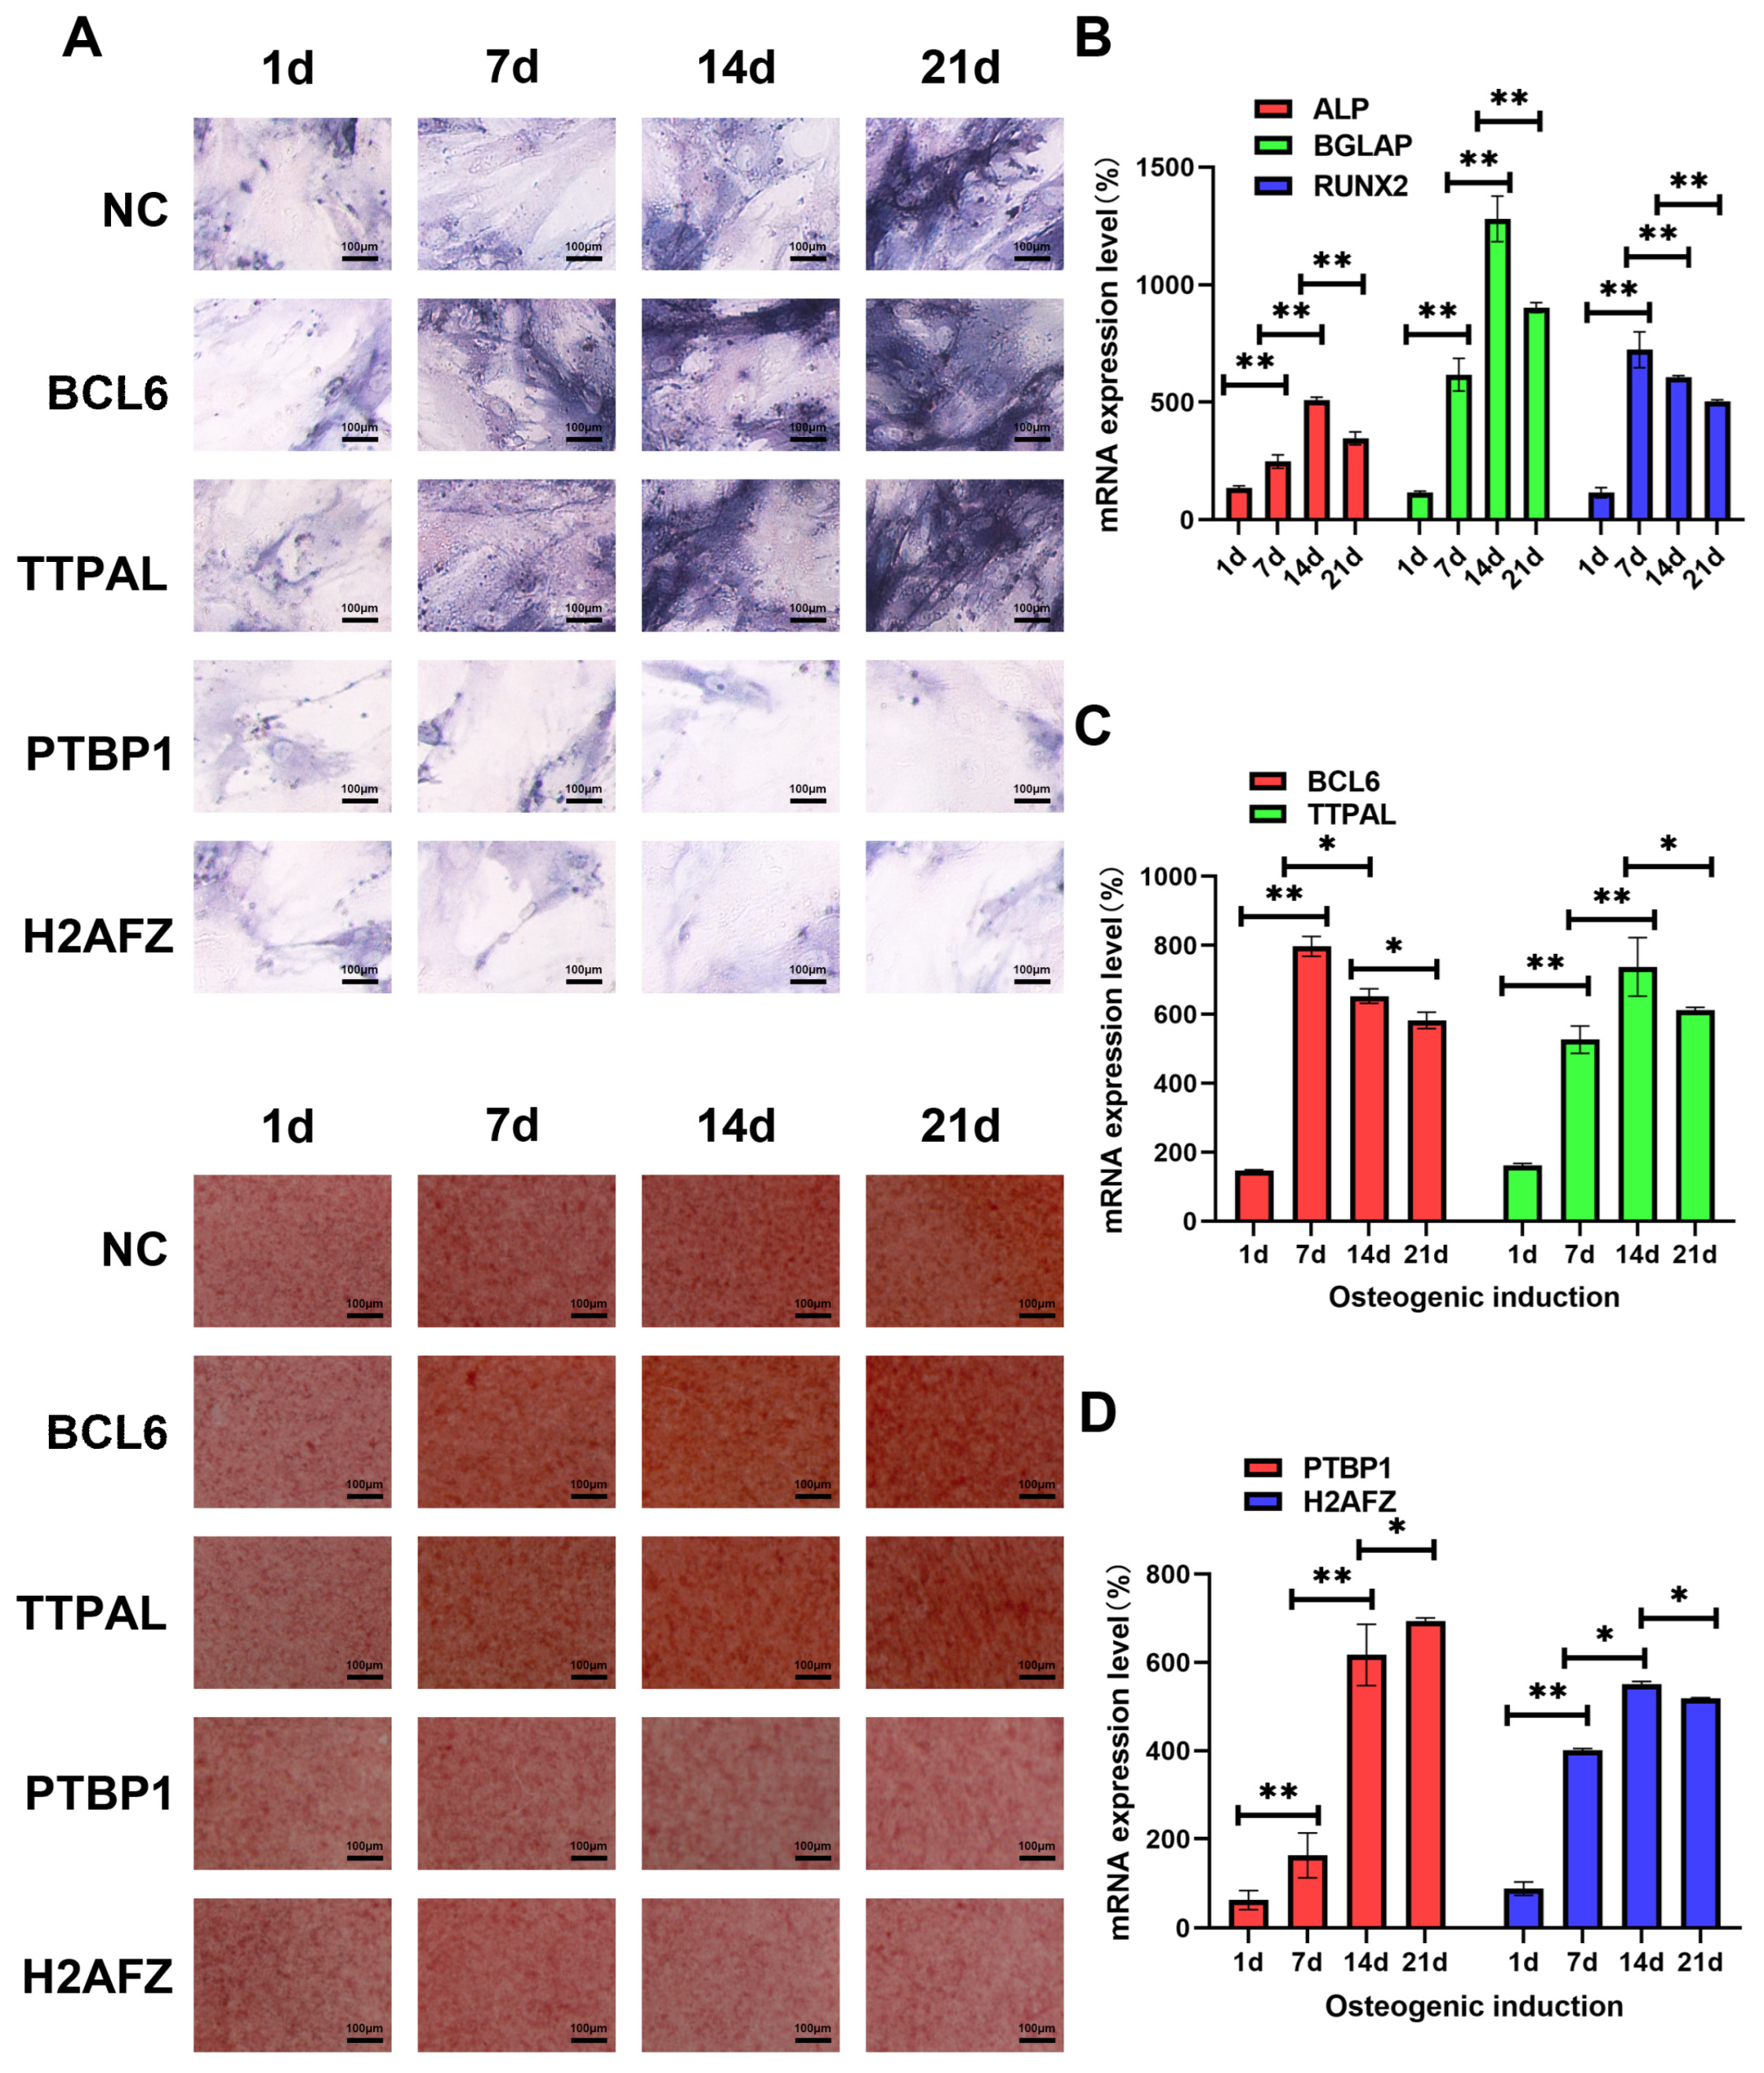
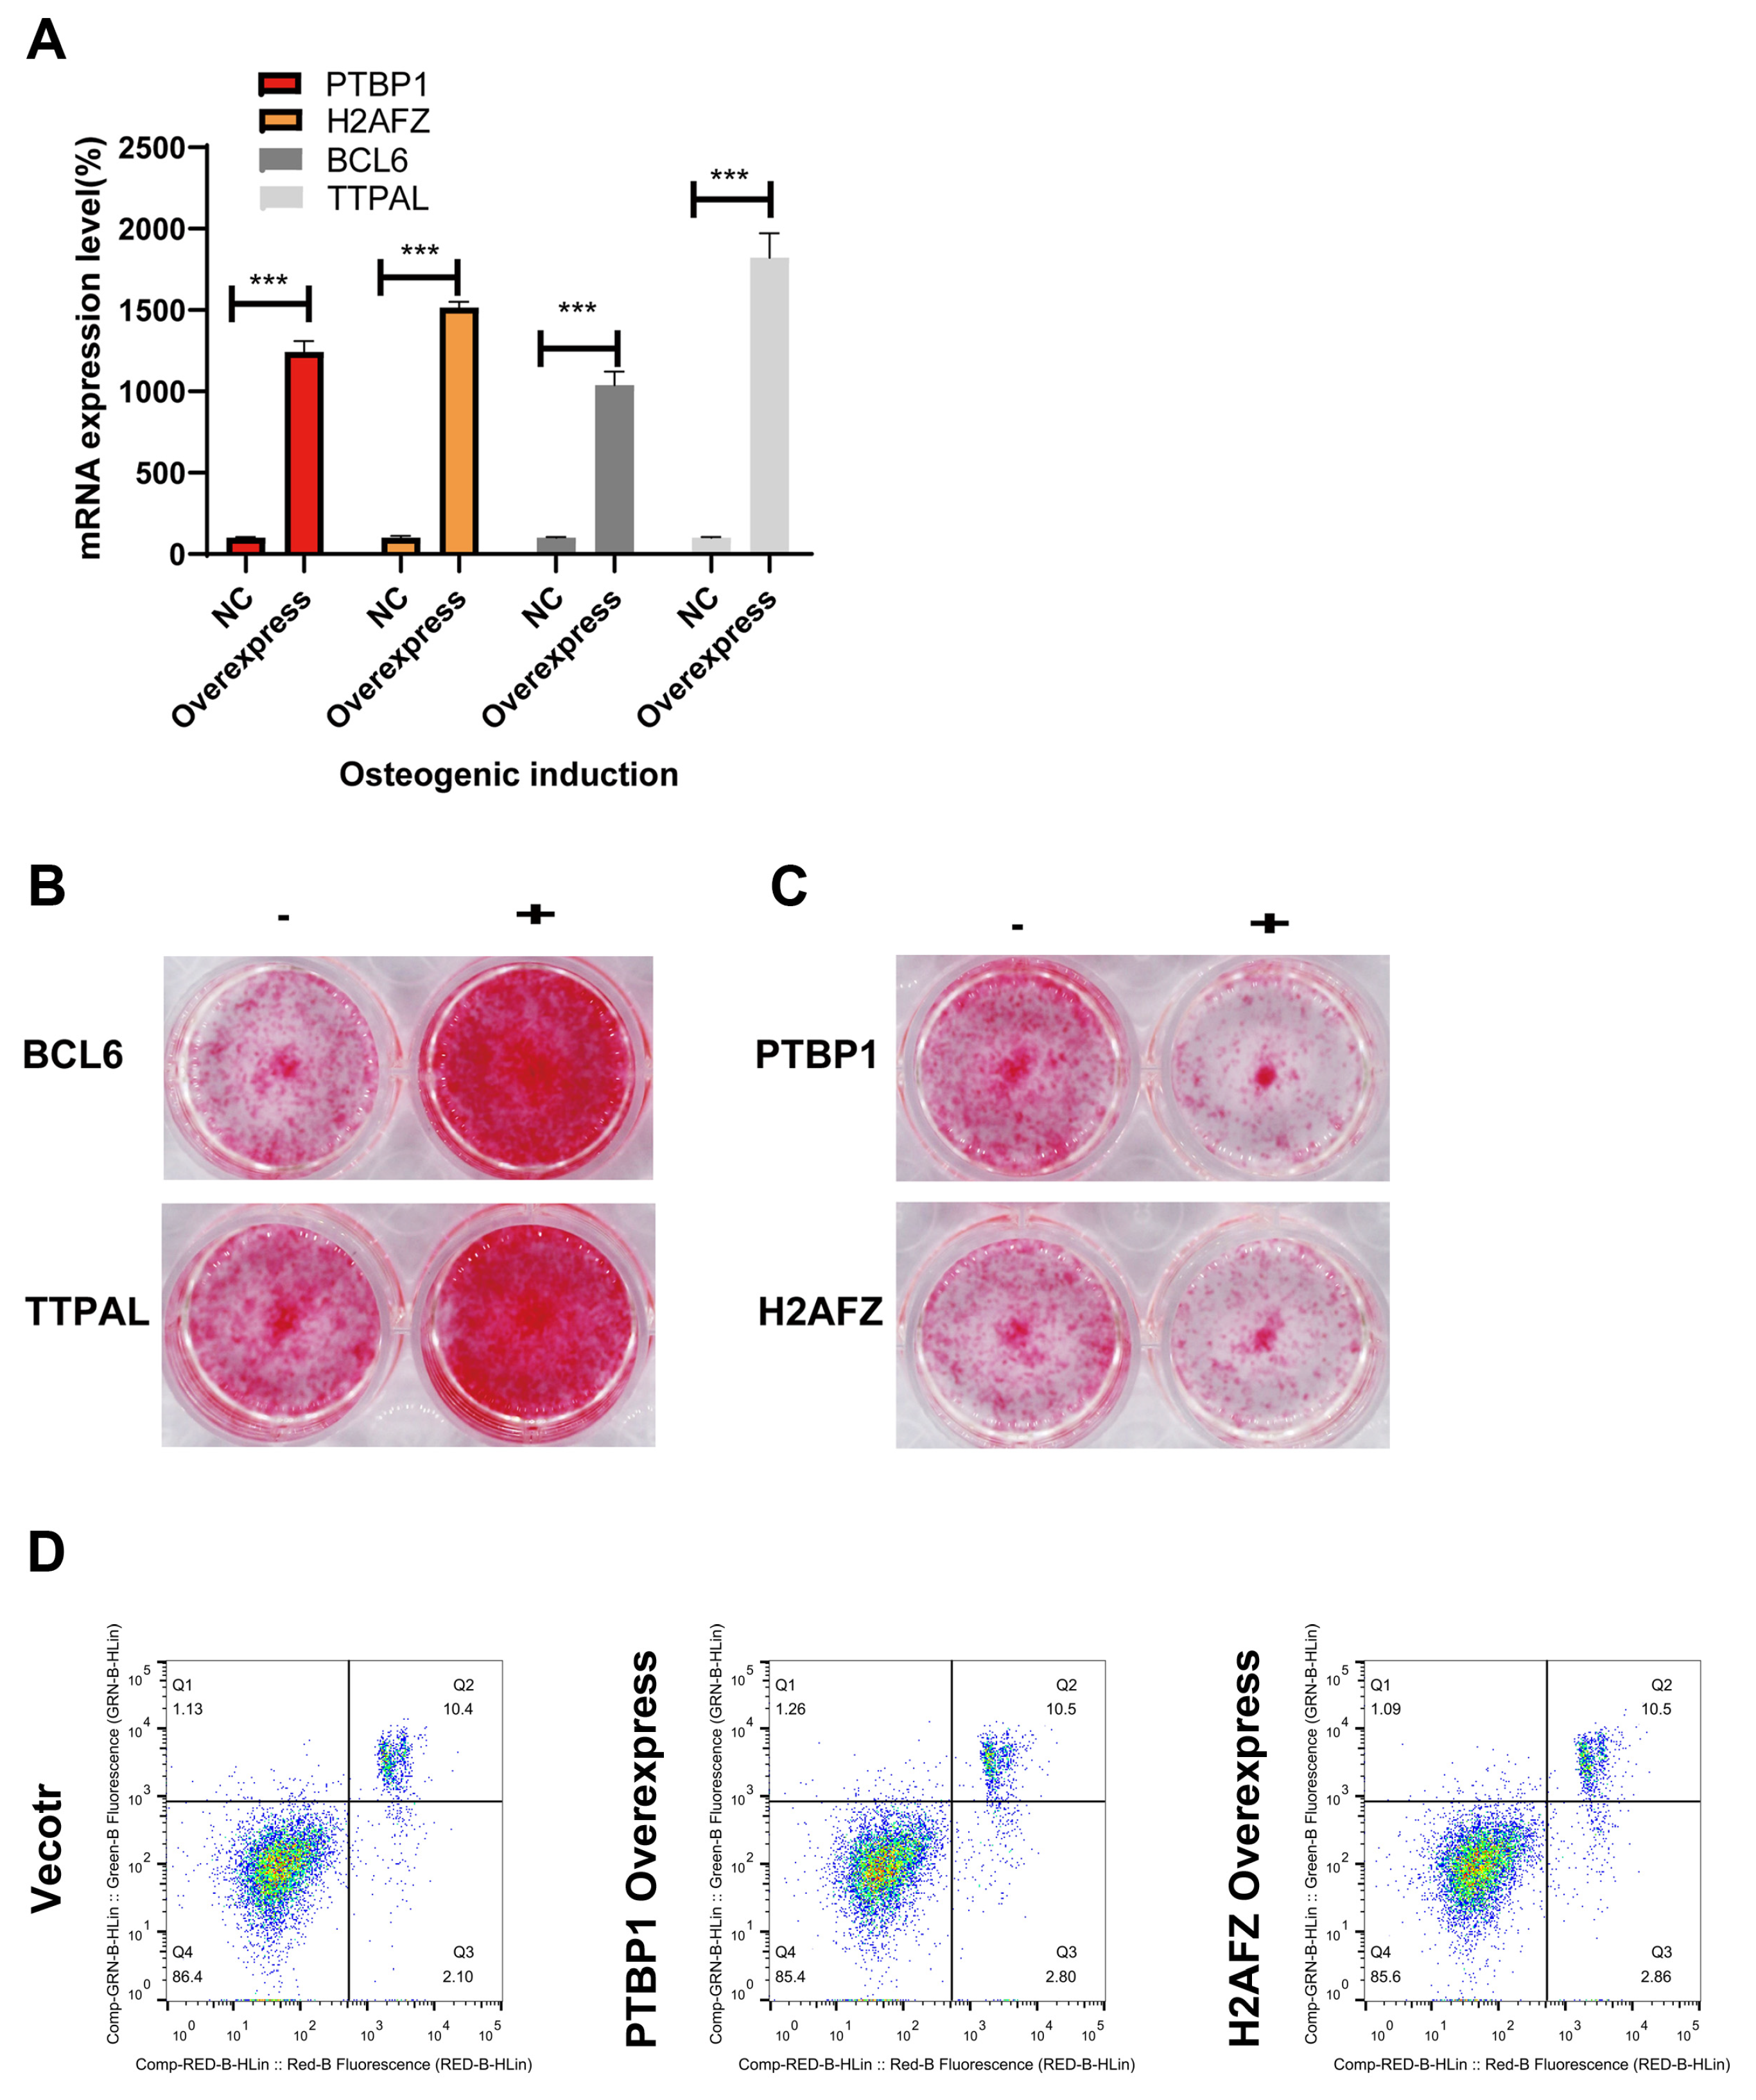
3.6. Identifying the Molecular Function of Osteogenic Regulators in MSCs via Lentiviral Overexpression of Candidate Genes

To explore the molecular mechanisms that regulate osteogenic induction in MSCs, we performed lentiviral packaging technology to overexpress four potential regulatory genes: PTBP1, H2AFZ, BCL6, and TTPAL.
We first employed lentiviral packaging to overexpress the four candidate genes in 293T cells. The lentivirus produced from these cells was then used to infect BMSCs using the 293T supernatant. After a 48 h transduction period, RNA was extracted from the infected BMSCs to assess infection efficiency via qRT-PCR. The results confirmed successful infection (Figure 6A).
To assess the impact of gene overexpression on osteogenesis, we performed experiments using lentiviruses containing each of the four genes to infect BMSCs. The osteogenic potential of the infected BMSCs was evaluated using ARS on Day 7 post-infection. A control group, infected with a vector virus, was used for comparison. BCL6 and TTPAL were shown to enhance osteogenic potential, as indicated by increased ARS activity (Figure 6B). In contrast, PTBP1 and H2AFZ appeared to inhibit osteogenesis, as demonstrated by reduced ARS activity (Figure 6C). To rule out the influence of apoptosis, flow cytometry analysis was performed, demonstrating that PTBP1 and H2AFZ inhibit osteogenesis independently of apoptosis (Figure 6D).
The aforementioned findings suggest that BCL6 and TTPAL serve as positive regulators of osteogenic lineage differentiation in BMSCs, while PTBP1 and H2AFZ act as negative regulators.

4. Discussion

With the advancement of omics, research on genome-wide dynamics, including transcription factors and epigenomic programming, during pre-osteoblast differentiation has made significant progress [44,45]. In this research article, we leveraged publicly available transcriptomic datasets, including GSE37558 and GSE28205, which provided a foundational framework for examining critical factors that determine MSC differentiation fate, to systematically investigate the dynamic regulation of MSC differentiation during osteogenesis by exploring key cellular factors [33,34]. By integrating transcriptomic sequencing from different induction time points in a single-batch microarray dataset, as well as multiple-batch array sequencing, we identified differentially expressed genes that exhibited continuous and significant changes during MSC osteogenic induction.
To enhance the biological and clinical relevance of these candidate genes, we examined their expression levels in human tissues using the HUMAN PROTEIN ATLAS database [46,47]. High expression in blood and immune-related organs was used as a key criterion for further refining our selection. Through extensive big data analysis, we identified 13 genes with elevated expression in one or more blood and immune system tissues (Table 1).
Among these, four genes—PTBP1, H2AFZ, BCL6, and TTPAL—were selected for experimental validation due to their high expression in multiple blood and immune tissues. Our experimental results demonstrated dynamic changes in the expression of these genes during osteogenic induction, as shown in Figure 5A, which aligned with transcriptomic sequencing data. Moreover, the functional roles of these genes were confirmed through biological assays, as depicted in Figure 5B. These results validate our approach of combining transcriptome sequencing with big data mining to identify key targets that dynamically regulate biological functions.
Based on previous studies, our research provides deeper mechanistic insights through the integration of the existing databases and high-throughput transcriptomics to systematically explore key regulatory factors governing MSC osteogenesis [48,49,50,51,52]. This study holds great implications for understanding the molecular factors that influence MSC differentiation fate and could have significant clinical applications [53]. Specifically, the identification of PTBP1, H2AFZ, BCL6, and TTPAL as the regulators of osteogenic differentiation presents novel therapeutic targets for conditions such as osteoporosis and bone fracture healing.
The current studies aimed to shed light on the molecular factors influencing MSC differentiation during osteogenesis. While our findings contribute to this complex landscape, recent advances have revealed multiple regulatory mechanisms. Tu W et al. identified that circ_0005753 interacts with PTBP1, which enhances TXNIP mRNA stability and elevates TXNIP expression [54]. The circ_0005753/PTBP1/TXNIP signaling pathway ultimately suppresses BMSC osteogenic differentiation. Similarly, Fujie et al. elucidated how Bcl6 governs Stat1 expression to regulate Runx2 nuclear translocation, where Bcl6 deletion elevates Stat1 levels, thereby inhibiting BMP2-stimulated Runx2 nuclear translocation—a critical step in bone formation [55]. In contrast, the role of H2AFZ remains somewhat ambiguous. Our results indicate H2AFZ down-regulation during osteogenic differentiation, contrasting with Diesel et al.’s observation of H2AFZ stability throughout hASC osteogenic differentiation over 28 days [56]. This discrepancy highlights a critical knowledge gap in understanding H2AFZ’s role in BMSC osteogenesis—particularly significant given BMSCs’ fundamental role in skeletal development and homeostasis [57].
While our analysis of high-throughput transcriptomic data from the GEO database provided valuable insights into the biological processes underlying osteogenic differentiation [58], it is important to acknowledge the limitations of this approach. Single analyses, although informative, may not fully capture the complexity of these processes [59,60]. Future studies should adopt multi-omics approaches, integrating data from mRNAs, regulatory factors, proteins, and metabolites to construct comprehensive gene regulatory networks. This would help elucidate causal relationships between molecules and provide a deeper understanding of the underlying mechanisms [61].
Despite this study focusing on high-throughput sequencing to identify key molecules in MSC osteogenic differentiation, further validation through both in vitro and in vivo experiments is necessary [62,63]. This will help facilitate the translation of our findings into clinical applications [64].

Supplementary Materials

The following supporting information can be downloaded at https://www.mdpi.com/article/10.3390/genes15121568/s1, Table S1: The primer sequences.

Author Contributions

Conceptualization, Y.L. and S.P.; methodology, L.L.; software, L.H.; validation, Y.P., T.L. and L.L.; formal analysis, Y.P.; investigation, L.H.; resources, T.L.; data curation, T.L. and Y.P.; writing—original draft preparation, Y.P. and T.L.; writing—review and editing, Y.L.; visualization, Y.L.; supervision, S.P.; project administration, Y.L.; funding acquisition, Y.L. and T.L. All authors have read and agreed to the published version of the manuscript.

Funding

This research was funded by the Natural Science Foundation of Jiangsu Province, grant number BK20221288 to Tao Liu, China Postdoctoral Science Foundation, grant number 2020M681232 to Yuwei Liu, and National Natural Science Foundation of China, grant number 82101630 to Yuwei Liu.

Institutional Review Board Statement

All the animal studies were performed in accordance with protocols approved by the Institutional Animal Care and Use Committee of East China Normal University (ECNU). All the mice had unrestricted access to food, water, and activity and were housed under a 12 h dark–light cycle with a constant temperature (20~26 °C) and humidity maintenance (40–60%). All the animal experiments were conducted under license at the Institutional Animal Care and Use Committee at East China Normal University (project license m20210216, 5 March 2021). For euthanasia, the mice were exposed to carbon dioxide with a Smartbox setup with a flow meter to calculate to deliver the appropriate flow, followed by cervical dislocation.

Informed Consent Statement

Not applicable.

Data Availability Statement

Data supporting our study are openly available in public repositories GSE37558 and GSE28205.

Conflicts of Interest

The authors declare no conflicts of interest.

References

  1. Yu, H.; Huang, Y.; Yang, L. Research progress in the use of mesenchymal stem cells and their derived exosomes in the treatment of osteoarthritis. Ageing Res. Rev. 2022, 80, 101684. [Google Scholar] [CrossRef] [PubMed]
  2. Zhang, H.; Xu, R.; Li, B.; Xin, Z.; Ling, Z.; Zhu, W.; Li, X.; Zhang, P.; Fu, Y.; Chen, J.; et al. LncRNA NEAT1 controls the lineage fates of BMSCs during skeletal aging by impairing mitochondrial function and pluripotency maintenance. Cell Death Differ. 2022, 29, 351–365. [Google Scholar] [CrossRef] [PubMed]
  3. Han, Y.; Yang, J.; Fang, J.; Zhou, Y.; Candi, E.; Wang, J.; Hua, D.; Shao, C.; Shi, Y. The secretion profile of mesenchymal stem cells and potential applications in treating human diseases. Signal Transduct. Target. Ther. 2022, 7, 92. [Google Scholar] [CrossRef] [PubMed]
  4. Wang, Y.; Fang, J.; Liu, B.; Shao, C.; Shi, Y. Reciprocal regulation of mesenchymal stem cells and immune responses. Cell Stem Cell 2022, 29, 1515–1530. [Google Scholar] [CrossRef]
  5. Jiang, Z.; Li, N.; Shao, Q.; Zhu, D.; Feng, Y.; Wang, Y.; Yu, M.; Ren, L.; Chen, Q.; Yang, G. Light-controlled scaffold- and serum-free hard palatal-derived mesenchymal stem cell aggregates for bone regeneration. Bioeng. Transl. Med. 2023, 8, e10334. [Google Scholar] [CrossRef]
  6. Li, P.; Gong, Z.; Shultz, L.D.; Ren, G. Mesenchymal stem cells: From regeneration to cancer. Pharmacol. Ther. 2019, 200, 42–54. [Google Scholar] [CrossRef]
  7. Hoang, D.M.; Pham, P.T.; Bach, T.Q.; Ngo, A.T.L.; Nguyen, Q.T.; Phan, T.T.K.; Nguyen, G.H.; Le, P.T.T.; Hoang, V.T.; Forsyth, N.R.; et al. Stem cell-based therapy for human diseases. Signal Transduct. Target. Ther. 2022, 7, 272. [Google Scholar] [CrossRef]
  8. Zhang, L.; Ma, X.-J.; Fei, Y.-Y.; Han, H.-T.; Xu, J.; Cheng, L.; Li, X. Stem cell therapy in liver regeneration: Focus on mesenchymal stem cells and induced pluripotent stem cells. Pharmacol. Ther. 2022, 232, 108004. [Google Scholar] [CrossRef]
  9. Song, N.; Scholtemeijer, M.; Shah, K. Mesenchymal Stem Cell Immunomodulation: Mechanisms and Therapeutic Potential. Trends Pharmacol. Sci. 2020, 41, 653–664. [Google Scholar] [CrossRef]
  10. Kim, P.; Park, J.; Lee, D.-J.; Mizuno, S.; Shinohara, M.; Hong, C.P.; Jeong, Y.; Yun, R.; Park, H.; Park, S.; et al. Mast4 determines the cell fate of MSCs for bone and cartilage development. Nat. Commun. 2022, 13, 3960. [Google Scholar] [CrossRef]
  11. Jia, F.; Fellner, A.; Kumar, K.R. Monogenic Parkinson’s Disease: Genotype, Phenotype, Pathophysiology, and Genetic Testing. Genes 2022, 13, 471. [Google Scholar] [CrossRef] [PubMed]
  12. Deng, P.; Yuan, Q.; Cheng, Y.; Li, J.; Liu, Z.; Liu, Y.; Li, Y.; Su, T.; Wang, J.; Salvo, M.E.; et al. Loss of KDM4B exacerbates bone-fat imbalance and mesenchymal stromal cell exhaustion in skeletal aging. Cell Stem Cell 2021, 28, 1057–1073.e7. [Google Scholar] [CrossRef] [PubMed]
  13. Liu, F.; Yuan, Y.; Bai, L.; Yuan, L.; Li, L.; Liu, J.; Chen, Y.; Lu, Y.; Cheng, J.; Zhang, J. LRRc17 controls BMSC senescence via mitophagy and inhibits the therapeutic effect of BMSCs on ovariectomy-induced bone loss. Redox Biol. 2021, 43, 101963. [Google Scholar] [CrossRef]
  14. Li, C.-J.; Xiao, Y.; Yang, M.; Su, T.; Sun, X.; Guo, Q.; Huang, Y.; Luo, X.-H. Long noncoding RNA Bmncr regulates mesenchymal stem cell fate during skeletal aging. J. Clin. Investig. 2018, 128, 5251–5266. [Google Scholar] [CrossRef]
  15. Li, W.; Feng, W.; Su, X.; Luo, D.; Li, Z.; Zhou, Y.; Zhu, Y.; Zhang, M.; Chen, J.; Liu, B.; et al. SIRT6 protects vascular smooth muscle cells from osteogenic transdifferentiation via Runx2 in chronic kidney disease. J. Clin. Investig. 2022, 132, e150051. [Google Scholar] [CrossRef]
  16. Xing, W.; Godwin, C.; Pourteymoor, S.; Mohan, S. Conditional disruption of the osterix gene in chondrocytes during early postnatal growth impairs secondary ossification in the mouse tibial epiphysis. Bone Res. 2019, 7, 24. [Google Scholar] [CrossRef]
  17. Yoshida, G.; Kawabata, T.; Takamatsu, H.; Saita, S.; Nakamura, S.; Nishikawa, K.; Fujiwara, M.; Enokidani, Y.; Yamamuro, T.; Tabata, K. Degradation of the NOTCH intracellular domain by elevated autophagy in osteoblasts promotes osteoblast differentiation and alleviates osteoporosis. Autophagy 2022, 18, 2323–2332. [Google Scholar] [CrossRef]
  18. Liu, Z.-Z.; Hong, C.-G.; Hu, W.-B.; Chen, M.-L.; Duan, R.; Li, H.-M.; Yue, T.; Cao, J.; Wang, Z.-X.; Chen, C.-Y.; et al. Autophagy receptor OPTN (optineurin) regulates mesenchymal stem cell fate and bone-fat balance during aging by clearing FABP3. Autophagy 2021, 17, 2766–2782. [Google Scholar] [CrossRef]
  19. Zhang, Y.; Lin, D.; Zheng, Y.; Chen, Y.; Yu, M.; Cui, D.; Huang, M.; Su, X.; Sun, Y.; Chen, Y.; et al. MiR-9-1 controls osteoblastic regulation of lymphopoiesis. Leukemia 2023, 37, 2261–2275. [Google Scholar] [CrossRef]
  20. Iacomino, G. miRNAs: The Road from Bench to Bedside. Genes 2023, 14, 314. [Google Scholar] [CrossRef]
  21. Lee, K.S.; Lee, J.; Kim, H.K.; Yeom, S.H.; Woo, C.H.; Jung, Y.J.; Yun, Y.E.; Park, S.Y.; Han, J.; Kim, E.; et al. Extracellular vesicles from adipose tissue-derived stem cells alleviate osteoporosis through osteoprotegerin and miR-21-5p. J. Extracell. Vesicles 2021, 10, e12152. [Google Scholar] [CrossRef] [PubMed]
  22. Lim, J.; Heo, J.; Ju, H.; Shin, J.-W.; Kim, Y.; Lee, S.; Yu, H.Y.; Ryu, C.-M.; Yun, H.; Song, S.; et al. Glutathione dynamics determine the therapeutic efficacy of mesenchymal stem cells for graft-versus-host disease via CREB1-NRF2 pathway. Sci. Adv. 2020, 6, eaba1334. [Google Scholar] [CrossRef] [PubMed]
  23. Soliman, H.; Theret, M.; Scott, W.; Hill, L.; Underhill, T.M.; Hinz, B.; Rossi, F.M. Multipotent stromal cells: One name, multiple identities. Cell Stem Cell 2021, 28, 1690–1707. [Google Scholar] [CrossRef] [PubMed]
  24. Zong, C.; Meng, Y.; Ye, F.; Yang, X.; Li, R.; Jiang, J.; Zhao, Q.; Gao, L.; Han, Z.; Wei, L. AIF1 + CSF1R + MSCs, induced by TNF-α, act to generate an inflammatory microenvironment and promote hepatocarcinogenesis. Hepatology 2023, 78, 434–451. [Google Scholar] [CrossRef]
  25. Tsai, J.N.; Lee, H.; David, N.L.; Eastell, R.; Leder, B.Z. Combination denosumab and high dose teriparatide for postmenopausal osteoporosis (DATA-HD): A randomised, controlled phase 4 trial. Lancet Diabetes Endocrinol. 2019, 7, 767–775. [Google Scholar] [CrossRef]
  26. Wang, Y.; Deng, P.; Liu, Y.; Wu, Y.; Chen, Y.; Guo, Y.; Zhang, S.; Zheng, X.; Zhou, L.; Liu, W.; et al. Alpha-ketoglutarate ameliorates age-related osteoporosis via regulating histone methylations. Nat. Commun. 2020, 11, 5596. [Google Scholar] [CrossRef]
  27. Cai, W.; Zhang, J.; Yu, Y.; Ni, Y.; Wei, Y.; Cheng, Y.; Han, L.; Xiao, L.; Ma, X.; Wei, H.; et al. Mitochondrial Transfer Regulates Cell Fate Through Metabolic Remodeling in Osteoporosis. Adv. Sci. 2023, 10, e2204871. [Google Scholar] [CrossRef]
  28. Gong, Y.; Li, Z.; Zou, S.; Deng, D.; Lai, P.; Hu, H.; Yao, Y.; Hu, L.; Zhang, S.; Li, K.; et al. Vangl2 limits chaperone-mediated autophagy to balance osteogenic differentiation in mesenchymal stem cells. Dev. Cell 2021, 56, 2103–2120.e9. [Google Scholar] [CrossRef]
  29. Qiu, J.; Ni, L.; Xia, X.; Chen, S.; Zhang, Y.; Lang, M.; Li, M.; Liu, B.; Pan, Y.; Li, J.; et al. Genome-Wide Analysis of the Protein Phosphatase 2C Genes in Tomato. Genes 2022, 13, 604. [Google Scholar] [CrossRef]
  30. Nguyen, M.; Sabry, R.; Davis, O.S.; Favetta, L.A. Effects of BPA, BPS, and BPF on Oxidative Stress and Antioxidant Enzyme Expression in Bovine Oocytes and Spermatozoa. Genes 2022, 13, 142. [Google Scholar] [CrossRef]
  31. Guan, G.; Cannon, R.D.; Coates, D.E.; Mei, L. Effect of the Rho-Kinase/ROCK Signaling Pathway on Cytoskeleton Components. Genes 2023, 14, 272. [Google Scholar] [CrossRef] [PubMed]
  32. Zavala, E.I.; Thomas, J.T.; Sturk-Andreaggi, K.; Daniels-Higginbotham, J.; Meyers, K.K.; Barrit-Ross, S.; Aximu-Petri, A.; Richter, J.; Nickel, B.; Berg, G.E.; et al. Ancient DNA Methods Improve Forensic DNA Profiling of Korean War and World War II Unknowns. Genes 2022, 13, 129. [Google Scholar] [CrossRef] [PubMed]
  33. Alves, R.D.; Eijken, M.; van de Peppel, J.; van Leeuwen, J.P. Calcifying vascular smooth muscle cells and osteoblasts: Independent cell types exhibiting extracellular matrix and biomineralization-related mimicries. BMC Genom. 2014, 15, 965. [Google Scholar] [CrossRef] [PubMed]
  34. Bruedigam, C.; Leeuwen, J.; Peppel, J.V. Gene Expression Analyses in Models of Rosiglitazone-Induced Physiological and Pathological Mineralization Identify Novel Targets to Improve Bone and Vascular Health. Cells 2023, 12, 2462. [Google Scholar] [CrossRef]
  35. Bozoky, B.; Szekely, L.; Ernberg, I.; Savchenko, A. AtlasGrabber: A software facilitating the high throughput analysis of the human protein atlas online database. BMC Bioinform. 2022, 23, 546. [Google Scholar] [CrossRef]
  36. Zhao, P.; Zhen, H.; Zhao, H.; Huang, Y.; Cao, B. Identification of hub genes and potential molecular mechanisms related to radiotherapy sensitivity in rectal cancer based on multiple datasets. J. Transl. Med. 2023, 21, 176. [Google Scholar] [CrossRef]
  37. Zhong, H.; Shi, Q.; Wen, Q.; Chen, J.; Li, X.; Ruan, R.; Zeng, S.; Dai, X.; Xiong, J.; Li, L.; et al. Pan-cancer analysis reveals potential of FAM110A as a prognostic and immunological biomarker in human cancer. Front. Immunol. 2023, 14, 1058627. [Google Scholar] [CrossRef]
  38. Hochmann, S.; Ou, K.; Poupardin, R.; Mittermeir, M.; Textor, M.; Ali, S.; Wolf, M.; Ellinghaus, A.; Jacobi, D.; Elmiger, J.A.J.; et al. The enhancer landscape predetermines the skeletal regeneration capacity of stromal cells. Sci. Transl. Med. 2023, 15, eabm7477. [Google Scholar] [CrossRef]
  39. Tsukasaki, M.; Takayanagi, H. Osteoimmunology: Evolving concepts in bone-immune interactions in health and disease. Nat. Rev. Immunol. 2019, 19, 626–642. [Google Scholar] [CrossRef]
  40. Mo, C.; Guo, J.; Qin, J.; Zhang, X.; Sun, Y.; Wei, H.; Cao, D.; Zhang, Y.; Zhao, C.; Xiong, Y.; et al. Single-cell transcriptomics of LepR-positive skeletal cells reveals heterogeneous stress-dependent stem and progenitor pools. EMBO J. 2022, 41, e108415. [Google Scholar] [CrossRef]
  41. Guo, Y.; Jia, X.; Cui, Y.; Song, Y.; Wang, S.; Geng, Y.; Li, R.; Gao, W.; Fu, D. Sirt3-mediated mitophagy regulates AGEs-induced BMSCs senescence and senile osteoporosis. Redox Biol. 2021, 41, 101915. [Google Scholar] [CrossRef] [PubMed]
  42. Jiao, D.; Zheng, A.; Liu, Y.; Zhang, X.; Wang, X.; Wu, J.; She, W.; Lv, K.; Cao, L.; Jiang, X. Bidirectional differentiation of BMSCs induced by a biomimetic procallus based on a gelatin-reduced graphene oxide reinforced hydrogel for rapid bone regeneration. Bioact. Mater. 2021, 6, 2011–2028. [Google Scholar] [CrossRef] [PubMed]
  43. Zhang, P.; Dong, J.; Fan, X.; Yong, J.; Yang, M.; Liu, Y.; Zhang, X.; Lv, L.; Wen, L.; Qiao, J.; et al. Characterization of mesenchymal stem cells in human fetal bone marrow by single-cell transcriptomic and functional analysis. Signal Transduct. Target. Ther. 2023, 8, 126. [Google Scholar] [CrossRef]
  44. Cui, J.; Shibata, Y.; Zhu, T.; Zhou, J.; Zhang, J. Osteocytes in bone aging: Advances, challenges, and future perspectives. Ageing Res. Rev. 2022, 77, 101608. [Google Scholar] [CrossRef]
  45. Delgado-Calle, J.; Bellido, T. The osteocyte as a signaling cell. Physiol. Rev. 2022, 102, 379–410. [Google Scholar] [CrossRef]
  46. Sjöstedt, E.; Zhong, W.; Fagerberg, L.; Karlsson, M.; Mitsios, N.; Adori, C.; Oksvold, P.; Edfors, F.; Limiszewska, A.; Hikmet, F.; et al. An atlas of the protein-coding genes in the human, pig, and mouse brain. Science 2020, 367, eaay5947. [Google Scholar] [CrossRef]
  47. Alves, L.N.R.; Meira, D.D.; Merigueti, L.P.; Casotti, M.C.; Ventorim, D.D.P.; Almeida, J.F.F.; de Sousa, V.P.; Sant’ana, M.C.; da Cruz, R.G.C.; Louro, L.S.; et al. Biomarkers in Breast Cancer: An Old Story with a New End. Genes 2023, 14, 1364. [Google Scholar] [CrossRef]
  48. Marie, P.J.; Fromigué, O. Osteogenic differentiation of human marrow-derived mesenchymal stem cells. Regen. Med. 2006, 1, 539–548. [Google Scholar] [CrossRef]
  49. Mollentze, J.; Durandt, C.; Pepper, M.S. An In Vitro and In Vivo Comparison of Osteogenic Differentiation of Human Mesenchymal Stromal/Stem Cells. Stem Cells Int. 2021, 2021, 9919361. [Google Scholar] [CrossRef]
  50. Nantavisai, S.; Pisitkun, T.; Osathanon, T.; Pavasant, P.; Kalpravidh, C.; Dhitavat, S.; Makjaroen, J.; Sawangmake, C. Systems biology analysis of osteogenic differentiation behavior by canine mesenchymal stem cells derived from bone marrow and dental pul. Sci. Rep. 2020, 10, 20703. [Google Scholar] [CrossRef]
  51. Zha, K.; Tian, Y.; Panayi, A.C.; Mi, B.; Liu, G. Recent Advances in Enhancement Strategies for Osteogenic Differentiation of Mesenchymal Stem Cells in Bone Tissue Engineering. Front. Cell Dev. Biol. 2022, 10, 824812. [Google Scholar] [CrossRef] [PubMed]
  52. Zhao, L.; Liu, S.; Peng, Y.; Zhang, J. Lamc1 promotes osteogenic differentiation and inhibits adipogenic differentiation of bone marrow-derived mesenchymal stem cells. Sci. Rep. 2024, 14, 19592. [Google Scholar] [CrossRef] [PubMed]
  53. Cherubini, A.; Barilani, M.; Rossi, R.L.; Jalal, M.M.K.; Rusconi, F.; Buono, G.; Ragni, E.; Cantarella, G.; Simpson, H.A.R.W.; Péault, B.; et al. FOXP1 circular RNA sustains mesenchymal stem cell identity via microRNA inhibition. Nucleic Acids Res. 2019, 47, 5325–5340. [Google Scholar] [CrossRef]
  54. Tu, W.; Zhu, S.; Li, F.; Xu, C.; Tu, W.; Chen, Y. A novel link between melatonin and circ_0005753/PTBP1/TXNIP regulatory network in the modulation of osteogenic potential in mesenchymal stem cells. Chem. Biol. Drug Des. 2024, 103, e14380. [Google Scholar] [CrossRef]
  55. Fujie, A.; Funayama, A.; Miyauchi, Y.; Sato, Y.; Kobayashi, T.; Kanagawa, H.; Katsuyama, E.; Hao, W.; Tando, T.; Watanabe, R.; et al. Bcl6 promotes osteoblastogenesis through Stat1 inhibition. Biochem. Biophys. Res. Commun. 2015, 457, 451–456. [Google Scholar] [CrossRef] [PubMed]
  56. Diesel, L.F.D.C.; Dos Santos, B.P.; Bellagamba, B.C.; Neto, A.S.P.; Ely, P.B.; Meirelles, L.D.S.; Nardi, N.B.; Camassola, M. Stability of Reference Genes during Tri-Lineage Differentiation of Human Adipose-Derived Stromal Cells. J. Stem Cells 2015, 10, 225–242. [Google Scholar]
  57. Pfeffer, G.; Lee, G.; Pontifex, C.S.; Fanganiello, R.D.; Peck, A.; Weihl, C.C.; Kimonis, V. Multisystem Proteinopathy Due to VCP Mutations: A Review of Clinical Heterogeneity and Genetic Diagnosis. Genes 2022, 13, 963. [Google Scholar] [CrossRef]
  58. Yang, M.; Miao, Y.-R.; Xie, G.-Y.; Luo, M.; Hu, H.; Kwok, H.F.; Feng, J.; Guo, A.-Y. ICBatlas: A Comprehensive Resource for Depicting Immune Checkpoint Blockade Therapy Characteristics from Transcriptome Profiles. Cancer Immunol. Res. 2022, 10, 1398–1406. [Google Scholar] [CrossRef]
  59. Ma, Q.; Xu, D. Deep learning shapes single-cell data analysis. Nat. Rev. Mol. Cell Biol. 2022, 23, 303–304. [Google Scholar] [CrossRef]
  60. Castiglioni, S.; Di Fede, E.; Bernardelli, C.; Lettieri, A.; Parodi, C.; Grazioli, P.; Colombo, E.A.; Ancona, S.; Milani, D.; Ottaviano, E.; et al. KMT2A: Umbrella Gene for Multiple Diseases. Genes 2022, 13, 514. [Google Scholar] [CrossRef]
  61. Gao, Y.; Chi, Y.; Chen, Y.; Wang, W.; Li, H.; Zheng, W.; Zhu, P.; An, J.; Duan, Y.; Sun, T.; et al. Multi-omics analysis of human mesenchymal stem cells shows cell aging that alters immunomodulatory activity through the downregulation of PD-L1. Nat. Commun. 2023, 14, 4373. [Google Scholar] [CrossRef] [PubMed]
  62. Wu, J.; He, S.; Song, Z.; Chen, S.; Lin, X.; Sun, H.; Zhou, P.; Peng, Q.; Du, S.; Zheng, S.; et al. Macrophage polarization states in atherosclerosis. Front. Immunol. 2023, 14, 1185587. [Google Scholar] [CrossRef] [PubMed]
  63. Ben-Dror, J.; Shalamov, M.; Sonnenblick, A. The History of Early Breast Cancer Treatment. Genes 2022, 13, 960. [Google Scholar] [CrossRef]
  64. Deng, C.; Dong, K.; Liu, Y.; Chen, K.; Min, C.; Cao, Z.; Wu, P.; Luo, G.; Cheng, G.; Qing, L.; et al. Hypoxic mesenchymal stem cell-derived exosomes promote the survival of skin flaps after ischaemia-reperfusion injury via mTOR/ULK1/FUNDC1 pathways. J. Nanobiotechnol. 2023, 21, 340. [Google Scholar] [CrossRef] [PubMed]
Figure 1. Two batches of microarray datasets related to long-term osteogenic induction were analyzed to identify DEGs. (A) Venn diagrams illustrating the intersection of differentially expressed genes (DEGs) between the two microarray datasets. The left panel represents the down-regulated genes, while the right panel represents the up-regulated genes in GSE28205 and GSE37558. The DEGs were identified using thresholds of false discovery rate (FDR) ≤ 0.25 and p-value ≤ 0.05. (B) A heatmap was utilized to visualize the DEGs between the two batches of datasets. (C) The volcano plot in panel C presents the information on the DEGs with a cutoff value of log2(fold change) ≥ 1.5.
Genes 15 01568 g001
Figure 2. Refinement of time-dependent osteogenic induction in MSCs through the analysis of microarray dataset GSE37558. (A) A Venn diagram was generated to illustrate the overlap of DEGs across three time points during osteogenic induction in the GSE37558 dataset. The left panel represents the down-regulated genes, while the right panel represents the up-regulated genes. The DEGs were identified based on thresholds of false discovery rate (FDR) ≤ 0.25 and p-value ≤ 0.05. (B) The DEGs among the three different osteogenic induction time points in the GSE37558 dataset were visualized using a heatmap. (C) The volcano plot in panel C presents the information on the DEGs with a cutoff value of log2(fold change) ≥ 1.5.
Genes 15 01568 g002
Figure 3. Recombining DEGs to enhance the screening and identification of key regulatory molecules. (A,B) Venn diagram showing the intersection of DEGs across time points and microarray datasets from various batches; (C,D) Detailed view of the coexpression network of DEGs, highlighting key genes.
Genes 15 01568 g003
Figure 4. Characterization and multipotent differentiation capacity of mouse bone marrow mesenchymal stem cells (mBMSCs). (A) The flow cytometry analysis of the expression of positive (CD90, CD73, and CD105) and negative (CD34 and CD117) markers of mBMSCs. (B) Alizarin Red S staining for mBMSCs culturing for 21 days in osteogenic medium or basal medium. (C) Oil Red O staining for mBMSCs culturing for 14 days in adipogenic medium or basal medium. (D) Alcian blue staining for mBMSCs culturing for 28 days in chondrogenic medium or basal medium with the method of micromass. Scale bar: 100 μm. All the data are presented as the means ± SEMs. Statistical significance was determined using one-way ANOVA followed by Scheffe’s post hoc test. All the cell experiments were repeated independently in triplicate.
Genes 15 01568 g004
Figure 5. Elucidating the molecular mechanisms governing dynamic osteogenic induction in MSCs through the overexpression of four candidate genes using lentiviral packaging technology. (A) ALP and ARS were performed to evaluate the osteogenic differentiation of BMSCs at 1, 7, 14, and 21 days. Scale bar: 100 μm. (B) A qRT–PCR analysis was conducted to assess the mRNA expression levels of osteogenic markers (ALP, BGLAP, and RUNX2) at 1, 7, 14, and 21 days. (B) A qRT–PCR analysis was conducted to assess the mRNA expression levels of osteogenic markers (ALP, BGLAP, and RUNX2) at 1, 7, 14, and 21 days. (C) The temporal expression of BCL6 and TTPAL mRNA during the osteogenic induction period was analyzed at 1, 7, 14, and 21 days via qRT–PCR. (D) The temporal expression of PTBP1 and H2AFZ mRNA during the osteogenic induction period was analyzed at 1, 7, 14, and 21 days via qRT–PCR. The experiments were performed in triplicate using cells isolated from three separate 2-month-old wild-type C57BL/6J mice. Each replicate was derived from a different mouse. All the data are presented as the means ± SEMs. Statistical significance was determined using one-way ANOVA followed by Scheffe’s post hoc test. * p < 0.05; ** p < 0.01. All the cell experiments were repeated independently in triplicate.
Genes 15 01568 g005
Figure 6. Molecular functions involved in the dynamic regulation of osteogenic induction through the lentiviral-mediated overexpression of four candidate genes. (A) Overexpression efficacy measured by qRT–PCR; (B) the overexpression of BCL6 and TTPAL affects the osteogenic phenotype of BMSCs, as detected by an ARS assay; (C) the overexpression of PTBP1 and H2AFZ alters the osteogenic phenotype of BMSCs, as detected by an ARS assay; (D) flow cytometry analysis showing the effects of PTBP1 and H2AFZ overexpression on apoptosis. Each replicate was derived from a different mouse. All the data are presented as the means ± SEMs. Statistical significance was determined using one-way ANOVA followed by Scheffe’s post hoc test. *** p < 0.001. All the cell experiments were repeated independently in triplicate.
Genes 15 01568 g006
Table 1. Studied gene candidates expressed in blood and immune tissues.
Gene NameBlood and Immune SystemProtein Expressed in the Database of the HUMAN PROTEIN ALTAS
Bone MarrowLymph NodeTonsilSpleen
CXCL12HighLowLowLowBone marrow poietic cells showed strong nuclear positivity.
PTBP1HighHighHighMediumMost normal tissues displayed strong nuclear positivity.
PKM2LowHighHighHighCytoplasmic expression in most tissues, hepatocytes, neurons, and most soft tissues was negative.
H2AFZHighHighMediumHighUbiquitous nuclear expression.
NUDT1MediumHighHighMediumMost normal tissues showed moderate to strong cytoplasmic staining.
ANGPT1HighMediumMediumMediumUbiquitous cytoplasmic expression.
PPAGRLowNot detectedHighLowSquamous epithelia, glandular cells in the gastrointestinal tract, gall bladder, urinary bladder, placenta, and epididymis showed moderate to strong nuclear positivity.
MMEMediumLowMediumHighB-lymphocytes, myoepithelium, stromal cells, and some glandular epithelia displayed strong cytoplasmic positivity.
RPS6KA2MediumLowHighMediumMost of the normal tissues displayed moderate nuclear and cytoplasmic positivity.
TTPALMediumHighHighHighMost normal tissues displayed moderate to strong cytoplasmic staining with a granular pattern.
BCL6HighHighHighMediumNuclear expression, mainly in lymphoid tissues.
CTNNB1LowNot detectedHighNot detectedMembranous expression was observed in most tissues.
STAT5AMediumHighHighLowCytoplasmic and nuclear expression in a few tissues, most abundant in subsets of lymphoid cells.
Disclaimer/Publisher’s Note: The statements, opinions and data contained in all publications are solely those of the individual author(s) and contributor(s) and not of MDPI and/or the editor(s). MDPI and/or the editor(s) disclaim responsibility for any injury to people or property resulting from any ideas, methods, instructions or products referred to in the content.

