1. Introduction
The occurrence of diseases is often related to abnormal gene expression, which can be influenced by various factors including genetic variants, interactions with other genes, the regulatory roles of transcription factors, and epigenetic modifications such as DNA methylation and histone acetylation [
1,
2]. Enhancers and promoters are cis-regulatory elements involved in gene expression [
3,
4], both being sequences of DNA. Enhancers play a promoting role in gene expression by influencing the expression levels of target genes, typically located tens of kilobases (kb) away from these genes [
5,
6,
7]. Promoters act as the “switch” for gene expression, determining the initiation site for transcription and usually located just 1–2 kb from the target gene [
3,
8]. Enhancers exert their function by interacting with promoters, thereby increasing gene expression [
3,
9]. Although enhancers and their target promoters or genes are often distantly situated, their interaction (enhancer–promoter interaction, EPI) generally requires physical proximity or even contact [
10,
11]. The regulatory relationship between enhancers and target promoters is diverse and can typically be categorized into three modes: “many-to-one”, “one-to-many” and “many-to-many” [
12]. Furthermore, gene expression exhibits tissue specificity, as different tissues possess distinct functions and structures, which is rooted in the tissue-specific regulation of gene expression. Consequently, the interactions between enhancers and promoters in different tissues also display significant tissue specificity [
13,
14].
From a methodological perspective, EPI prediction can be broadly classified into statistical methods, machine learning methods, and deep learning approaches. Traditional statistical methods often use distance, correlation, expression quantitative trait loci (eQTL), and chromatin interaction data, relying on simple mathematical models and prior assumptions [
15,
16,
17]. Correlation-based methods are influenced by feature selection and the correlation algorithms used, and are sensitive to outliers, such as GeneHancer [
18]. CT-FOCS [
19] predicts EPIs that are active in only a few cell types using a linear mixed-effects model (LMM). EpiTensor [
20] is a tensor decomposition-based model designed to infer three-dimensional genomic relationships from one-dimensional epigenomic data. These methods are advantageous due to their strong interpretability, low computational resource demands, and suitability for small datasets or limited-resource settings. However, they are limited by their reliance on simplified assumptions (like linear relationships and normal distributions), making it difficult to capture complex nonlinear features, and they generally perform worse than deep learning on large datasets.
Early machine learning approaches for EPI prediction, such as TargetFinder [
21] and kmer-SVM [
22], predicted using genomic signals and DNA sequence k-mer frequencies, but faced challenges in feature acquisition and generalization. 3DPredictor [
23] defined EP interactions using quantified 3D interaction frequencies, providing a different perspective from traditional anchor-based methods. EP2vec [
24] embedded DNA sequences using doc2vec and combined this with gradient boosting regression trees (GBRTs) for prediction, automatically learning features and capturing long-range dependencies. However, performance heavily depended on the choice of k values and the number of features. Compared to these methods, deep learning approaches can automatically extract complex nonlinear features without relying on feature selection.
Deep learning methods such as EPIANN [
25], SPEID [
26], SIMCNN [
27], EPI-DLMH [
28], ChINN [
29], and EPI-trans [
30] employ convolutional neural networks (CNNs), recurrent neural networks (RNNs), or Transformers to extract DNA sequence features. While these methods excel at feature extraction, they still primarily rely on sequence information. Studies have shown that local epigenomic features can provide richer information than sequences alone [
31,
32]. For example, DeepTACT [
33] combines sequence information with chromatin accessibility data. However, many methods still neglect genomic signals from adjacent regions. In contrast, TransEPI [
34] improves prediction accuracy by leveraging extensive genomic signals, though this approach may introduce feature redundancy and elevate computational demands. Issues with these methods include (1) the random division of datasets, leading to the same enhancers or promoters appearing in both training and testing sets, potentially overestimating model performance, as seen in TargetFinder, EPIANN, SPEID, SIMCNN, and ChINN; (2) unbalanced datasets leading to models biased towards predicting the majority class, i.e., negative samples, which may overlook the identification of truly interacting enhancer–promoter pairs, as in TransEPI and DeepTACT or over-sampling to increase the number of positive samples, as in EPI-DLMH and EPI-trans; and (3) traditional methods often simplify enhancer–promoter interactions into one-to-one relationships, but overlook the potential complex network relationships, such as multiple enhancers regulating the same promoter (or vice versa), thus failing to fully reflect their potential interactions and regulatory mechanisms.
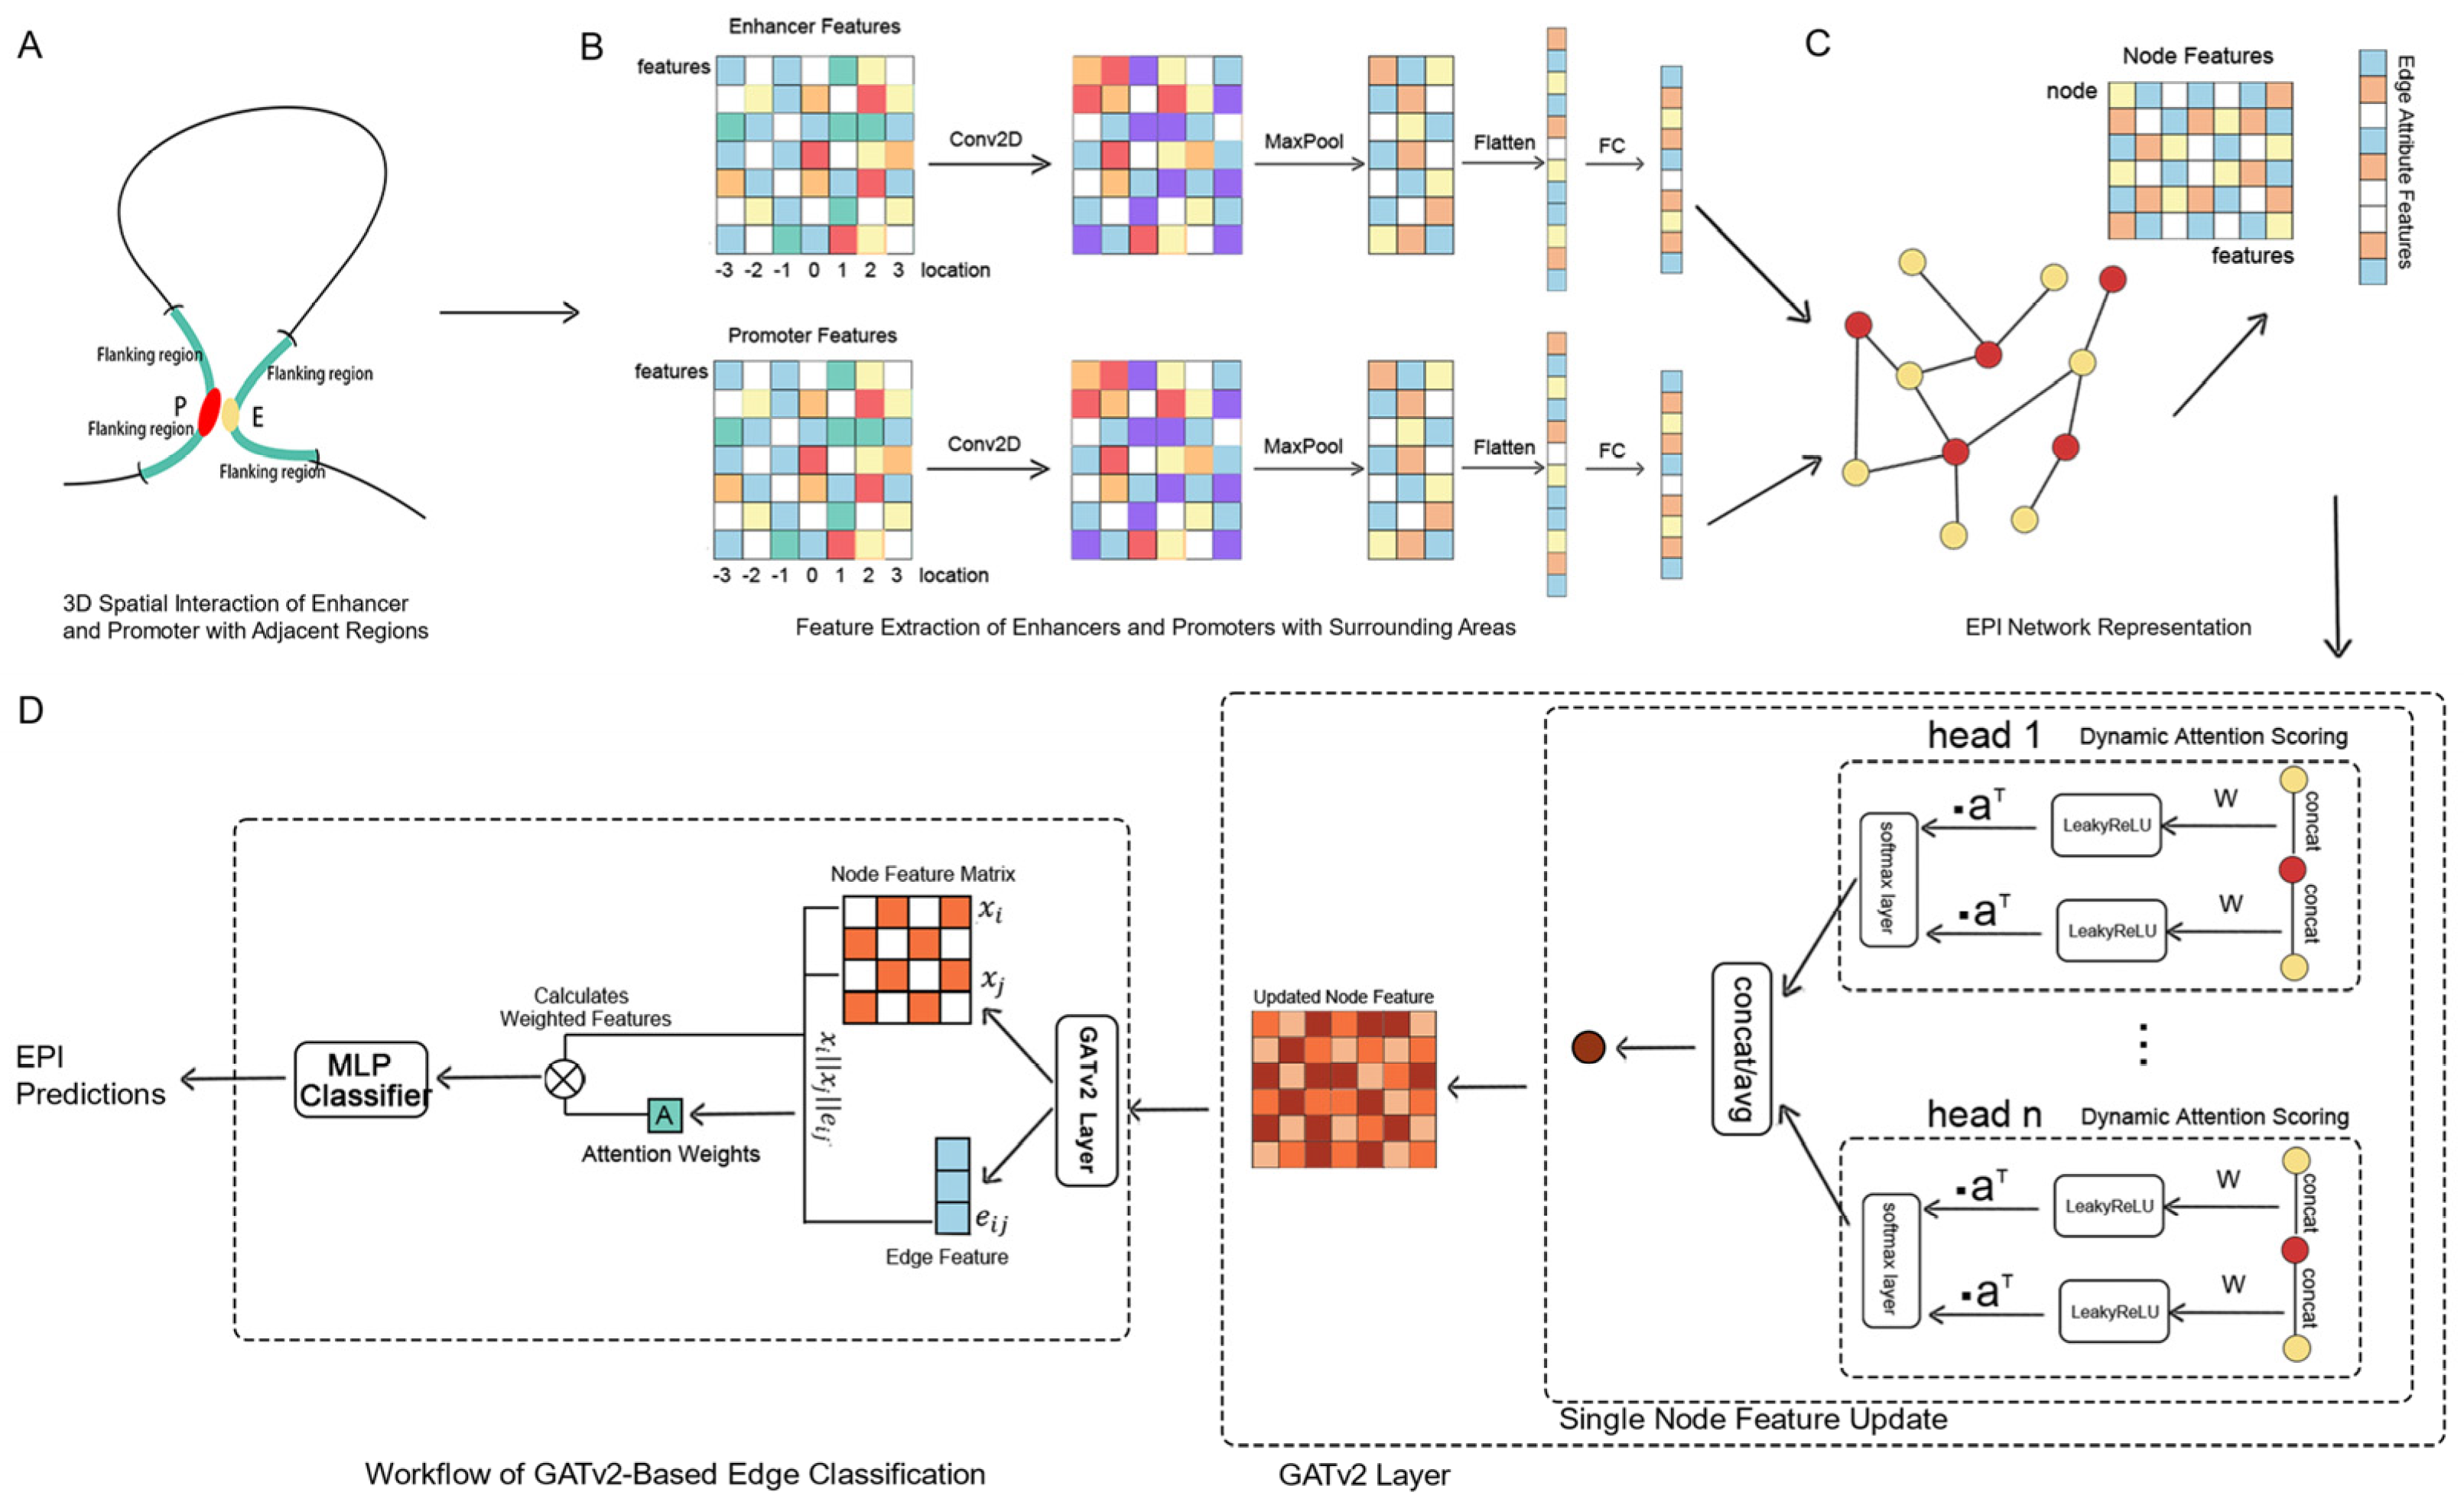
Addressing the limitations of traditional EPI prediction methods, such as the inadequate consideration of one-to-many and many-to-many interaction modes, the selection of feature sets, and the rational division of datasets, we propose a novel predictive framework, GATv2EPI. This framework innovatively constructs a graph structure that includes enhancers, promoters, and their interrelationships, and utilizes convolutional neural networks (CNNs) along with dynamic graph attention networks (GATv2) [
35] to deeply explore the complex regulatory relationships between enhancers and promoters. This approach comprehensively considers all interaction modes within EPI, emphasizing their importance in the regulation of gene expression. In terms of feature selection, GATv2EPI integrates various epigenetic features from enhancers, promoters, and their flanking regions, achieving an effective balance between feature richness and computational complexity. For dataset partitioning, GATv2EPI adopts a strategy based on graph connectivity, constructing datasets by sampling connected subgraphs from each chromosome. This method effectively prevents information leakage between training and testing sets and ensures consistent data distribution across different datasets. Overall, GATv2EPI provides a robust, network-based framework for predicting interactions between enhancers and promoters, enhancing prediction accuracy by capturing complex interaction modes such as one-to-many and many-to-many. This model offers deeper insights into the regulatory mechanisms underlying enhancer–promoter interactions.
3. Results
3.1. Assessment of EPI Prediction by GATv2EPI
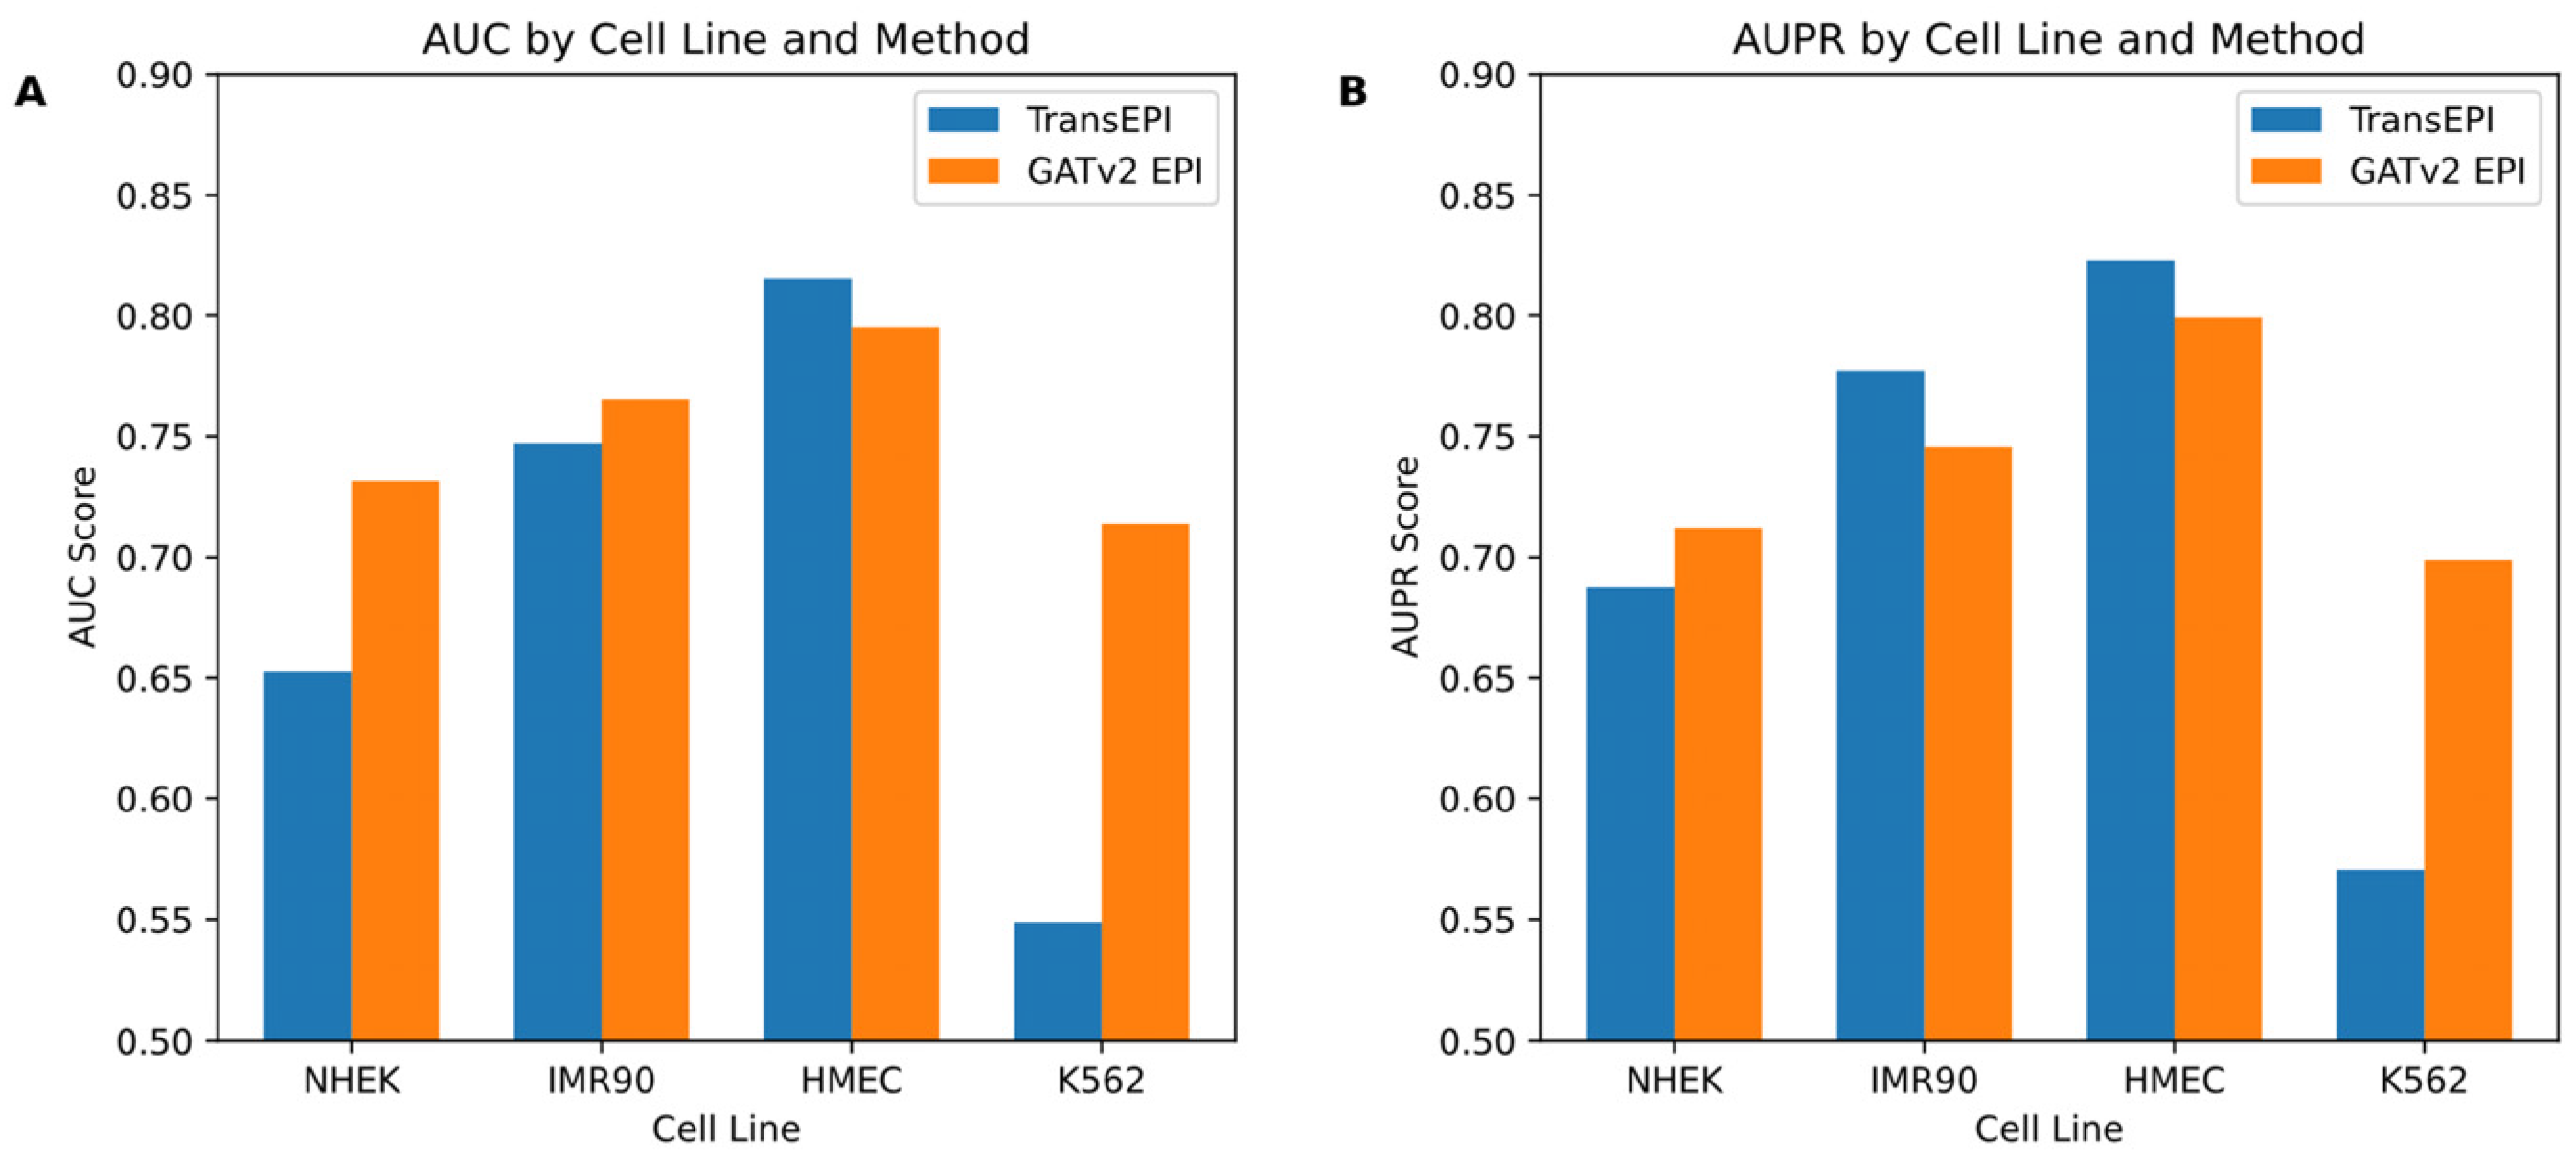
In this study, we initially assessed the efficacy of the GATv2EPI model compared to the TransEPI model in predicting enhancer–promoter interactions (EPIs) across various cell lines (NHEK, IMR90, HMEC, and K562). As shown in
Figure 2, the results for TransEPI were obtained from the average of five-fold cross-validation based on multiple experiments, whereas the results for GATv2EPI were derived from the final experimental outcome. By evaluating the models using two widely recognized metrics—the Area Under the Curve (AUC) and the Area Under the Precision–Recall Curve (AUPR)—we observed that GATv2EPI consistently outperformed TransEPI, especially showing significant advantages in the K562 cell line, which is commonly associated with leukemia. These observations suggest that GATv2EPI may offer higher sensitivity and accuracy in processing data related to disease-specific cells.
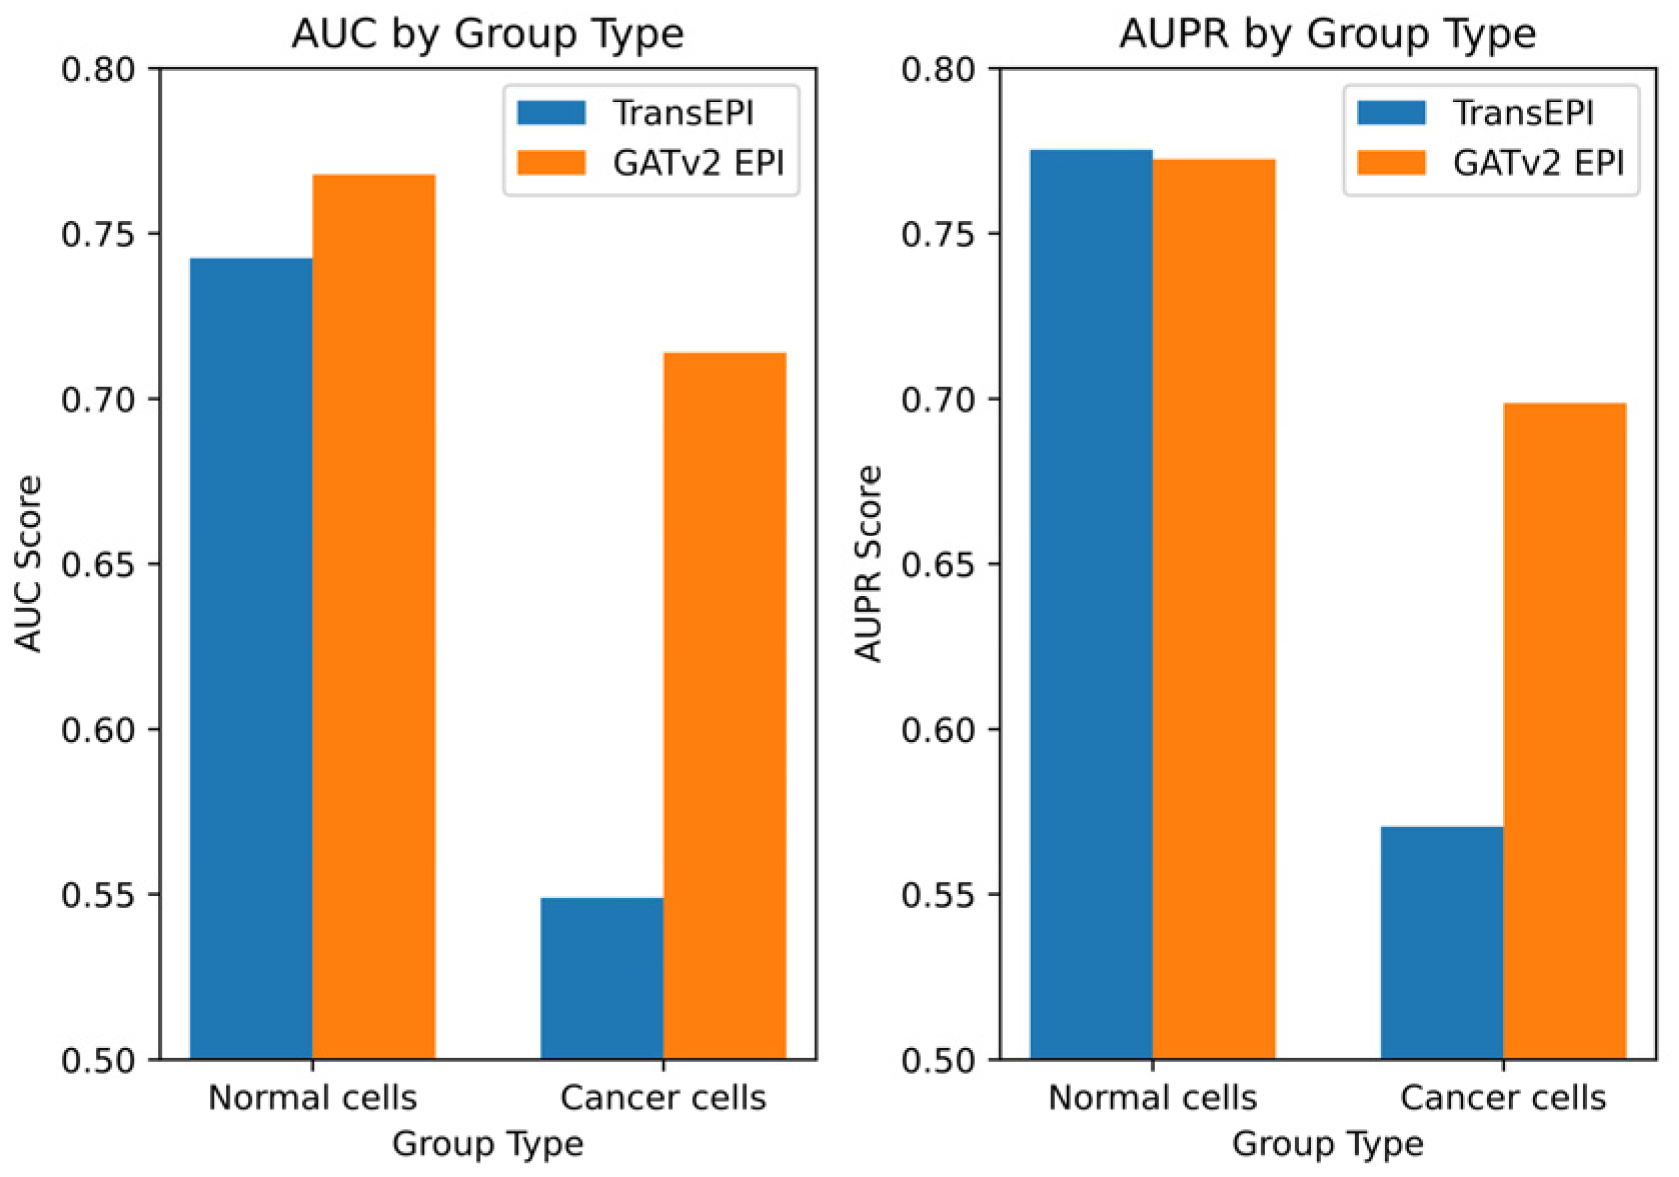
Building on these initial results, we designed a further experiment to explore the differential performance of GATv2EPI between normal cells and cancer cells. We categorized data from the HMEC, IMR90, and NHEK cell lines as ‘normal cells’ and data from the K562 cell line as ‘cancer cells’, establishing two distinct EPI prediction models. The dataset for the normal cells comprised 7053 positive samples and 7459 negative samples, while the dataset for the cancer cells contained 2350 positive and 2381 negative samples. This categorization enabled targeted predictive testing on both datasets, with the results depicted in
Figure 3.
From these tests, GATv2EPI demonstrated superior performance over TransEPI in terms of AUC in both cell groups. Regarding AUPR, GATv2EPI’s performance equaled that of TransEPI in the normal cell group but was significantly better in the cancer cell group. Particularly for data related to diseases, the enhanced performance of GATv2EPI highlights its robust adaptability and potential in managing complex disease states. These findings not only confirm the effectiveness of GATv2EPI but also underscore its unique advantages in data processing under disease conditions.
In conclusion, although the performance differences between GATv2EPI and TransEPI were minimal in normal cells, the distinct superiority of GATv2EPI in cancer cells underscores its broader application prospects and potential value in disease data processing. Future research could further investigate the performance of GATv2EPI across a broader array of disease datasets, thereby confirming its suitability across various disease contexts.
3.2. Training Time of GATv2EPI Model
In this study, we significantly improved the training efficiency of the GATv2EPI model by partitioning subgraphs according to chromosomes and parallel training on different subgraphs while sharing model parameters. Experiments were conducted on a Linux server equipped with an Intel Xeon Gold 6326 CPU, two NVIDIA A100 GPUs (each with 80GB of VRAM), and 1.0 TB of memory. The deep learning framework used was PyTorch 1.10.1 + cu111, which supports CUDA 11.2 and driver version 460.106.00, with the code written in Python 3.9.17. Due to the shared nature of the server’s VRAM resources, the batch size for the TransEPI model was limited to 64. In contrast, the GATv2EPI model utilized a strategy of subgraph partitioning by chromosome, setting its geometric batch size to 1, allowing for more flexible VRAM usage and effectively preventing out-of-memory issues. Both models were trained for 200 epochs on the same dataset, which included 14,512 normal cell samples and 4731 K562 disease cell samples. As shown in
Table 2, the training time for TransEPI on the K562 dataset was 396.57 s, whereas GATv2EPI required only 44.24 s. On the normal cell dataset, TransEPI took 1001.41 s to train, while GATv2EPI only needed 47.18 s. These data underscore the efficiency and speed advantages of GATv2EPI when handling large-scale and complex graph-structured data.
Several factors contribute to the faster training speed of our model. First, there are differences in the range and dimensionality of feature extraction. TransEPI extracts features from a 2.5 Mbp range, comprising 5000 bins, each containing eight dimensions of features, resulting in a large total feature count. In contrast, GATv2EPI extracts features from a 40 kb range, consisting of 21 bins with seven dimensions each. This significant reduction in feature count greatly diminishes computational complexity, thereby enhancing training efficiency. Secondly, the model architectures differ substantially. TransEPI combines CNN and Transformer structures, while GATv2EPI is based on CNN and graph attention networks (GATv2). The GATv2 model is designed with consideration for the sparsity of graph data, demonstrating greater efficiency and accuracy in handling sparse graph data compared to the large matrix operations required by Transformer models. Transformer models process sequence data using global self-attention mechanisms, which involve considerable computation and memory consumption; in contrast, GATv2 focuses local attention on neighboring nodes, significantly reducing computational complexity and optimizing resource usage. Furthermore, our training strategy of partitioning subgraphs by chromosome not only saves VRAM but also accelerates training speed. By dividing large-scale graphs into multiple subgraphs and training each independently, we can more efficiently utilize GPU resources. In comparison, TransEPI’s training time is prolonged due to its limited batch size imposed by VRAM constraints. Consequently, GATv2EPI exhibits superior performance in terms of computational time and resource consumption.
3.3. Key Signal Regions of Promoters and Enhancers
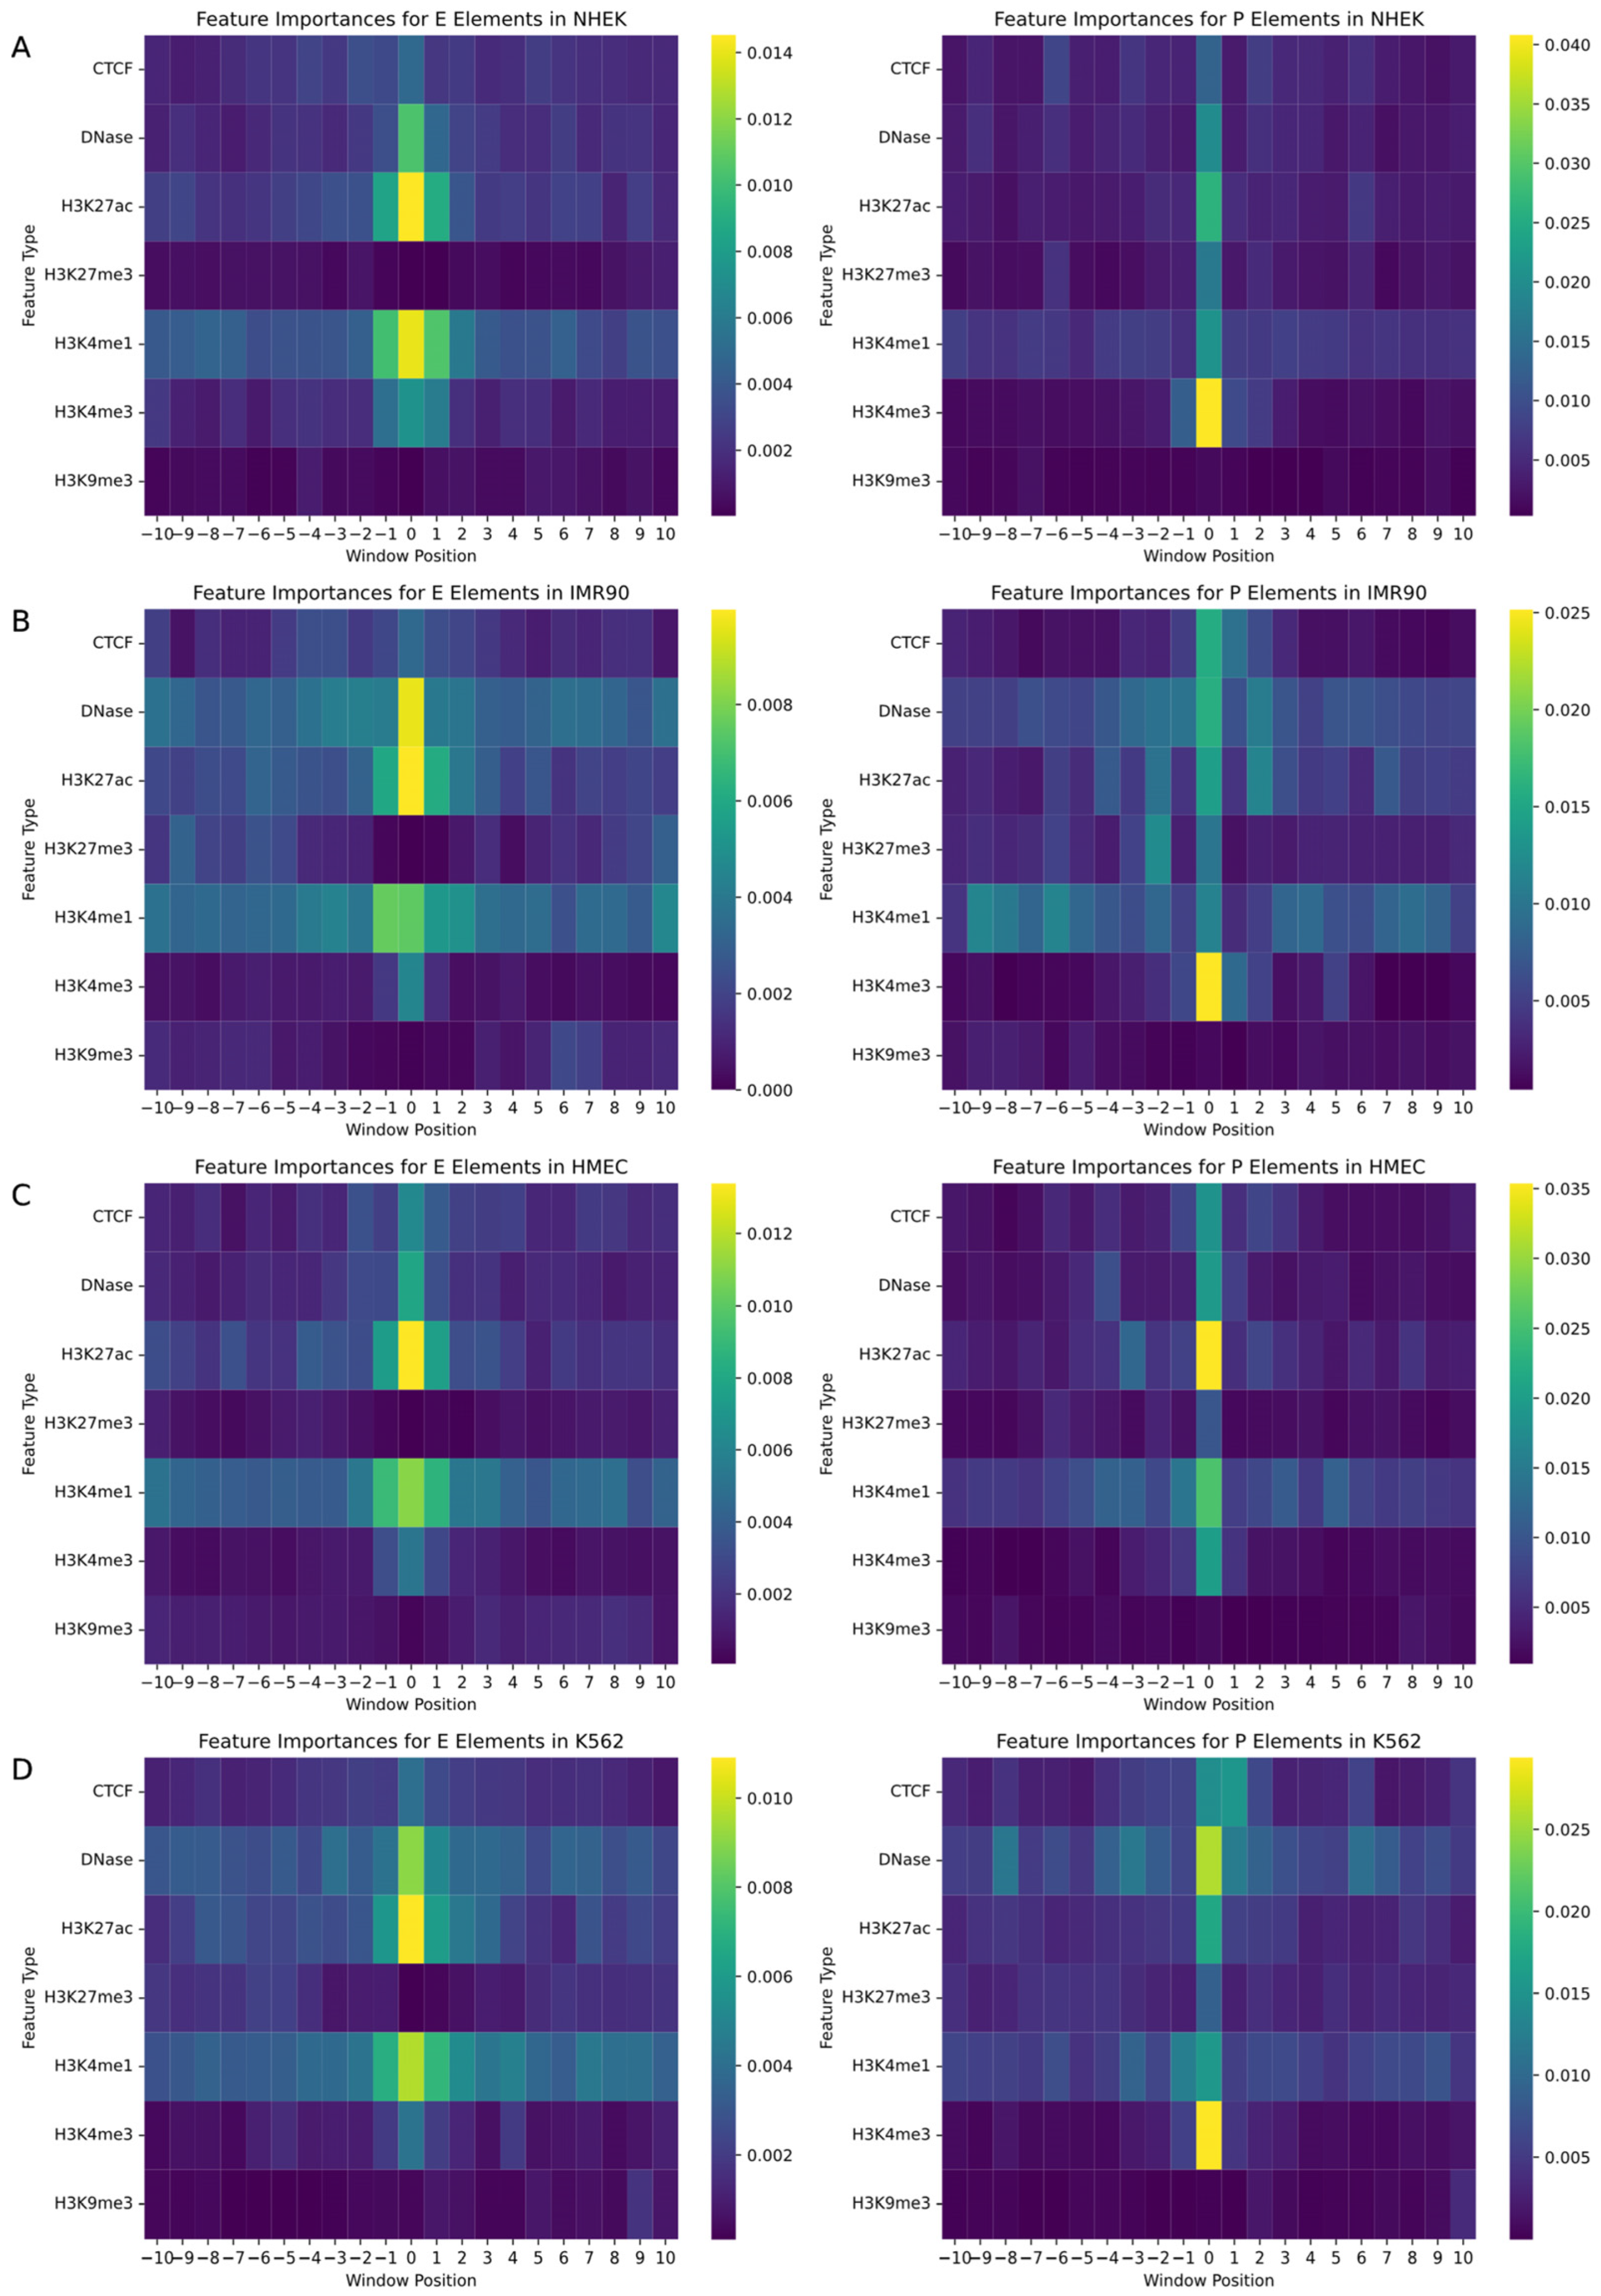
In the study of gene regulatory networks, accurately understanding the biological features and their specific locations within the genome is crucial for predicting interactions between enhancers and promoters. This research employed a random forest model to quantify feature importance, aiming to identify decisive biomarkers and their positional information in predicting enhancers and promoters. We assessed a variety of biological signals including CTCF, DNase, and various histone modifications such as H3K27ac, with each feature marked within a −10 to +10 window around the enhancer or promoter. The random forest model enabled the generation of two heatmaps for each cell line, mapping the importance of features for both promoters and enhancers, as illustrated in
Figure 4.
The analysis revealed that biomarkers closely associated with the physical locations of enhancers and promoters had the most significant impact on EPI prediction. Particularly, signals located at the central position (window position 0) near enhancers and promoters exhibited the highest feature importance. Additionally, the importance of signals significantly decreased with increasing distance from enhancers or promoters, emphasizing the pivotal role of biomarkers near regulatory regions in predicting gene regulatory events. Histone modifications such as H3K4me3, H3K4me1, H3K27ac, and DNase I hypersensitive sites showed high feature importance across all cell types due to their role in identifying active gene regulatory regions, becoming key features for predicting interactions between enhancers and promoters. Moreover, specific biomarkers like CTCF binding sites were more important in promoter predictions in certain cell lines, while they might not be the most critical feature in enhancer predictions, reflecting functional differences in various regulatory contexts. Although some biomarkers are universally important across all cell lines, the specific degree of importance and the range of positions show significant variability among different cell types. For instance, in HMEC cells, the prominence of H3K27ac near enhancers may exceed that in other cell types, reflecting cell-type-specific gene regulatory mechanisms and expression patterns.
Through these detailed analyses, we not only gained a deeper understanding of the role of specific biomarkers in gene regulatory networks but also revealed the behavioral patterns of these features in different cellular environments. These findings have significant scientific and clinical implications for the precise regulation of gene expression, offering directions for future research and potentially guiding the development of gene therapy and precision medicine.
3.4. Analysis of Differences in Enhancer–Promoter Interactions Among Cell Lines
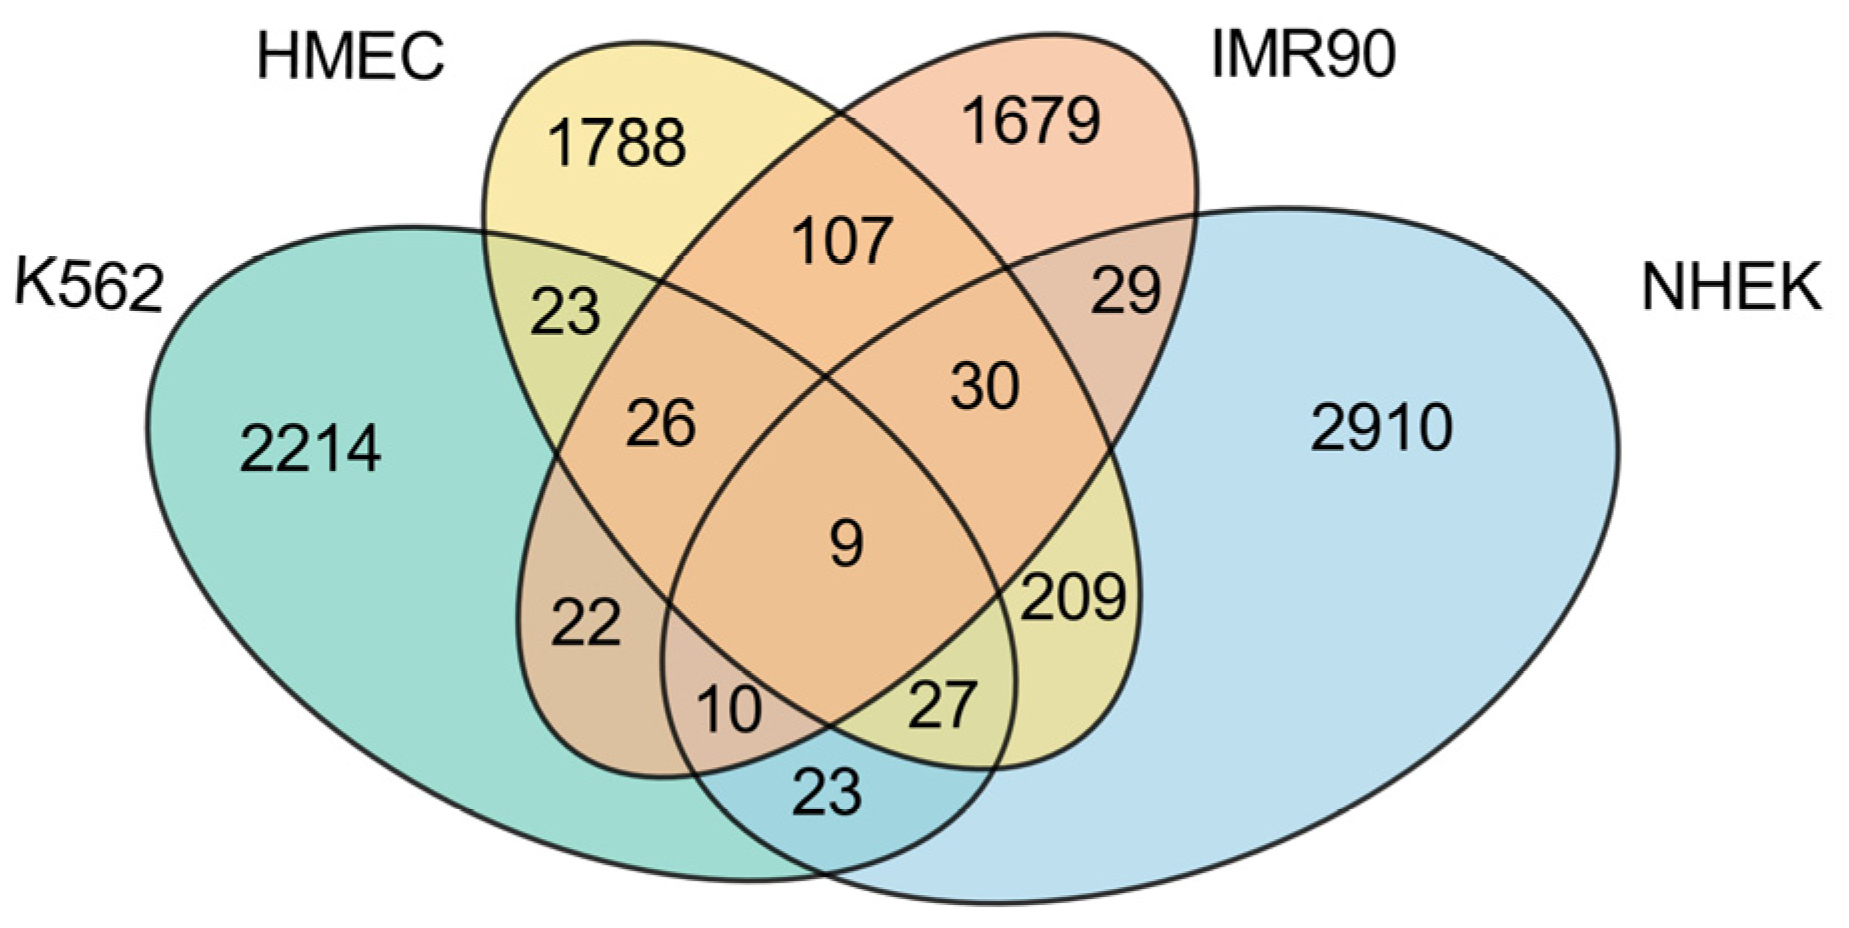
This study conducts a detailed analysis of the intersection of enhancer–promoter interactions (EPIs) across four cell lines (K562, HMEC, IMR90, and NHEK), revealing both commonalities and specificities within the gene regulatory networks of these cell lines, as illustrated in
Figure 5.
First, examining the proportion of cell line-specific EPIs, each cell line exhibits a high level of unique EPIs, with K562 showing the highest proportion at 92.99%, significantly exceeding those of the other normal cell lines. This indicates that the K562 cell line, being a cancer cell line, has a relatively unique regulatory network, likely to support its rapid growth and proliferation. In contrast, the HMEC cell line presents the lowest proportion of unique EPIs at 79.61%, which may reflect a higher degree of commonality in gene regulatory mechanisms with other normal cell lines. The presence of numerous unique EPIs suggests that each cell line possesses its own distinct regulatory network.
While most EPIs display high specificity across the different cell lines, there is also a notable number of shared EPIs. Among the normal cell lines, HMEC, IMR90, and NHEK share a considerable number of EPIs, with HMEC sharing 172 EPIs with IMR90 and 275 EPIs with NHEK, while IMR90 and NHEK share 78 EPIs. These data indicate that there are many similarities in gene regulation among normal cell lines, particularly highlighting HMEC’s significant role in sharing with others, potentially due to similarities in tissue type or physiological function. Conversely, K562 shares relatively fewer EPIs with the normal cell lines, specifically 85 with HMEC, 67 with IMR90, and 69 with NHEK. This suggests a marked difference in gene regulatory mechanisms between the cancer cell line and the normal cell lines. Notably, across all four cell lines, only nine EPIs are commonly shared, as detailed in
Table 3. These shared EPIs may represent fundamental gene regulatory mechanisms that play core roles in all cells, likely closely related to the maintenance of essential biological functions.
In summary, these findings indicate that K562, as a cancer cell line, exhibits strong specificity, with a regulatory network significantly distinct from that of normal cell lines. However, among the normal cell lines, HMEC shows the highest number of shared EPIs, possibly due to its greater universality and adaptability within gene regulatory networks. This characteristic allows HMEC to display more commonalities in comparison with other normal cell lines. Conversely, the lower number of shared EPIs between IMR90 and NHEK further emphasizes that the specificities and commonalities among different cell lines are multi-layered, transcending a simple dichotomy between cancer and normal cell lines.
3.5. Analysis of EPI Network Structural Characteristics Across Different Cell Lines
This study aimed to systematically analyze the structural characteristics of enhancer–promoter interaction (EPI) networks in four cell lines (K562, HMEC, IMR90, and NHEK).
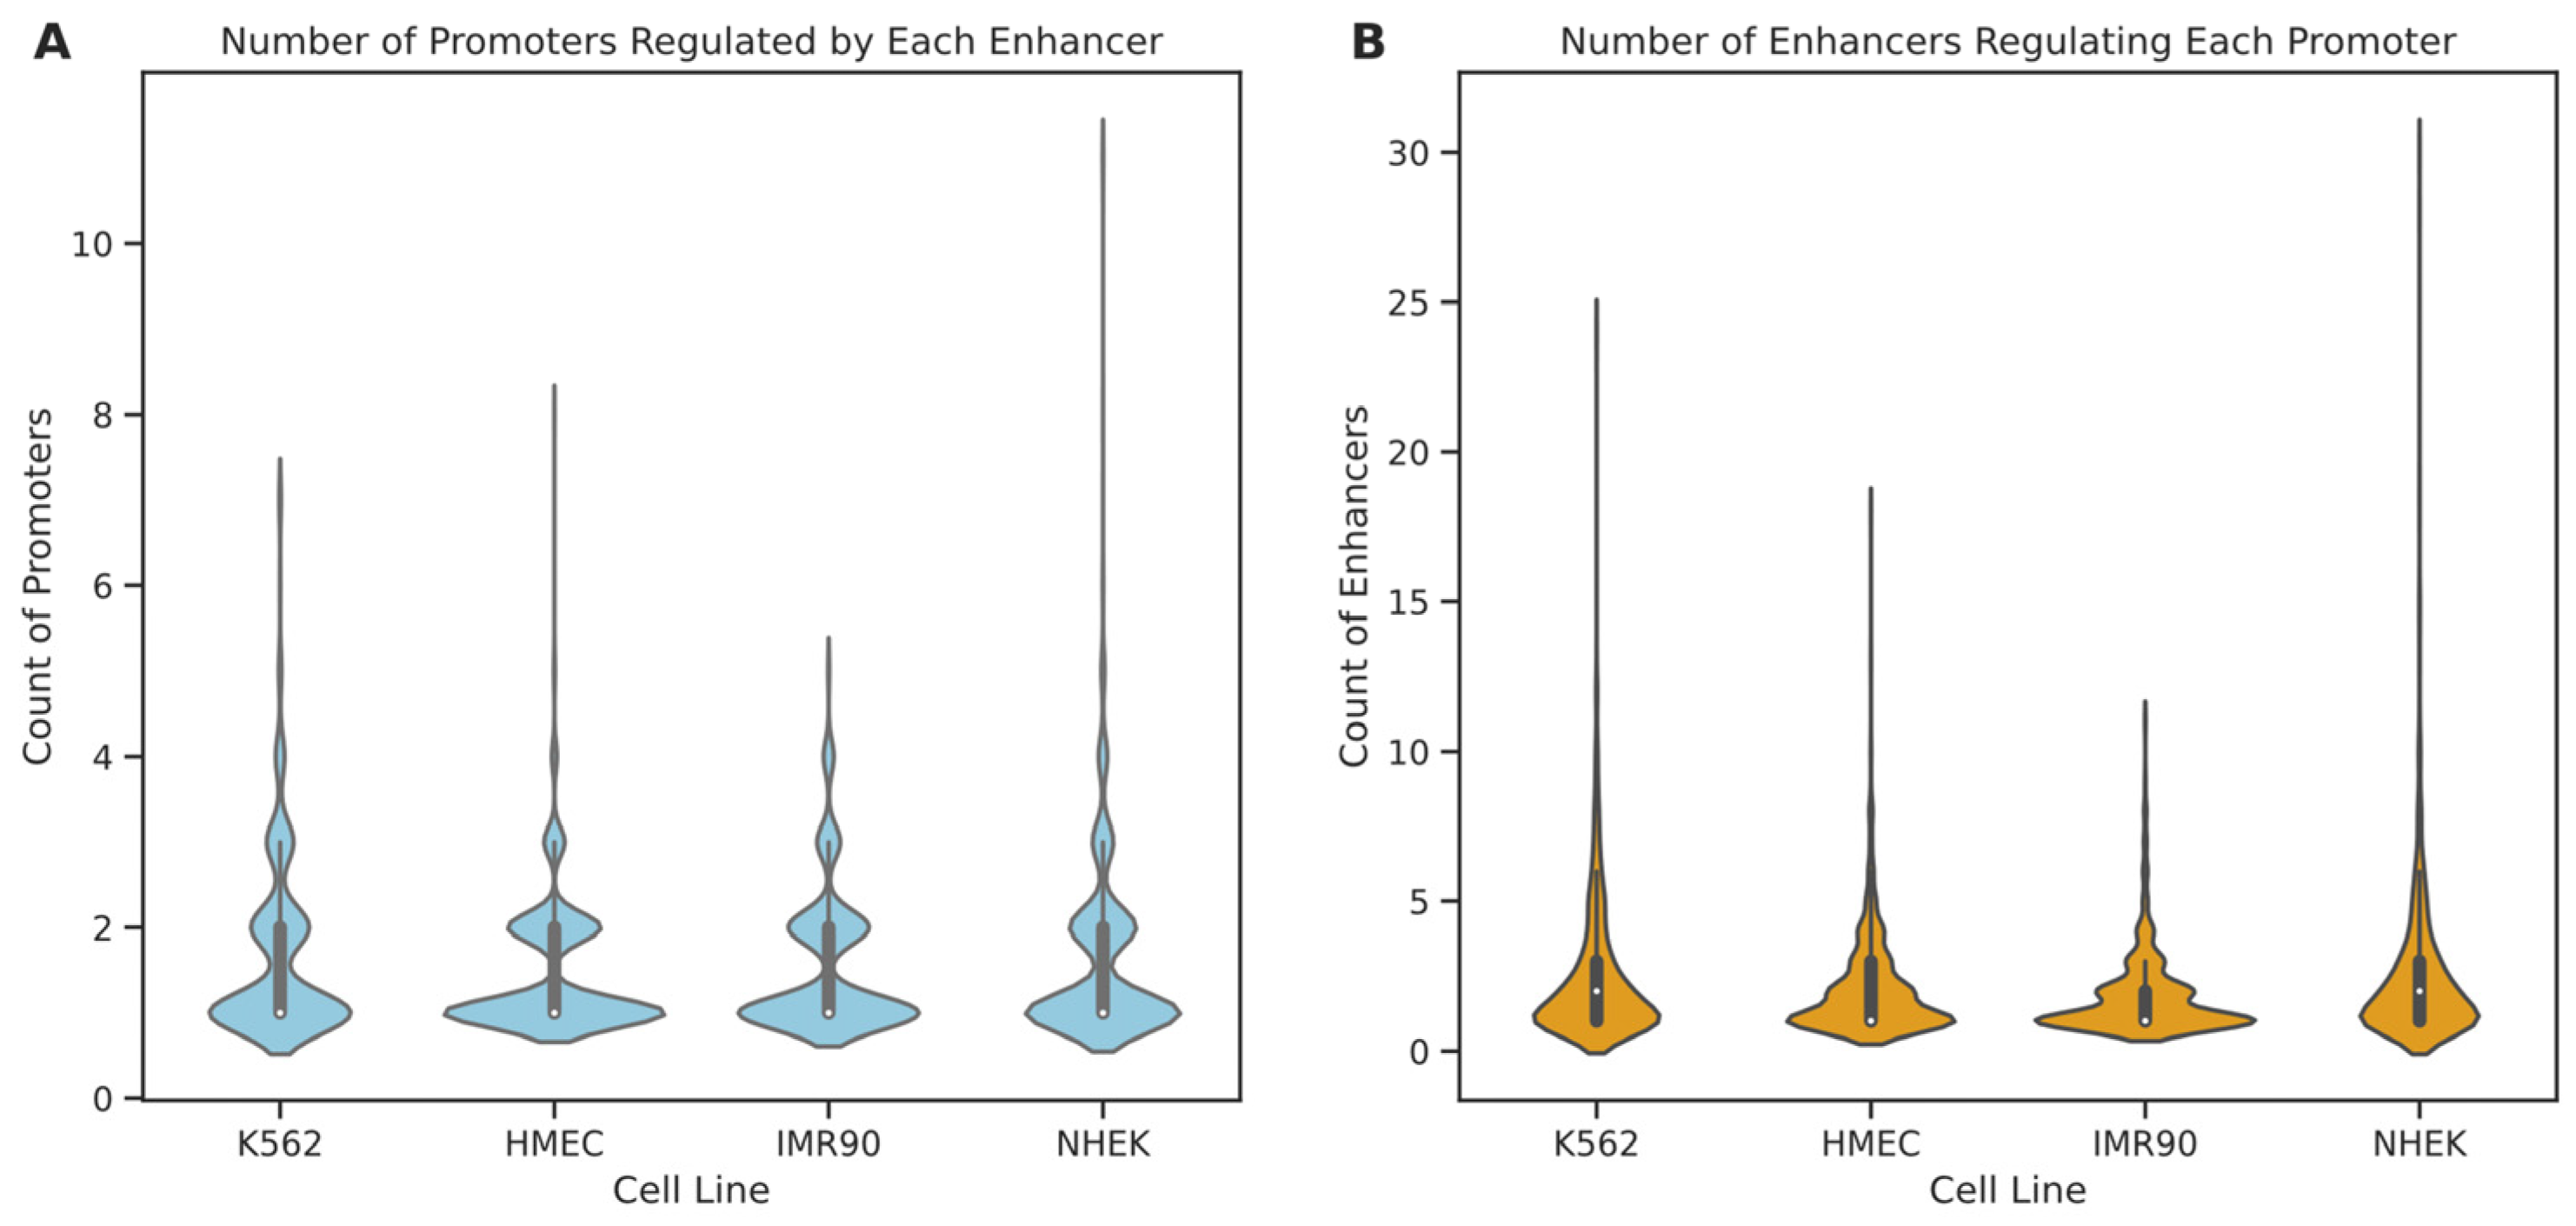
Initially, we analyzed the degree distribution of enhancer and promoter nodes within these cell lines (see
Figure 6). The results indicate that in all four cell lines, 75% of enhancers regulate only one to two promoters, suggesting that most enhancers tend to have specific interactions with a few promoters. A minority of enhancers interact with multiple promoters, with enhancers in IMR90, K562, HMEC, and NHEK engaging with up to 5, 7, 8, and 11 promoters, respectively. In contrast, promoter nodes typically have higher degrees than enhancers, particularly in the NHEK cell line, where some promoters are regulated by up to 30 enhancers, possibly indicating a more central role for promoters within the regulatory networks. Further examination of the degree distribution graphs reveals that the degree distribution in the IMR90 cell line is relatively “broad and short,” whereas it is “tall and thin” in the NHEK cell line. This suggests that the EPI network in IMR90 is simpler, with most nodes having fewer connections and more specific regulation, while the EPI network in NHEK is more complex, with more extensive regulatory relationships. To further understand the structure of the EPI network, we fitted the node degree distribution to common network distribution models, such as power-law, log-normal, and long-tail distributions. The fitting results showed that the p-values for all models were above 0.05, indicating that the degree distribution of the EPI network significantly differs from common protein interaction networks and may possess more complex and specific local structures. This phenomenon could be due to the highly specialized interaction patterns formed by enhancers and promoters for precise gene expression regulation.
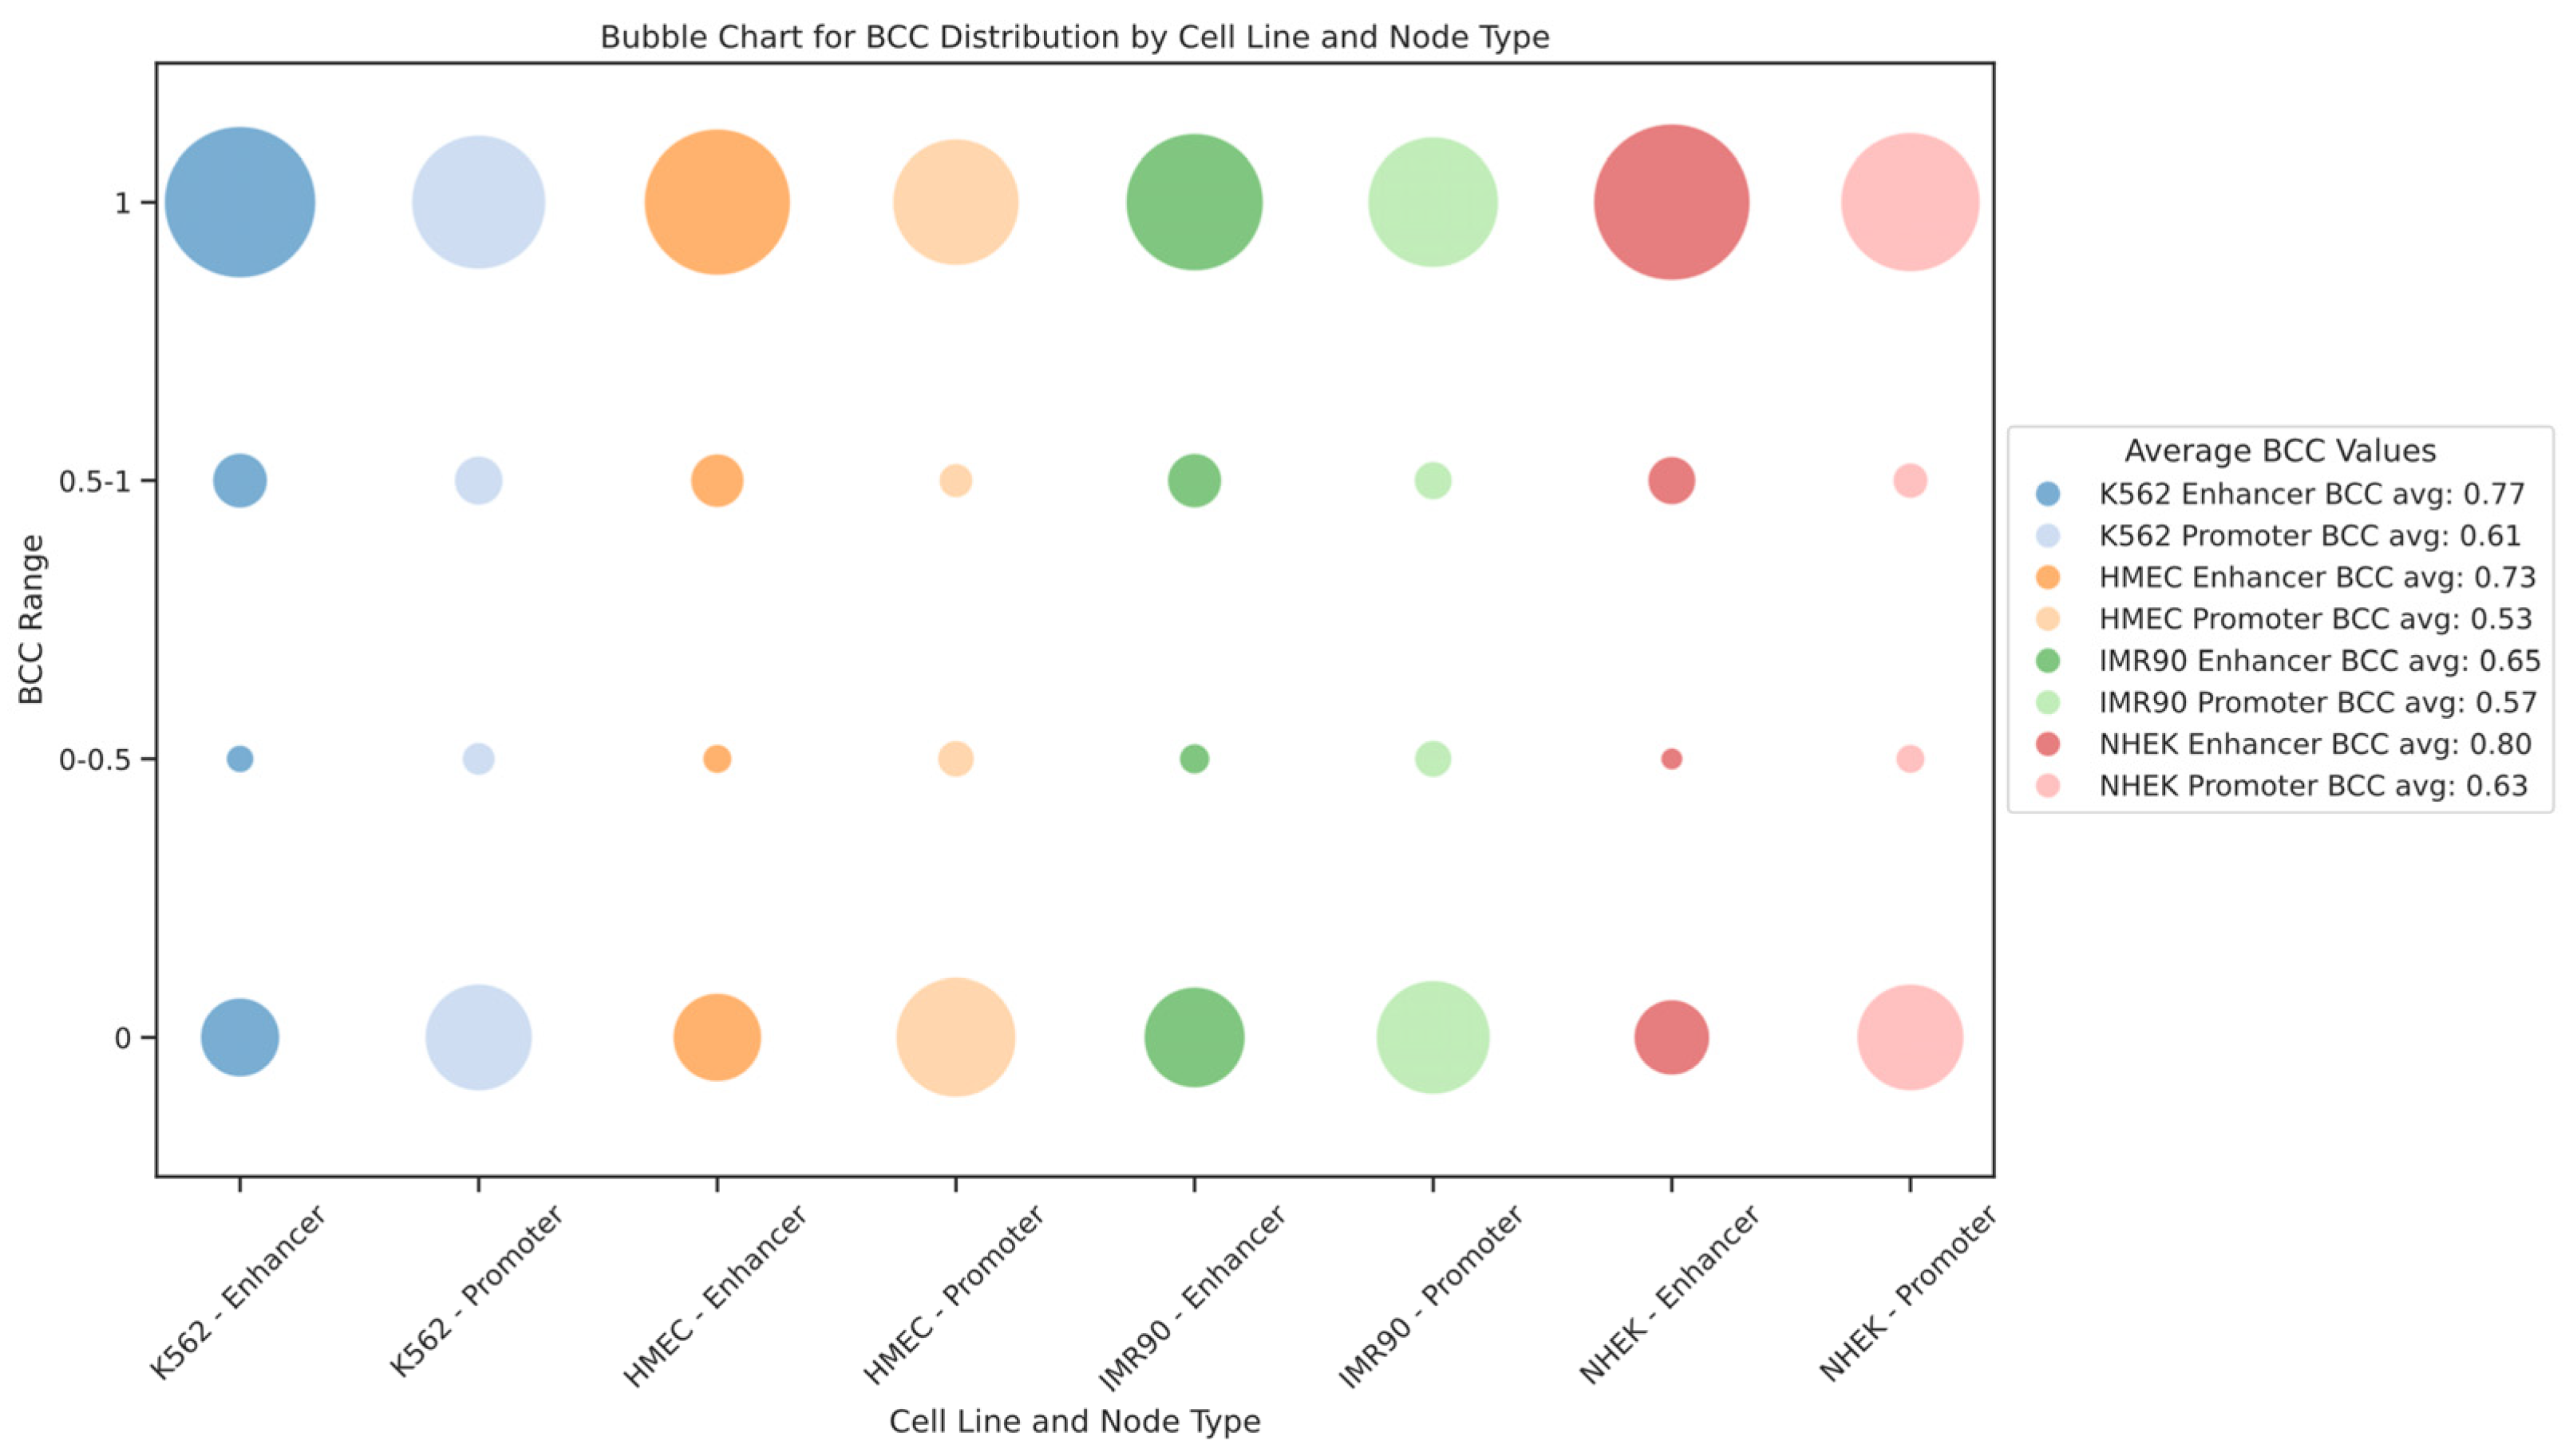
We also modeled the EPI as a bipartite network. In this context, the bipartite clustering coefficient (BCC) quantifies the clustering between different types of nodes. BCC values range from 0 to 1, where BCC = 1 indicates that the nodes participate in a highly connected local network, and BCC = 0 indicates very low clustering between nodes. For the EPI network, BCC = 1 means that enhancers and promoters form a densely interconnected local structure, where multiple enhancers and promoters form a “cluster” through mutual connections. Such cluster formations reflect the synergy in gene regulatory networks, where multiple enhancers regulate gene expression through shared promoters or several promoters collaborate via a single enhancer. Conversely, BCC = 0 suggests that the enhancer and promoter form only an isolated interaction pair, without further regulatory connections. In such cases, the interactions between enhancers and promoters exhibit high specificity, as they tend to regulate only a single gene or a small group of genes rather than participating in complex regulatory networks. This implies that these enhancers and promoters may undertake more specific or independent regulatory functions within the gene regulatory network. The distribution of the bipartite clustering coefficient BCC for enhancer and promoter nodes in each cell line is shown in
Figure 7. We found that the BCC values for enhancer nodes are generally higher than those for promoter nodes across different cell lines, indicating stronger clustering of enhancers within the gene regulatory network. Additionally, the distribution of BCC values shows extremes, with most nodes having BCC values of either 1 or 0, rarely in between, suggesting that the EPI network comprises both highly dense regulatory clusters and numerous isolated interaction pairs. This dual structure reveals the complexity and cell-type specificity of gene expression regulation within the network.
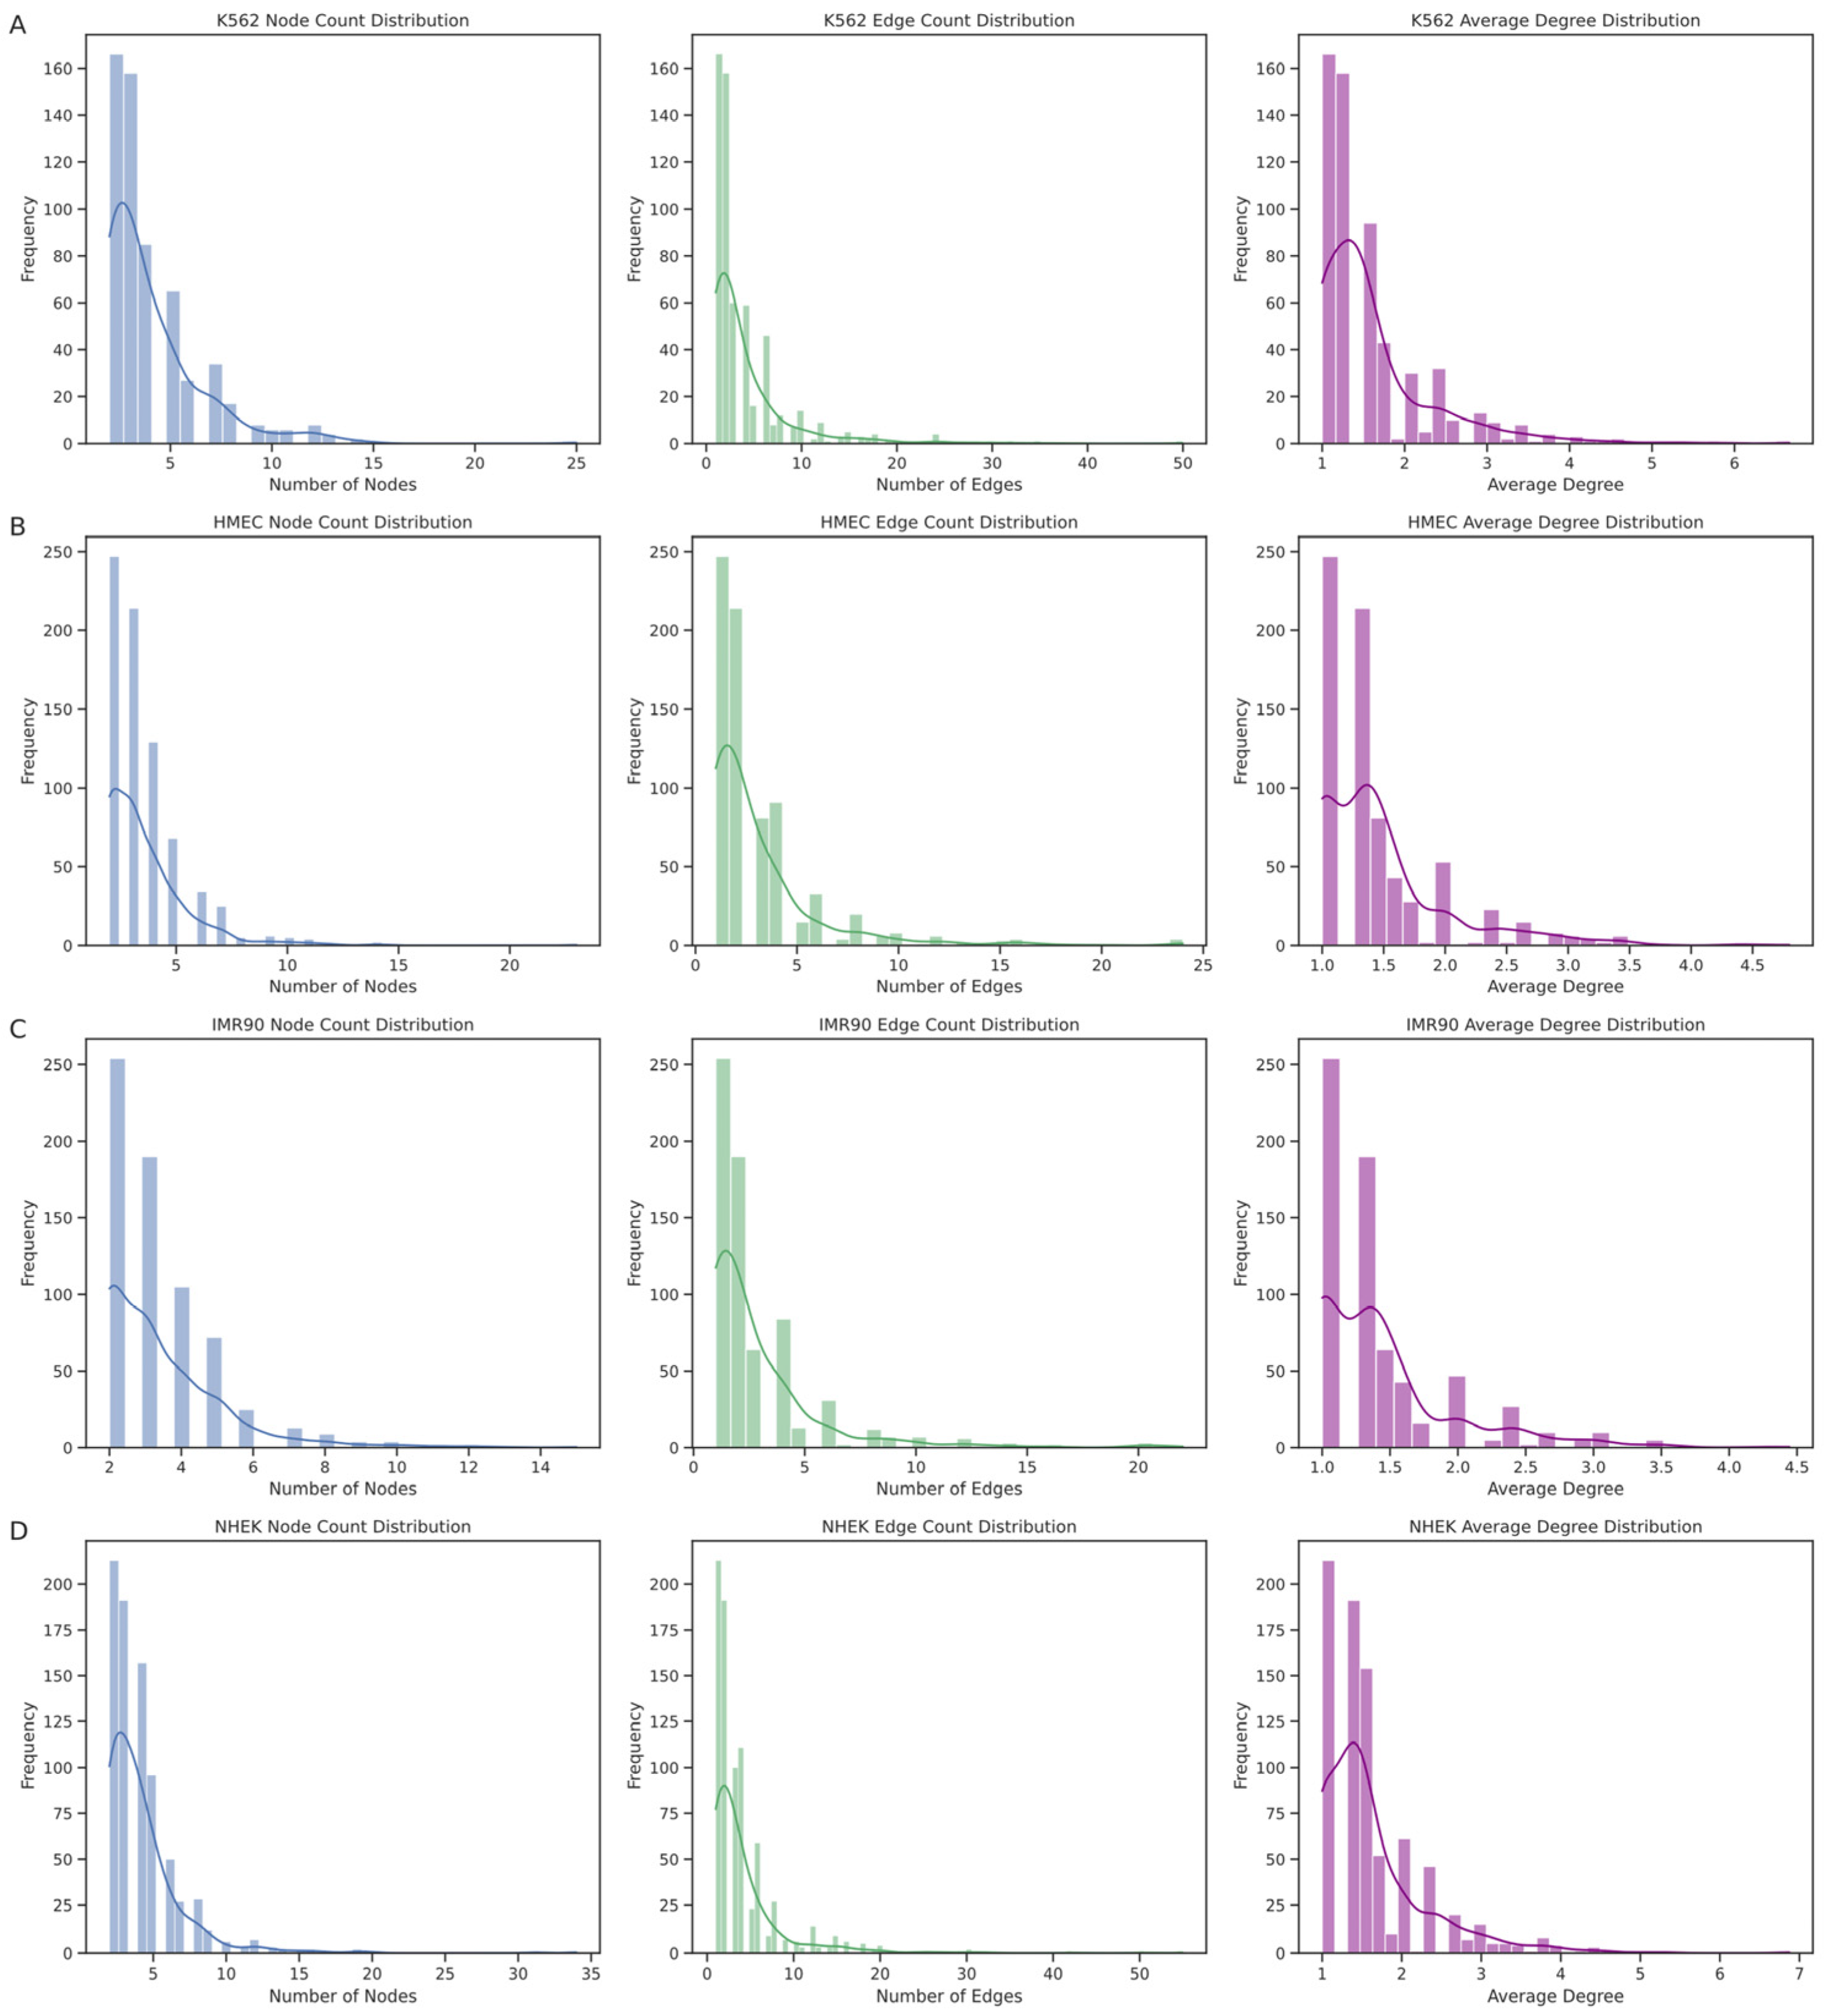
The EPI network consists of numerous discrete connected subgraphs, forming a broadly distributed archipelago network structure. By analyzing each connected subgraph’s node count, edge count, and average node degree (
Figure 8), we further understood the unique enhancer–promoter interaction patterns within each cell line. The results show that the node count distribution is concentrated at smaller values, indicating that most enhancers and promoters in these networks interact with only a few other elements. Similarly, the distribution trends of edge counts and average node degrees align with the node count distribution, mostly falling within lower ranges, suggesting that most subgraphs have relatively sparse internal connections. However, we also observed a few larger subgraphs with higher distribution values, such as in the K562 cell line, where the largest subgraph had 25 nodes with an average node degree of 6.6667, and in the NHEK cell line, where the largest subgraph had 34 nodes with an average node degree of 6.8750, hinting at larger and denser regulatory clusters within the EPI network. The largest regulatory clusters in the HMEC and IMR90 EPI networks might not be as complex as those in K562 and NHEK. This structural diversity is likely crucial for the complex gene expression regulation mechanisms within cells.
Through these analyses, the EPI network in the IMR90 cell line exhibits high specificity due to the localized and limited interactions between enhancers and promoters. In contrast, the interactions between promoters and enhancers are more complex in the NHEK and K562 cell lines. These findings reveal unique regulatory patterns and structural characteristics of the EPI network across different cell lines, showing more complex regulatory dynamics and specific biological functions compared to common protein interaction networks. Although the EPI network exhibits certain archipelago characteristics and local clustering, its internal structural heterogeneity and complexity reveal the complexity and cell-type specificity of gene expression regulation.
4. Discussion
In the study of enhancer–promoter interaction (EPI) prediction, this paper introduces a novel approach based on graph neural networks, named GATv2EPI. Traditional EPI prediction methods typically consider simple one-to-one interactions between enhancers and promoters, which fail to capture the complexity of interactions across broader genomic regions. GATv2EPI addresses this limitation by constructing complex EPI network structures and leveraging GATv2 to utilize global topological information within the network, effectively capturing the intricate relationships between enhancers and promoters. Furthermore, in terms of feature selection, GATv2EPI distinguishes itself from most deep learning models for EPI prediction, which primarily use DNA sequence features of enhancers and promoters. Instead, GATv2EPI incorporates local epigenetic features (such as CTCF, DNase-seq, and histone modifications), along with spatial distance features between enhancers and promoters, providing richer information for EPI prediction. Regarding feature extraction regions, unlike DeepTACT, our method not only considers the features of the enhancers and promoters themselves but also integrates information from their flanking regions, offering a more comprehensive context that enhances the model’s generalization ability. In contrast to TransEPI, which extracts features within a 2.5 Mbp range, our approach requires only a 40 kb range, significantly reducing computational complexity and improving training efficiency. Additionally, GATv2EPI employs a novel dataset partitioning method based on graph connectivity, sampling all connected subgraphs for each chromosome.
This strategy effectively avoids the overestimation of model performance caused by the random partitioning used in methods like SIMCNN, EPI-Trans, TargetFinder, and ChINN. It also overcomes the limitations of chromosome-wise partitioning in TransEPI, where samples from the same chromosome are confined to a single dataset, ensuring biological consistency and independence in training, validation, and test sets, thereby enhancing the model’s reliability.
A limitation of our method is that, although we have reduced computational complexity by optimizing the range of feature extraction and using chromosome-based subgraph partitioning to save memory and shorten training time, GATv2EPI, being a graph neural network-based approach, still requires considerable computational resources when dealing with particularly large datasets. This can be a challenge in resource-limited research settings and may restrict the broader application of the model.
This study further underscores the critical role of epigenetic marks in regulating gene expression, particularly by enhancing the predictive model’s performance through the integration of local epigenetic information with the spatial relationships between enhancers and promoters. We systematically analyzed the structural characteristics of the EPI network and discovered that it functions as a highly localized archipelago network, with differences in EPI network structures among the various cell lines. K562 and NHEK exhibited higher bipartite clustering coefficients and larger, more densely connected subgraphs compared to HMEC and IMR90.
In our analysis of the EPI network, we believe that beyond the identified cell-line-specific enhancer–promoter interactions, future work should focus on extracting and identifying key regulatory subnetworks that may comprise multiple enhancers and promoters whose synergistic effects are crucial for the expression of specific genes. Moreover, mining EPIs related to diseases will provide important insights into disease mechanisms. By comparing the EPI network differences between healthy and diseased cell lines, specific enhancer–promoter interactions can be identified, which may play pivotal roles in the onset and progression of diseases. For instance, the fewer shared EPIs in the K562 cell line compared to normal cell lines might indicate specific regulatory mechanisms associated with cancer. Future research could systematically identify and validate these disease-related EPIs in conjunction with clinical data, thus providing potential biomarkers for precision medicine and targeted therapy.
Regarding the future development of EPI prediction models, we currently rely primarily on bulk data for analysis. While this approach captures overall biological features to some extent, its resolution and accuracy are limited. Our future goal is to achieve more refined analyses, delving into single-cell resolution using single-cell RNA-seq data to enhance the accuracy and biological relevance of EPI predictions. However, the current lack of single-cell ChIP-seq data restricts research in this area. With technological advancements and the successful application of single-cell sequencing technologies, we anticipate integrating more single-cell data to achieve more comprehensive and in-depth EPI predictions. This will provide stronger support for understanding complex biological processes and significantly enhance the model’s practical utility and scientific value.
In downstream applications, EPI prediction models can be extended to drug development, disease mechanism research, and personalized medicine. For example, based on EPI prediction results, researchers can identify potential therapeutic targets, accelerating new drug development. Furthermore, the model can be employed to study the changes in gene regulatory networks under specific disease states, aiding in the identification of disease-related biomarkers and providing critical guidance for diagnosis and treatment.


