Article

Comparative Transcriptome Analysis of High- and Low-Growth Genotypes of Eucalyptus urophylla in Response to Long-Term Nitrogen Deficiency

1
Guangdong Provincial Key Laboratory of Silviculture, Protection and Utilization, No. 233, Guangshan First Road, Guangzhou 510520, China
2
Guangdong Academy of Forestry, No. 233, Guangshan First Road, Guangzhou 510520, China
*
Author to whom correspondence should be addressed.
These authors contributed equally to this work.
Genes 2024, 15(1), 60; https://doi.org/10.3390/genes15010060
Submission received: 23 November 2023 / Revised: 23 December 2023 / Accepted: 27 December 2023 / Published: 30 December 2023
(This article belongs to the Special Issue Plant Genetic Diversity and Omics Research)

Abstract

:
Nutrients play important roles in the growth and development of most plant species. However, in perennial trees, the function of nutrients in different genotypes is poorly understood. Three different nutrient levels (low, sufficient, and high nutrient levels) were applied to two contrasting Eucalyptus urophylla cultivars (a high-growth cultivar ZQUA44 and a low-growth cultivar ZQUB15), and growth and expression levels were analyzed. Although the growth traits of both genotypes under nutrient starvation treatment were much lower than under abundant nutrients, tree height, crown width, and biomass of different ZQUA44 tissues were much higher than those of ZQUB15 at all three nutrient levels. Differentially expressed genes (DEGs) clustered into six subclusters based on their expression patterns, and functional annotation showed that the DEGs involved in glutathione metabolism and flavonoid biosynthesis may be responsible for nutrient starvation across different genotypes, while the DEGs involved in carotenoid biosynthesis and starch and sucrose metabolism may have a range of functions in different genotypes. The DEGs encoding the MYB-related family may be responsible for nutrient deficiency in all genotypes, while B3 may have different functions in different genotypes. Our results demonstrate that different genotypes may form different pathways to coordinate plant survival when they face abiotic stresses.

1. Introduction

Water, mineral nutrients, and light are the main external inputs needed by plants to grow. In southern China, which has an abundance of rainfall and sunlight, mineral nutrients are the essential limiting factor for plant growth and production. For example, the macroelement nitrogen (N) is one of the most widely distributed nutrients in plants and is an essential nutrient for plant growth. N is the most fundamental elemental constituent of proteins [1], and its deficiency causes a decrease in amino acids, resulting in reduced plant growth. Long-term N deficiency leads to a decreased leaf area, resulting in yellowing of the leaves and a lower photosynthesis rate, reducing crop yield [2]. Furthermore, phosphorus (P), potassium (K), calcium (Ca), magnesium (Mg), and sulfur (S) are fundamental elements in plant cells and are incorporated into proteins, genetic materials, and membranes [1]. The macroelements P, Mg, and Ca also play important roles in energy metabolism, enzyme activity regulation, and phytohormone signal transduction [1]. Therefore, the absorption of sufficient mineral nutrients is essential for plant growth. However, in many areas of the world, agricultural, horticultural, forest, and herb plantations are deficient in elements that support healthy and productive plant growth. Therefore, fertilizers are applied to maximize yields. However, different genotypes have different growth traits due to variations in mineral nutrient use efficiency (NUE), even when the same level of nutrient is applied. Trees with a high growth performance tend to be more efficient at absorbing and utilizing nutrients than low-growth individuals under the same cultivation conditions; this difference may be due to variations in genetic signature [3,4]. Consequently, the development of tree species with a higher NUE will greatly increase the input-output (i.e., fertilizer application–wood production) of plantations and prevent nutrients from being released into ecosystems. Thus, to develop effective breeding programs, it is vital to fully understand the underlying genetic basis of the high- and low-growth traits of trees in response to nutrient supply.
In recent years, there has been substantial progress in next-generation sequencing accompanying bioinformatics analysis, which has allowed the identification of key genes and critical pathways underlying the responses of various plant species to variable levels of nutrients [5]. In Arabidopsis, the response to nutrient deficiency involves various complex networks, including the rearrangement of gene expression, hormone signal transduction, and physiological and morphological modifications [6]. Tao et al. (2013) studied the effects of nutrient starvation on starch accumulation in Landoltia punctata and found that it inhibited universal metabolism. Furthermore, the expression of genes encoding the key enzymes involved in starch biosynthesis was increased, while that of those that play an important role in starch consumption was inhibited [7]. However, few nutrient-starvation studies have been conducted on perennial plant species, which have much larger genomes than herbaceous plants. In one such study, the genetic mechanism controlling the “stay-green” phenomenon in Litchi chinesis pericarp under foliar Mg treatment was investigated via de novo transcriptome sequencing [8]. The authors reported that DEGs were enriched in flavonoid biosynthesis, anthocyanin biosynthesis, and the abscisic acid (ABA) signal pathway, indicating the role of Mg in many metabolic pathways in litchi. Still, the molecular basis underlying differences between high- and low-growth genotypes of lignocellulose tree species in response to nutrient stress is unclear. It is necessary to identify nutrient-responsive genes and to clarify the regulatory and metabolic mechanisms that allow tree species to adapt during periods of nutrient deficiency.
Eucalyptus is one of the most important commercial tree species in the world and is widely grown for pulp production [9]. By 2017, about 4.6 million hectares of Eucalyptus had been planted in southern China, accounting for 6.5% of all forestry plantations and producing 30 million m3 of wood products (26.9% of the country’s annual wood production). E. urophylla is one of the most widely planted E. urophylla species in southern China due to its high growth rate. A high growth rate requires high nutrient availability, and therefore, the availability of essential nutrients is a crucial factor determining the wood production of tree species worldwide. The seedling stage is a critical period for the survival and establishment of trees [10]. Previously, we conducted an 18-month precision fertilizer control experiment on 100 E. urophylla clones and found that the biomass of some clones was significantly higher than that of other clones under the same nutrient level. Which genes lead to the differences between clones? What are the functions of these genes? These are the questions we aim to unravel.
Therefore, in this study, we analyzed the phenotypic responses of E. urophylla seedlings subjected to nutrient stress. Transcriptomic analyses were performed to study gene expression patterns under different nutrient stress conditions using RNA extracted from the leaves of 18-month-old seedlings. The main objective was to identify genes that were differentially expressed under control and stress conditions and to provide information regarding the molecular mechanism involved in nutrition treatment that can be used in future studies.

2. Materials and Methods

2.1. Plant Materials and Nutrient Treatments

The plants used in this study were grown from seeds obtained commercially from the Commonwealth Scientific and Industrial Research Organisation (CSIRO), Australia. All plants were cloned by tissue culture. Based on field studies, two E. urophylla genotypes were identified for use in the study: a high-growth cultivar (ZQUA44) and a low-growth cultivar (ZQUB15) (Yang et al., unpublished). Healthy seedlings of similar size were selected for each genotype and cultured in cylindrical containers with black-and-white film for moisture control. These were exposed to three nutrient treatments (low, sufficient, and high nutrient levels) under natural conditions in March. The low treatment entailed only one application of base fertilizer (250 g calcium-magnesium phosphate fertilizer (Norsterra, Norway)) per tree. The sufficient treatment included the application of base fertilizer and an after fertilizer (250 and 100 g compound fertilizer in August and the next March, respectively) per tree. The high treatment involved the base fertilizer (250 g calcium-magnesium phosphate fertilizer and 100 g compound fertilizer) and an after fertilizer (100 g urea in May and 150 and 100 g compound fertilizer in August and the next March, respectively) per one tree. Each treatment was replicated three times. After 18 months of culture, the leaves of all treatments were sampled and stored in liquid nitrogen.

2.2. Determination of Growth Characteristics

In total, three features were quantified in 18-month-old E. urophylla seedlings, with three biological replicates used for each treatment. Height was measured as the distance from the rhizome on the ground to the shoot apex and was measured using a height gauge. The ground diameter was determined at the base of a tree shoot using calipers. Crown width was the width of the north-south or east-west direction of trees and was determined by a scaled measuring stick. The biomass of the different treatments referred to the dry weight of different tissues, including leaves, stems, and branches. All tissues were sampled and dried in a drying oven. Each sample was measured until a constant weight was achieved.

2.3. RNA Isolation, Sequencing, and Assembly

Total RNA was isolated from the leaves of the three replicate plants in each treatment using the Qiagen RNAeasy kit (Qiagen China, Shanghai, China) and purified using an RNAclean Kit (Tiangen Biotech (Beijing) CO. LTD., China) following the manufacturer’s instructions. The integrity of the RNA was monitored on 1% agarose gels, and the purity was checked using a NanoPhotometer® spectrophotometer (Implen, Westlake Village, CA, USA). The RNA concentration was determined using a Qubit® RNA assay kit with the Qubit® 2.0 fluorometer (Life Technologies, San Francisco, CA, USA). A total amount of 3 µg high-quality RNA per sample was used for subsequent RNA sequencing. The cDNA library was constructed for each of the nine RNA samples and sequenced on the Illumina HiSeq 2500 platform (Illumina Inc., San Diego, CA, USA). Before assembly, the adapter sequences, poly N, and low-quality reads were removed from the raw data. An index of the reference genome (directly downloaded from https://phytozome.jgi.doe.gov/pz/portal.html#!bulk?org=org_egrandis, accessed on 19 August 2020) was built using Bowtie v2.0.6 and the paired-end clean reads were aligned to the reference genome using TopHat v2.0.9 [11]. Then, the mapped reads of each sample were assembled using both Scripture (beta2) [12] and Cufflinks (v2.1.1) [13].

2.4. Normalization of Gene Expression Levels and Identification of DEGs

To evaluate gene expression levels, the paired-end clean reads that were mapped to the reference genome were used for the FPKM calculation of each sample using Cuffdiff [13]. The FPKM was calculated based on the length of the fragments and the reads count mapped to the fragment.
To distinguish the transcriptional changes under the different treatments in the two genotypes, the DEGs under the different treatments were identified by comparing the expression levels under the sufficient and low treatments to those under the high and sufficient treatments in ZQUA44 and ZQUB15, respectively, using the DESeq2 R package (1.16.1). To eliminate false positives, the false discovery rate (FDR) was calculated to adjust the threshold of the p-value. Transcripts with a minimal two-fold difference in expression (|log2Fold change| ≥ 1) and an FDR ≤ 0.01 were considered to be differentially expressed between the three treatments. For convenience, DEGs with higher expression levels under the sufficient treatment than under the low treatment, as well as those with higher expression levels under the high treatment than under the sufficient treatment, were considered upregulated, whereas those in opposition were considered downregulated.
To assess the gene expression patterns under different nutrient conditions within each genotype, expression pattern analysis was performed, which assigned all DEGs of ZQUA44 and ZQUB15 across the two treatment levels to nine expression profiles, using Short Timeseries Expression Miner (STEM) version 1.3.8 (Ernst and Bar-Josepheight, 2006). The DEGs belonging to the same cluster were proposed to have a similar expression pattern. For each genotype, the clustered profiles of DEGs with p < 0.05 were considered to be significantly different from the reference set.

2.4.1. Functional Annotation and GO and KEGG Classification

The identified genes were annotated by referring to E. grandis in the Phytozome plant genomics resource (https://phytozome.jgi.doe.gov/pz/portal.html#!bulk?org=org_egrandis, accessed on 19 August 2020) and The Arabidopsis Information Resource (TAIR) (https://www.arabidopsis.org/, accessed on 19 August 2020). Then, GO terms were determined by AgriGO (http://bioinfo.cau.edu.cn/agriGO/index.php, accessed on 25 August 2020) with Arabidopsis as the background and an FDR < 0.05 was set as the threshold. The KEGG Orthology-Based Annotation System (KOBAS) 3.0 tool (http://kobas.cbi.pku.edu.cn/index.php, accessed on 26 August 2020) was used to analyze the potential functions of the target genes in the pathways under the three different nutrition treatments (p < 0.01).

2.4.2. Validation of the Expression Level

Ten genes with different expression patterns revealed by RNA sequencing were randomly selected for validation by reverse transcription quantitative real-time PCR (qRT-PCR). RNA extracted from leaves from all samples was used for qRT-PCR validation. cDNA was synthesized using a Tiangen FastKing RTKit (Tiangen Biotech). Gene-specific primers for qRT-PCR were designed based on the corresponding sequence on the NCBI Primer-BLAST (https://www.ncbi.nlm.nih.gov/tools/primer-blast/index.cgi?LINK_LOC, accessed on 27 August 2020) and are listed in Table S1. Actin (EF145577) was used as an internal control. The qRT-PCR was performed using the FastKing RT Kit and determined using an Applied Biosystems 7500 fast real-rime PCR system following the manufacturer’s instructions. Three technical replicates were performed for each gene. A regression analysis was performed between qRT-PCR and RNA sequencing, including all of the genes of the two genotypes at the three different treatments using the r package (version 3.1.3, http://cran.r-project.org/, accessed on 15 September 2020).

3. Results

3.1. Effect of Different Nutrient Treatments on Tree Growth Characteristics

To examine the effects of different long-term nutrient treatments on the high- and low-growth genotypes of E. urophylla, we measured growth traits, including tree height, ground diameter, and crown width, as well as the biomass of different tissues (e.g., the biomass of branches, leaves, roots, and stems) 18 months after nutrient treatment. There were significant differences (p < 0.05 unless otherwise stated) in all growth traits between the different treatments (Figure 1). For example, tree heights of the high- and low-growth genotypes under ‘sufficient’ (see Methods) nutrient levels (281.00 and 194.67 cm, respectively) and ‘high’ nutrient levels (289.00 and 229.00 cm, respectively) were significantly greater than under low nutrient levels (178.00 and 150.00 cm, respectively) (Figure 1). Moreover, the leaves under low nutrient levels were much smaller (and showed signs of disease) compared to those under sufficient and high treatments (Figure S1). No significant differences in height were found between the high and sufficient treatments for ZQUA44, while a significant difference was observed for ZQUB15. The same was found in regard to increases in ground diameter and crown width. To further evaluate the effects of nutrients on plant growth, the biomass of different tissues was assessed. Stems, branches, roots, and leaves (and overall biomass) were much lower under low nutrient levels than in the other treatments for both genotypes, indicating that nutrient availability was the most important factor that restricted plant growth.
However, the growth traits of the different genotypes varied at the same level of nutrient treatment. For example, ZQUA44 plants were much taller than ZQUB15 plants at all three nutrient levels. The same was observed for ground diameter. Interestingly, the crown width was similar under the low and sufficient treatments, while a much larger crown was observed under high nutrients. All biomass values were greater for ZQUA44 than for ZQUB15 under low nutrient levels, indicating that the genetic basis of the different genotypes was another important factor causing variation in phenotypic performance. The differences in plant growth traits between the high and low nutrient applications were much larger in ZQUA44 than in ZQUB15. In addition, no significant differences were observed in height between the sufficient and high treatments in ZQUA44, indicating a higher NUE in ZQUA44.

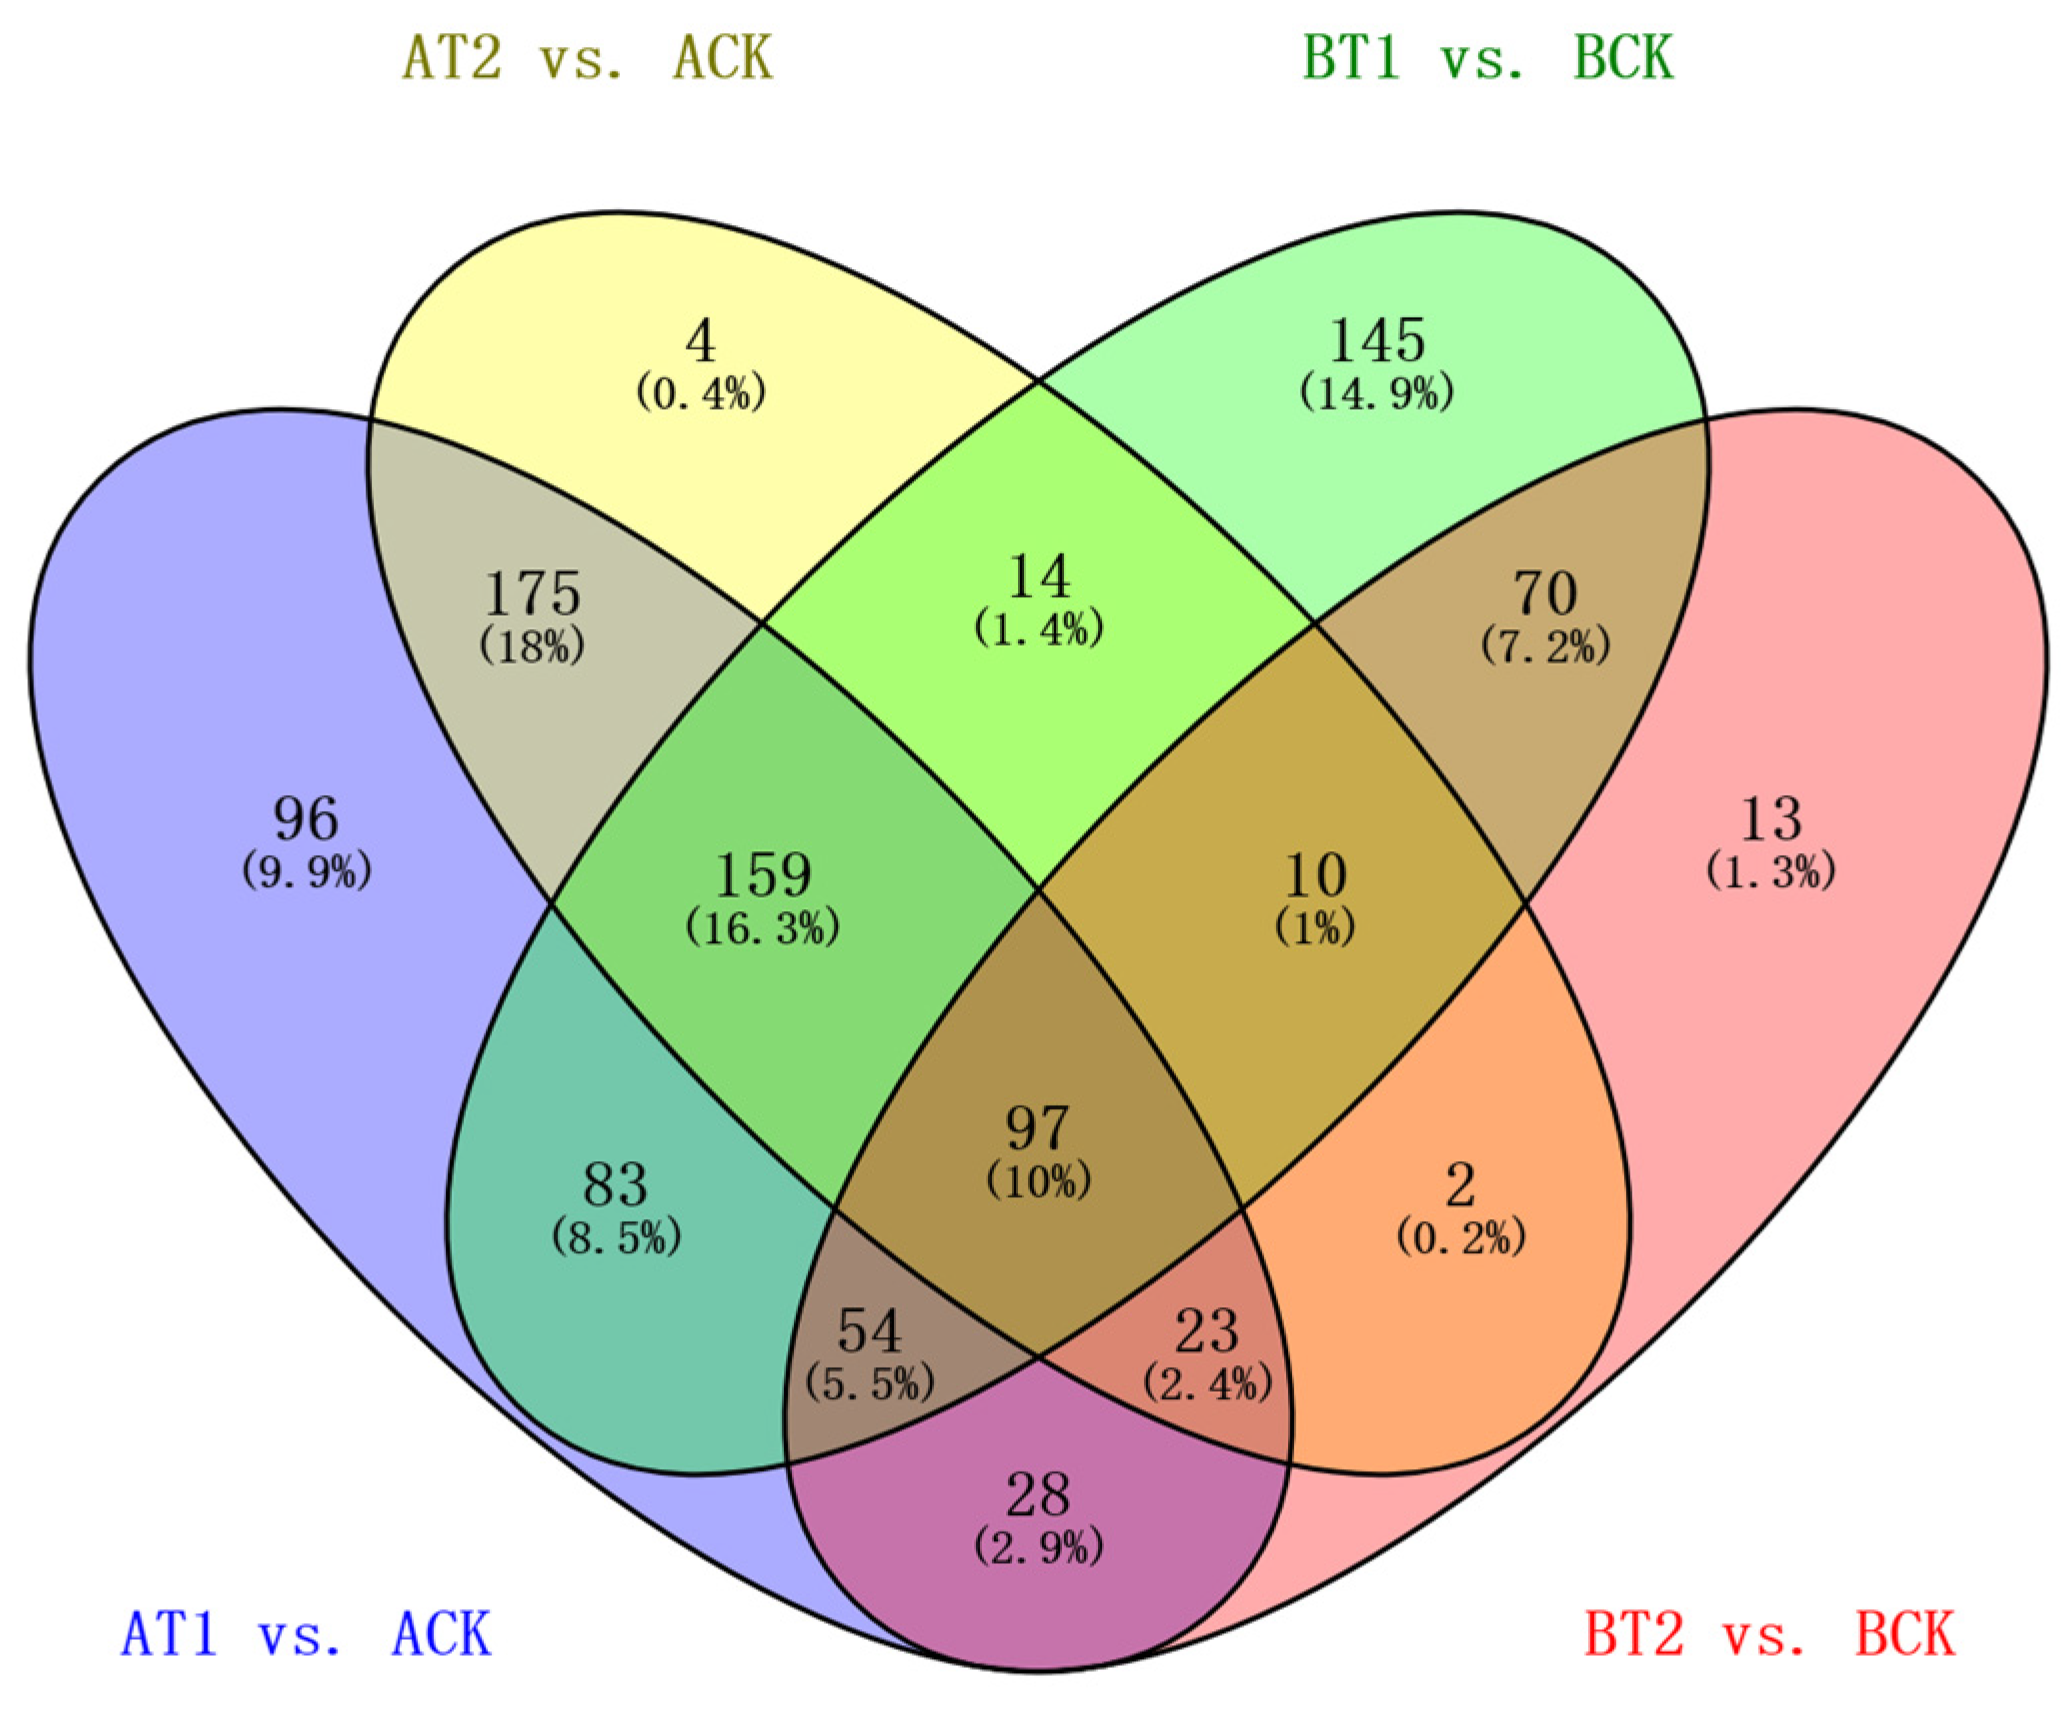
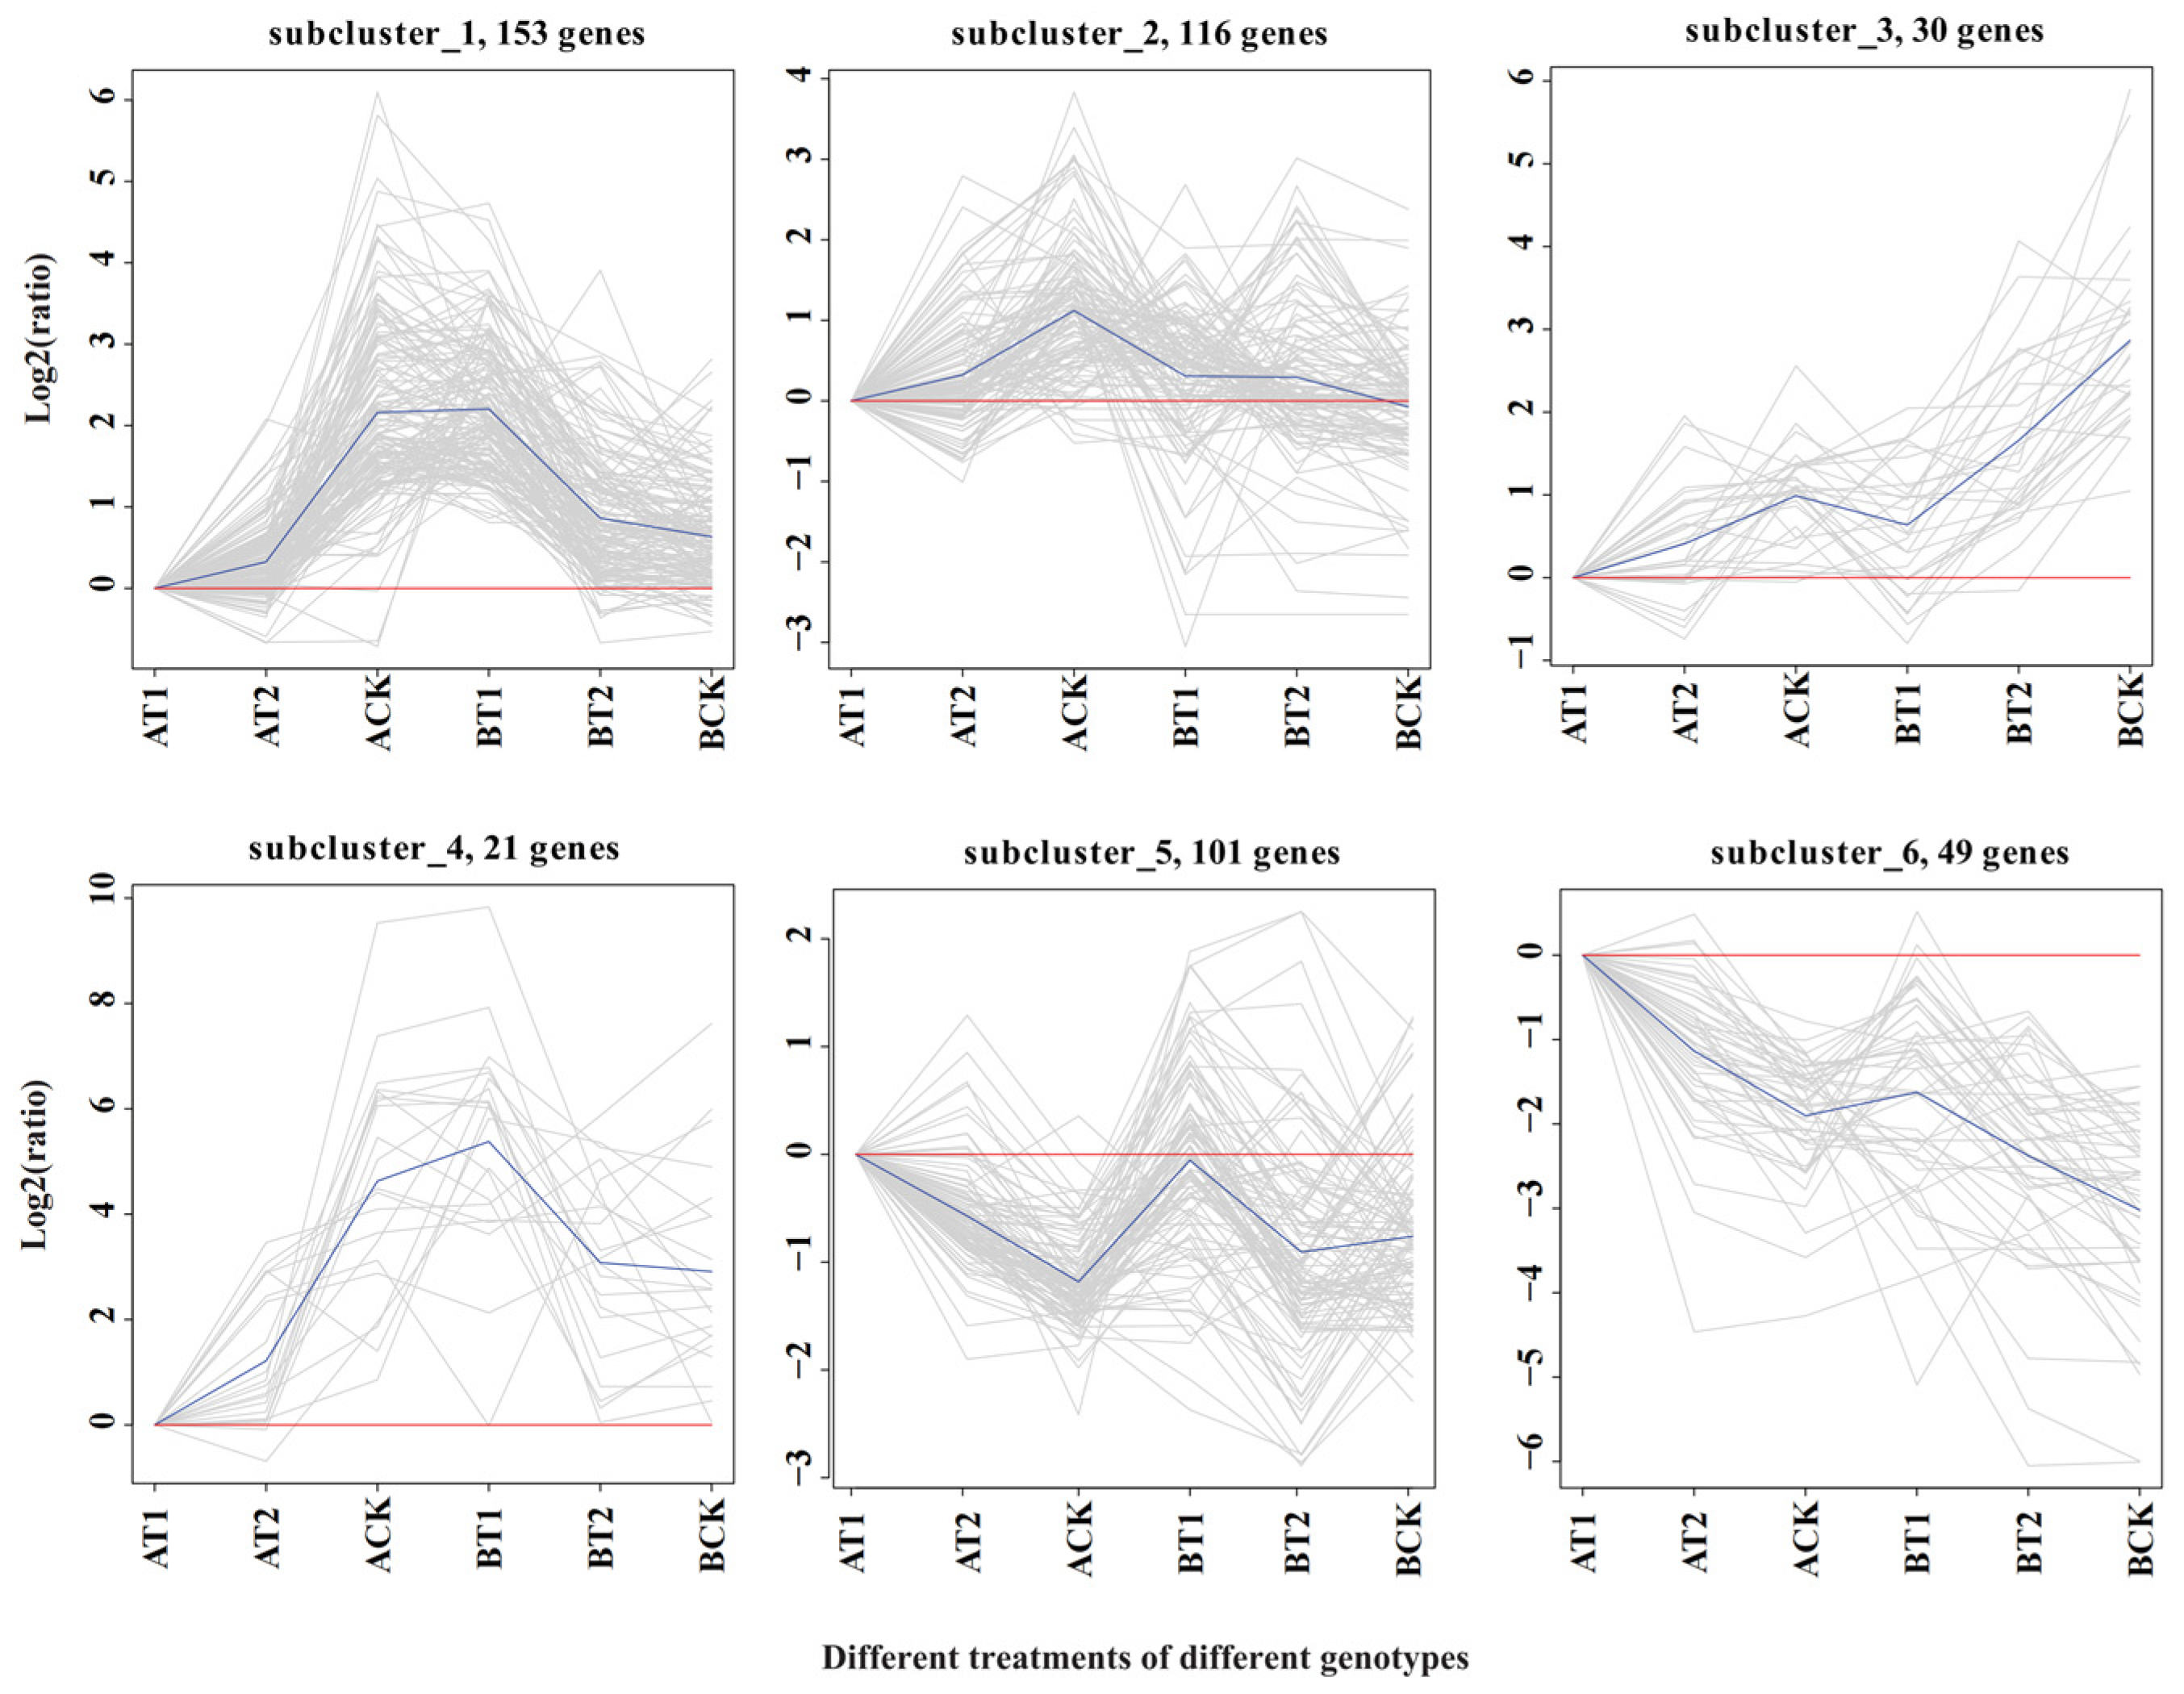
3.2. An RNA Sequencing Approach for the Assembly, Quantification, Identification, and Clustering of DEGs in Response to Nutrient Treatments

To evaluate the genetic variation in the two genotypes under different treatments, transcriptome profiling of 18 samples of the two genotypes was conducted on an Illumina Hiseq 2500 platform. In total, 8.42–11.11 million 125 bp pair-end reads were generated (Table 1). After removing adapter, ploy-N, and low-quality reads using in-house perl scripts, 8.15–10.72 million clean reads were obtained. Then, clean data with a high Q20 (94.43–98.41%) and Q30 (85.65–95.71) and low error rate (<0.03%) were used for alignment to the reference genome using TopHat v2.0.9. A range of 3.21–5.72 million reads were mapped to the reference genome, and more than 96% of them were uniquely mapped. The expression levels of protein-coding genes were represented by fragments per kilo-base of exon per million fragments mapped (FPKMs). The genes with FPKMs < 0.1 in all samples were filtered out, and the remaining genes were used for further analysis. To detect genes that were specifically expressed under different treatments, the DESeq2 R package (1.16.1) was used to analyze samples of the two genotypes under the different treatments. In total, 973 DEGs were detected in ZQUA44 and ZQUB15 under the low and sufficient nutrient treatments compared to high treatment using a threshold of a 2-fold change in gene expression, as previously applied when using the degR package (p < 0.01, and Q < 0.10, Figure 2). Of these DEGs, 470 were found in both ZQUA44 and ZQUB15, while 275 and 228 DEGs were found in only ZQUA44 and ZQUB15, respectively.
To further determine the possible mechanisms through which the different genotypes respond to different nutrient levels, the expression trends of common DEGs between the two genotypes were analyzed using ggplot2 package implemented in R (Version 3.0.3). The DEGs clustered into six subclusters, which were divided into three groups: Group 1 (G1) consisting of subclusters 1 (153 DEGs), 2 (116 DEGs), and 4 (21 DEGs); Group 2 (G2) consisting of subcluster 3 (30 DEGs); and Group 3 (G3) consisting of subclusters 5 (101 DEGs) and 6 (49 DEGs) (Figure 3). The DEGs in G1 were all activated under nutrient deficiency in genotype ZQUB15, while they were inhibited in genotype ZQUA44. The DEGs in G2 were all inhibited under nutrient deficiency, while they were activated under high nutrient levels in both genotypes. The opposite situation was observed in G3, in which the DEGs were all activated under nutrient deficiency, while they were inhibited under high nutrient levels in both genotypes. Because the same DEGs in the different genotypes had different expression patterns in G1, we propose that the DEGs in this group may be responsible for the genotype/nutrient interaction. In Groups 2 and 3, the DEGs were activated or inhibited in both genotypes. We therefore propose that the DEGs of these groups may be responsible for the nutrient responses across clones. The DEGs found only in either ZQUA44 or ZQUB15 may be genotype-specific genes between low- and high-performing clones.

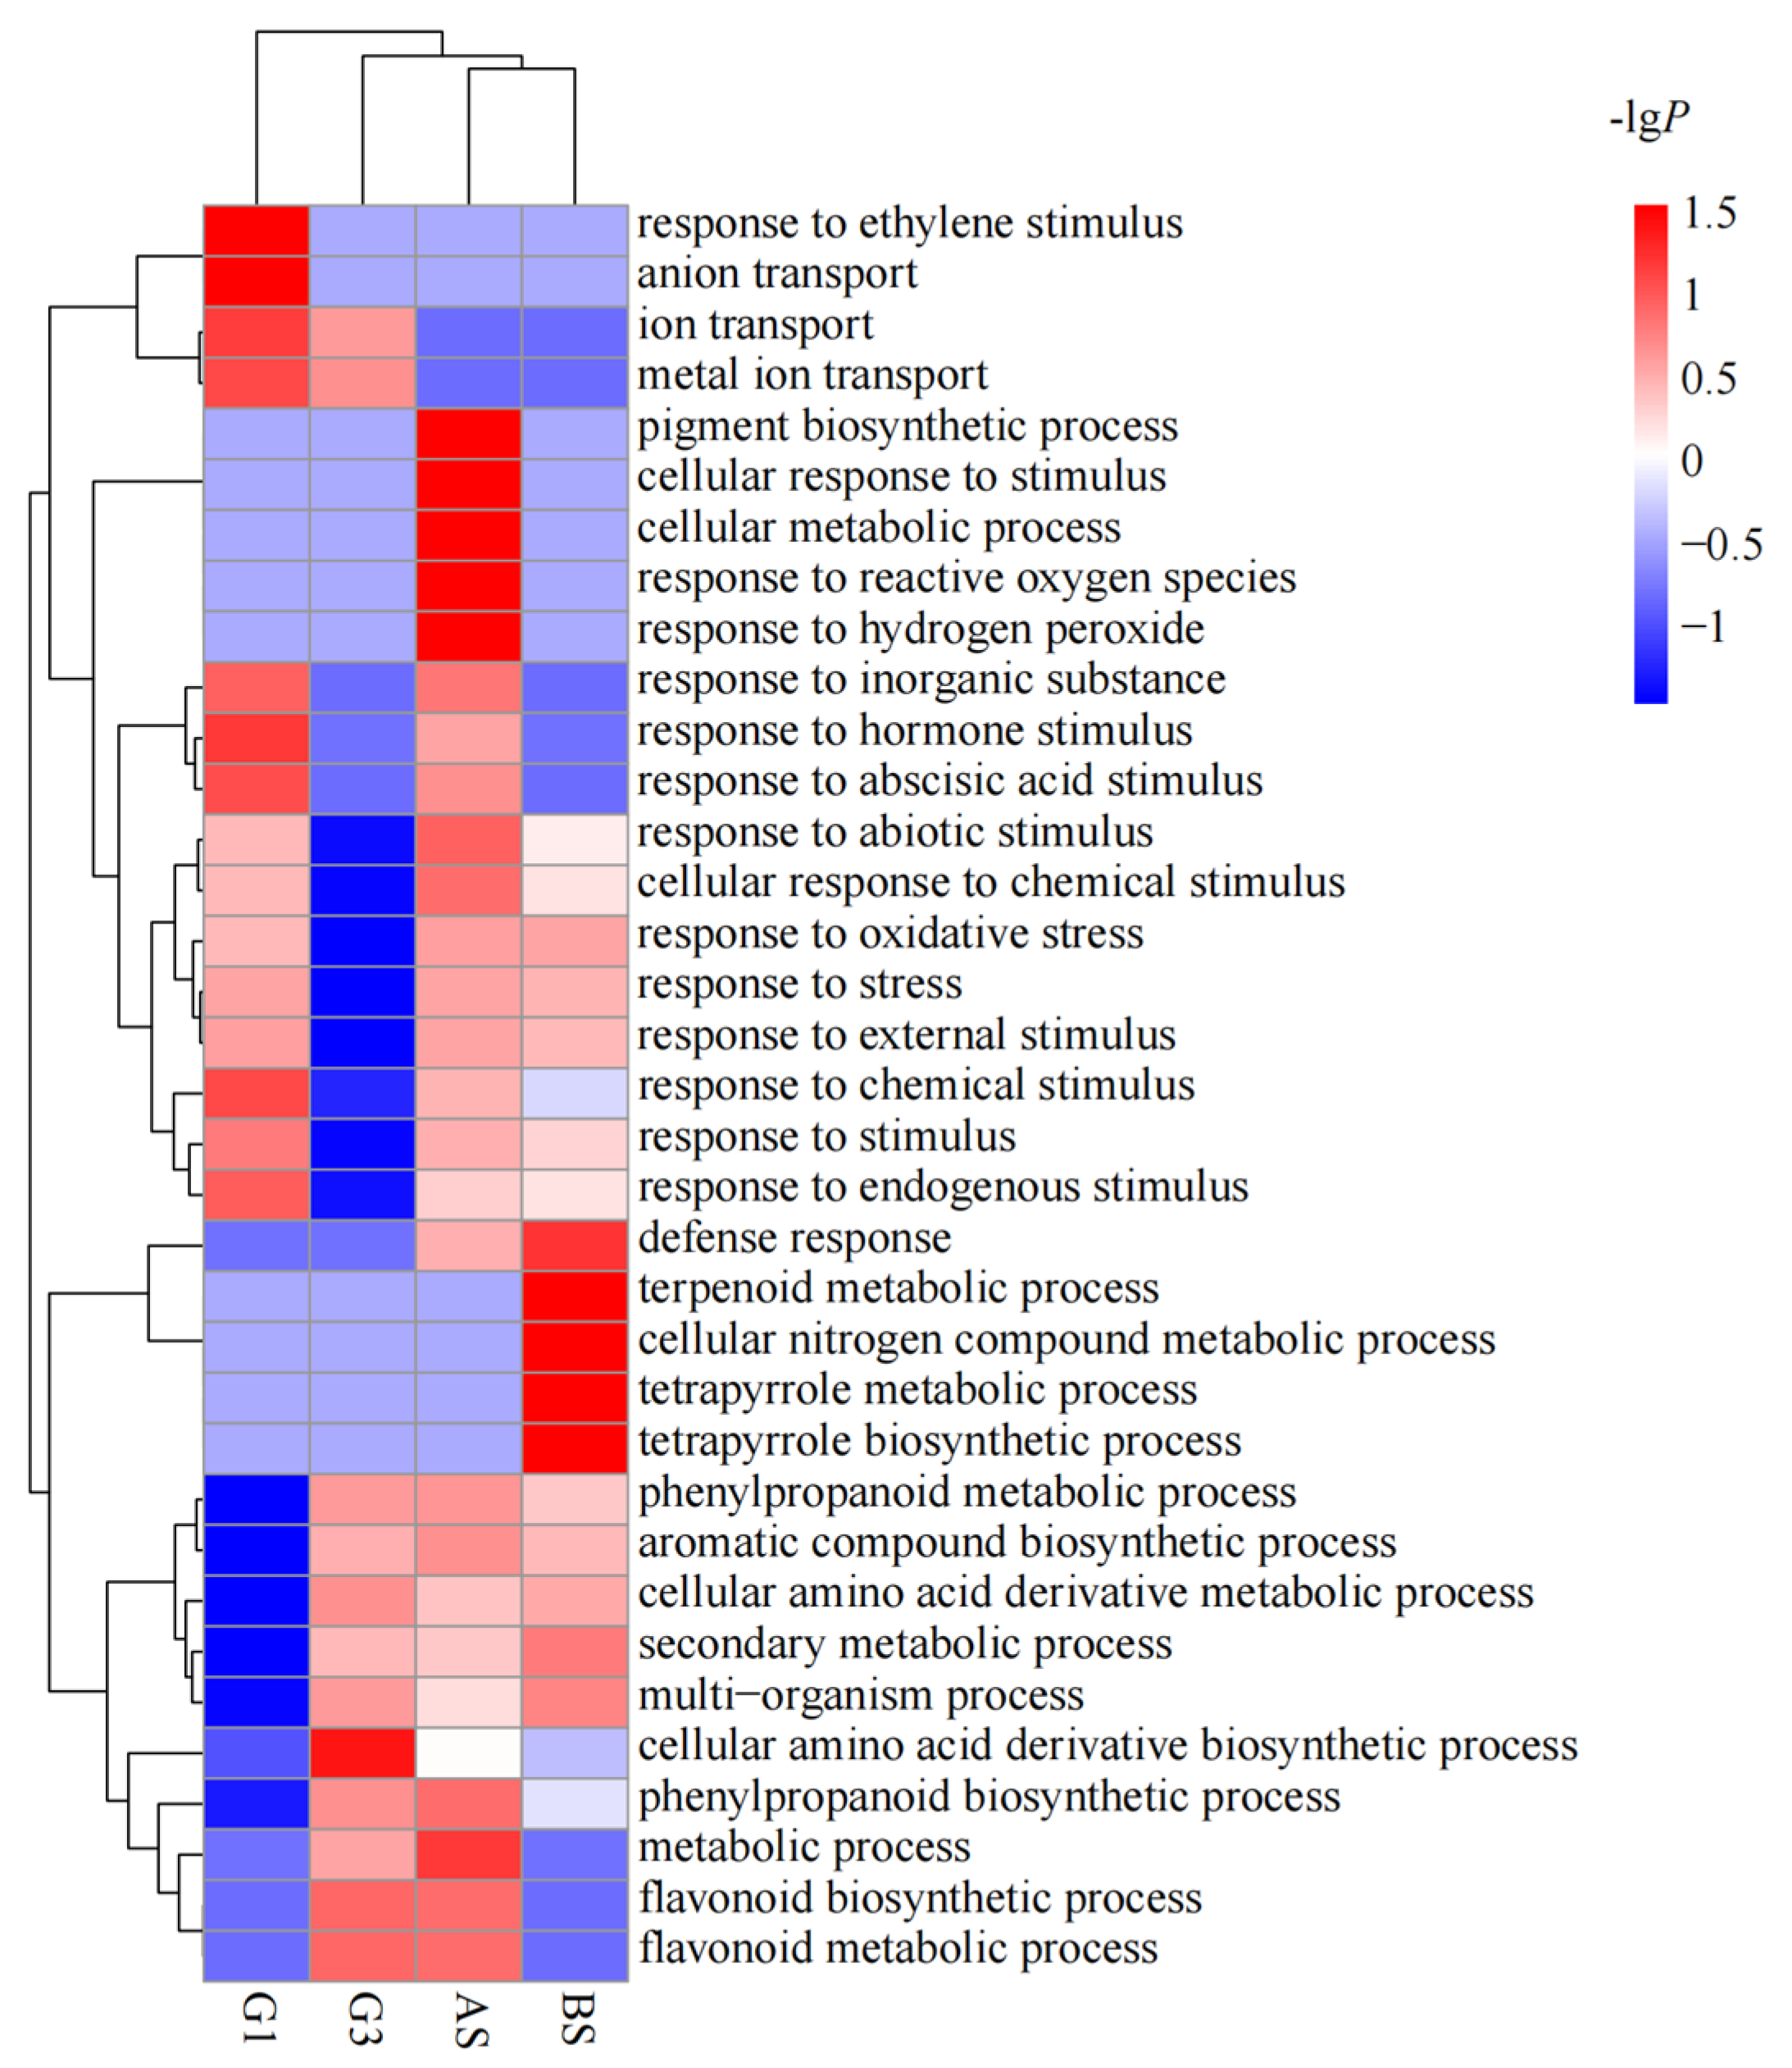
3.3. Functional Enrichment of the DEGs of Different Genotypes in Response to Nutrient Treatments

Gene ontology (GO) classifications were determined to analyze the possible functions of DEGs that were differentially expressed in the ZQUA44 and ZQUB15 genotypes and the common DEGs that were found in both genotypes (Figure 4). A total of 35 GO terms in biological processes were identified in four groups of DEGs, including AS for DEGs that were differentially expressed in ZQUA44, BS for DEGs that were differentially expressed in ZQUB15, and G1 and G3 for the common DEGs (p < 0.0001, Q < 0.01). Overall, 12 of the significant GO terms identified in G1 were involved in responses to stress or stimulus. The most significant processes were the response to a stimulus and the response to a chemical stimulus. In G3, 57.1% of the 14 identified GO terms were involved in biosynthetic or metabolic processes, and only two GO terms were involved in responses to stress or stimulus. The most significant processes in this group were the flavonoid metabolic process, secondary metabolic process, and flavonoid biosynthetic process. In total, 27 GO terms were identified in the DEGs identified in ZQUA44, and 15 of them were involved in responses to stimulus or stress. The most significant terms were response to stimulus and response to abiotic stimulus in ZQUA44. In ZQUB15, 20 GO terms were identified, and 10 of them were involved in metabolic or synthesis processes. The most significant terms were response to stimulus and secondary metabolic process. Furthermore, the DEGs of all groups were involved in the cellular amino acid derivative biosynthetic process, phenylpropanoid biosynthetic process, response to chemical stimulus, and response to stimulus. Overall, 18 GO terms for molecular functions were found in the five groups of DEGs (Table 2). DEGs with oxidoreductase activity and catalytic activity were significantly enriched in all five groups. Those involved in transcription activator activity were significantly enriched in G1, those involved in transporter activity were significantly enriched in AS, and those involved in transferase activity were significantly enriched in BS.
A Kyoto Encyclopedia of Genes and Genomes (KEGG) analysis showed that the DEGs involved in metabolic pathways were significantly enriched in G1, G3, and AS (Table 3, Q < 0.2). The DEGs in G1 were involved in amino acid metabolism, including ascorbate and aldarate metabolism, arginine and proline metabolism, tyrosine metabolism, galactose metabolism, and alanine, aspartate, and glutamate metabolism. Those involved in plant hormone signal transduction, galactose metabolism, protein processing in endoplasmic reticulum, nitrogen metabolism, cysteine and methionine metabolism, and glycerolipid metabolism were significantly enriched in AS. Those in BS were involved in biosyntheses, such as cutin, suberine, wax biosynthesis, and zeatin biosynthesis. The most significant processes were phenylpropanoid biosynthesis and sulfur metabolism in G2, while glutathione metabolism; phenylalanine, tyrosine, and tryptophan biosynthesis; and stilbenoid, diarylheptanoid, and gingerol biosynthesis were most significantly enriched in G3.

3.4. DEGs Involved in Plant Hormone Signal Transduction

In total, 11 DEGs were identified as being involved in plant hormone signal transduction, including the signal transduction pathway of cytokinine, abscisic acid (ABA), brassinosteroid, and salicylic acid (Table 4, Figure 5). Half of them were enriched in the ABA signal transduction pathway, including two DEGs encoding PYR/PYL (ABA receptor), three encoding P2C (protein phosphatase 2C), and one encoding ABF (ABA-responsive element binding factor). The DEGs involved in plant hormone signal transduction had different expression patterns. For example, those encoding NPR1 (nonexpresser of pathogenesis-related genes), BKI1 (A leucine-rich repeat receptor serine/threonine kinase that could perceive brassinosteroids at the plasma membrane called BRI1, and the BRI1-interacting protein called BKI1), and PYR/PYL were all activated under nutrient deficiency in both genotypes, while those encoding AHP (histidine-containing phosphotransfer peotein, Eucgr.J00169.1, and Eucgr.G03093.1) and PP2C (Eucgr.J02003.1, Eucgr.C03732.1, and Eucgr.A02858.1) were activated under high nutrient levels in the high-growth ZQUA44 genotype but were inhibited under low nutrient levels in the low-growth ZQUB15 genotype. The DEGs encoding A-ARR (Eucgr.B03374.1) and ABF (Eucgr.F02337.3) were activated under high nutrient levels in ZQUA44, while there were no significant differences observed in ZQUB15.

3.5. Transcription Factors (TFs) Responding to Nutrient Deficiency

To identify the important TFs responsible for nutrient deficiency, the DEGs from different groups were annotated in the plant transcription factor database (Table 5). In total, 74 DEGs encoding 21 TF families were obtained in all groups in ZQUA44 and ZQUB15. Of all groups, G1 had the most abundant DEGs encoding 10 TFs, followed by AS, which had 25 DEGs encoding 15 TFs. The most abundant TFs were ERF (10) and MYB (10), followed by NAC (8) and WRKY (7). Seven DEGs encoding ERF and six encoding NAC were found in G1, while five encoding WRKY were found in BS. Some TF families were only found in one group; for example, the TF of MIKC_MADS was only found in G3, the TFs of CPP and RAV were only found in BS, the TFs of LBD and SBP were only found in G1, and the TFs of NF-YA, TCP, bZIP, Dof, and B3 were only found in AS.
Further analysis of WRKY encoding genes showed that two DEGs encoding WRKY23 (Eucgr.H00996) and WRKY75 (Eucgr.B03520) were inhibited at the low nutrient level, while the other five DEGs encoding WRKY26 (Eucgr.B04010), WRKY33 (Eucgr.K02940), WRKY50 (Eucgr.C00675), WRKY6 (Eucgr.E04011), and WRKY75 (Eucgr.I01633) were all activated at the low nutrient level (Table 6).

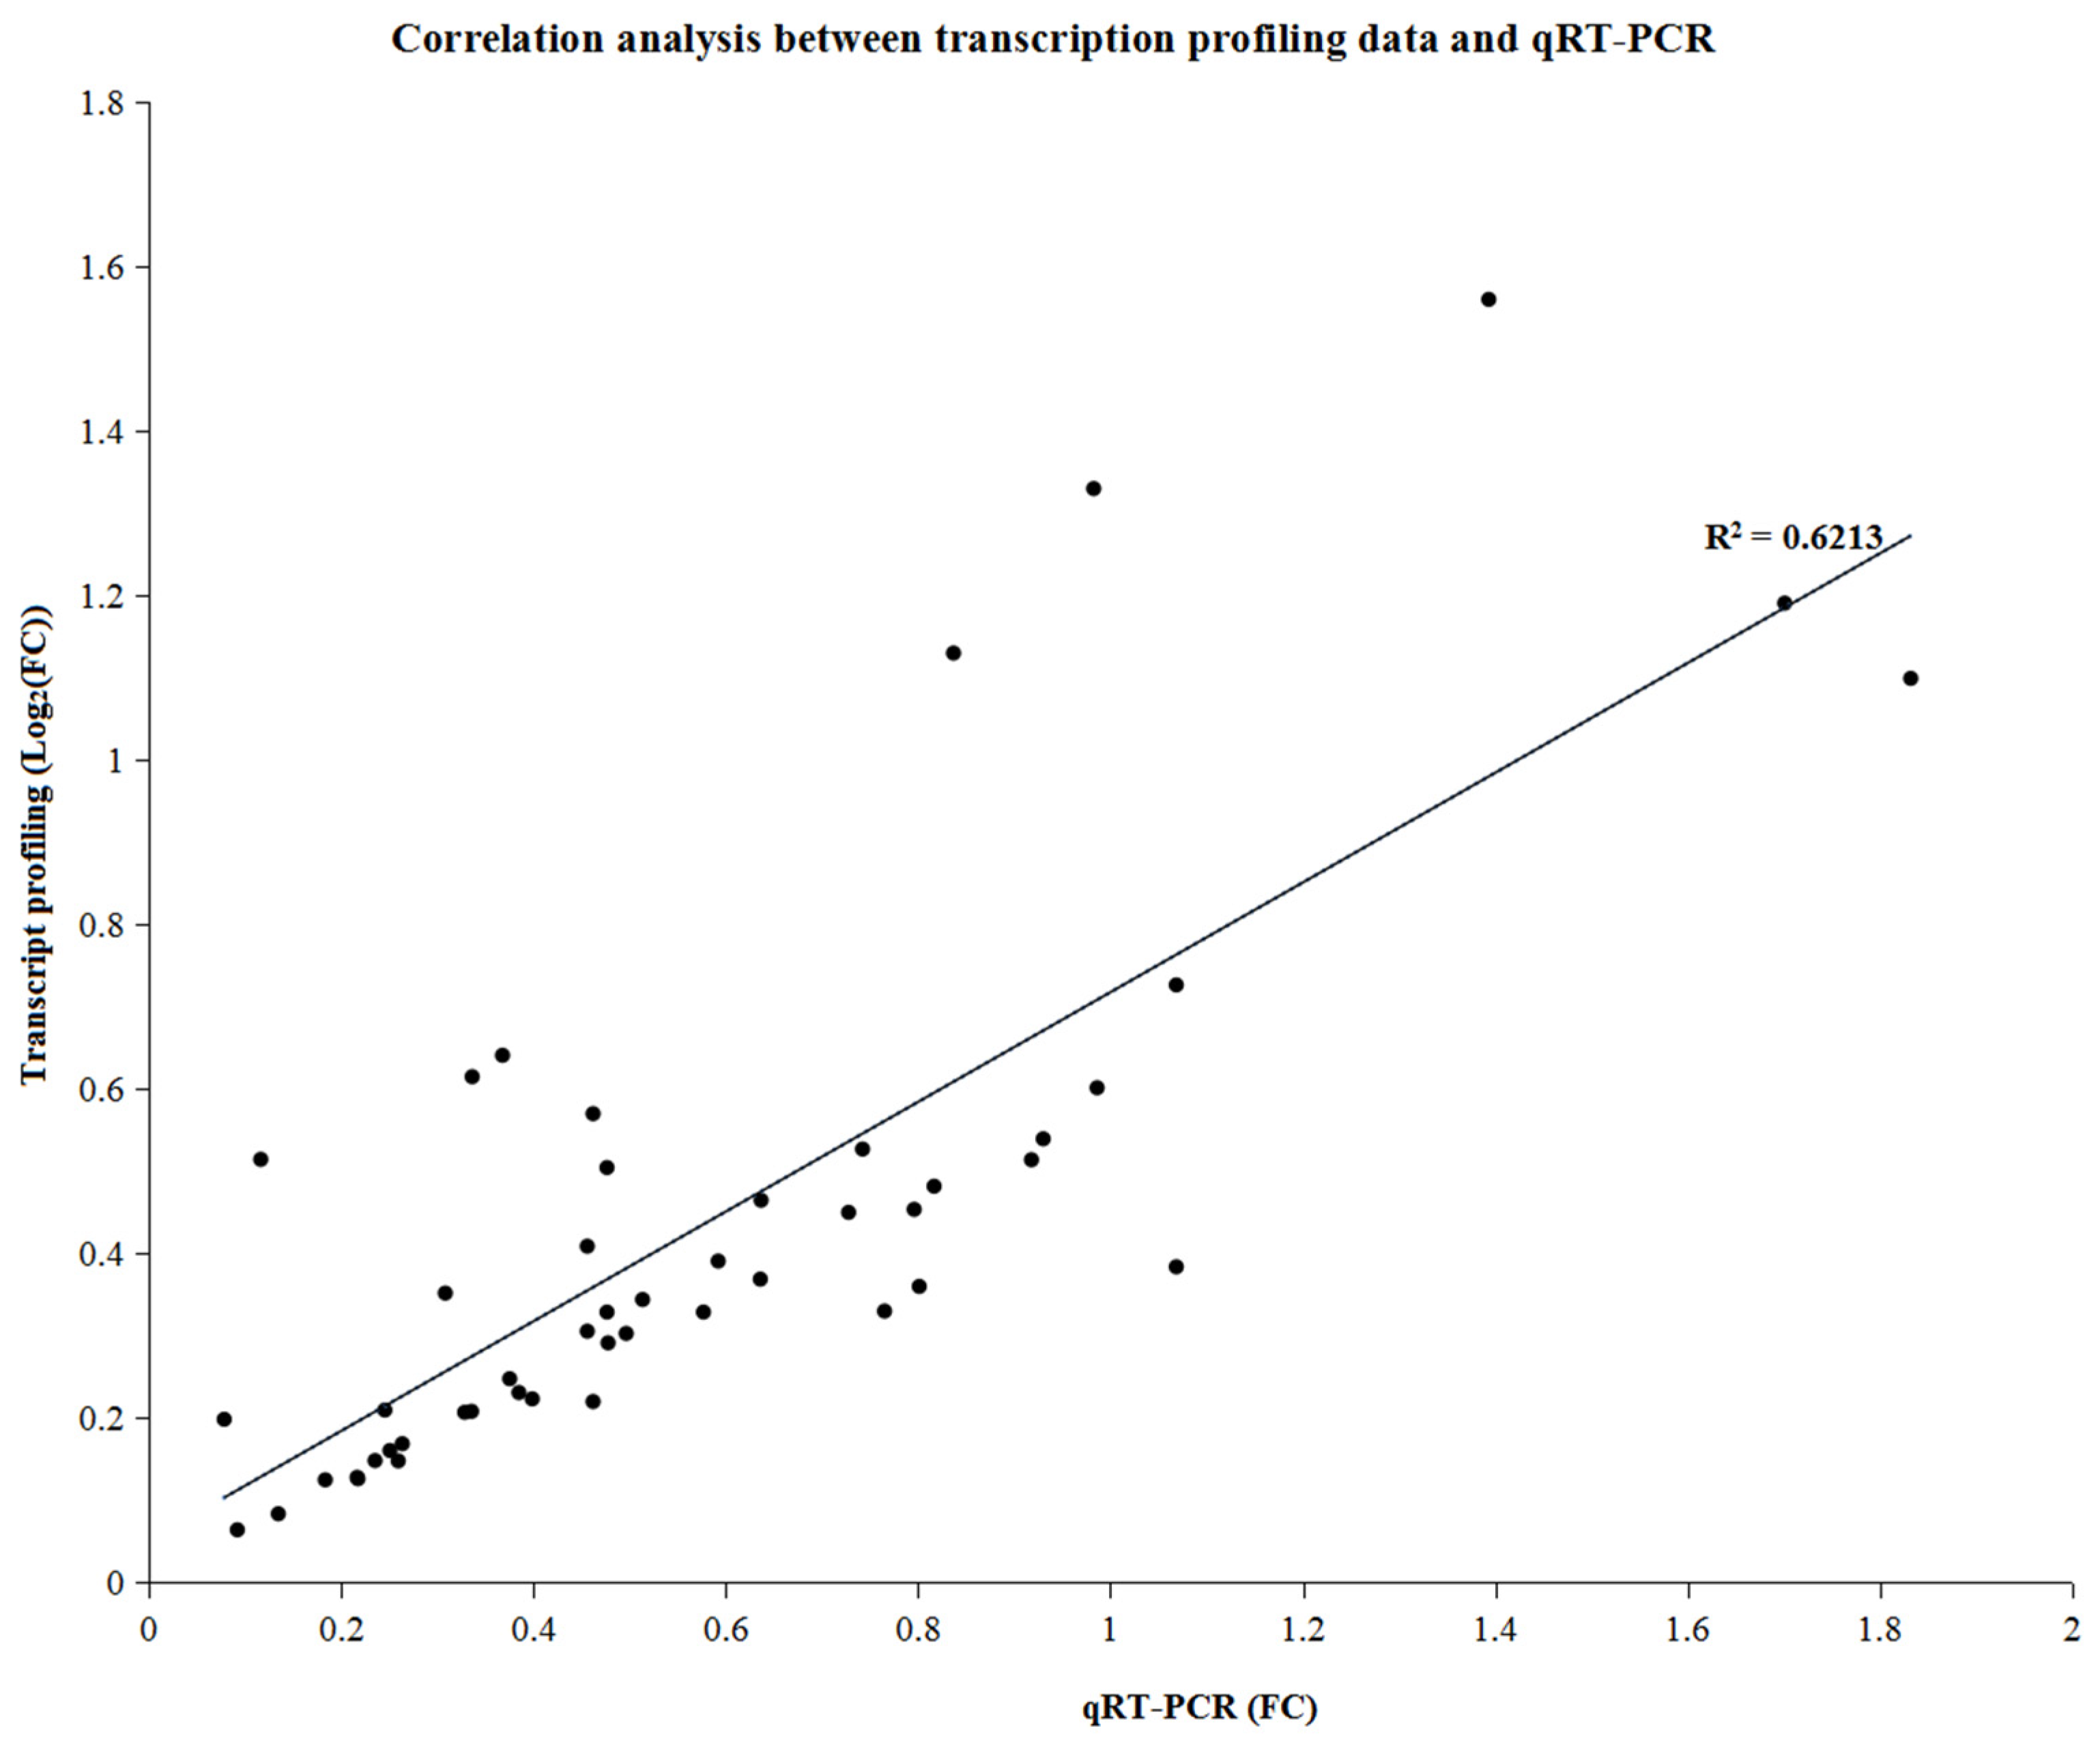
3.6. Validation of RNA Sequencing Results via Quantitative Real-Time Polymerase Chain Reaction (qRT-PCR)

To validate the RNA sequencing results, 10 genes with different expression patterns were randomly selected for qRT-PCR using an Applied Biosystems 7500 fast real-rime PCR system (Applied Biosystems, Waltham, MA, USA). A similar expression pattern was found for all three nutrient treatments for both genotypes when the qRT-PCR results and RNA sequencing data were compared, indicating that the expression results generated by RNA sequencing were reliable and could be used for further study (R2 = 0.6213, Figure 6).

4. Discussion

Comparative transcriptome analyses are powerful for analyzing the genotypes of plants that exhibit different phenotypes under various external treatments [14]. In this study, we compared the transcriptomic differences between two E. urophylla cultivars that show different phenotypes under different nutrient application levels. The phenotypic characteristics exhibited a similar tendency in the two E. urophylla genotypes at low, sufficient, and high nutrient levels. For example, tree height, ground diameter, crown width, and the biomass of different tissues were much lower in both genotypes under low nutrient conditions than under sufficient and high levels, indicating that nutrient availability was the most important factor restricting plant growth, which agreed with previous studies that nutrient limitation significantly restricted plant growth and physiological metabolisms [15,16].
However, the growth traits were much higher for ZQUA44 than for ZQUB15 in all three nutrient levels, indicating that trees with different genotypes may respond differently. This result agrees with prior research on Oryza sativa, Vigna radiata, and Zea may that different individuals have different production under the same nutrient levels [17,18,19,20]. To address this further, we conducted comparative transcriptomic sequencing analyses. The identified DEGs were clustered into different groups with different functions. The DEGs had the same expression pattern in both genotypes and were significantly enriched in glutathione metabolism, flavonoid biosynthesis, and metabolic or biosynthetic processes, indicating that these DEGs may have similar functions when there are underlying nutrient deficiency stresses across clones [21]. The other DEGs had contrasting expression patterns in the two genotypes and were significantly enriched in response to stimulus or stress, indicating that they may be responsible for the nutrient/genotype interaction. Furthermore, the DEGs that were differentially expressed in AS were significantly enriched in response to stimulus or stress, while those in BS were significantly enriched in metabolic or biosynthetic processes, which implies that different genotypes had different DEGs to respond to the same abiotic stresses. DEGs associated with oxidoreductase activity and catalytic activity were also abundant in all five groups. This indicates that different genotypes had similar biological responses when exposed to abiotic stress, although different DEGs were involved. Our results are consistent with the previous study that drought stress induces different key genes and pathways in two wheat (Triticum aestivum L.) varieties [21].
Phytohormones are the key regulators of plant growth and development and are mediators of environmental stress responses [6]. Abscisic acid (ABA) is an essential phytohormone that controls many developmental stages, including seed dormancy, seedling development, flowering, and fruit ripening. ABA levels increase to adapt to abiotic stresses, such as drought, high temperature, chilling, and salinity. Plants can translate environmental stress into a physiological response through ABA signal transduction. Five groups of proteins have been identified in this pathway, including the ABA receptor PYL/PYR protein, PP2C protein, and kinase family SnRK2. P2C, which is a negative regulator of ABA signaling pathways, positively regulates the abiotic stress signaling pathway in herbaceous plants [22]. In our study, three DEGs encoding the PP2C protein were inhibited under nutrient deficiency in ZQUA44, whereas they were activated in ZQUB15. Furthermore, two DEGs encoding the negative regulator of PYL/PYR protein were identified, and both were activated at low nutrient levels in both genotypes. Because the PYL/PYR protein is a negative regulator of PP2C protein, the expression level of PP2C agreed with the pattern in ZQUA44, but this did not occur in ZQUB15, indicating that the genetic variation in the two genotypes may be the reason for the phenotypic variation [21,23].
In addition to phytohormones, many TFs control signal transduction under biotic and abiotic stresses, including the MYB (10), ERF (10), NAC (8), WRKY (7), MYB-related (6), and bHLH (5) families, whose members promote or suppress abiotic stress responses [24,25,26,27,28]. For example, MYBs have been studied in various plant species and have been proven to be related to growth and development and stress responses in plants [29,30,31,32,33,34]; these results agreed with our study that MYB-encoding DEGs may be involved in resistance to nutrient deficiencies. Ten DEGs encoding ERF were obtained in our study, and seven of them were enriched in G1, indicating their role in the nutrient/genotype interaction. Our results are consistent with previous studies that ERFs are one of the most important TF families, and they are involved in various plant-specific processes, such as developmental processes, regulation of metabolism, and the response to biotic and abiotic stresses [35,36]. Members of the WRKY family are essential regulators of plant innate immunity, and they play key roles in regulating biotic and abiotic stress reactions in various plant species [7,37]. Furthermore, a gene encoding WRKY in Larrea tridentata was proven to activate ABA signaling, which plays an essential role in stress resistance [38,39,40,41,42,43,44,45,46]. In poplar, 15 PtWRKYs in leaves were identified as involved in the nitrogen response, and PtWRKY33 was down-regulated in the nitrogen deficiency group [47]. In our study, a DEG encoding WRKY33 was activated in the nutrient deficiency treatment, which was inconsistent with the result in poplar, indicating that homologous genes in different plant species may have different functions. A gene encoding TCP, which plays a key role in cell proliferation in developing tissues and is predicted to be related to tree height growth, was inhibited at low nutrient levels in ZQUA44, which may explain why the tree height of ZQUA44 was restricted to a greater extent than that of ZQUB15 under low nutrient levels [48].
In addition to the phytohormone-related genes and TFs, other genes encoding F-box protein, late embryogenesis abundant (LEA) protein, ammonium transporter 2, cytochrome P450, UDP-glycosyltransferase (UGT), and phenylalanine ammonia-lyase were also identified in this study. F-box protein is related to cell cycle regulation and signal transduction [49]. Several late embryogenesis proteins have been found to be related to resistance to water deficiency; they function by protecting cytoplasmic components [50]. The identification of this gene in our study provides new insight into its possible functions in resistance to nutrient deficiency. Genes encoding ammonium transporter 2 were significantly activated under high nutrient levels in ZQUA44, while no significant differences were observed in ZQUB15, indicating that a higher nutrient level may promote the transport ability of mineral elements in ZQUA44 to maintain their high growth ability [51,52,53]. UGTs can catalytically transfer the glycosyl group from activated donor molecules to specific receptor molecules, and they play important roles in various processes, such as hormone signal transduction and cell wall polysaccharide synthesis [54]. UGTs, together with phytohormones, play a pivotal role in stress resistance by changing the water solubility of the receptor molecule [55,56]. In our study, three DEGs were activated in ZQUA44 and ZQUB15; two were activated under nutrient deficiency in ZQUA44, while six were activated in ZQUB15, indicating that different members of this gene family may play different roles in different genotypes.

5. Conclusions

Our results clearly demonstrate that not only the environmental factors but also the genetic differences play essential roles in tree performance. High-growth genotype ZQUA44 and low-growth genotype ZQUB15 exhibited significant differences in their responses to nutrient starvation in terms of tree height, crown width, and the biomass of different tissues. Transcriptomic profiling indicated that the DEGs showed similar expression trends that may be responsible for resistance to nutrient starvation across genotypes. The different genotypes had different genes that responded to the treatment, and the same genes had different expression patterns between the genotypes. The DEGs showed opposite expression trends, which may be responsible for the nutrient/genotype interaction. The DEGs in AS and BS may be genotype-specific; they were involved in response to stimulus or stress in ZQUA44 and were involved in metabolic or synthesis processes in ZQUB15. These findings provide a genetic basis for the breeding of E. urophylla with tolerance to nutrient deficiency.

Supplementary Materials

The following supporting information can be downloaded at: https://www.mdpi.com/article/10.3390/genes15010060/s1, Figure S1: Leaves at different treatments of ZQUA44 and ZQUB15; Table S1: Primers for qRT-PCR validation.

Author Contributions

Conceptualization, H.Y. and W.P.; methodology, H.Y.; validation, X.Y. and H.Y.; investigation, H.Y., X.Y., F.X., H.L., B.Z., B.X. and X.C.; resources, W.Z.; data curation, H.Y. and X.Y.; writing—original draft preparation, X.Y. and F.X.; writing—review and editing, H.Y.; funding acquisition, W.P. All authors have read and agreed to the published version of the manuscript.

Funding

The research was supported by the Key Research and Development (R&D) Projects for the 14th Five-Year Plan (2022YFD2200203), National Key Research and Development Plan (2016YFD0600501), and Forestry Science and Technology Innovation Project of Guangdong Province, China (2016KJCX002). The financial supporters did not play any role in the design of the study, data collection, and analysis of the data or writing of the manuscript.

Institutional Review Board Statement

Not applicable.

Informed Consent Statement

Not applicable.

Data Availability Statement

The data obtained and used in this study are available from the corresponding author upon reasonable request. The data are not publicly available due to privacy.

Acknowledgments

The authors would like to express their special gratitude to all of the funders for their financial assistance.

Conflicts of Interest

The authors declare no conflicts of interest.

References

  1. Maathuis, F.J. Physiological functions of mineral macronutrients. Curr. Opin. Plant Biol. 2009, 12, 250–258. [Google Scholar] [CrossRef] [PubMed]
  2. Brix, H. Effects of thinning and nitrogen fertilization on growth of Douglas-fir: Relative contribution of foliage quantity and efficiency. Can. J. For. Res. 1983, 13, 167–175. [Google Scholar] [CrossRef]
  3. Gerloff, G.C. Comparative Mineral Nutrition of Plants. Annu. Rev. Plant Physiol. 1963, 14, 107–124. [Google Scholar] [CrossRef]
  4. Siddiqi, M.Y.; Glass, A.D.M. Utilization index: A modified approach to the estimation and comparison of nutrient utilization efficiency in plants. J. Plant Nutr. 2008, 4, 289–302. [Google Scholar] [CrossRef]
  5. Wang, Z.; Gerstein, M.; Snyder, M. RNA-Seq: A revolutionary tool for transcriptomics. Nat. Rev. Genet. 2009, 10, 57–63. [Google Scholar] [CrossRef] [PubMed]
  6. Armengaud, P.; Breitling, R.; Amtmann, A. The Potassium-Dependent Transcriptome of Arabidopsis Reveals a Prominent Role of Jasmonic Acid in Nutrient Signaling. Plant Physiol. 2004, 136, 2556–2576. [Google Scholar] [CrossRef] [PubMed]
  7. Tao, X.; Fang, Y.; Xiao, Y.; Jin, Y.; Ma, X.; Zhao, Y.; He, K.; Zhao, H.; Wang, H. Comparative transcriptome analysis to investigate the high starch accumulation of duckweed (Landoltia punctata) under nutrient starvation. Biotechnol. Biofuels 2013, 6, 72. [Google Scholar] [CrossRef] [PubMed]
  8. Wang, Z.; Li, S.; Yuan, M.; Zhou, K. De novo transcriptome assembly for pericarp in Litchi chinesis Sonn. cv. Feizixiao and identification of differentially expressed genes in response to Mg Foliar Nutrient. Sci. Hortic. 2017, 226, 59–67. [Google Scholar] [CrossRef]
  9. Pandey, G.K.; Cheong, Y.H.; Kim, K.; Grant, J.J.; Li, L.; Hung, W.; D’Angelo, C.; Weinl, S.; Kudla, J.; Luan, S. The Calcium Sensor Calcineurin B-Like 9 Modulates Abscisic Acid Sensitivity and Biosynthesis in Arabidopsis. Plant Cell 2004, 16, 1912–1924. [Google Scholar] [CrossRef]
  10. Poorter, L.; Markesteijn, L. Seedling Traits Determine Drought Tolerance of Tropical Tree Species. Biotropica 2008, 40, 321–331. [Google Scholar] [CrossRef]
  11. Kim, D.; Pertea, G.; Trapnell, C.; Pimentel, H.; Kelley, R.; Salzberg, S. TopHat2: Accurate alignment of transcriptomes in the presence of insertions, deletions and gene fusions. Genome Biol. 2013, 14, R36. [Google Scholar] [CrossRef] [PubMed]
  12. Guttman, M.; Garber, M.; Levin, J.; Donaghey, J.; Robinson, J.; Adiconis, X.; Fan, L.; Koziol, M.; Gnirke, A.; Nusbaum, C.; et al. Correction: Corrigendum: Ab initio reconstruction of cell type–specific transcriptomes in mouse reveals the conserved multi-exonic structure of lincRNAs. Nat. Biotechnol. 2010, 28, 756. [Google Scholar]
  13. Trapnell, C.; Williams, B.; Pertea, G.; Mortazavi, A.; Kwan, G.; van Baren, M.; Salzberg, S.; Wold, B.; Pachter, L. Transcript assembly and quantification by RNA-Seq reveals unannotated transcripts and isoform switching during cell differentiation. Nat. Biotechnol. 2010, 28, 511–515. [Google Scholar] [CrossRef] [PubMed]
  14. Dal Santo, S.; Palliotti, A.; Zenoni, S.; Tornielli, G.B.; Fasoli, M.; Paci, P.; Tombesi, S.; Frioni, T.; Silvestroni, O.; Bellincontro, A.; et al. Distinct transcriptome responses to water limitation in isohydric and anisohydric grapevine cultivars. BMC Genom. 2016, 17, 815. [Google Scholar] [CrossRef] [PubMed]
  15. Zhu, G.; Wang, S.; Huang, Z.; Zhang, S.; Liao, Q.; Zhang, C.; Lin, T.; Qin, M.; Peng, M.; Yang, C.; et al. Rewiring of the Fruit Metabolome in Tomato Breeding. Cell 2018, 172, 249–261. [Google Scholar] [CrossRef] [PubMed]
  16. Connorton, J.; Balk, J. Iron Biofortification of Staple Crops: Lessons and Challenges in Plant Genetics. Plant Cell Physiol. 2019, 60, 1447–1456. [Google Scholar] [CrossRef]
  17. Li, D.; Wang, H.; Wang, M.; Li, G.; Chen, Z.; Leiser, W.L.; Wei, T.M.; Lu, X.; Wang, M.; Chen, S.; et al. Genetic Dissection of Phosphorus Use Efficiency in a Maize Association Population under Two P Levels in the Field. Int. J. Mol. Sci. 2021, 22, 9311. [Google Scholar] [CrossRef]
  18. Lu, Q.; Zhang, M.; Niu, X.; Wang, S.; Xu, Q.; Feng, Y.; Wang, C.; Deng, H.; Yuan, X.; Yu, H.; et al. Genetic variation and association mapping for 12 agronomic traits in indica rice. BMC Genom. 2015, 16, 1067. [Google Scholar] [CrossRef]
  19. Kothari, D.; Pargaien, N.; Tewari, L.M.; Dikshit, H.; Mishra, G.; Aski, M.; Bansal, R.; Gupta, S.; Kumar, S.; Nair, R. Genetic Variation for Traits Related to Phosphorus Use Efficiency in Vigna Species. Agronomy 2023, 13, 305. [Google Scholar] [CrossRef]
  20. Zulfiqar, A.; Naseer, S.; Saleem, A.; Sabar, M.; Ahmed, S.; Sardar, R.; Shahzadi, F.; Raza, Q. Genetic diversity studies for grain iron and zinc content analysis for Elite rice (Oryza sativa L.) genotype by using SSR markers. J. Food Compos. Anal. 2023, 115, 104816. [Google Scholar] [CrossRef]
  21. Niu, Y.; Li, J.; Sun, F.; Song, T.; Han, B.; Liu, Z.; Su, P. Comparative transcriptome analysis reveals the key genes and pathways involved in drought stress response of two wheat (Triticum aestivum L.) varieties. Genomics 2023, 115, 110688. [Google Scholar] [CrossRef] [PubMed]
  22. Singh, A.; Jha, S.K.; Bagri, J.; Pandey, G.K. ABA Inducible Rice Protein Phosphatase 2C Confers ABA Insensitivity and Abiotic Stress Tolerance in Arabidopsis. PLoS ONE 2015, 10, e125168. [Google Scholar] [CrossRef] [PubMed]
  23. Gibson, G. The environmental contribution to gene expression profiles. Nat. Rev. Genet. 2008, 9, 575–581. [Google Scholar] [CrossRef] [PubMed]
  24. Chen, L.; Zhao, Y.; Xu, S.; Zhang, Z.; Xu, Y.; Zhang, J.; Chong, K. OsMADS57 together with OsTB1 coordinates transcription of its target OsWRKY94 and D14 to switch its organogenesis to defense for cold adaptation in rice. New Phytol. 2018, 218, 219–231. [Google Scholar] [CrossRef] [PubMed]
  25. Hu, Z.; Wang, R.; Zheng, M.; Liu, X.; Meng, F.; Wu, H.; Yao, Y.; Xin, M.; Peng, H.; Ni, Z.; et al. TaWRKY51 promotes lateral root formation through negative regulation of ethylene biosynthesis in wheat (Triticum aestivum L.). Plant J. 2018, 96, 372–388. [Google Scholar] [CrossRef] [PubMed]
  26. Park, D.; Shim, Y.; Gi, E.; Lee, B.; An, G.; Kang, K.; Paek, N. The MYB-related transcription factor RADIALIS-LIKE3 (OsRL3) functions in ABA-induced leaf senescence and salt sensitivity in rice. Environ. Exp. Bot. 2018, 156, 86–95. [Google Scholar] [CrossRef]
  27. Nan, H.; Gao, L. Genome-Wide Analysis of WRKY Genes and Their Response to Hormone and Mechanic Stresses in Carrot. Front. Genet. 2019, 10, 363. [Google Scholar] [CrossRef]
  28. Zhu, D.; Hou, L.; Xiao, P.; Guo, Y.; Deyholos, M.K.; Liu, X. VvWRKY30, a grape WRKY transcription factor, plays a positive regulatory role under salinity stress. Plant Sci. 2019, 280, 132–142. [Google Scholar] [CrossRef]
  29. Takahashi, N.; Ogita, N.; Takahashi, T.; Taniguchi, S.; Tanaka, M.; Seki, M.; Umeda, M. A regulatory module controlling stress-induced cell cycle arrest in Arabidopsis. eLife 2019, 8, e43944. [Google Scholar] [CrossRef]
  30. Gonzalez, A.; Zhao, M.; Leavitt, J.M.; Lloyd, A.M. Regulation of the anthocyanin biosynthetic pathway by the TTG1/bHLH/Myb transcriptional complex in Arabidopsis seedlings. Plant J. 2008, 53, 814–827. [Google Scholar] [CrossRef]
  31. Zhang, Y.; Zhang, J.; Shao, C.; Bao, Z.; Liu, G.; Bao, M. Single-repeat R3 MYB transcription factors from Platanus acerifolia negatively regulate trichome formation in Arabidopsis. Planta 2019, 249, 861–877. [Google Scholar] [CrossRef] [PubMed]
  32. Qi, T.; Song, S.; Ren, Q.; Wu, D.; Huang, H.; Chen, Y.; Fan, M.; Peng, W.; Ren, C.; Xie, D. The Jasmonate-ZIM-domain proteins interact with the WD-Repeat/bHLH/MYB complexes to regulate Jasmonate-mediated anthocyanin accumulation and trichome initiation in Arabidopsis thaliana. Plant Cell 2011, 23, 1795–1814. [Google Scholar] [CrossRef] [PubMed]
  33. Stracke, R.; Werber, M.; Weisshaar, B. The R2R3-MYB gene family in Arabidopsis thaliana. Curr. Opin. Plant Biol. 2001, 4, 447–456. [Google Scholar] [CrossRef] [PubMed]
  34. Chen, Y.S.; Chao, Y.C.; Tseng, T.W.; Huang, C.K.; Lo, P.C.; Lu, C.A. Two MYB-related transcription factors play opposite roles in sugar signaling in Arabidopsis. Plant Mol. Biol. 2017, 93, 299–311. [Google Scholar] [CrossRef] [PubMed]
  35. Rashid, M.; Guangyuan, H.; Guangxiao, Y.; Hussain, J.; Xu, Y. AP2/ERF Transcription Factor in Rice: Genome-Wide Canvas and Syntenic Relationships between Monocots and Eudicots. Evol. Bioinform. Online 2012, 8, 321–355. [Google Scholar] [CrossRef] [PubMed]
  36. Nakano, T.; Suzuki, K.; Fujimura, T.; Shinshi, H. Genome-wide analysis of the ERF gene family in Arabidopsis and rice. Plant Physiol. 2006, 140, 411–432. [Google Scholar] [CrossRef] [PubMed]
  37. Shimono, M.; Sugano, S.; Nakayama, A.; Jiang, C.; Ono, K.; Toki, S.; Takatsuji, H. Rice WRKY45 Plays a Crucial Role in Benzothiadiazole-Inducible Blast Resistance. Plant Cell 2007, 19, 2064–2076. [Google Scholar] [CrossRef] [PubMed]
  38. Zou, X.; Seemann, J.R.; Neuman, D.; Shen, Q.J. A WRKY Gene from Creosote Bush Encodes an Activator of the Abscisic Acid Signaling Pathway. J. Biol. Chem. 2004, 279, 55770–55779. [Google Scholar] [CrossRef]
  39. Li, W.; Pang, S.; Lu, Z.; Jin, B. Function and Mechanism of WRKY Transcription Factors in Abiotic Stress Responses of Plants. Plants 2020, 9, 1515. [Google Scholar] [CrossRef]
  40. Sahebi, M.; Hanafi, M.M.; Rafii, M.Y.; Mahmud, T.; Azizi, P.; Osman, M.; Abiri, R.; Taheri, S.; Kalhori, N.; Shabanimofrad, M.; et al. Improvement of Drought Tolerance in Rice (Oryza sativa L.): Genetics, Genomic Tools, and the WRKY Gene Family. BioMed Res. Int. 2018, 2018, 3158474. [Google Scholar] [CrossRef]
  41. Wang, C.T.; Ru, J.N.; Liu, Y.W.; Li, M.; Zhao, D.; Yang, J.F.; Fu, J.D.; Xu, Z.S. Maize WRKY Transcription Factor ZmWRKY106 Confers Drought and Heat Tolerance in Transgenic Plants. Int. J. Mol. Sci. 2018, 19, 3046. [Google Scholar] [CrossRef] [PubMed]
  42. Shi, W.Y.; Du, Y.T.; Ma, J.; Min, D.H.; Jin, L.G.; Chen, J.; Chen, M.; Zhou, Y.B.; Ma, Y.Z.; Xu, Z.S.; et al. The WRKY Transcription Factor GmWRKY12 Confers Drought and Salt Tolerance in Soybean. Int. J. Mol. Sci. 2018, 19, 4087. [Google Scholar] [CrossRef] [PubMed]
  43. Gao, Y.F.; Liu, J.K.; Yang, F.M.; Zhang, G.Y.; Wang, D.; Zhang, L.; Ou, Y.B.; Yao, Y.A. The WRKY transcription factor WRKY8 promotes resistance to pathogen infection and mediates drought and salt stress tolerance in Solanum lycopersicum. Physiol. Plant 2020, 168, 98–117. [Google Scholar] [CrossRef] [PubMed]
  44. Villano, C.; Esposito, S.; D’Amelia, V.; Garramone, R.; Alioto, D.; Zoina, A.; Aversano, R.; Carputo, D. WRKY genes family study reveals tissue-specific and stress-responsive TFs in wild potato species. Sci. Rep. 2020, 10, 7196. [Google Scholar] [CrossRef] [PubMed]
  45. Banerjee, A.; Roychoudhury, A. WRKY proteins: Signaling and regulation of expression during abiotic stress responses. Sci. World J. 2015, 2015, 807560. [Google Scholar] [CrossRef] [PubMed]
  46. Jiang, J.; Ma, S.; Ye, N.; Jiang, M.; Cao, J.; Zhang, J. WRKY transcription factors in plant responses to stresses. J. Integr. Plant Biol. 2017, 59, 86–101. [Google Scholar] [CrossRef] [PubMed]
  47. Chen, Y.; Kong, X.; Yang, L.; Fu, M.; Zhang, S. Genome-Wide Identification of WRKY Family Genes and the Expression Profiles in Response to Nitrogen Deficiency in Poplar. Genes 2022, 13, 2324. [Google Scholar] [CrossRef]
  48. Martín-Trillo, M.; Cubas, P. TCP genes: A family snapshot ten years later. Trends Plant Sci. 2010, 15, 31–39. [Google Scholar] [CrossRef]
  49. Craig, K.L.; Tyers, M. The F-box: A new motif for ubiquitin dependent proteolysis in cell cycle regulation and signal transduction. Prog. Biophys. Mol. Biol. 1999, 72, 299–328. [Google Scholar] [CrossRef]
  50. Singh, S.; Cornilescu, C.C.; Tyler, R.C.; Cornilescu, G.; Tonelli, M.; Lee, M.S.; Markley, J.L. Solution structure of a late embryogenesis abundant protein (LEA14) from Arabidopsis thaliana, a cellular stress-related protein. Protein Sci. 2005, 14, 2601–2609. [Google Scholar] [CrossRef]
  51. Wu, X.; Liu, T.; Zhang, Y.; Duan, F.; Neuhauser, B.; Ludewig, U.; Schulze, W.X.; Yuan, L. Ammonium and nitrate regulate NH4+ uptake activity of Arabidopsis ammonium transporter AtAMT1;3 via phosphorylation at multiple C-terminal sites. J. Exp. Bot. 2019, 70, 4919–4930. [Google Scholar] [CrossRef] [PubMed]
  52. Zhu, Y.; Huang, X.; Hao, Y.; Su, W.; Liu, H.; Sun, G.; Chen, R.; Song, S. Ammonium Transporter (BcAMT1.2) Mediates the Interaction of Ammonium and Nitrate in Brassica campestris. Front. Plant Sci. 2019, 10, 1776. [Google Scholar] [CrossRef] [PubMed]
  53. You, S.; Wang, Y.; Li, Y.; Li, Y.; Tan, P.; Wu, Z.; Shi, W.; Song, Z. Cloning and Functional Determination of Ammonium Transporter PpeAMT3;4 in Peach. BioMed Res. Int. 2020, 2020, 2147367. [Google Scholar] [CrossRef] [PubMed]
  54. Ross, J.; Li, Y.; Lim, E.; Bowles, D.J. Higher plant glycosyltransferases. Genome Biol. 2001, 2, s3001–s3004. [Google Scholar] [CrossRef]
  55. Wang, H.; Wang, Z.; Zhang, M.; Jia, B.; Heng, W.; Ye, Z.; Zhu, L.; Xu, X. Transcriptome sequencing analysis of two different genotypes of Asian pear reveals potential drought stress genes. Tree Genet. Genomes 2018, 14, 40. [Google Scholar] [CrossRef]
  56. Li, Y.; Xu, B.; Du, Q.; Zhang, D. Association genetics and expression patterns of a CBF4 homolog in Populus under abiotic stress. Mol. Genet. Genom. 2015, 290, 913–928. [Google Scholar] [CrossRef]
Figure 1. The growth traits at low nutrient application levels (T1), sufficient nutrient level (T2), and high nutrient level (CK) in genotypes ZQUA44 and ZQUB15. (a) tree height; (b) ground diameter; (c) crown width; (d) biomass of different treatments in different genotypes. The lowercase letter ab and the capital letter AB represent the significant difference between the treatments of ZQUA44 and ZQUB15, respectively. The “*” indicates the significant difference between ZQUA44 and ZQUB15 at the same treatments. The “ns” indicates the no significant difference were found between ZQUA44 and ZQUB15.
Genes 15 00060 g001
Figure 2. Venn analysis of different genotypes at different treatments. A: ZQUA44; B: ZQUB15. T1: treatment of low nutrient level; T2: treatment of sufficient nutrient level; CK: treatment of high nutrient level. AT1 indicates the treatment of low nutrient levels in genotype ZQUA44; AT2 indicates the treatment of sufficient nutrient levels in genotype ZQUA44; ACK indicates the treatment of high nutrient levels in genotype ZQUA44; BT1 indicates the treatment of low nutrient levels in genotype ZQUB15; BT2 indicates the treatment of sufficient nutrient level on genotype ZQUB15; BCK indicates the treatment of high nutrient level on genotype ZQUB15. The labels are the same as below.
Genes 15 00060 g002
Figure 3. Cluster analysis of the common differentially expressed genes in ZQUA44 and ZQUB15. The ordinate is the value of the expression value after logarithmic centralization correction and the red lines indicate the value is zero. The blue lines represent the relative corrected gene expression levels of all genes in this cluster under different experimental conditions.
Genes 15 00060 g003
Figure 4. Gene Ontology analysis of differentially expressed genes (DEGs) from different expression groups. G1 indicates the DEGs inhibited at low nutrient treatment in ZQUA44 and activated in ZQUB15; G3 implicates the DEGs activated at low nutrient treatment in both genotypes; AS represents DEGs identified in ZQUA44; BS indicates DEGs identified in ZQUB15. The p-values were used for the heatmap after the calculation by −lgP. Red indicates the higher significance of the GO term, and blue indicates the lower significance of the GO term.
Genes 15 00060 g004
Figure 5. Analysis of important plant hormone signal transduction pathways related to nutrient treatment. The normalized expression levels were used for heatmap visualization. Red indicates the higher expression levels of DEGs, and blue indicates the lower expression levels of DEGs.
Genes 15 00060 g005
Figure 6. Correlation analysis between RNA sequencing results and quantitative real-time polymerase chain reaction.
Genes 15 00060 g006
Table 1. Sequencing and assembly statistics for the nine transcriptome data of two E. urophylla genotypes of nutrient treatment.
SampleIDNo. of Raw Reads (107)No. of Clean Reads (107)No. of Clean Basepairs (106)No. of Mapped Reads (107)Uniquely Mapped (107)Mapped Percentage (%)
ZQUA44T1_19.499.1813.555.135.0054.48
ZQUA44T1_29.068.7813.114.774.6352.76
ZQUA44T1_39.739.4914.244.093.9441.53
ZQUA44T2_19.609.2813.674.914.7951.58
ZQUA44T2_29.359.0813.573.793.6239.82
ZQUA44T2_310.4710.1115.175.465.3252.66
ZQUA44CK_110.289.8914.855.725.5756.27
ZQUA44CK_29.188.8413.074.514.3348.91
ZQUA44CK_38.818.5812.823.633.5040.75
ZQUB15T1_19.839.5114.054.093.9341.35
ZQUB15T1_29.709.3413.954.704.5648.81
ZQUB15T1_38.428.1512.213.373.2640.01
ZQUB15T2_19.589.2213.594.994.8752.75
ZQUB15T2_28.768.5212.733.363.2437.98
ZQUB15T2_310.5810.3015.374.304.1540.34
ZQUB15CK_18.478.2212.273.213.0737.37
ZQUB15CK_28.978.6812.964.294.1948.24
ZQUB15CK_311.1110.7216.045.114.9946.64
Table 2. Annotation of molecular function of differentially expressed genes at different groups.
Groups of DEGsGO TermDescriptionNumber of Enriched DEGsp-ValueFDR
G1GO:0016701oxidoreductase activity, acting on single donors with incorporation of molecular oxygen54.00 × 10−60.001
G1GO:0003824catalytic activity800.00030.039
G1GO:0016757transferase activity, transferring glycosyl groups110.000450.039
G1GO:0016563transcription activator activity60.000740.048
G2GO:0016491oxidoreductase activity71.90 × 10−50.0001
G2GO:0003824catalytic activity130.00150.0042
G3GO:0003824catalytic activity667.00 × 10−121.20 × 10⁻⁹
G3GO:0016787hydrolase activity271.10 × 10−50.00094
G3GO:0016491oxidoreductase activity161.80 × 10−50.0011
G3GO:0004091carboxylesterase activity83.40 × 10−50.0015
ATGO:0003824catalytic activity968.50 × 10−82.40 × 10⁻⁵
ATGO:0016491oxidoreductase activity254.90 × 10−60.00069
ATGO:0005215transporter activity220.000140.013
ATGO:0046527glucosyltransferase activity60.000240.017
ATGO:0022892substrate- transporter activity170.000350.018
ATGO:0016706oxidoreductase activity, acting on paired donors, with incorporation or reduction of molecular oxygen, 2-oxoglutarate as one donor, and incorporation of one atom each of oxygen into both donors50.000370.018
ATGO:0022857transmembrane transporter activity170.00070.028
ATGO:0016705oxidoreductase activity, acting on paired donors, with incorporation or reduction of molecular oxygen60.00160.047
ATGO:0022891substrate- transmembrane transporter activity140.00170.047
ATGO:0016758transferase activity, transferring hexosyl groups80.00140.047
BTGO:0003824catalytic activity842.00 × 10−84.00 × 10⁻⁶
BTGO:0016491oxidoreductase activity225.90 × 10−60.0006
BTGO:0008194UDP-glycosyltransferase activity82.10 × 10−50.0014
BTGO:0016758transferase activity, transferring hexosyl groups97.20 × 10−50.0037
BTGO:0016757transferase activity, transferring glycosyl groups100.000520.021
BTGO:0046527glucosyltransferase activity50.000740.025
BTGO:0016209antioxidant activity50.00110.033
BTGO:0016765transferase activity, transferring alkyl or aryl (other than methyl) groups50.00140.036
Table 3. Significant KEGG pathways enriched at different groups.
GroupsKEGG PathwayIDDEGs Numberp-ValueQ-Value
G1Ascorbate and aldarate metabolismath0005340.00020.0085
G1Arginine and proline metabolismath0033030.00240.0547
G1Tyrosine metabolismath0035020.01640.2424
G1Galactose metabolismath0005220.02600.2424
G1Alanine, aspartate and glutamate metabolismath0025020.02980.2424
G1Limonene and pinene degradationath0090310.03460.2424
G1Monoterpenoid biosynthesisath0090210.03770.2424
G1Metabolic pathwaysath01100170.04390.2471
G2Phenylpropanoid biosynthesisath0094020.00400.0202
G2Sulfur metabolismath0092010.02490.0623
G3Phenylalanine, tyrosine and tryptophan biosynthesisath0040020.01110.1867
G3Stilbenoid, diarylheptanoid and gingerol biosynthesisath0094510.02430.1867
G3Metabolic pathwaysath01100120.025150.1867
G3Glutathione metabolismath0048020.03250.1867
ASGalactose metabolismath0005230.00300.0938
ASPlant hormone signal transductionath0407560.00630.0938
ASProtein processing in endoplasmic reticulumath0414150.00720.0938
ASMetabolic pathwaysath01100210.01120.1088
ASNitrogen metabolismath0091020.02880.1991
ASCysteine and methionine metabolismath0027030.03060.1991
ASGlycerolipid metabolismath0056120.04140.2308
BSCutin, suberine and wax biosynthesisath0007320.00760.1249
BSZeatin biosynthesisath0090820.01090.1249
Table 4. Differentially expressed genes involved in plant hormone signal transduction pathways.
Gene IDAT1
(FPKM)
AT2
(FPKM)
ACK
(FPKM)
BT1
(FPKM)
BT2
(FPKM)
BCK
(FPKM)
UniprotSymbolSubcluster
Eucgr.A014860.640.876.354.082.924.94Q5SN75P2C08sub4
Eucgr.A028580.240.309.6510.761.753.41Q9FLI3P2C75sub4
Eucgr.C0373221.0024.4476.2846.3823.8040.61P49597P2C56sub1
Eucgr.F002530.550.510.000.700.000.00Q9FX08P2C12sub6
Eucgr.H0408716.26226.0035.919.7415.8114.61Q3EAF9P2C49sub1
Eucgr.J020038.73181.0083.0256.7626.5760.24Q9ZW21P2C24sub4
Eucgr.C033371222.611033.70638.0437.2957.41105.58Q9ZRA4AB19Asub3
Eucgr.C035361079.85930.58667.89227.95439.956177.00Q9ZRA4AB19Asub3
Eucgr.D0060658.97124.94334.92267.52238.79182.00Q0534912KDsub4
Eucgr.I012763.243.831.877.7010.8026.74Q6NMM0SAU61sub4
Eucgr.F0320838.001.290.672.780.740.95Q9SQ80G2OX1sub6
Eucgr.F0412522.9032.458.6510.034.303.94P46687GASA3sub3
Eucgr.K0247220.4620.9018.74117.0041.9258.02Q6NMQ7GASA6sub5
Eucgr.F0019213.5717.6327.3438.6523.7414.97Q8LC30RAP21sub1
Eucgr.F023171.080.471.5558.001.660.87O22174ERF08sub1
Eucgr.F026910.040.3623.0034.000.000.19Q70II3EF110sub1
Eucgr.H016590.020.050.531.380.000.00Q9SZ06EF109sub1
Eucgr.K0012819.279.6716.375.9518.513.04Q9LY05EF106sub1
Eucgr.F042030.130.208.694.300.270.15Q9FGF8ABR1sub4
Eucgr.G019700.150.373.516.091.740.32Q9LYU3EF113sub4
Eucgr.H039655.2012.2420.3518.4721.786.23P42736RAP23sub4
Eucgr.C0422130.524.8214.0022.9711.4429.80Q9XI33WIN1sub6
Eucgr.F023197.735.567.5312.266.012.54Q8LC30RAP21sub6
Eucgr.I0042212.9211.513.9914.4120.3113.61O65665ERF60sub6
Eucgr.K0012669.1762.2647.4389.3759.1742.78Q8VY90EF105sub6
Eucgr.A0114618.4111.396.0413.6812.625.29Q8L8B8LOG3sub6
Eucgr.B023215.677.4735.511.9913.256.79O81077ABAH2sub1
Eucgr.C015247.034.492.7823.3914.2712.84Q9SKK0EBF1sub1
Eucgr.C0315733.4738.3613.1525.7930.2812.39Q9FUJ1CKX7sub6
Eucgr.E0114913.8213.4323.6619.399.186.47Q949P1ABAH1sub1
Eucgr.G014370.040.291.746.041.811.43Q9LJK2ABAH4sub1
Eucgr.G030933.611.721.543.810.470.53Q8S8E3PYL6sub6
Eucgr.I0112715.2421.069.7527.5826.978.78Q8W3P8AOGsub1
Eucgr.I012010.140.610.110.423.413.39Q6RYA0SABP2sub4
Eucgr.J001696.764.552.085.091.230.54O80920PYL4sub6
Eucgr.K0247220.4620.918.7411.1741.9258.02Q6NMQ7GASA6sub5
Eucgr.B033741.382.094.491.701.410.96Q9ZWS9ARR3sub1
Eucgr.B0262011.6426.0957.13113.3490.2095.91Q39182DEF02sub2
Eucgr.H05052223.79163.36302.39893.653003.643268.99Q07502DEFsub4
Table 5. Differentially expressed genes encoding transcription factors in different groups.
Transcription FactorsG1G2G3ASBS
C2H2 1 1
CPP 1
ERF7 12
MYB4 312
NAC6 11
RAV 1
WRKY 25
B3 3
bHLH3 11
bZIP 2
C3H3 2
Dof 2
G2-like 3
HD-ZIP1 1
HSF11 2
MYB_related1 32
NF-YA 1
TCP 1
MIKC_MADS 1
LBD1
SBP1
Table 6. Differentially expressed transcription factors in different groups.
Groups of DEGsGene IDGene NamesT1T2CKlog2FPKM
(T1/CK)
p Valuelog2FPKM
(T2/CK)
p Value
ATEucgr.H00996WRKY231.574.828.19−2.380.00−0.760.18
ATEucgr.B03520WRKY756.939.6724.10−1.800.00−1.320.03
BTEucgr.B04010WRKY2615.398.774.791.680.000.870.07
BTEucgr.K02940WRKY338.015.622.841.500.000.990.06
BTEucgr.C00675WRKY5026.2117.537.471.810.001.230.02
BTEucgr.E04011WRKY64.212.481.071.980.001.220.08
BTEucgr.I01633WRKY751.724.700.541.660.163.110.01
Disclaimer/Publisher’s Note: The statements, opinions and data contained in all publications are solely those of the individual author(s) and contributor(s) and not of MDPI and/or the editor(s). MDPI and/or the editor(s) disclaim responsibility for any injury to people or property resulting from any ideas, methods, instructions or products referred to in the content.

