Article

Genetic Characterization of Blood Group Antigens for Polynesian Heritage Norfolk Island Residents

1
Centre for Genomics and Personalized Health, Queensland University of Technology, Brisbane, QLD 4059, Australia
2
Clinical Services and Research, Australian Red Cross Lifeblood, Brisbane, QLD 4059, Australia
*
Author to whom correspondence should be addressed.
Genes 2023, 14(9), 1740; https://doi.org/10.3390/genes14091740
Submission received: 23 June 2023 / Revised: 18 August 2023 / Accepted: 25 August 2023 / Published: 30 August 2023
(This article belongs to the Section Population and Evolutionary Genetics and Genomics)

Abstract

:
Improvements in blood group genotyping methods have allowed large scale population-based blood group genetics studies, facilitating the discovery of rare blood group antigens. Norfolk Island, an external and isolated territory of Australia, is one example of an underrepresented segment of the broader Australian population. Our study utilized whole genome sequencing data to characterize 43 blood group systems in 108 Norfolk Island residents. Blood group genotypes and phenotypes across the 43 systems were predicted using RBCeq. Predicted frequencies were compared to data available from the 1000G project. Additional copy number variation analysis was performed, investigating deletions outside of RHCE, RHD, and MNS systems. Examination of the ABO blood group system predicted a higher distribution of group A1 (45.37%) compared to group O (35.19%) in residents of the Norfolk Island group, similar to the distribution within European populations (42.94% and 38.97%, respectively). Examination of the Kidd blood group system demonstrated an increased prevalence of variants encoding the weakened Kidd phenotype at a combined prevalence of 12.04%, which is higher than that of the European population (5.96%) but lower than other populations in 1000G. Copy number variation analysis showed deletions within the Chido/Rodgers and ABO blood group systems. This study is the first step towards understanding blood group genotype and antigen distribution on Norfolk Island.

1. Introduction

Modern transfusion practices rely on the accurate identification of patients’ blood group antigens, detection of clinically significant antibodies, and the ability to provide patients with the best-matched blood and blood products. Blood group antigens consist of proteins, glycoproteins, and carbohydrates on the surface of the red cell that dictates their immunogenicity and serological phenotype [1]. In response to antigenic stimulation, circulating lymphocytes and/or plasma cells produce antigen-specific antibodies [1,2]. Exposure to foreign antigens during pregnancy or after a blood transfusion can result in development of these antibodies through a process known as alloimmunization [3]. Alloimmunization occurs in an estimated 1–3% of the transfused population, but might be 30% higher in regularly transfused patients, e.g., chronic kidney disease patients [4,5,6].
Finding the best possible matching unit between donor and patient blood groups may reduce the incidence of alloimmunization and decrease the risk of adverse transfusion reactions. The International Society of Blood Transfusion (ISBT) currently recognizes 44 different red cell blood group systems, containing >345 red cell antigens, which are comprised of >1600 alleles [7]. These antigens are inherited and consist of polymorphic structures located on the surface of red blood cells. Genome sequencing analysis can characterize all blood group system antigens, overcoming limitations in traditional serology/molecular based testing [8].
While the importance of extensive blood group antigen characterization in larger populations has been previously highlighted, many isolated populations, including founder populations, remain overlooked [9]. Founder populations are populations with reduced genetic diversity and higher homozygosity, usually due to genetic bottlenecks associated with geographical and cultural isolation. As a result, variants that are rare in global populations may occur at higher frequencies in founder populations [10]. One such population includes Norfolk Island; an isolated, external territory of Australia, located approximately 1456 km east of Brisbane, with a current population of ~1800 residents [11]. Many islanders can trace their heritage back to the original founders—a small group comprised of HMS Bounty mutineers and their Tahitian wives [12]. Many rare blood group antigens are clinically significant. For example, the JK null allele within the Kidd (JK) blood group system, lacks both Jk(a) and Jk(b) antigens, and has been shown to play a role in both hemolytic transfusion reactions (HTRs) and hemolytic disease of the fetus and newborn (HDFN) [13]. We hypothesize that the strong Polynesian heritage link in Norfolk Island may show an increased prevalence of JK null alleles compared to Caucasian populations.
The physical isolation of Norfolk Island makes it difficult to maintain a strong health service for residents, as, unlike other remote healthcare services, external assistance is only available through commercial or charter flights [14]. Maintaining a strong health service in remote areas relies on the ability to recruit and maintain skilled healthcare workers, having the necessary infrastructure in place to provide health services and understanding the needs of the community [14]. Norfolk Island currently has a 24-bed hospital that provides 34 different outpatient services. In 2012, maternity services were scrapped due to an inability to recruit and retain staff with suitable obstetric skills. As a result, all pregnancies are now managed by the Australian public health system and births occur on the mainland. The number of births on the island is relatively low, with the 2016 census showing a total of 40 recorded births for Australian territories of Norfolk Island, Christmas Island, Keeling Island, and Jervis Bay territory [15]. A significant challenge in remote communities involves patient management during critical bleeding situations. On Norfolk Island, the Australian Red Cross Lifeblood operates a blood bank in the hospital, with 175 residents as registered blood donors [14]. When a patient is critically bleeding, a clinical decision must be made if the immediate correction of blood loss or anemia outweighs the potential risks associated with blood transfusions, such as HTRs and alloimmunization.
Previous studies have demonstrated that the Norfolk Island population may have an increased risk of cardiovascular disease and metabolic syndrome compared to the mainland Australian population [16,17]. These studies suggest that their Polynesian heritage likely contributes to the risk of cardiovascular disease in this population, with Polynesian populations having an increase in total triglycerides, body mass index, and higher blood pressure as compared to other populations [16]. Although no data pertaining to cancer incidence in Norfolk Island are available, evidence suggests that such incidence is increased in Polynesian populations [18]. Blood transfusions are often required for the management of cancer and kidney disease [19,20]. Indeed, contrary to popular belief, most blood products are used to help manage patients with chronic conditions rather than trauma patients, with the Australian Red Cross Lifeblood estimating that 34% of transfused blood in Australia are used for patients with cancer or blood diseases [21].
The characterization of blood group antigens within the Norfolk Island population may provide building blocks to understand unique health challenges with transfusion medicine for residents. Characterization of blood groups alongside assessment of blood requirements may help improve blood transfusion safety within the community, help identify and stratify the risk of HDFN and identify any potential rare blood donors. In this study we used whole genome sequencing (WGS) data from 108 Norfolk Island residents to investigate their red cell blood group genotypes and predict antigens and phenotypes.

2. Methods

2.1. Norfolk Island Population Sample Selection and Whole Genome Sequencing Data

The Queensland University of Technology Human Research Ethics Committee granted approval of this study (approval code 3923) and was approved 10/05/2021. WGS data were obtained from whole blood DNA samples obtained from 108 consenting subjects enrolled in the Norfolk Island Health Study as reported previously [16]. The samples were selected from a large multi-generational pedigree within the population. The subsample of 108 subjects was specifically selected based on each subject having a direct genetic link back to the original founders of the population. The purpose of this selection method was to gain a representative subsample of the Norfolk islander founder population. As such, there was a significant degree of relatedness among subjects. Participants in this study were 18 years and over and signed informed consent forms prior to study participation, with ethical clearance granted by the Griffith University Human Research Ethics Committee [17]. The sequencing was performed on Illumina HiSeq X sequencers at the Kinghorn Centre for Clinical Genomics. The sequencing protocol involved paired-end Illumina TruSeq Nano DNA HT libraries and v2.5 clustering and sequencing reagents.

2.2. Variant Calling and Annotation

Sequencing reads (FASTQ) were mapped to the GRCh38 reference genome using Burrows–Wheeler Aligner (BWA) to generate binary alignment mappings (BAM) for an average 20× coverage [22]. GATK best practices were followed for data pre-processing, variant calling, and variant filtering [23]. The BAMTrimmer tool within RBCeq [24] was used to calculate blood group gene coverage (Figure 1). The blood group encoding gene variants annotation/categorization was performed using ANNOVAR [25].

2.3. Prediction of Red Cell Genotypes and Phenotypes Using RBCeq

The RBCeq software [24] takes single nucleotide variations (SNVs) and insertions/deletions (indels) from 48 genes and calculates CNVs, to facilitate the profiling of 43 blood groups and two transcription factors. RBCeq initially scans each blood group for reference and alternative alleles in the input VCF file, the zygosity of detected reference–alternate alleles guides sub-allele selection. Furthermore, the selected reference/alternate/sub alleles are paired against each other. They are then assigned a score that aids in selecting the dominant allele pair. The reference and alternative alleles scanned by RBCeq are stored in a back-end database that is based on International Society of Blood Transfusion (ISBT) allele tables [7,24].

2.4. Copy Number Variation Analysis

Additional CNV analysis was performed, focused on double deletions in blood group genes. A GATK gCNV pipeline was followed with a set interval size of 1000 bp. The pipeline was multithreaded, with the genome split into 100 intervals, which were analyzed separately and recombined at the end of the analysis [23]. The individual CNV vcf files were merged into a multivcf file and a tab delimited file containing the copy numbers at every 1000 bp intervals were analyzed. To assess the pathogenicity of the CNVs, we used AnnotSV [26], which follows ACMG-ClinGen guidelines [27].

2.5. Comparison with 1000 Genomes (1000G) Dataset

We performed a comparative analysis for the predicted genotype and phenotype frequencies between our population dataset and the 1000G dataset. The 1000G project ran from 2008–2015 and is an open access database containing 2504 whole genome samples from 26 different population groups. These 26 populations have been grouped into 5 main population types (America, East Asia, South Asia, Africa, and Europe). These data provide an overview of common human genetic variation and consist of a combination of WGS and dense microarray phenotype. For the present study, WGS BAM and VCF files were accessed through the 1000G project FTP server. Blood group profiles for 108 Norfolk Island residents were compared with population data obtained from 1000G [28].

2.6. Statistical Analysis

We utilized two-sample proportion tests to compare the populations of the 1000G against the NI population. A statistical test was conducted only when the variant frequency was found to be equal to or greater than 10%. To account for multiple comparisons, we employed the Bonferroni test for p-value correction. A significance level of p-value < 0.0016 (0.05/30*—5 comparison for each variant) was deemed statistically significant.

3. Results

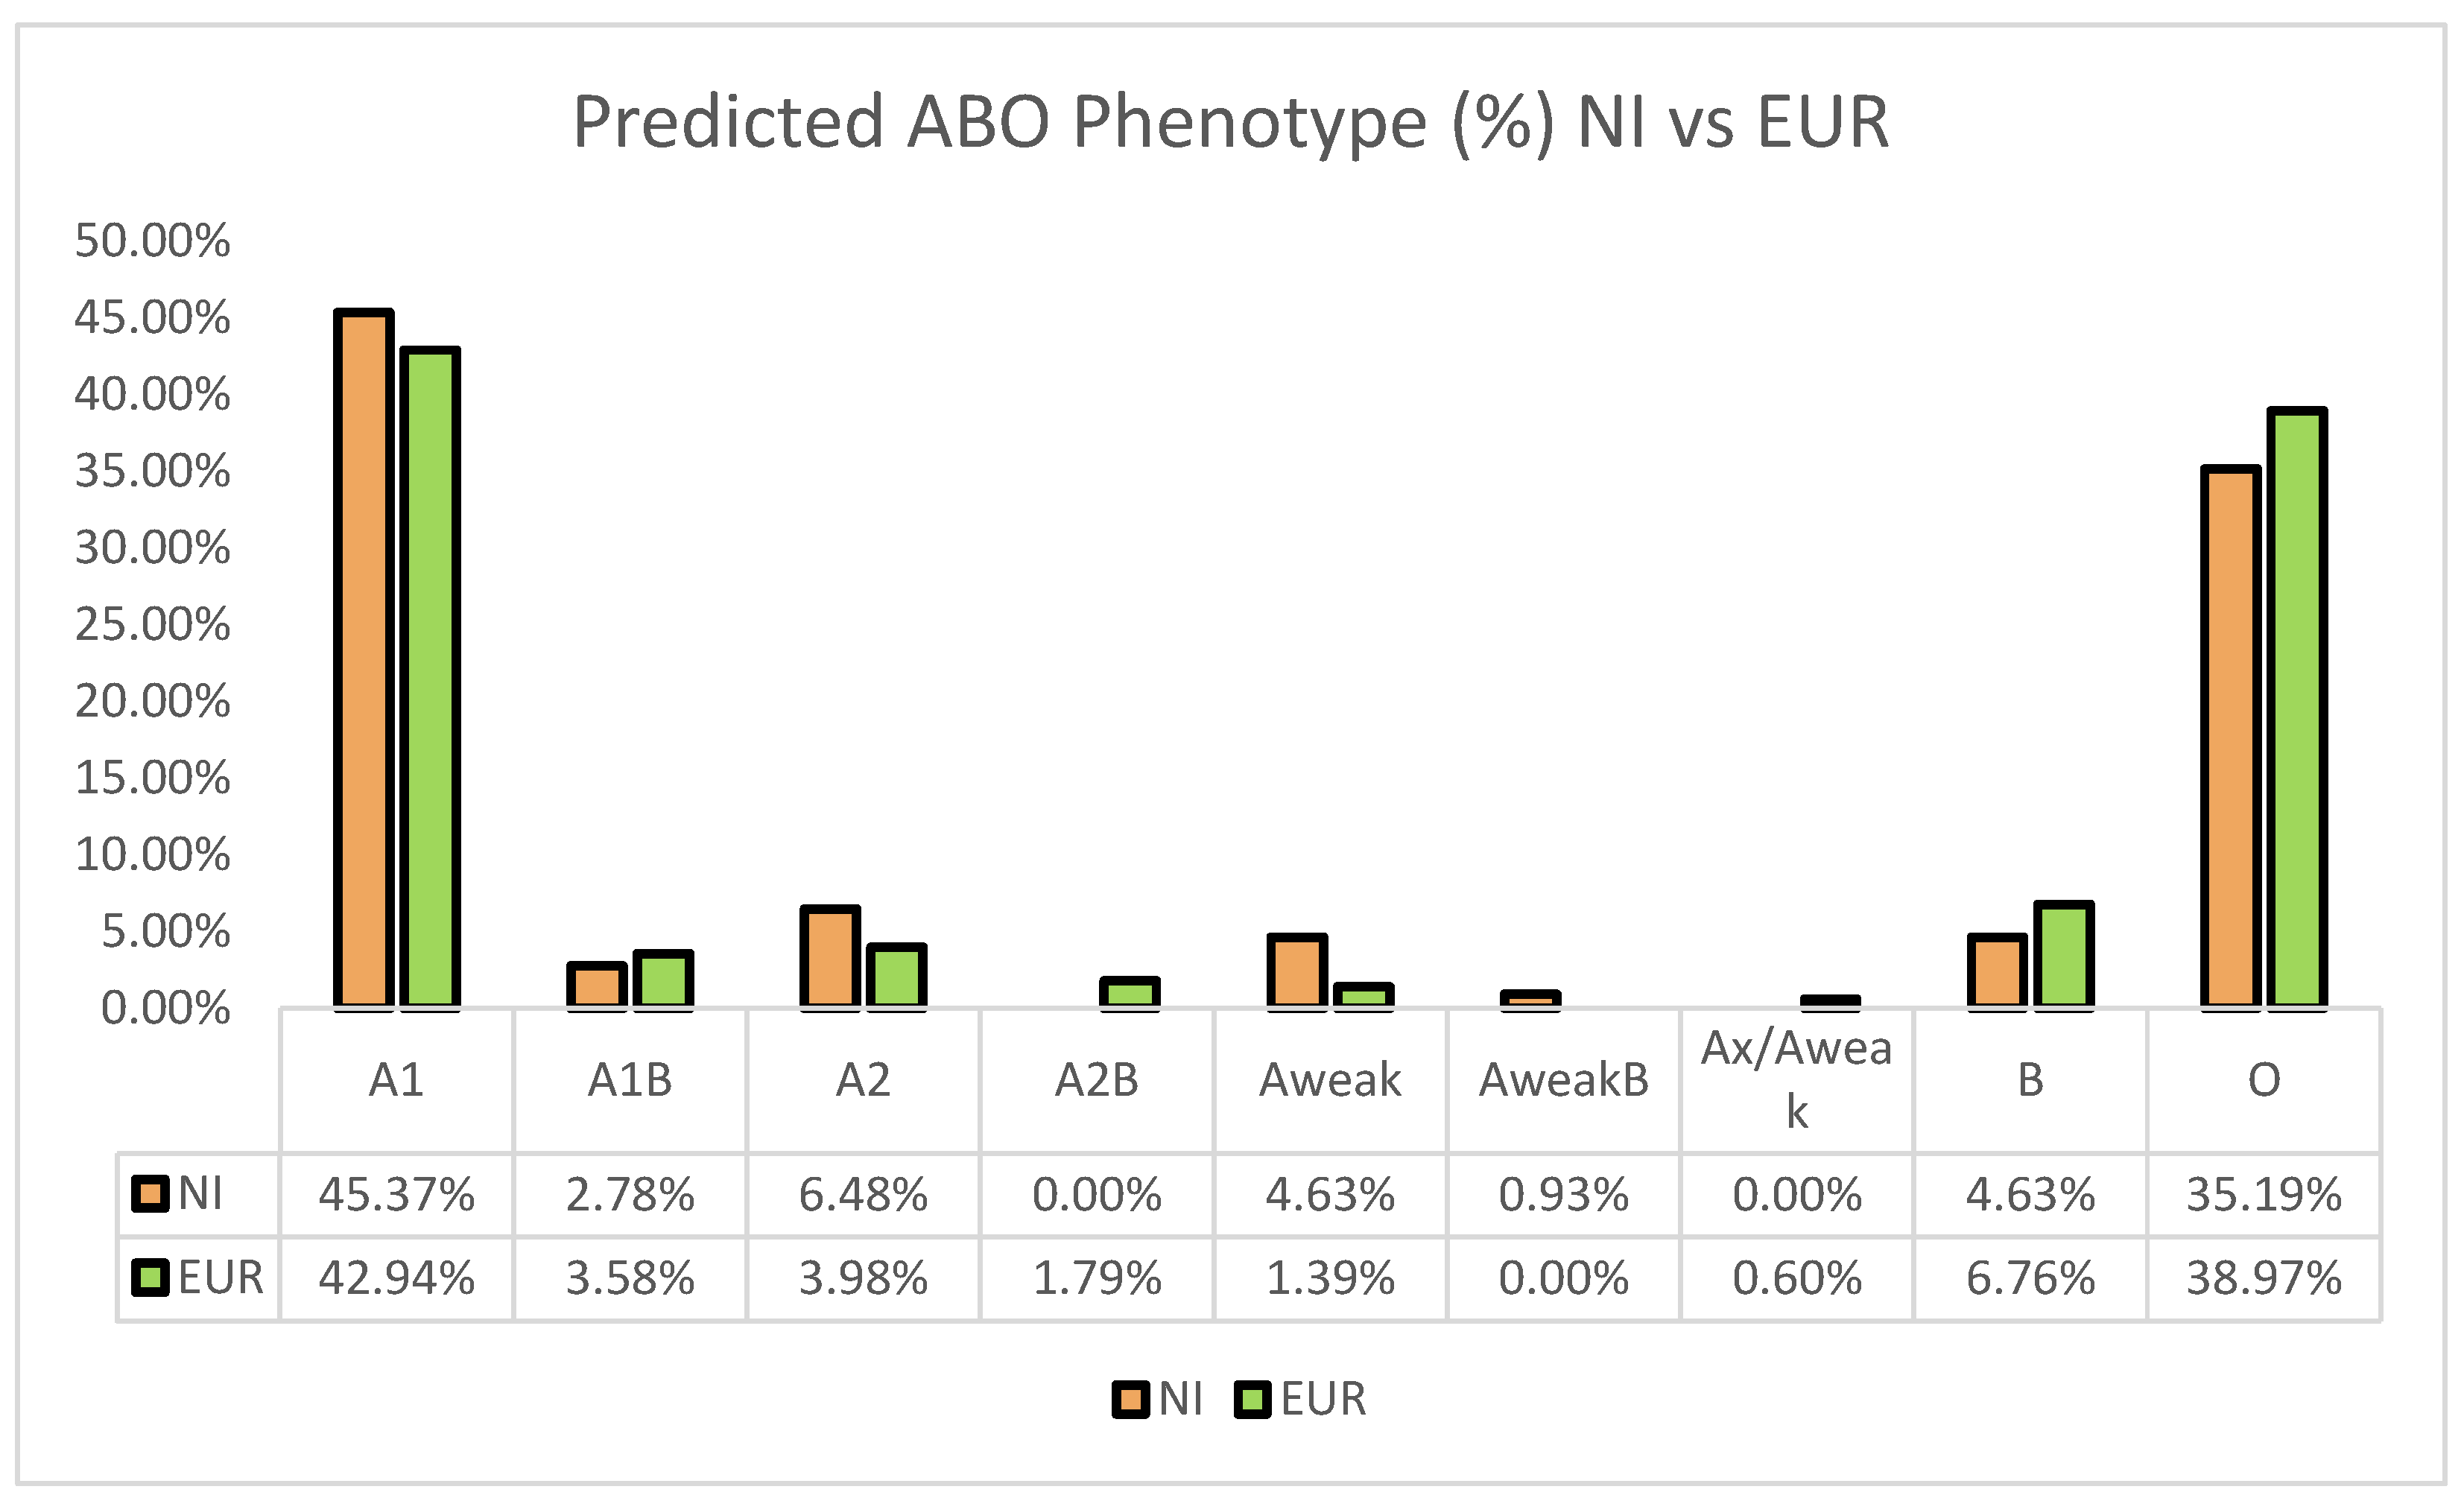
3.1. Prevalence of Predicted ABO Phenotype

In examining ABO genotypes and their predicted phenotypes, our results showed that the predicted distribution of A1 is slightly higher than the distribution of group O (45.37% and 35.19%, respectively) (Figure 2). This predicted A1 prevalence is comparable with the distribution observed in European populations (42.94%). Our analysis showed that five participants (4.63%) had a predicted Aweak phenotype, and one participant (0.93%) had a predicted AweakB phenotype. While the group O distribution in our NI population was similar to the distribution seen in European populations (35.19% and 38.97%, respectively), group B distribution was slightly lower (4.63% compared to 6.76%).

3.2. RHD Characterisation and Its Prevalence

The Rh system was analyzed next, comparing the frequencies between NI and European populations. The Rh(D)-negative phenotype is reported at a prevalence of ~15% in European populations [29], whereas we observed a predicted ~9% Rh(D)-negative prevalence in this NI population (Table 1). Two participants were found to be homozygous for the RHD*01W.33 allele (weak D type 33). No genotypes with heterozygous variants for RHD*01W.33 were observed.

3.3. Comprehensive Analysis of the Kidd Blood Group among Norfolk Islanders

We examined the distribution of Kidd variants and predicted phenotypes among Norfolk Island residents (Table 2). While we did not predict any JK null phenotypes, we did identify several variants within the JK system. Our analysis showed three participants heterozygous for the JK*02N.17/JK*02 genotype, with a predicted phenotype of Jk(a−b+), and one participant with a heterozygous genotype of JK*01N.19/JK*01 with a predicted phenotype of Jk(a+b−). We also identified three participants with the homozygous genotype of JK*01W.01/JK*01W.01, with a predicted phenotype of Jk(a+wb−) (Table 2).

3.4. Prediction and Distribution of High Frequency Antigens

Our analysis showed a number of SNVs associated with predicted high frequency antigens across several blood group systems, including Knops (KN), Scianna (SC), Pel (PEL), Colton (CO), H, Kell (KEL), Cartwright (YT), and Landsteiner–Wiener (LW). For the KN system, we detected 15 individuals with a homozygous genotype of KN*01.-05/KN*01.-05, leading to a predicted loss of the high frequency antigen Yk(a−). We also identified four individuals with a homozygous genotype of KN*01.-08/KN*01.-08, with a predicted loss of the high frequency antigen Sl3. For the H system, one participant was homozygous for the FUT2*01W.02.01/FUT2*01W.02.01 genotype which results in the H+w secretor phenotype.
Several heterozygous alleles were also observed within this population. In the SC system, three participants genotyped with SC*01/SC*01.-07. In the CO system, there were seven participants with a CO*01.01/CO*02.01 genotype, predictive of Co(a+b+) phenotype. Within the KEL system, we identified a single participant with a KEL*02/KEL*01.01 genotype and predicted K+k+ phenotype. Finally, within the YT system, we also identified seven participants with a YT*02/YT*01 genotype and predicted Yt(a+b+) phenotype (Table 3).

3.5. Analysis of Copy Number Variations among Norfolk Island Residents

We performed a CNV analysis focused on homozygous deleted regions in blood group genes. Additional GATK-pipelines were performed to examine CNVs in blood group systems, except for RHD and MNS, revealing a deletion of exon 27 in the Chido/Rodger’s system at a frequency of 4.63% (Table 4). A similar deletion was observed in exon 28 at a frequency of 5.55%. In C4B, the complete deletion of exon 28 was detected at a frequency of 7.40%, which may translate to an impact in the Ch/Rg system and C4B expression. Other notable findings in our population included a 46 bp deletion within exon 7 of the ABO system at a frequency of 1.85%, which may affect the ABO phenotype in these individuals (Table 4).

3.6. Prevalence of Predicted Weak Phenotypes and Low Frequency Antigens among Norfolk Island Residents

We examined the incidence of variants encoding for weak and low frequency antigens in a number of clinically significant blood group systems (Table 5) and found one individual heterozygous for ACKR1 c.265C>T, resulting in the Duffy genotype FY*01/FY*02W.01 or FY*02/FY*02W.01. These data also revealed a heterozygous LW*05/LW*07 variant encoding LW(a+b+) present in one individual from the Norfolk Island study population with a similar frequency to that observed in the 1000G, as well as a rare heterozygous variant in the KEL system KEL*02/KEL*02.03 in one individual with a predicted phenotype of K−k+. For PEL, we identified a single individual with the homozygous genotype ABCC4*01.02W/ABCC4*01.02W, leading to a predicted weakening of the Pel antigen and a predicted phenotype of Plew+.

4. Discussion

Previous studies have demonstrated that red cell antigen distributions vary between ethnic groups, suggesting that founder effects, gene flow, and natural selection contribute to the differences observed in descendent populations [31]. Alloimmunization complicates transfusion practices—contributing towards adverse outcomes in transfusions and HDFN complications. Our study is the first to carry out extensive characterization of the 43 blood group systems and to analyze associated trends within the isolated Norfolk Island community, with the goal to characterize the blood group antigens for this community.
The ABO system is the most clinically significant blood group system. Transfusion mismatches in this system are the most common cause of life-threatening immediate intravascular hemolysis [1]. In this study, we describe a similar predicted phenotypic distribution of group A1 among the Norfolk Island population (45.37%) to that observed in European populations (42.94%). It was hypothesized by Simmons that higher group A prevalence was reported in Micronesia, Melanesia, and Indonesia due to a lack of the B antigen [32]. These findings align with our data, given the traceable European and Polynesian heritage of Norfolk Islanders and decreased prevalence of variants encoding for B antigens within the population. Our study also predicted seven participants with A2 phenotype (6.48%), five participants with weak A (4.63%), and one participant with AweakB phenotype (0.93%). The identification of weak ABO subgroups is clinically significant, as they can result in discrepancies in serology-based testing, which in turn may contribute towards delays in obtaining blood products.
There are known challenges associated with providing equitable care for isolated and rural communities due to limitations on resources, services, and the recruitment and retention of a skilled workforce [33]. Whilst most antibodies in the Rh system can cause HDFN and HTRs, anti-D is considered the most clinically significant in this system as it has the highest immunogenicity [3]. Our data indicated a prevalence of RHD-negative caused by a complete deletion of the RHD gene (RHD*01N.01/RHD*01N.01) of 9.26%. We also detected two participants homozygous for RHD*01W.33 (weak D type 33), which consists of a SNP at c.520G>A [7].
The clinically significant Kidd (JK) blood group system is present on chromosome 18 (18q11-q12), and is encoded by the SLC14A1 gene [13]. The null phenotype, Jk(a−b−), is rare in all populations but is reported at a higher frequency in Polynesian populations (1.0–1.4%) [13,31]. The most common JK null variant that is detected in Polynesian populations is JK*02N.01, which is a splice site mutation of intron 5 of the JK*B allele [13,34]. While we did not identify any participants with this mutation, we identified three participants with the heterozygous JK*02/JK*02N.17 genotype, leading to a predicted phenotype of Jk(a−b+). This variant has not been previously described at an increased frequency in Polynesian or European populations. However, a recent study has shown that the SNP associated with JK*02N.17 (c.810G>A) and its impact on JK null may be overstated and should be revisited [35]. We did observe several JK variants that occurred at a higher rate compared to the European population (Table 2). We identified three participants with a homozygous genotype of JK*01W.01/JK*01W.01, encoding for Jk(a+wb−) phenotype. This allele is commonly seen in East Asian populations but is not commonly associated with Polynesian or European heritage [13]. We speculate that the JK null variants observed in the Norfolk Island population in the present study is attributable to the inheritance of JK null silencing mutations from Polynesian founders.
High incidence antigens are those that have a prevalence of >90%, but are usually present at >99% in populations. Patients lacking these antigens with alloantibodies will struggle to find compatible units due to the high prevalence within the donor population [35]. Our study showed a notable finding within the Knops system. Knops antibodies are high-titer, low avidity antibodies and are considered clinically insignificant as they rarely cause HTRs or HDFN, however, patients with these antibodies cause know interferences with serological assays [1,35]. The Knops blood groups system consists of three low-prevalence antigens (Knb, McCb, and Vil) and six high prevalence antigens (Sja, KCAM, Kna, MccA, Yka, and Sl3) [3]. Knops is encoded by the complement receptor type 1 gene (CR1) on chromosome 1q32.2. The reference allele KN*01 encodes the common antigens Kn(a+), McC(a), Sl1+, Sl3+, KCAM, and DACY+ [36]. Our results showed 15 participants homozygous for KN*01.-05/KN*01.-05, which predicts a loss of the high incidence antigen Yka. The Yka antigen is found in 92% of the Australian population [37], making this a notable finding. Additionally, our study demonstrated one participant homozygous for the ABCC4*01.02W/ABCC4*01.02W genotype within the PEL system, predictive of a weakened PEL phenotype, with PEL expression reduced by 30% [38].
Whilst SNVs define most of the blood group antigens, some blood group antigen expressions are impacted by larger insertions/deletions [2,39,40]. Our CNV analysis extended beyond the RHD/RHCE and MNS systems and revealed an increased frequency of CNVs associated with the Chido/Rodger’s blood group system. This blood group system consists of 41 exons and 9 antigens located in the C4d regions of C4 complement protein [41]. The C4A and C4B genes are highly homologous, sharing 99.91% nucleotide sequences, with many CNVs being described in Caucasian populations [41,42]. Due to the high homology between C4A and C4B genes, a better approach might be needed for subsequent studies. Our CNV analysis detected deletions between exons 27 and 28 in both C4A and C4B genes among Norfolk Island residents. Several diseases have been associated with mutations within the C4a/b regions of complement, with systemic lupus erythematosus (SLE) being particularly strongly linked to such mutations. The prevalence of SLE within Polynesian communities is higher than in the Caucasian population, affecting 51–73 per 100,000 individuals as compared to 15–19 per 100,000, respectively [43]. The prevalence of SLE within the Norfolk Island community was not assessed as part of this study, however, given the increased incidence observed in Polynesia, its associations with CNVs in C4A/C4B may contribute to the high frequency of this type of variant within our dataset [43]. CNV analysis also uncovered deletions within ABO. The ABO system consists of seven exons and 77% of its coding function occurs on exons 6 and 7. Variation within these exons is the predominant determinant of the A or B antigen, and loss of coding capacity may affect the function of glycosyltransferase, which may affect antigen expression [44]. However, as serology was not performed, there is no way to confirm the effect of this ABO variation.
In summary, we examined the prevalence of blood group genotypes and predicted phenotypes in 43 blood group systems among 108 residents of Norfolk Island. These data showed an expected similar correlation between Norfolk Island and European blood group frequencies for the ABO blood group system. The heterozygous JK null alleles predicted among Norfolk Islanders suggest that the null phenotype has been diluted in this population, with traceability back to Polynesian ancestry still being possible. Whilst our dataset comprised a small number of individuals selected for their direct descent to the founding population of Norfolk Island, our study uncovered a number of uncommon and potentially clinically significant variants which require further investigation. Whilst RBCeq predicts the red cell phenotype based on genetic information, it is important to note that genotype does not always correlate to phenotype, and the lack of basic or extended serology to determine the concordance of phenotype predictions to actual blood group phenotypes is a recognized limitation of this study. Future studies with confirmatory serology may help amend blood group predictions for Norfolk Island residents and is recommended.
The accurate characterization of blood group antigens in conjunction with an assessment of blood requirements may help reduce transfusion reactions, assess risk of hemolytic disease of fetuses and newborns, and improve blood safety for this isolated population. Given that Norfolk Islanders exhibit an increased risk of metabolic syndrome, cardiovascular disease, and kidney disease, and are isolated from mainland Australia, such an analysis would be useful to facilitate improved donor–patient matching in transfusion medicine.

Author Contributions

S.H.N. led the project and oversaw all activities of the project. Sample collection and sequencing was led by R.A.L. Result validation and data analysis: S.O., S.J., S.S., S.L. and V.A. Data visualizations: S.L., S.O. and S.J. First draft of manuscript: S.O. and S.J. Manuscript revision: S.J., S.S., E.R., R.A.L., R.L.F., L.G. and S.H.N. All authors have read and agreed to the published version of the manuscript.

Funding

This research was funded by grants from the Australian National Health and Medical Research Council (Medical Genomics Program Grant) and the Griffith Medical Research College (a joint program of Queensland Institute of Medical Research and Griffith University) SM and PMV are supported by the NHMRC fellowship scheme.

Institutional Review Board Statement

The Queensland University of Technology Human Research Ethics Committee granted approval of this study (approval code 3923) and was approved 10/05/2021.

Informed Consent Statement

Informed consent was obtained from all subjects involved in the study.

Data Availability Statement

Due to ethical constraints, restricted data is in place. The Norfolk genetics steering committee will assess restricted data access requests via our GRC computational genetics group. Interested researchers should contact [email protected].

Acknowledgments

We thank the Norfolk Island volunteers for their participation in this study. Australian Governments fund Australian Red Cross Lifeblood for provision of blood, blood products and services to the Australian community.

Conflicts of Interest

The authors declare that the research was conducted in the absence of any commercial or financial relationships that could be construed as potential conflicts of interest.

References

  1. Ajmani, P.S. Blood Group and Immunology. In Immunohematology and Blood Banking: Principles and Practice; Springer: Singapore, 2020; pp. 7–23. [Google Scholar]
  2. Harmening, D.M. Modern Blood Banking & Transfusion Practices; FA Davis: Philadelphia, PA, USA, 2018. [Google Scholar]
  3. Connie, M.; Westhoff, J.R.S.; Beth, H.S. Chapter 110—Human Blood Group Antigens and Antibodies. In Human Blood Group Antigens and Antibodies, 7th ed.; Hoffman, E.J.B.R., Silberstein, L.E., Heslop, H.E., Weitz, J.I., Anastasi, J., Salama, M.E., Abutalib, S.A., Eds.; Elsevier: Amsterdam, The Netherlands, 2018; pp. 1687–1701. [Google Scholar]
  4. Karpinski, M.; Pochinco, D.; Dembinski, I.; Laidlaw, W.; Zacharias, J.; Nickerson, P. Leukocyte reduction of red blood cell transfusions does not decrease allosensitization rates in potential kidney transplant candidates. Am. Soc. Nephrol. 2004, 15, 818–824. [Google Scholar] [CrossRef] [PubMed]
  5. Gill, K.S.; Muntner, P.; Lafayette, R.A.; Petersen, J.; Fink, J.C.; Gilbertson, D.T.; Bradbury, B.D. Red blood cell transfusion use in patients with chronic kidney disease. Nephrol. Dial. Transplant. 2013, 28, 1504–1515. [Google Scholar] [CrossRef] [PubMed]
  6. Caamaño, J.; Musante, E.; Contreras, M.; Ulloa, H.; Reyes, C.; Inaipil, V.; Saavedra, N.; Guzmán, N. Frequency and specificity of red blood cell alloimmunization in chilean transfused patients. Transfus. Med. Hemotherapy 2015, 42, 4–7. [Google Scholar] [CrossRef] [PubMed]
  7. ISBT. Table of Blood Group Systems v10.0. ISBT: Red Cell Immunogenetics and Blood Group Terminology. 2021. Available online: https://www.isbtweb.org/fileadmin/user_upload/Table_of_blood_group_systems_v10.0_30-JUN-2021_with_LRG_and_revised_antigens.pdf (accessed on 11 May 2023).
  8. Keller, M. The role of red cell genotyping in transfusion medicine. Immunohematology 2015, 31, 49–52. [Google Scholar] [CrossRef] [PubMed]
  9. Jadhao, S.; Hoy, W.; Lee, S.; Patel, H.R.; McMorran, B.J.; Flower, R.L.; Nagaraj, S.H. The genomic landscape of blood groups in Indigenous Australians in remote communities. Transfusion 2022, 62, 1110–1120. [Google Scholar] [CrossRef] [PubMed]
  10. Hatzikotoulas, K.; Gilly, A.; Zeggini, E. Using population isolates in genetic association studies. Brief. Funct. Genom. 2014, 13, 371–377. [Google Scholar] [CrossRef] [PubMed]
  11. Australian Bureau of Statistics. Norfolk Island. Norfolk Island 2016 Census All Persons QuickStats. 2016. Available online: https://www.abs.gov.au/census/find-census-data/quickstats/2016/SSC90004 (accessed on 22 June 2022).
  12. Macgregor, S.; Bellis, C.; Lea, R.A.; Cox, H.; Dyer, T.; Blangero, J.; Visscher, P.M.; Griffiths, L.R. Legacy of mutiny on the Bounty: Founder effect and admixture on Norfolk Island. Eur. J. Hum. Genet. 2010, 18, 67–72. [Google Scholar] [CrossRef]
  13. Lawicki, S.; Covin, R.B.; Powers, A.A. The Kidd (JK) blood group system. Transfus. Med. Rev. 2017, 31, 165–172. [Google Scholar] [CrossRef]
  14. KPMG. Norfolk Island Health Service Plan. 2020. Available online: https://www.regional.gov.au/territories/norfolk_island/norfolk_island_health_services/files/2019-kpmg-ni-health-service-plan.pdf (accessed on 22 June 2022).
  15. Australian Bureau of Statistics. 3301.0-Births, Australia, 2016. Available online: https://www.abs.gov.au/AUSSTATS/[email protected]/Lookup/3301.0Explanatory%20Notes12016?OpenDocument (accessed on 22 June 2022).
  16. Benton, M.C. Identification of Susceptibility Genes for Metabolic Syndrome in the Isolated Population of Norfolk Island. Ph.D. Thesis, Griffith University, Queensland, Australia, 2013. [Google Scholar]
  17. Bellis, C.; Hughes, R.M.; Begley, K.N.; Quinlan, S.; Lea, R.A.; Heath, S.C.; Blangero, J.; Griffiths, L.R. Phenotypical characterisation of the isolated Norfolk Island population focusing on epidemiological indicators of cardiovascular disease. Hum. Hered. 2005, 60, 211–219. [Google Scholar] [CrossRef]
  18. Tervonen, H.; Foliaki, S.; Bray, F.; Roder, D. Cancer epidemiology in the small nations of Pacific Islands. Cancer Epidemiol. 2017, 50, 184–192. [Google Scholar] [CrossRef]
  19. Park, H.; Liu, X.; Henry, L.; Harman, J.; Ross, E.A. Trends in anemia care in non-dialysis-dependent chronic kidney disease (CKD) patients in the United States (2006–2015). BMC Nephrol. 2018, 19, 318. [Google Scholar] [CrossRef] [PubMed]
  20. Docherty, A.B.; Walsh, T.S. Anemia and blood transfusion in the critically ill patient with cardiovascular disease. Crit. Care 2017, 21, 61. [Google Scholar] [CrossRef] [PubMed]
  21. National Blood Authority Australia. National Blood Authority Annual Report 2019–2020. 2020. Available online: www.blood.gov.au/about-nba (accessed on 9 May 2022).
  22. Durbin, R. Fast and accurate long-read alignment with Burrows-Wheeler transform. Bioinformatics 2010, 26, 589–595. [Google Scholar]
  23. DePristo, M.A.; Banks, E.; Poplin, R.; Garimella, K.V.; Maguire, J.R.; Hartl, C.; del Angel, G.; Rivas, M.A.; Hanna, M.; McKenna, A.; et al. A framework for variation discovery and genotyping using next-generation DNA sequencing data. Nat. Genet. 2011, 43, 491–498. [Google Scholar] [CrossRef] [PubMed]
  24. Jadhao, S.; Davison, C.L.; Roulis, E.V.; Schoeman, E.M.; Divate, M.; Haring, M.; Williams, C.; Shankar, A.J.; Lee, S.; Pecheniuk, N.M.; et al. RBCeq: A robust and scalable algorithm for accurate genetic blood typing. EBioMedicine 2022, 76, 103759. [Google Scholar] [CrossRef] [PubMed]
  25. Wang, K.; Li, M.; Hakonarson, H. ANNOVAR: Functional annotation of genetic variants from high-throughput sequencing data. Nucleic. Acids Res. 2010, 38, e164. [Google Scholar] [CrossRef] [PubMed]
  26. Geoffroy, V.; Herenger, Y.; Kress, A.; Stoetzel, C.; Piton, A.; Dollfus, H.; Muller, J. AnnotSV: An integrated tool for structural variations annotation. Bioinformatics 2018, 34, 3572–3574. [Google Scholar] [CrossRef] [PubMed]
  27. Rivera-Muñoz, E.A.; Milko, L.V.; Harrison, S.M.; Azzariti, D.R.; Kurtz, C.L.; Lee, K.; Mester, J.L.; Weaver, M.A.; Currey, E.; Craigen, W.; et al. ClinGen variant curation expert panel experiences and standardized processes for disease and gene-level specification of the ACMG/AMP guidelines for sequence variant interpretation. Hum. Mutat. 2018, 39, 1614–1622. [Google Scholar] [CrossRef]
  28. 1000 Genomes Project Consortium. A global reference for human genetic variation. Nature 2015, 526, 68. [Google Scholar] [CrossRef]
  29. NHS. Blood Groups. 2020. Available online: https://www.nhs.uk/conditions/blood-groups/#:~:text=About%2085%25%20of%20the%20UK,type%20is%20not%20immediately%20known (accessed on 4 July 2022).
  30. Hamosh, A.; Scott, A.F.; Amberger, J.S.; Bocchini, C.A.; McKusick, V.A. Online Mendelian Inheritance in Man (OMIM), a knowledgebase of human genes and genetic disorders. Nucleic Acids Res. 2005, 33 (Suppl. 1), D514–D517. [Google Scholar] [CrossRef]
  31. Anstee, D.J. The relationship between blood groups and disease. J. Am. Soc. Hematol. 2010, 115, 4635–4643. [Google Scholar] [CrossRef] [PubMed]
  32. Simmons, R.T. Blood group genes in Polynesians and comparisons with other Pacific peoples. Oceania 1962, 32, 198–210. [Google Scholar] [CrossRef]
  33. Irshaid, N.M.; Henry, S.M.; Olsson, M.L. Genomic characterization of the Kidd blood group gene: Different molecular basis of the Jk (a–b–) phenotypein Polynesians and Finns. Transfusion 2000, 40, 69–74. [Google Scholar] [CrossRef] [PubMed]
  34. Vorholt, S.M.; Lenz, V.; Just, B.; Enczmann, J.; Fischer, J.C.; Horn, P.A.; Zeiler, T.A.; Balz, V. High-Throughput Next-Generation Sequencing of the Kidd Blood Group: Unexpected Antigen Expression Properties of Four Alleles and Detection of Novel Variants. Transfus. Med. Hemotherapy 2023, 50, 51–65. [Google Scholar] [CrossRef] [PubMed]
  35. Seltsam, A.; Wagner, F.F.; Salama, A.; Flegel, W.A. Antibodies to high-frequency antigens may decrease the quality of transfusion support: An observational study. Transfusion 2003, 43, 1563–1566. [Google Scholar] [CrossRef] [PubMed]
  36. Scharberg, E.A.; Rink, G.; Schulz, D.; Rothenberger, S.; Stürtzel, A.; Gillhuber, N.; Seyboth, S.; Bugert, P. KDAS, a new blood group antigen in the Knops blood group system antithetical to KCAM. Transfusion 2020, 60, E25–E27. [Google Scholar] [CrossRef] [PubMed]
  37. Australian Red Cross Lifeblood. Major Blood Group Phenotypes and Their Frequencies. Blood Group Phenotypes 2021–2023. Available online: https://www.lifeblood.com.au/health-professionals/testing/blood-groups/phenotypes (accessed on 9 February 2023).
  38. Azouzi, S.; Mikdar, M.; Hermand, P.; Gautier, E.F.; Salnot, V.; Willemetz, A.; Nicolas, G.; Vrignaud, C.; Raneri, A.; Mayeux, P.; et al. Lack of the multidrug transporter MRP4/ABCC4 defines the PEL-negative blood group and impairs platelet aggregation. Blood. J. Am. Soc. Hematol. 2020, 135, 441–448. [Google Scholar] [CrossRef] [PubMed]
  39. Reid, M.E.; Lomas-Francis, C. The Blood Group Antigen Factsbook; Academic Press: Cambridge, MA, USA, 2012. [Google Scholar]
  40. McCarroll, S.A.; Kuruvilla, F.G.; Korn, J.M.; Cawley, S.; Nemesh, J.; Wysoker, A.; Shapero, M.H.; Bakker, P.I.W.d.; Maller, J.B.; Kirby, A.; et al. Integrated detection and population-genetic analysis of SNPs and copy number variation. Nat. Genet. 2008, 40, 1166–1174. [Google Scholar] [CrossRef]
  41. Mougey, R. A review of the Chido/Rodgers blood group. Immunohematology 2010, 26, 30–38. [Google Scholar] [CrossRef]
  42. Lundtoft, C.; Pucholt, P.; Martin, M.; Bianchi, M.; Lundström, E.; Eloranta, M.; Sandling, J.K.; Sjöwall, C.; Jönsen, A.; Gunnarsson, I.; et al. Complement C4 copy number variation is linked to SSA/Ro and SSB/La autoantibodies in systemic inflammatory autoimmune diseases. Arthritis Rheumatol. 2022, 74, 1440–1450. [Google Scholar] [CrossRef]
  43. Barber, M.R.; Drenkard, C.; Falasinnu, T.; Hoi, A.; Mak, A.; Kow, N.Y.; Svenungsson, E.; Peterson, J.; Clarke, A.E.; Ramsey-Goldman, R. Global epidemiology of systemic lupus erythematosus. Nat. Rev. Rheumatol. 2021, 17, 515–532. [Google Scholar] [CrossRef]
  44. Gill, J.C.; Endres-Brooks, J.; Bauer, P.J.; Marks, W.J.; Montgomery, R.R. The effect of ABO blood group on the diagnosis of von Willebrand disease. Blood 1987, 69, 1691–1695. [Google Scholar] [CrossRef]
Figure 1. Overview of the workflow used to characterize population-specific blood group variants and predict phenotypes of Norfolk Island residents compared to populations in the 1000G. Blood group gene coverage was calculated using BAMstat and bedtools.
Genes 14 01740 g001
Figure 2. Comparison of ABO blood group frequencies in Norfolk Islander and European populations. Similar group A frequencies were observed when comparing Norfolk Islander (NI) and European populations, while group O prevalence was slightly lower among NI populations. Group B was seen at a reduced prevalence for Norfolk Island residents compared to European populations.
Genes 14 01740 g002
Table 1. RHD predictions and variant calculations were compared to African, American, East Asian, European, and South Asian populations using data obtained from 1000G. We utilized two-sample proportion tests to compare the populations of the 1000G against the NI population showing statistically significant differences between NI and AFR and EAS.
PhenotypePopulationFrequency (%)p-Value
D+NI96 (88.89)-
AFR638 (96.52)<0.0001 **
AMR326 (93.95)0.119
EAS503 (99.80)<0.0001 **
EUR422 (83.90)0.245
SAS462 (94.48)0.056
D-NI10 (9.26)-
AFR23 (3.48)0.013
AMR21 (6.05)0.349
EAS1 (0.20)NA
EUR81 (16.10)0.096
SAS27 (5.52)0.216
Weak D (type 33)NI2 (1.85)-
AFR0 (0)NA
AMR0 (0)NA
EAS0 (0)NA
EUR0 (0)NA
SAS0 (0)NA
**—Statistically significant results.
Table 2. Analysis of the JK blood group system of Norfolk Island residents showed a slightly higher distribution of Jk(a+b+) variants compared to European populations. However, the number of weakened phenotypes Jk(a+wb−) was higher in NI compared to European, but lower compared to the other populations.
PhenotypePopulationFrequency (%)p-Value
Jk(a+b−)NI37 (34.26)-
AFR336 (50.83)0.001
AMR72 (20.75)0.006
EAS32 (6.35)NA
EUR124 (24.65)0.05
SAS155 (31.69)0.688
Jk(a+b+)NI45 (41.67)-
AFR126 (19.06)<0.0001 **
AMR85 (24.49)0.001
EAS46 (9.13)<0.0001
EUR169 (33.59)0.138
SAS99 (20.25)<0.0001 **
Jk(a+b+w)/Jk(a+wb+)NI10 (9.26)-
AFR0 (0)NA
AMR0 (0)NA
EAS2 (0.4)NA
EUR0 (0)NA
SAS0 (0)NA
Jk(a−b+)NI13 (12.04)-
AFR55 (8.32)0.281
AMR102 (29.39)<0.0001 **
EAS136 (26.98)<0.0001 **
EUR129 (25.65)0.004
SAS68 (13.91)0.72
Jk(a+wb−)NI3 (2.78)-
AFR62 (38.58)NA
AMR22 (16.43)NA
EAS80 (21.43)NA
EUR19 (5.96)NA
SAS57 (28.22)NA
**—Statistically significant results.
Table 3. Distributions of notable high incidence variants in the Norfolk Island population, predicting an increased prevalence of the Yka− antigen in the Knops blood group system, similar to the distribution seen in East Asian, American, and South Asian, and lower than European populations.
Blood Group
System
ISBT & Nucleotide ChangePhenotype RBCeq Prediction
ZygosityNI%
N = 108
AFR%
N = 661
AMR%
N = 347
EAS%
N = 504
EUR%
N = 503
SAS%
N = 489
KN (ISBT 022)KN*01.-08 c4828T>AKn(a+b−) McC(a+b−) Sl1+ Yk(a+) Vil- Sl3- KCAM+Heterozygous5.56
(n = 6)
0.00
(n = 0)
1.15
(n = 4)
0.00
(n = 0)
3.77
(n = 20)
0.20
(n = 1)
KN (ISBT 022)KN*01-05 c.4223C>TKn(a+b−) McC(a+b−) Sl1+ Yk(a−) Vil- Sl3+ KCAM+Homozygous13.89
(n = 15)
0.30
(n = 2)
16.14
(n = 56)
12.70
(n = 64)
9.94
(n = 49)
10.84
(n = 53)
SC (ISBT 013)SC*01.-07Sc1+ SCAN+Heterozygous2.78
(n = 3)
0.00
(n = 0)
0.86
(n = 3)
0.00
(n = 0)
0.99
(n = 5)
0.20
(n = 1)
CO (ISBT 015)CO*01/CO*02
c.134C>T
Co(a+b+)Heterozygous6.48
(n = 7)
1.82
(n = 12)
1.73
(n = 6)
0.00
(n = 0)
6.56
(n = 33)
0.82
(n = 4)
KEL (ISBT 006)KEL*02
c.578C
K+k+Heterozygous3.70
(n = 4)
0.45
(n = 3)
4.32
(n = 15)
0.00
(n = 0)
7.55
(n = 38)
1.23
(n = 6)
YT (ISBT 011)YT*01/YT*02
c.1057C>A
Yt(a+b+)Heterozygous6.48
(n = 7)
0.00
(n = 0)
7.20
(n = 25)
0.40
(n = 2)
9.54
(n = 48)
8.38
(n = 41)
Table 4. Copy number variation analysis for 108 Norfolk Island samples performed with GATK and gCNV and annotated by ANNOTSV [26]. This analysis was focused on double deletions in blood group genes and compared to global frequencies for reference.
Blood Group System/GeneGenomic Positions for DeletionsImpacted Intron/ExonFrequency
NI
Frequency
Global
OMIM IDClinical Significance
CH/RG (ISBT 017)
C4A
31,995,858–
31,996,157
Intron 25-Intron 264.63%6.51%120810 [30] C4a deficiency [30]
31,996,158–
31,996,457
Intron 26-exon284.63%6.51%120810 [30]C4a deficiency [30]
31,996,458–
31,996,757
Exon 27-intron 285.55%6.51%120810 [30]C4a deficiency [30]
CH/RG
(ISBT 017)
C4B
32,028,596–
32,028,895
Intron 25-Intron 265.55%6.51%120820 [30]C4B deficiency [30]
32,028,896–
32,029,195
Intron 26-
Exon 28
7.40%6.51%120820 [30]C4B deficiency [30]
32,029,196–
32,029,495
Exon 28-
Intron 28
7.40%6.51%120820 [30]C4B deficiency [30]
ABO
(ISBT 001)
133,255,603133,255,902Exon 7-
Exon 7
1.85%1.29%616093 [30]Blood group, ABO system [30]
Table 5. Notable variants of weak and rare phenotypical expressions in the Norfolk Island population and their frequencies compared to those observed in other populations including a prediction of the weakened PEL+w phenotype.
Blood Group
System
ISBTZygosityRBCeq Prediction
PhenotypeNI%
N = 108
AFR%
N = 661
AMR%
N = 347
EAS%
N = 504
EUR%
N = 503
SAS%
N = 489
FY
(ISBT 008)
FY*02W.01HeterozygousFy(a+b+w) OR Fy(a+wb+) OR Fyˣ0.93
(n = 1)
0.00
(n = 0)
0.00
(n = 0)
0.00
(n = 0)
0.00
(n = 0)
0.00
(n = 0)
LW
(ISBT 016)
LW*05/LW*07HeterozygousLw(a+b+)0.93
(n = 1)
0
(n = 0)
0
(n = 0)
0
(n = 0)
0.80
(n = 4)
0
(n = 0)
KEL
(ISBT 006)
KEL*02/KEL*02.03HeterozygousK-k+0.93
(n = 1)
0.30
(n = 2)
3.17
(n = 11)
0.00
(n = 0)
0.40
(n = 12)
0.20
(n = 1)
PEL
(ISBT 040)
ABCC4*01.02W
c.912G>T
HomozygousPEL+w0.93
(n = 1)
5.3 (n = 35)0.29 (n = 1)3.17 (n = 16)0.99 (n = 5)2.66 (n = 13)
H
(ISBT 018)
FUT2*01W.02.01HomozygousH+w0.93
(n = 1)
0.00
(n = 0)
0.00
(n = 0)
19.05
(n = 94)
0.00
(n = 0)
0.00
(n = 0)
Disclaimer/Publisher’s Note: The statements, opinions and data contained in all publications are solely those of the individual author(s) and contributor(s) and not of MDPI and/or the editor(s). MDPI and/or the editor(s) disclaim responsibility for any injury to people or property resulting from any ideas, methods, instructions or products referred to in the content.

