
Comparative Transcriptome Analysis Reveals the Effect of Lignin on Storage Roots Formation in Two Sweetpotato (Ipomoea batatas (L.) Lam.) Cultivars

 and
and 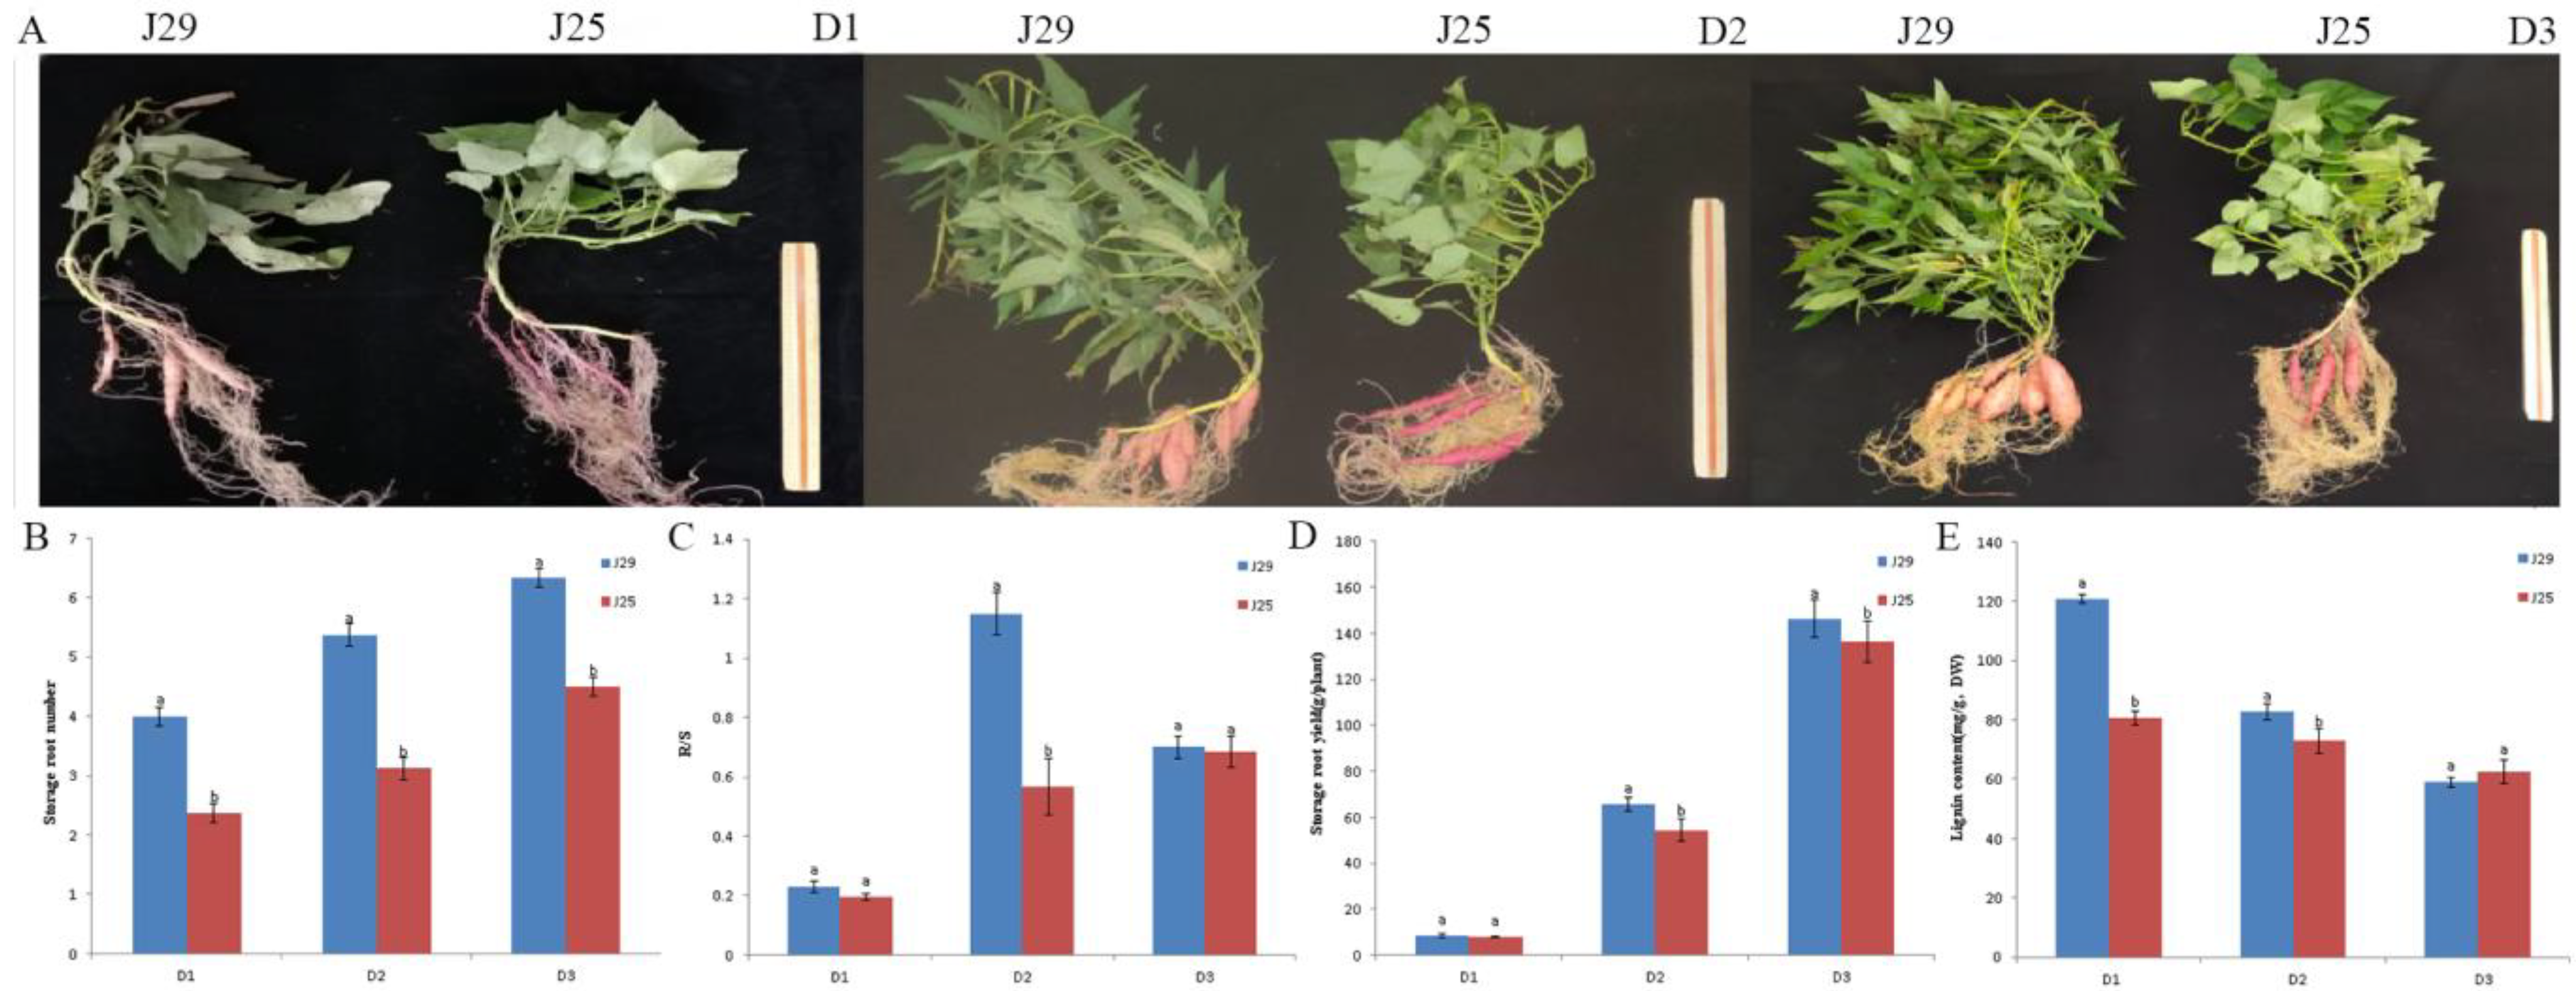
Abstract
1. Introduction
2. Materials and Methods
2.1. Plant Materials
2.2. Determination of Lignin Content
2.3. RNA Extraction, Full-Length cDNA Library Construction and Sequencing
2.4. Functional Annotation, Identification and Analysis of DEGs
2.5. Real-Time Quantitative PCR Validation
2.6. Statistical Analysis
3. Results
3.1. Characteristic of SR Development at Different Stages in Two Cultivars
3.2. Determination of Lignin Content
3.3. Global Analysis for RNA-Seq Data
3.4. Annotation and Classification of Sweetpotato Unigenes
3.5. Analysis of Differential Expression Genes (DEGs)
3.6. Pathway Analysis of DEGs
3.7. DEGs in Photosynthetic Carbon Fixation
3.8. DEGs in Starch and Sucrose Metabolism
3.9. DEGs in Phenylpropanoid Biosynthesis
3.10. DEGs in Hormone Signal Transduction
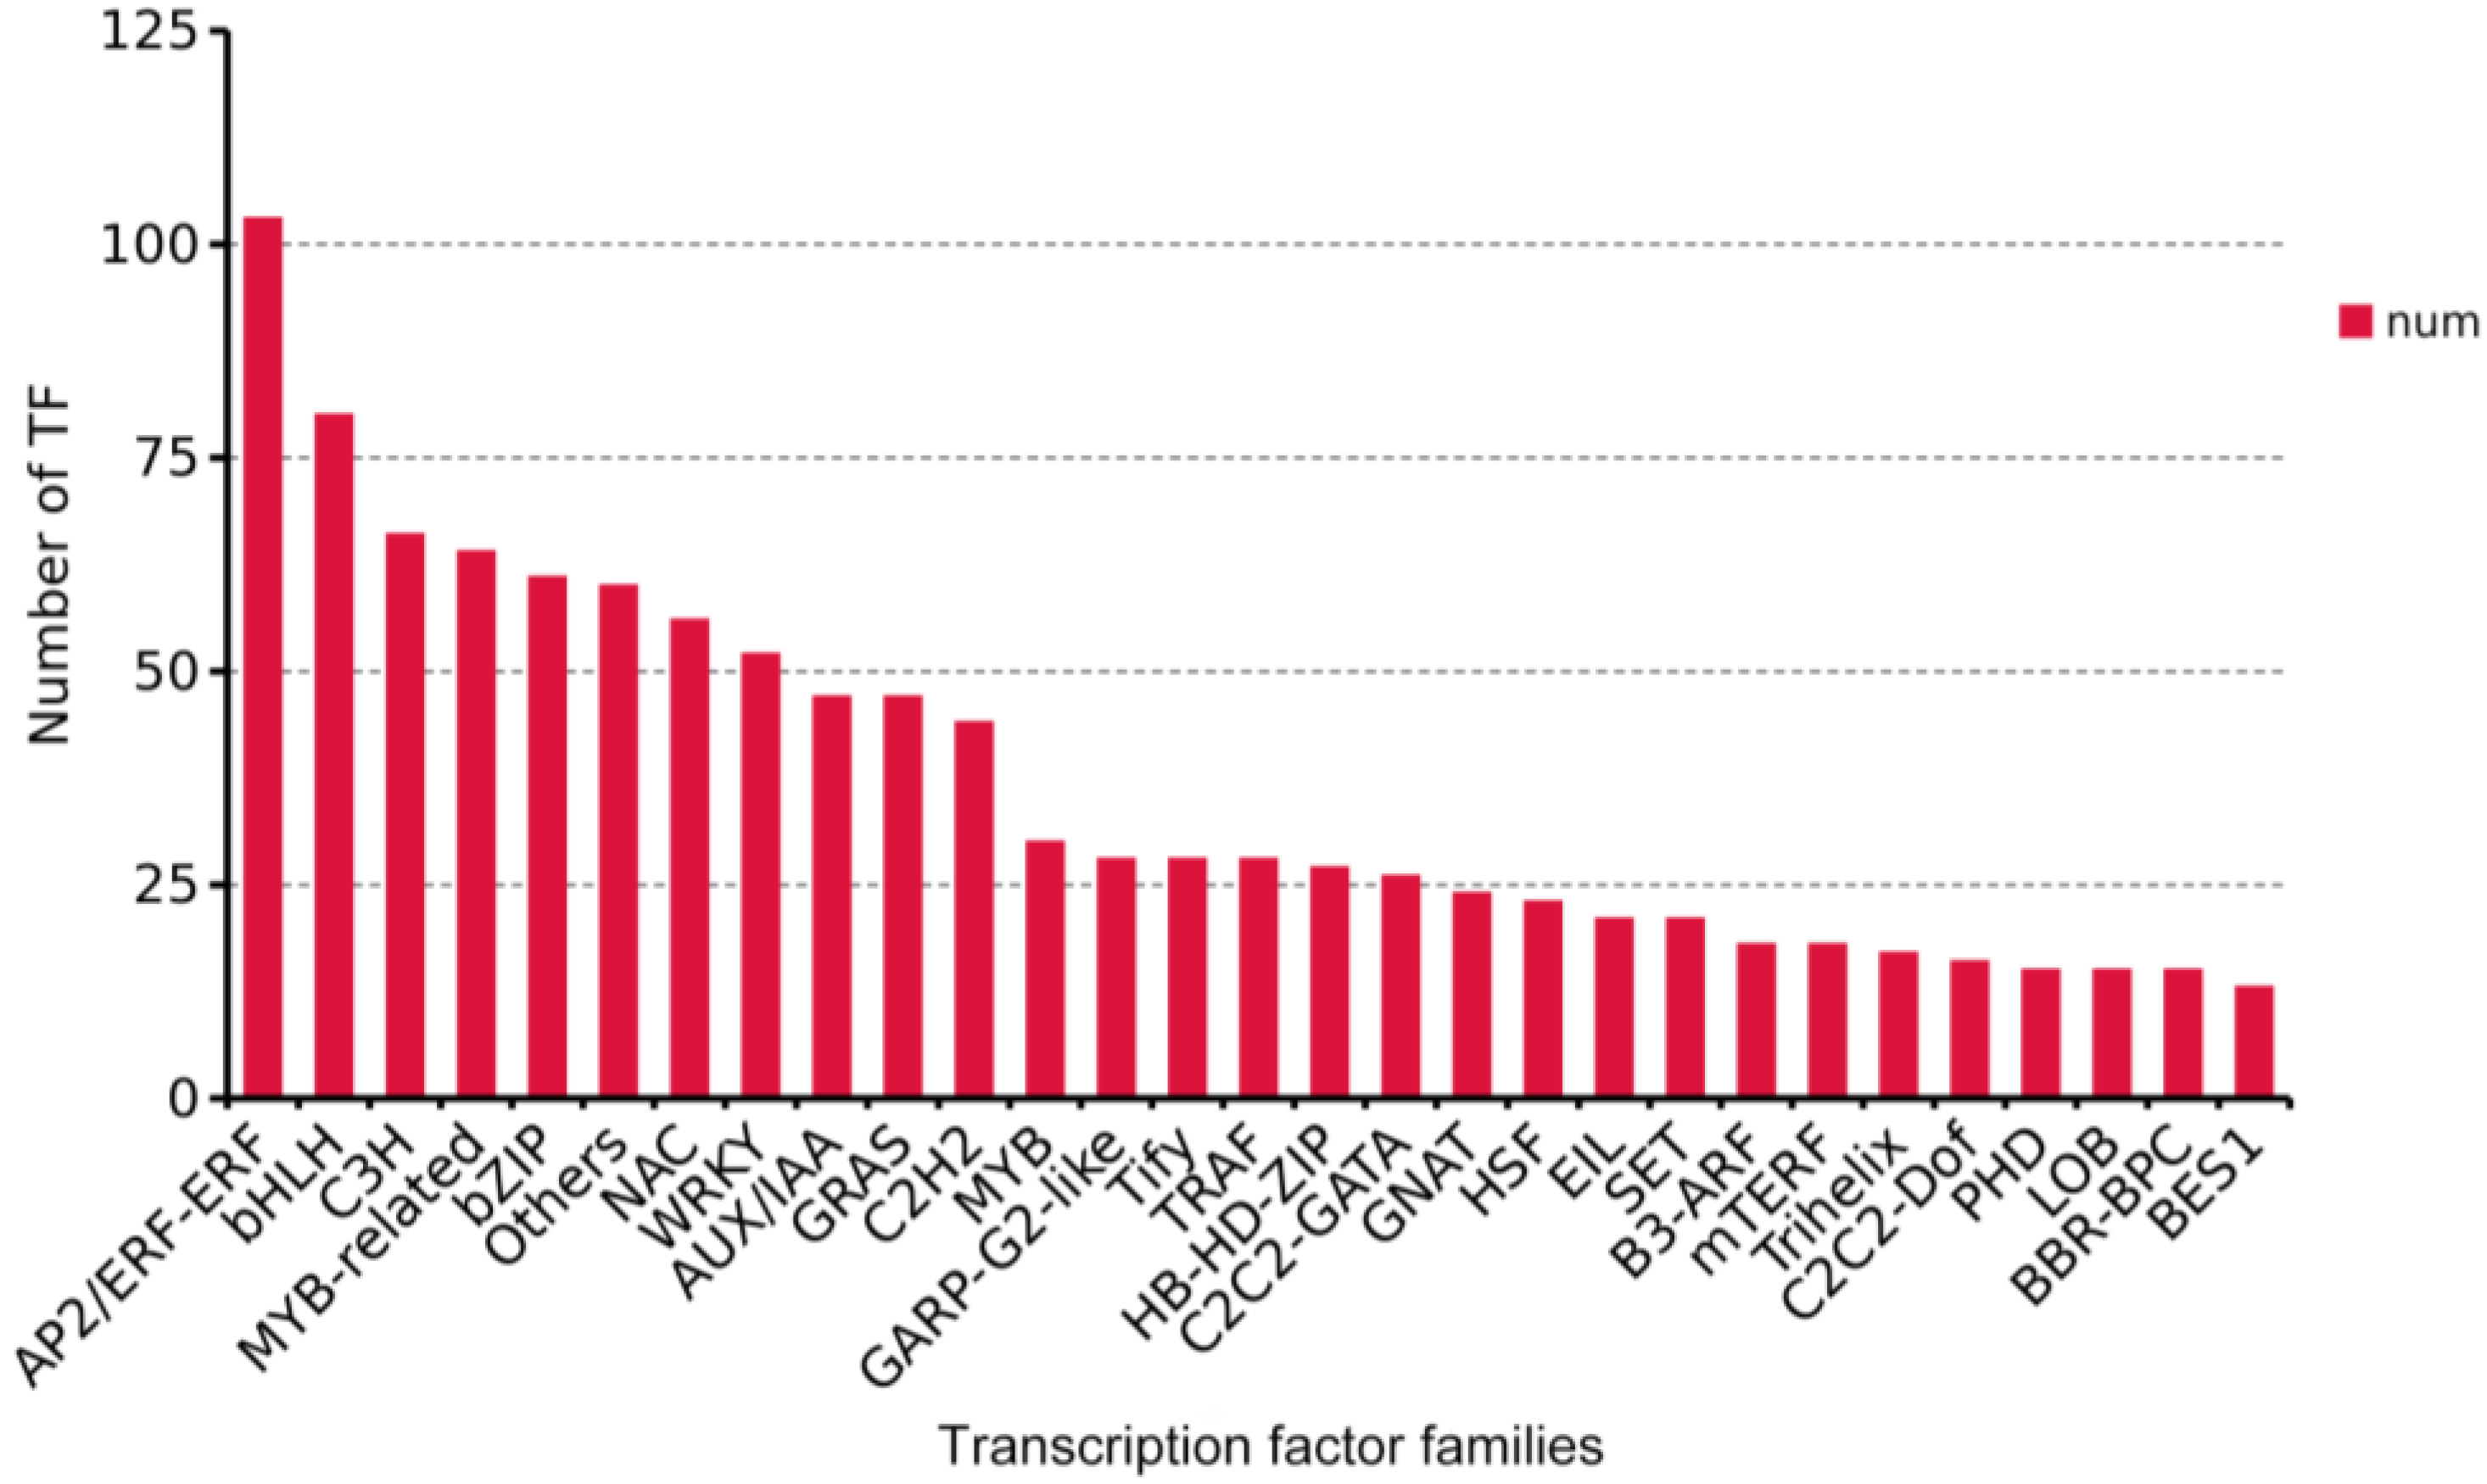
3.11. Differentially Expressed Transcription Factors in Root Development


3.12. Validation of RNA-Seq Results
4. Discussion
5. Conclusions
Supplementary Materials
Author Contributions
Funding
Data Availability Statement
Conflicts of Interest
References
- Lee, J.J.; Park, K.W.; Kwak, Y.-S.; Ahn, J.Y.; Jung, Y.H.; Lee, B.-H.; Jeong, J.C.; Lee, H.-S.; Kwak, S.-S. Comparative Proteomic Study between Tuberous Roots of Light Orange-and Purple-Fleshed Sweetpotato Cultivars. Plant Sci. 2012, 193, 120–129. [Google Scholar] [CrossRef] [PubMed]
- Fao Food and Agriculture Data. 2021. Available online: http://www.fao.org/faostat/zh/#home (accessed on 8 March 2023).
- Ravi, V.; Indira, P. Crop Physiology of Sweetpotato. Hortic. Rev. 2010, 23, 277–338. [Google Scholar]
- Gurmu, F.; Hussein, S.; Laing, M. Genotype-by-Environment Interaction and Stability of Sweetpotato Genotypes for Root Dry Matter, β-Carotene and Fresh Root Yield. Open Agric. 2017, 2, 473–485. [Google Scholar] [CrossRef]
- Laurie, S.M.; Booyse, M. Employing the Gge Sreg Model Plus Elston Index Values for Multiple Trait Selection in Sweetpotato. Euphytica 2015, 204, 433–442. [Google Scholar] [CrossRef]
- Solis, J.; Villordon, A.; Baisakh, N.; LaBonte, D.; Firon, N. Effect of Drought on Storage Root Development and Gene Expression Profile of Sweetpotato under Greenhouse and Field Conditions. J. Am. Soc. Hortic. Sci. 2014, 139, 317–324. [Google Scholar] [CrossRef]
- Bararyenya, A.; Tukamuhabwa, P.; Gibson, P.; Grüneberg, W.; Ssali, R.; Low, J.; Odong, T.; Ochwo-Ssemakula, M.; Talwana, H.; Mwila, N. Continuous Storage Root Formation and Bulking in Sweetpotato. Gates Open Res. 2019, 3, 83. [Google Scholar] [CrossRef]
- Kim, Y.-H.; Park, S.-C.; Ji, C.Y.; Lee, J.J.; Jeong, J.C.; Lee, H.-S.; Kwak, S.-S. Diverse Antioxidant Enzyme Levels in Different Sweetpotato Root Types During Storage Root Formation. Plant Growth Regul. 2015, 75, 155–164. [Google Scholar] [CrossRef]
- Firon, N.; LaBonte, D.; Villordon, A.; Kfir, Y.; Solis, J.; Lapis, E.; Perlman, T.S.; Doron-Faigenboim, A.; Hetzroni, A.; Althan, L. Transcriptional Profiling of Sweetpotato (Ipomoea batatas) Roots Indicates Down-Regulation of Lignin Biosynthesis and up-Regulation of Starch Biosynthesis at an Early Stage of Storage Root Formation. BMC Genom. 2013, 14, 460. [Google Scholar] [CrossRef]
- Vanholme, R.; Demedts, B.; Morreel, K.; Ralph, J.; Boerjan, W. Lignin Biosynthesis and Structure. Plant Physiol. 2010, 153, 895–905. [Google Scholar] [CrossRef]
- Wang, H.; Yang, J.; Zhang, M.; Fan, W.; Firon, N.; Pattanaik, S.; Yuan, L.; Zhang, P. Altered Phenylpropanoid Metabolism in the Maize Lc-Expressed Sweet Potato (Ipomoea batatas) Affects Storage Root Development. Sci. Rep. 2016, 6, 18645. [Google Scholar] [CrossRef]
- Ohashi-Ito, K.; Oda, Y.; Fukuda, H. Arabidopsis Vascular-Related Nac-Domain6 Directly Regulates the Genes That Govern Programmed Cell Death and Secondary Wall Formation During Xylem Differentiation. Plant Cell 2010, 22, 3461–3473. [Google Scholar] [CrossRef]
- Zhou, J.; Lee, C.; Zhong, R.; Ye, Z.-H. Myb58 and Myb63 Are Transcriptional Activators of the Lignin Biosynthetic Pathway During Secondary Cell Wall Formation in Arabidopsis. Plant Cell 2009, 21, 248–266. [Google Scholar] [CrossRef] [PubMed]
- Yang, L.; Zhao, X.; Yang, F.; Fan, D.; Jiang, Y.; Luo, K. Ptrwrky19, a Novel Wrky Transcription Factor, Contributes to the Regulation of Pith Secondary Wall Formation in Populus trichocarpa. Sci. Rep. 2016, 6, 18643. [Google Scholar] [CrossRef] [PubMed]
- Chen, H.-C.; Song, J.; Wang, J.P.; Lin, Y.-C.; Ducoste, J.; Shuford, C.M.; Liu, J.; Li, Q.; Shi, R.; Nepomuceno, A. Systems Biology of Lignin Biosynthesis in Populus Trichocarpa: Heteromeric 4-Coumaric Acid: Coenzyme a Ligase Protein Complex Formation, Regulation, and Numerical Modeling. Plant Cell 2014, 26, 876–893. [Google Scholar] [CrossRef] [PubMed]
- Lu, S.; Li, Q.; Wei, H.; Chang, M.-J.; Tunlaya-Anukit, S.; Kim, H.; Liu, J.; Song, J.; Sun, Y.-H.; Yuan, L. Ptr-Mir397a Is a Negative Regulator of Laccase Genes Affecting Lignin Content in Populus trichocarpa. Proc. Natl. Acad. Sci. USA 2013, 110, 10848–10853. [Google Scholar] [CrossRef] [PubMed]
- Jin, Y.; Ye, N.; Zhu, F.; Li, H.; Wang, J.; Jiang, L.; Zhang, J. Calcium-Dependent Protein Kinase Cpk 28 Targets the Methionine Adenosyltransferases for Degradation by the 26s Proteasome and Affects Ethylene Biosynthesis and Lignin Deposition in Arabidopsis. Plant J. 2017, 90, 304–318. [Google Scholar] [CrossRef]
- Huang, D.; Wang, S.; Zhang, B.; Shang-Guan, K.; Shi, Y.; Zhang, D.; Liu, X.; Wu, K.; Xu, Z.; Fu, X. A Gibberellin-Mediated Della-Nac Signaling Cascade Regulates Cellulose Synthesis in Rice. Plant Cell 2015, 27, 1681–1696. [Google Scholar] [CrossRef]
- Zhang, K.; Novak, O.; Wei, Z.; Gou, M.; Zhang, X.; Yu, Y.; Yang, H.; Cai, Y.; Strnad, M.; Liu, C.-J. Arabidopsis Abcg14 Protein Controls the Acropetal Translocation of Root-Synthesized Cytokinins. Nat. Commun. 2014, 5, 3274. [Google Scholar] [CrossRef]
- Kim, S.; Nie, H.; Jun, B.; Kim, J.; Lee, J.; Kim, S.; Kim, E.; Kim, S. Functional Genomics by Integrated Analysis of Transcriptome of Sweet Potato (Ipomoea batatas (L.) Lam.) During Root Formation. Genes Genom. 2020, 42, 581–596. [Google Scholar] [CrossRef]
- Villordon, A.Q.; Labonte, D.; Firon, N.; Kfir, Y.; Schwartz, A. Characterization of Adventitious Root Development in Sweetpotato. Hortscience 2009, 44, 651–655. [Google Scholar] [CrossRef]
- Van Acker, R.; Vanholme, R.; Storme, V.; Mortimer, J.C.; Dupree, P.; Boerjan, W. Lignin Biosynthesis Perturbations Affect Secondary Cell Wall Composition and Saccharification Yield in Arabidopsis thaliana. Biotechnol. Biofuels 2013, 6, 46. [Google Scholar] [CrossRef] [PubMed]
- Luo, Y.; Ding, N.; Shi, X.; Wu, Y.; Wang, R.; Pei, L.; Xu, R.; Cheng, S.; Lian, Y.; Gao, J. Generation and Comparative Analysis of Full-Length Transcriptomes in Sweetpotato and Its Putative Wild Ancestor I. trifida. bioRxiv 2017, 112425. [Google Scholar] [CrossRef]
- Li, B.; Dewey, C.N. Rsem: Accurate Transcript Quantification from RNA-Seq Data with or without a Reference Genome. BMC Bioinform. 2011, 12, 1–16. [Google Scholar] [CrossRef] [PubMed]
- Anders, S.; Huber, W. Differential Expression Analysis for Sequence Count Data. Genome Biol. 2010, 11, R106. [Google Scholar] [CrossRef] [PubMed]
- Langfelder, P.; Horvath, S. Wgcna: An R Package for Weighted Correlation Network Analysis. BMC Bioinform. 2008, 9, 559. [Google Scholar] [CrossRef]
- Jeong, H.; Mason, S.P.; Barabási, A.-L.; Oltvai, Z.N. Lethality and Centrality in Protein Networks. Nature 2001, 411, 41–42. [Google Scholar] [CrossRef]
- Qin, Z.; Hou, F.; Li, A.; Dong, S.; Huang, C.; Wang, Q.; Zhang, L. Comparative Analysis of Full-Length Transcriptomes Based on Hybrid Population Reveals Regulatory Mechanisms of Anthocyanin Biosynthesis in Sweet Potato (Ipomoea batatas (L.) Lam). BMC Plant Biol. 2020, 20, 299. [Google Scholar] [CrossRef]
- Singh, J.; Pandey, P.; James, D.; Chandrasekhar, K.; Achary, V.M.M.; Kaul, T.; Tripathy, B.C.; Reddy, M.K. Enhancing C3 Photosynthesis: An Outlook on Feasible Interventions for Crop Improvement. Plant Biotechnol. J. 2014, 12, 1217–1230. [Google Scholar] [CrossRef]
- Guo, H.-S.; Xie, Q.; Fei, J.-F.; Chua, N.-H. Microrna Directs Mrna Cleavage of the Transcription Factor Nac1 to Downregulate Auxin Signals for Arabidopsis Lateral Root Development. Plant Cell 2005, 17, 1376–1386. [Google Scholar] [CrossRef]
- Liu, R.; Cai, X.-T.; Zhao, P.-X.; Xu, P.; Xiang, C.-B. Arabidopsis Erf109 Regulates Auxin Transport-Related Genes in Root Development. bioRxiv 2019, 725572. [Google Scholar] [CrossRef]
- Ohashi-Ito, K.; Matsukawa, M.; Fukuda, H. An Atypical Bhlh Transcription Factor Regulates Early Xylem Development Downstream of Auxin. Plant Cell Physiol. 2013, 54, 398–405. [Google Scholar] [CrossRef] [PubMed]
- Nakano, Y.; Yamaguchi, M.; Endo, H.; Rejab, N.A.; Ohtani, M. Nac-Myb-Based Transcriptional Regulation of Secondary Cell Wall Biosynthesis in Land Plants. Front. Plant Sci. 2015, 6, 288. [Google Scholar] [CrossRef]
- Wang, H.; Avci, U.; Nakashima, J.; Hahn, M.G.; Chen, F.; Dixon, R.A. Mutation of Wrky Transcription Factors Initiates Pith Secondary Wall Formation and Increases Stem Biomass in Dicotyledonous Plants. Proc. Natl. Acad. Sci. USA 2010, 107, 22338–22343. [Google Scholar] [CrossRef]
- Kazan, K. Auxin and the Integration of Environmental Signals into Plant Root Development. Ann. Bot. 2013, 112, 1655–1665. [Google Scholar] [CrossRef]
- Silverstone, A.L.; Ciampaglio, C.N.; Sun, T.-P. The Arabidopsis Rga Gene Encodes a Transcriptional Regulator Repressing the Gibberellin Signal Transduction Pathway. Plant Cell 1998, 10, 155–169. [Google Scholar] [CrossRef] [PubMed]
- Zhu, M.; Xie, H.; Wei, X.; Dossa, K.; Yu, Y.; Hui, S.; Tang, G.; Zeng, X.; Yu, Y.; Hu, P. Wgcna Analysis of Salt-Responsive Core Transcriptome Identifies Novel Hub Genes in Rice. Genes 2019, 10, 719. [Google Scholar] [CrossRef] [PubMed]
- Belehu, T.; Hammes, P.S.; Robbertse, P.J. The Origin and Structure of Adventitious Roots in Sweet Potato (Ipomoea batatas). Aust. J. Bot. 2004, 52, 551–558. [Google Scholar] [CrossRef]
- Biemelt, S.; Tschiersch, H.; Sonnewald, U. Impact of Altered Gibberellin Metabolism on Biomass Accumulation, Lignin Biosynthesis, and Photosynthesis in Transgenic Tobacco Plants. Plant Physiol. 2004, 135, 254–265. [Google Scholar] [CrossRef] [PubMed]
- Zierer, W.; Rüscher, D.; Sonnewald, U.; Sonnewald, S. Tuber and Tuberous Root Development. Annu. Rev. Plant Biol. 2021, 72, 551–580. [Google Scholar] [CrossRef]
- Singh, V.; Sergeeva, L.; Ligterink, W.; Aloni, R.; Zemach, H.; Doron-Faigenboim, A.; Yang, J.; Zhang, P.; Shabtai, S.; Firon, N. Gibberellin Promotes Sweetpotato Root Vascular Lignification and Reduces Storage-Root Formation. Front. Plant Sci. 2019, 10, 1320. [Google Scholar] [CrossRef]
- Pandey, V.P.; Awasthi, M.; Singh, S.; Tiwari, S.; Dwivedi, U.N. A Comprehensive Review on Function and Application of Plant Peroxidases. Biochem. Anal. Biochem. 2017, 6, 308. [Google Scholar] [CrossRef]
- Kim, Y.-H.; Kim, C.Y.; Song, W.-K.; Park, D.-S.; Kwon, S.-Y.; Lee, H.-S.; Bang, J.-W.; Kwak, S.-S. Overexpression of Sweetpotato Swpa4 Peroxidase Results in Increased Hydrogen Peroxide Production and Enhances Stress Tolerance in Tobacco. Planta 2008, 227, 867–881. [Google Scholar] [CrossRef]
- Lee, C.-J.; Park, S.-U.; Kim, S.-E.; Lim, Y.-H.; Ji, C.Y.; Kim, Y.-H.; Kim, H.S.; Kwak, S.-S. Overexpression of Iblfp in Sweetpotato Enhances the Low-Temperature Storage Ability of Tuberous Roots. Plant Physiol. Biochem. 2021, 167, 577–585. [Google Scholar] [CrossRef]
- Meng, X.; Liu, S.; Dong, T.; Li, Z.; Ma, D.; Pan, S.; Zhu, M. Identification, Expression Analysis, and Functional Characterization of Salt Stress-Responsive Genes of Ap2/Erf Transcription Factors in Sweetpotato. Crop Sci. 2020, 60, 3247–3260. [Google Scholar] [CrossRef]
- Li, T.; Wang, W.; Chen, Q.; Chen, J.; Zhang, X.; Wei, L.; Deng, L.; Yao, S.; Zeng, K. Transcription Factor Cserf1b Regulates Postharvest Citrus Fruit Resistance to Penicillium digitatum. Postharvest Biol. Technol. 2023, 198, 112260. [Google Scholar] [CrossRef]
- Wessels, B.; Seyfferth, C.; Escamez, S.; Vain, T.; Antos, K.; Vahala, J.; Delhomme, N.; Kangasjärvi, J.; Eder, M.; Felten, J. An Ap 2/Erf Transcription Factor Erf 139 Coordinates Xylem Cell Expansion and Secondary Cell Wall Deposition. New Phytol. 2019, 224, 1585–1599. [Google Scholar] [CrossRef] [PubMed]
- Bian, X.; Kim, H.S.; Kwak, S.-S.; Zhang, Q.; Liu, S.; Ma, P.; Jia, Z.; Xie, Y.; Zhang, P.; Yu, Y. Different Functions of Ibrap2.4, a Drought-Responsive Ap2/Erf Transcription Factor, in Regulating Root Development between Arabidopsis and Sweetpotato. Front. Plant Sci. 2022, 13, 820450. [Google Scholar] [CrossRef] [PubMed]


Disclaimer/Publisher’s Note: The statements, opinions and data contained in all publications are solely those of the individual author(s) and contributor(s) and not of MDPI and/or the editor(s). MDPI and/or the editor(s) disclaim responsibility for any injury to people or property resulting from any ideas, methods, instructions or products referred to in the content. |
© 2023 by the authors. Licensee MDPI, Basel, Switzerland. This article is an open access article distributed under the terms and conditions of the Creative Commons Attribution (CC BY) license (https://creativecommons.org/licenses/by/4.0/).
Share and Cite
Du, T.; Qin, Z.; Zhou, Y.; Zhang, L.; Wang, Q.; Li, Z.; Hou, F. Comparative Transcriptome Analysis Reveals the Effect of Lignin on Storage Roots Formation in Two Sweetpotato (Ipomoea batatas (L.) Lam.) Cultivars. Genes 2023, 14, 1263. https://doi.org/10.3390/genes14061263
Du T, Qin Z, Zhou Y, Zhang L, Wang Q, Li Z, Hou F. Comparative Transcriptome Analysis Reveals the Effect of Lignin on Storage Roots Formation in Two Sweetpotato (Ipomoea batatas (L.) Lam.) Cultivars. Genes. 2023; 14(6):1263. https://doi.org/10.3390/genes14061263
Chicago/Turabian StyleDu, Taifeng, Zhen Qin, Yuanyuan Zhou, Lei Zhang, Qingmei Wang, Zongyun Li, and Fuyun Hou. 2023. "Comparative Transcriptome Analysis Reveals the Effect of Lignin on Storage Roots Formation in Two Sweetpotato (Ipomoea batatas (L.) Lam.) Cultivars" Genes 14, no. 6: 1263. https://doi.org/10.3390/genes14061263
APA StyleDu, T., Qin, Z., Zhou, Y., Zhang, L., Wang, Q., Li, Z., & Hou, F. (2023). Comparative Transcriptome Analysis Reveals the Effect of Lignin on Storage Roots Formation in Two Sweetpotato (Ipomoea batatas (L.) Lam.) Cultivars. Genes, 14(6), 1263. https://doi.org/10.3390/genes14061263