Article

Genetic Diversity and Population Differentiation of a Chinese Endangered Plant Ammopiptanthus nanus (M. Pop.) Cheng f.

Ministry of Education Key Laboratory of Xinjiang Phytomedicine Resource Utilization, College of Life Sciences, Shihezi University, Shihezi 832003, China
*
Author to whom correspondence should be addressed.
Genes 2023, 14(5), 1020; https://doi.org/10.3390/genes14051020
Submission received: 26 February 2023 / Revised: 25 April 2023 / Accepted: 28 April 2023 / Published: 29 April 2023
(This article belongs to the Special Issue Molecular Phylogenetics and Phylogeography of Seed Plants)

Abstract

:
Ammopiptanthus nanus (M. Pop.) Cheng f. is a very important resource plant that integrates soil and water conservation, afforestation of barren mountains, and ornamental, medicinal, and scientific research functions and is also a critically endangered plant in China, remaining in only six small fragmented populations in the wild. These populations have been suffering from severe anthropomorphic disturbances, causing further losses in genetic diversity. However, its genetic diversity level and genetic differentiation degree among the fragmented populations are still unclear. Inthis study, DNA was extracted from fresh leaves from the remnant populations of A. nanus, and the inter-simple-sequence repeat (ISSR) molecular marker system was used to assess its level of genetic diversity and differentiation. The result was that its genetic diversity is low at both species and population levels, with only 51.70% and 26.84% polymorphic loci, respectively. The Akeqi population had the highest genetic diversity, whereas the Ohsalur and Xiaoerbulak populations had the lowest. There was significant genetic differentiation among the populations, and the value of the genetic differentiation coefficient (Gst) was as high as 0.73, while the gene flow value was as low as 0.19 owing to spatial fragmentation and a serious genetic exchange barrier among the populations. It is suggested that a nature reserve and germplasm banks should be established as soon as possible for elimination of the anthropomorphic disturbances, and mutual introductions between the populations and introduced patches of the species, such as with habitat corridors or stepping stones, should be performed simultaneously to improve the genetic diversity of the isolated populations for the conservation of this plant.

1. Introduction

Genetic diversity is the amount of genetic variability present among individuals of a variety or population within a species. It is the product of the recombination of genetic material (DNA) during the inheritance process, mutation, gene flow, and genetic drift [1], and it results in variations in DNA sequence, epigenetic profiles, protein structures and isoenzymes, physiological properties, and morphological properties [2].
Genetic diversity within a species is a determinant of its successful response to natural or anthropogenic disturbance events, and the level of genetic diversity also determines evolutionary trends in a species. High genetic diversity improves species’ adaptability [3]; thus, decreases in genetic diversity may reduce the adaptative potential of a species [4], typically resulting in a higher probability of extinction. Generally, it is believed that the genetic diversity of endangered plants is lower than that of ordinary species due to the small number of remaining plants, genetic drift caused by inbreeding or self-inbreeding, and an increase in homozygotes [5]. Studies on the genetic diversity of endangered species can reveal the mechanisms of their endangerment [6] and provide a scientific basis for conservation strategies [7]. Thus, this has gained increasing attention from conservation biologists [8,9].
Habitat fragmentation can transform a large and continuous population into several small, isolated parts surrounded by heterogeneous landscapes [10,11]. The level of inter-population gene flow decreases as isolation increases, leading to increased genetic differentiation among populations. Small populations tends to have low genetic diversity [12] and, thus, a high risk of local extinction [13,14]. Intra- and inter-population genetic variation, gene flow, and genetic differentiation between fragmented populations may provide further information on the causes of their endangerment and aid in formulating effective conservation strategies.
A very valuable relict plant, A. nanus is the Leguminaceae family and is a solo broad-leaved evergreen plant in the desert region of northwest China [15]. It is only found in a limited area in Kyrgyzstan [16] and in the Wuqia County of China, at an altitude of 2000–2400 m [15,17], growing on sunny arid slopes with 138 mm of average annual precipitation, 2580 mm of annual average evaporation, a 35 °C extreme maximum temperature, and a −30 °C of extreme minimum temperature, and is considered a super-arid plant with outstanding biological properties of drought tolerance [18] and cold tolerance [19,20,21] as well as the ecological values of wind protection, sand fixation, and prevention of soil erosion; its flower number is large, and its yellow corolla and “explosive” opening pattern in a short time has high ornamental value (Figure 1); its stems and leaves are rich in alkaloids, flavonoids, and phenylpropanoids [22], which were traditionally used for medicinal purposes; and it also has important academic value in the study of paleoclimatic changes.
However, climate change and long-term anthropogenic and natural disturbance events have resulted in a thin population of the species, with only six small, isolated surviving populations [23,24,25], and the species is listed as a national endangered plant in China. Furthermore, the species has since been strongly disturbed by grazing, logging, flooding, insect pests, and road-building in the past two decades [17]. Death is common in its wild populations; however, seedlings are extremely rare. Its genetic diversity has likely changed. For example, 31 individuals existed in the eastern Kangsu population 20 years ago, but only two currently remain due to highway-building, and the population is on the verge of extinction.
Although the level of genetic diversity and the population differentiation of the plant has been examined, there are great differences between the results of different studies. The results of Ge et al. (2005) showed that there was a low level of genetic differentiation, with only 8.5% of genetic differences occurring among populations [26]; however, Chen et al. [27] and Zhao et al.’s research [28], based on allozymes and RAPD molecular markers respectively, showed opposite results. Since a precise study on the degree of genetic differentiation and the level of genetic diversity is lacking, it is difficult to develop effective conservation measures for this endangered species.
There are many molecular markers available these days to analyze genetic diversity and population genetic structure in plants. The most frequently used molecular markers are inter-simple-sequence repeats (ISSR) [29]. The main advantages of using this method is that it is highly efficient, quick, inexpensive, robust, reproducible, highly polymorphic, randomly distributed throughout the genomes, and widely applicable to any genome [7]. The method has been effectively used for estimation of the genetic diversity and population genetic structure of plant resources [30,31,32].
Therefore, fresh leaves from all surviving populations of A. nanus were collected in this study, and inter-simple-sequence repeat (ISSR)-based genetic structure analysis was conducted for examining the genetic diversity level and genetic differentiation extent of the species and proposing effective conservation strategies.

2. Materials and Methods

According to the literature and our field investigations, there are only six populations of A. nanus (Tuopa, Akeqi, Kangsu, Xiaoerbulak, Ohsalur, and Heiziwei) surviving in Wuqia county in China (Table 1). Twenty individuals in each population were sampled randomly, and one young and healthy leaf of each individual was collected in 2022, regardless of size or age. The leaf was placed in a plastic self-sealing bag, and sufficient dried silica gel was added to rapidly dehydrate the leaves until DNA extraction.
DNA Extraction and PCR Amplification: DNA was extracted from the leaves using the DNA secure New Plant Genomic DNA Extraction Kit DP-3200 (Beijing Tiangen Biochemical Technology Co., Ltd. Germany). The extracted DNA was checked for purity and quality by agarose gel electrophoresis and was stored at −80 °C.
Polymerase chain reaction (PCR) amplification was performed using a Mastercycler Nexus X2 (Germany). The total volume of the amplification system was 25 μL, containing 2 μL of template DNA, 2 μL of primers, 12.5 μL of 2 × Taq PCR Mix, and 8.5 μL of ddH2O. Initial denaturation was performed at 94 °C for 5 min, followed by 45 cycles of 30 s at 94 °C, 60 s at 50–54 °C (depending on the primer), and 120 s at 72 °C; the final extension was at 72 °C for 7 min.
Nuclear DNA was amplifified by PCR using ISSR primers from the University of British Columbia primer set 9 (University of British Columbia, primer set #9). Following an initial screening from 100 primers, 10 primers that obtained maximum numbers of reliable and reproducible polymorphisms were then selected for analysis of the populations (Table 2).
Only bands that were clearly recorded across all populations were used. The ISSR profiles for each sample were scored on the presence or absence of the amplified products. The percentage of polymorphic loci (P), the average number of observed alleles per locus (NA), the effective number of alleles per locus (NE), Shannon’s information index (I), Nei’s gene diversity index (H), the genetic differentiation coefficient (Gst = 1-Hs/Ht, where Ht is the overall genetic diversity and Hs is the genetic diversity within a population), gene flow level (Nm), genetic distance, and genetic similarity were calculated using the POPGENE 32 software. SPSS 20.0 software was used for statistical analysis of the genetic diversity of A. nanus at species and population levels, and Duncan multiple comparisons were used for significant difference tests of NA, NE, H, and I among the populations (p < 0.05). The data are presented in the form of mean ± standard error. UPGMA clustering maps were constructed using NTSYS 2.1 software.

3. Results

3.1. Genetic Diversity Analysis

In this study, the 10 ISSR primers produced 136 unambiguous electrophoretic bands, among which 70 loci were polymorphic. The genetic diversity of A. nanus was low, with 51.70% and 26.84% polymorphic bands (P) at the species and population levels, respectively. However, the diversity parameters differed significantly among the six populations (Table 3).

3.2. Gene Flow

Our results show that the Nm of A. nanus is only 0.19, which is a very low level (Table 4).

3.3. Genetic Distance and Genetic Similarity among Populations

The genetic distances among the populations were relatively short, from 0.22 to 0.58, with a mean of 0.42. The populations showed a moderate level of genetic similarity (0.56–0.80), with a mean value of 0.66. The genetic similarity between the Ohsalur and Akeqi populations was the highest, but that between Ohsalur and Tuopa populations was the lowest (Table 5).

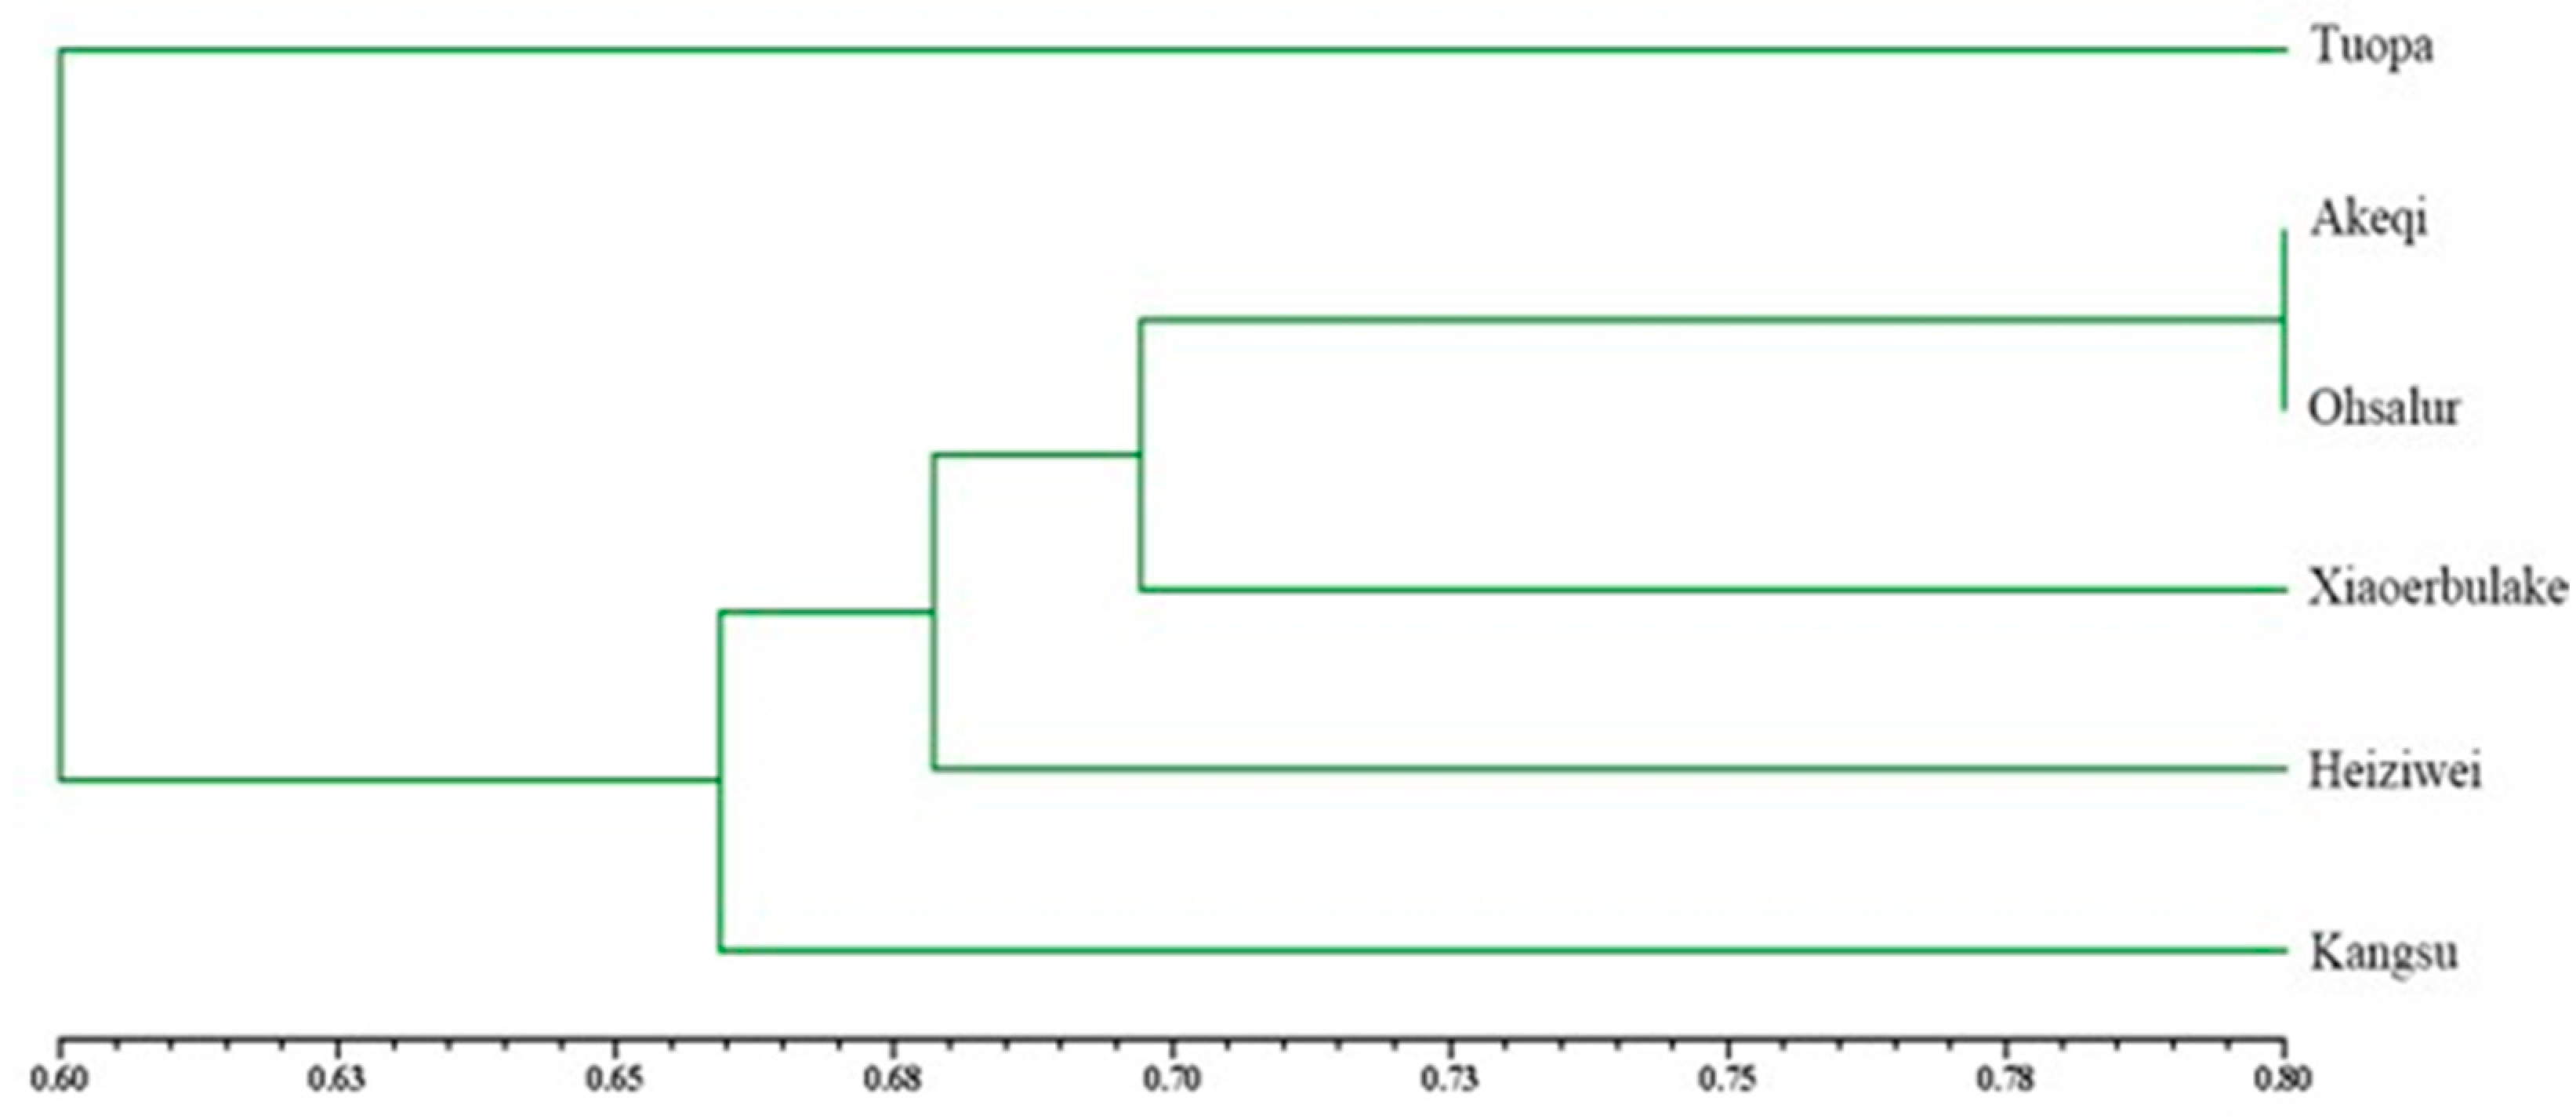
3.4. UPGMA Clustering

An UPGMA clustering map of the populations was constructed using NTSYS 2.1 software (Figure 2), which showed that the genetic distance between Akeqi and Ohsalur populations was the shortest.

4. Discussion

Study of genetic diversity and the population differentiation of an endangered species is a basis for exploring the adaptation of the species to its environment and is core to conservation biology. The genetic diversity of plant populations is determined by many factors, such as habitat type, reproductive mode, genetic mutation, genetic drift, and gene flow [33]. The percentage of polymorphic loci (P), Nei’s gene diversity index (H), and Shannon’s information index (I) are usually used for describing the genetic diversity level of a population or a species [26,34,35,36].
The genetic diversity revealed in our study is lower than that detected by Zhao et al. [28] and is much lower than that of its congener A. mongolicus [26]. The H and I of A. nanus were also extremely low at both species and population levels in the present study.
Zhao et al. (2016) found that the Kangsu population had the highest genetic diversity, the Xiaoerbulak population had the lowest, and the Ohsalur population was moderately diverse [28]. However, our results showed that, among the six populations, the Ohsalur and Xiaoerbulak populations had the lowest genetic diversity, with P values of less than 20% and H values of less than 0.1. Additionally, the P and NA of the Xiaoerbulak population were the lowest (16.91% and 1.17, respectively), and the NE, H, and I of the Ohsalur population were just 1.09, 0.06, and 0.09, respectively. Moreover, the Kangsu population had a moderate level of genetic diversity. These differences between the two works may be due to the individuals sampled, the primer sequences and molecular markers selected being different from each other, or the deaths of many individuals in Kangsu and Ohsalur populations because of the building of roads and construction of flood-control channels and reservoirs during the last decades, leading to an obvious reduction in population genetic diversity. Relatively speaking, the Akeqi population was the most genetically diverse, with the highest values for each parameter (P = 43.38, NA = 1.43, NE = 1.26, H = 1.53, and I = 0.23).
Frequent disturbance events, such as flooding, (Figure 3a), road-building, (Figure 3b), logging, (Figure 3c), grazing, (Figure 3d), and insect feeding (Figure 3e) have severely reduced the fitness of the endangered plant. Although it was classified as a national first-class protected plant in China, no forms of in situ conservation measures have been taken, such as any level of nature reserve, and illegal felling still occurs in the field. During our field survey in 2021, we found that more than 20 individuals in the Ohsalur population were surreptitiously felled, and grazing was common in all populations [37]. Camels, horse, sheep, and goats are common livestock in the A. nanus communities, and camels and goats are the main herbivores and they prefer the buds, shoot tips, young branches, and leaves. Although A. nanus is a shrub, its branches are fragile; individuals along gullies are susceptible to damage from rocks rolling down along the mountain slope owing to flooding, and approximately 80% of individuals along gullies were broken by rocks (Figure 3f).
The overall Gst of the A. nanus populations was 0.73 (Table 4), indicating that 73% of the genetic variation existed among populations, and the genetic variation within each population was only 27%, which is consistent with the allelic enzyme analysis result from Chen et al. [26] and the RAPD analysis result from Zhao et al. [28], illustrating that the genetic similarity among the individuals within the population is high, the genetic differenations between the populations are severe, and there are some obvious inter-population gene flow obstacles.
Govindaraju classified Nm, which indicates genetic exchange between populations, into three levels: high for Nm ≥ 1.00, moderate for 0.25 < Nm < 0.99, and low for Nm ≤ 0.25 [38]. Gene flow can prevent or reduce genetic differences between populations accumulated by isolation, and frequent gene flow (Nm > 1.0) can prevent differentiation between populations caused by genetic drift. At Nm < 1.0, genetic drift is the dominant cause of differentiation among populations [34,36,39,40]. Our results show that the gene-exchange level among the six wild populations of A. nanus is very low, which intensifies their inter-population genetic differentiation, and there is a clear trend of increase.
A complex breeding system was found in A. nanus, with both apomixis and sexual reproduction, and yields 30% and 28% fruit sets by spontaneous self-pollination and heterozygous pollination, respectively [41]. It has an explosive flowering pattern, with tens to hundreds of open flowers on each individual during its brief flowering period. This blooming pattern and its self-compatible mating system may increase the chance of self-pollination, which may reduce the genetic diversity of the offspring, producing a high level of genetic similarity within a population. Anthophora (Dasymegilla) waltoni Cockerell, Megachile (Chalcodoma) sp., and Halictus sp. are its main pollinators [42]; their effective pollination distance generally does not exceed 2.5 km. However, the six populations were strongly fragmented and separated by 30 km at least. Thus, lack of pollinators may contribute to the low Nm among the six populations.
Wuqia County is the historical refuge of the Tertiary glacial period relic species A. nanus. The present populations likely evolved from a few individuals that survived a previous bottleneck event; thus, genetic similarity among individuals within the present population is very high, owing to a founder effect [43].
An UPGMA clustering map showed that the genetic distance between Akeqi and Ohsalur populations was the shortest, although the spatial distance between the two sites was the greatest. Previous studies showed that the genetic distance between populations was proportional to the spatial distance between them [34,36,39]; however, inconsistencies also existed in this relationship [35,40]. The Akeqi and Ohsalur populations are spatially remote but genetically close; thus, the two populations are genetically similar, possibly owing to genetically similar ancestors. Since the genetic structure of the Tuopa poipulation was unique, and the genetic similarity between the Tuopa and Akeqi or Ohsalur populations was the lowest, propagules from Tuopa may be transplanted into other populations to improve their genetic diversity levels.

5. Conclusions

Populations of A. nanus face serious threats from low genetic diversity, isolation, and lack of gene flow, resulting in strong inter-population genetic differentiation. These populations have been suffering from severe anthropomorphic disturbances, causing further losses in genetic diversity. Survival of the endangered plant has been negatively affected by some anthropomorphic interference events, reducing the fitness of the species in its native habitat. The population size has been decreasing and is rarely replenished by seedlings. Thus, genetic diversity of the species will continue to decrease if no positive steps are taken.
Therefore, a nature reserve for this species and germplasm banks should be established as soon as possible, and anthropomorphic disturbances, such as felling, road-building, or grazing activities, should be strictly prohibited. Second, manual interventions through seed sowing and mutual transplantation among populations should be carried out to increase populations’ genetic diversity. In particular, since the Akeqi and Heiziwei populations are highly genetically diverse, seeds can be collected from these populations and widely sown in other populations to improve their genetic diversity.
Identifying species distribution and habitat change is an important part of effective conservation management. Nevertheless, economic development and rapid population growth worldwide in the past few decades have led to dramatic changes in land cover, habitat fragmentation and loss of species, especially in China [44,45]. Habitat fragmentation is commonly brought on by the human activities of logging, building roads, and other construction. When large areas of habitat are fragmented, resources are reduced, and this can lead to declines in a species’ population and even threaten its survival. Fragmentation divides individuals into several parts within a population and cuts them off from crucial resources [46]. Habitat fragmentation and loss can also reduce population connectivity between habitat patches, increase isolation, alter the composition and configuration of key habitats, increase the risk of species extinction, and ultimately affect biodiversity and ecosystem health. A dense population and a developed economy characteristic of this region would lead to high consumption of natural resources. Therefore, coordinating biodiversity conservation and economic development at a minimum cost has become a complex problem for stakeholders and scientists in conservation planning in China.
Landscape connectivity has potential effects on the survival, fitness, gene flow, diversity, and colonization of distinct small populations and has changed habitat suitability in the area. Habitat corridors save limited land resources and are the main countermeasure for species to reduce the negative impacts of habitat fragmentation and loss, which can promote the connectivity of habitat patches, increase habitat connectivity, and maintain material, energy, and gene flows and interactions among populations in remaining habitat patches [47]. The ecological network approach aims to expand the integrity of environmental processes, facilitate the conservation of species and habitats, and promote biodiversity, and a stepping stone is a specific kind of corridor where small patches provide habitats for shelter, feeding, or resting [48].
Due to the long-term impact of human activities, A. nanus’s habitats are facing the threat of fragmentation and loss, posing a serious challenge to its survival and diversity. Introduced patches of A. nanus should be planted in suitable ranges between the six surviving populations as habitat corridors or stepping stones to reduce their degree of isolation and increase gene flow among them; thereby, the adaptability potential of this species may be improved.
The reasons for the endangerment of this plant are multifaceted, among which pests in nature are one of the important reasons. Due to the harsh environment of A. nanus, there are few plant species available for insects to feed on, and the pest damage faced by the endangered plant is becoming increasingly severe. During our continuous years of investigation, we found that the insect infestation rate of seeds in natural populations is as high as 90%; rampant pest infestation is one of the main factors causing low seed yield and population renewal barriers for this plant. Etiella zinckenell is the pest that poses the most serious threat to the seeds of A. nanus, so it is necessary and urgent to conduct studies on prevention and control of this pest in the future, making sure its population density can be controlled at a low level to avoid a major outbreak of this pest.

Author Contributions

Conceptualization, M.M. and A.L.; methodology, A.L.; software, S.H.; validation, A.L., H.L. and S.W.; formal analysis, S.W.; investigation, A.L. and H.L.; resources, M.M.; data curation, A.L.; writing—original draft preparation, A.L.; writing—review and editing, M.M.; visualization, S.H.; supervision, M.M.; project administration, M.M.; funding acquisition, M.M. All authors have read and agreed to the published version of the manuscript.

Funding

This research was funded by the National Natural Science Foundation of China, grant number 31360047.

Institutional Review Board Statement

Not applicable.

Informed Consent Statement

Not applicable.

Data Availability Statement

Not applicable.

Conflicts of Interest

The authors declare no conflict of interest.

References

  1. Brown, W.L. Genetic diversity and genetic vulnerability—An appraisal. Econ. Bot. 1983, 37, 4–12. [Google Scholar] [CrossRef]
  2. Salgotra, R.K.; Chauhan, B.S. Genetic Diversity, Conservation, and Utilization of Plant Genetic Resources. Genes 2023, 14, 174. [Google Scholar] [CrossRef]
  3. Scribner, K.T.; Uhrig, G.; Kanefsky, J.; Sard, N.M.; Holtgren, M.; Jerome, C.; Ogren, S. Pedigree-based decadal estimates of lake sturgeon adult spawning numbers and genetic diversity of stream-side hatchery produced offspring. J. Great Lakes Res. 2022, 48, 551–564. [Google Scholar] [CrossRef]
  4. Soltis, P.; Soltis, U. Genetic Variation in Endemic and Widespread Plant Species. Aliso J. Syst. Florist. Bot. 1991, 13, 215–223. [Google Scholar] [CrossRef]
  5. Xiao, Y.; Jiang, X.; Lu, C.; Liu, J.; Diao, S.; Jiang, J. Genetic Diversity and Population Structure Analysis in the Chinese Endemic Species Michelia crassipes Based on SSR Markers. Forests 2023, 14, 508. [Google Scholar] [CrossRef]
  6. Kim, M.J.; Jeong, S.Y.; Kim, S.-S.; Jeong, J.S.; Kim, J.S.; Jeong, H.C.; Kim, K.-G.; Kim, I. Population genetic characterization of the endangered dung beetle Copris tripartitus (Coleoptera: Scarabaeidae) using novel microsatellite markers. J. Asia Pac. Èntomol. 2022, 25, 101899. [Google Scholar] [CrossRef]
  7. Borah, R.; Bhattacharjee, A.; Rao, S.R.; Kumar, V.; Sharma, P.; Upadhaya, K.; Choudhury, H. Genetic diversity and population structure assessment using molecular markers and SPAR approach in Illicium griffithii, a medicinally important endangered species of Northeast India. J. Genet. Eng. Biotechnol. 2021, 19, 118. [Google Scholar] [CrossRef]
  8. Sandamal, S.; Tennakoon, A.; Meng, Q.; Marambe, B.; Ratnasekera, D.; Melo, A.; Ge, S. Population genetics and evolutionary history of the wild rice species Oryza rufipogon and O. nivara in Sri Lanka. Ecol. Evol. 2018, 8, 12056–12065. [Google Scholar] [CrossRef]
  9. Wang, Y.; Cao, S.; Sui, X.; Wang, J.; Geng, Y.; Gao, F.; Zhou, Y. Genome-Wide Characterization, Evolution, and Expression Analysis of the Ascorbate Peroxidase and Glutathione Peroxidase Gene Families in Response to Cold and Osmotic Stress in Ammopiptanthus nanus. J. Plant Growth Regul. 2022, 42, 502–522. [Google Scholar] [CrossRef]
  10. Schaal, B.A.; Hayworth, D.A.; Olsen, K.M.; Rauscher, J.T.; Smith, W.A. Phylogeographic studies in plants: Problems and prospects. Mol. Ecol. 1998, 7, 465–474. [Google Scholar] [CrossRef]
  11. Wen, L. The effects of genetic diversity from habitat fragment. Sci. Econ. Soc. 2006, 24, 70–72. [Google Scholar]
  12. Wang, Z.; Peng, S.; Ren, H. Genetic variation and inbreeding depression in small populations. J. Plant Genet. Resour. 2005, 6, 101–107. [Google Scholar] [CrossRef]
  13. Ruping, W.; Lin, L. The extinction vortex of small population. J. Biol. 2008, 25, 14–16–24. [Google Scholar]
  14. Primack, B.R. Essentials of Conservation Biology, 5th ed.; Sinauer Associates, Inc.: Sunderland, MA, USA, 2010. [Google Scholar]
  15. Cheng, S.H. Ammopiptanthus Cheng f. A new genus of Leguminosae from central Asia. Bot. Zhurnal 1959, 44, 1381–1386. [Google Scholar]
  16. Li, Y. Evergreen shrubs Ammopiptanthus nanus (M. Pop.) Cheng f. research report. Xinjiang For. Sci. Technol. 1989, 1, 55–58. [Google Scholar]
  17. Pan, B.; Yu, Q.; Yna, C. Study for the ecological environment and vulnerable reasons of the Ammopiptanthus nanus. Acta Phytoecol. Geobot. Sin. 1992, 16, 276–282. [Google Scholar]
  18. Sun, Y.; Liu, L.; Sun, S.; Han, W.; Irfan, M.; Zhang, X.; Zhang, L.; Chen, L. AnDHN, a Dehydrin Protein from Ammopiptanthus nanus, Mitigates the Negative Effects of Drought Stress in Plants. Front. Plant Sci. 2021, 12, 788938. [Google Scholar] [CrossRef]
  19. Yu, H.; Zheng, H.; Liu, Y.; Yang, Q.; Li, W.; Zhang, Y.; Fu, F. Antifreeze protein from Ammopiptanthus nanus functions in temperature-stress through domain A. Sci. Rep. 2021, 11, 8458. [Google Scholar] [CrossRef]
  20. Zhu, M.; Liu, Q.; Liu, F.; Zheng, L.; Bing, J.; Zhou, Y.; Gao, F. Gene Profiling of the Ascorbate Oxidase Family Genes under Osmotic and Cold Stress Reveals the Role of AnAO5 in Cold Adaptation in Ammopiptanthus nanus. Plants 2023, 12, 677. [Google Scholar] [CrossRef]
  21. Liu, Q.; Sui, X.; Wang, Y.; Zhu, M.; Zhou, Y.; Gao, F. Genome-Wide Analyses of Thaumatin-like Protein Family Genes Reveal the Involvement in the Response to Low-Temperature Stress in Ammopiptanthus nanus. Int. J. Mol. Sci. 2023, 24, 2209. [Google Scholar] [CrossRef]
  22. Ji, T.-F.; Li, J.; Liang, C.-H. The Chemical constituents of the twigs of Ammopiptanthus nanus. J. Asian Nat. Prod. Res. 2013, 15, 332–336. [Google Scholar] [CrossRef] [PubMed]
  23. Liu, M.; Wu, S.; Pan, B.; Wang, D. Geographical distribution and habitat characteristic of [Ammopiptanthus (Maxim.) Cheng f.] (Fabaceae) in China. Arid. Land Geogr. 2017, 40, 380–387. [Google Scholar] [CrossRef]
  24. Wang, Z. Resource survey of rare plant dwarf sand holly and its conservation. Chin. Wild Plant Resour. 2005, 6, 44–45. [Google Scholar]
  25. Zhang, Y.Z.; Pan, B.R.; Yin, L.K.; Duan, S.M. Study on the floristic genera and structure of the community of Ammopiptanthus nanus. Arid. Zone Res. 2006, 23, 320–326. [Google Scholar] [CrossRef]
  26. Ge, X.-J.; Yu, Y.; Yuan, Y.-M.; Huang, H.-W.; Yan, C. Genetic Diversity and Geographic Differentiation in Endangered Ammopiptanthus (Leguminosae) Populations in Desert Regions of Northwest China as Revealed by ISSR Analysis. Ann. Bot. 2005, 95, 843–851. [Google Scholar] [CrossRef]
  27. Chen, G.; Huang, H.; Ge, X. Allozyme diversity and population differentiation in an endangered plant, Ammopiptanthus nanus (Leguminosae). J. Wuhan Bot. Res. 2005, 23, 131–137. [Google Scholar]
  28. Zhao, P.; Yong, X.; Hu, G.; Lv, T.; Jiao, P. RAPD analysis on the genetic diversity of endangered plant Ammopiptanthus nanus (M. Pop.) Cheng f. J. Arid. Land Resour. Environ. 2016, 30, 74–79. [Google Scholar] [CrossRef]
  29. Prevost, A.; Wilkinson, M.J. A new system of comparing PCR primers applied to ISSR fingerprinting of potato cultivars. Theor. Appl. Genet. 1999, 98, 107–112. [Google Scholar] [CrossRef]
  30. Ali, Z.; Xu, Z.; Zhang, D.; He, X.; Bahadur, S.; Yi, J. Molecular diversity analysis of eggplant (Solanum melongena) genetic resources. Genet. Mol. Res. 2011, 10, 1141–1155. [Google Scholar] [CrossRef]
  31. Tantasawat, P.A.; Poolsawat, O.; Arsakit, K.; Papan, P. Identification of ISSR, ISSR-RGA and SSR Markers Associated with Cercospora Leaf Spot Resistance Gene in Mungbean. Int. J. Agric. Biol. 2020, 23, 447–453. [Google Scholar] [CrossRef]
  32. Vaishnav, K.; Tiwari, V.; Durgapal, A.; Meena, B.; Rana, T.S. Estimation of genetic diversity and population genetic structure in Gymnema sylvestre (Retz.) R. Br. ex Schult. populations using DAMD and ISSR markers. J. Genet. Eng. Biotechnol. 2023, 21, 42. [Google Scholar] [CrossRef]
  33. Slatkin, M. Gene Flow and the Geographic Structure of Natural Populations. Science 1987, 236, 787–792. [Google Scholar] [CrossRef]
  34. Boydak, M.; Teker, T.; Gazdağli, A.; Thanos, C.A.; Çalişkan, S.; Kaltsis, A.; Tozlu, E.; Fournaraki, C.; Albayrak, G. ISSR genotyping of Phoenix theophrasti natural populations in Turkey and Crete (Greece) and P. dactylifera. Nord. J. Bot. 2021, 39, 1–11. [Google Scholar] [CrossRef]
  35. Ghomi, K.; Rabiei, B.; Sabouri, H.; Alamdari, E.G. Association analysis, genetic diversity and population structure of barley (Hordeum vulgare L.) under heat stress conditions using SSR and ISSR markers linked to primary and secondary metabolites. Mol. Biol. Rep. 2021, 48, 6673–6694. [Google Scholar] [CrossRef] [PubMed]
  36. Sheikh, Z.N.; Sharma, V.; Shah, R.A.; Sharma, N.; Summuna, B.; Al-Misned, F.A.; Serehy, H.A.E.; Mir, J.I. Genetic diversity analysis and population structure in apricot (Prunus armeniaca L.) grown under north-western himalayas using ISSR markers. Saudi J. Biol. Sci. 2021, 28, 5986–5992. [Google Scholar] [CrossRef] [PubMed]
  37. Zhang, Q.; Pan, B.; Zhang, Y.; Duan, S. Analysis on the characteristics of communities of Ammopiptanthus nanus and A. mongolicus. Arid. Zone Res. 2007, 24, 487–494. [Google Scholar] [CrossRef]
  38. Govindaraju, D.R. Relationship between Dispersal Ability and Levels of Gene Flow in Plants. Oikos 1988, 52, 31. [Google Scholar] [CrossRef]
  39. Moonsap, P.; Laksanavilat, N.; Sinumporn, S.; Tasanasuwan, P.; Kate-Ngam, S.; Jantasuriyarat, C. Genetic diversity of Indo-China rice varieties using ISSR, SRAP and InDel markers. J. Genet. 2019, 98, 80. [Google Scholar] [CrossRef]
  40. Parab, A.R.; Lynn, C.B.; Subramaniam, S. Assessment of Genetic Stability on In Vitro And Ex Vitro Plants of Ficus Carica Var. Black Jack Using Issr and Damd Markers. Mol. Biol. Rep. 2021, 48, 7223–7231. [Google Scholar] [CrossRef]
  41. Li, X. The Reproductive Biology of Ammopiptanthus Cheng f. (Fabaceae); Xinjiang Agricultural University: Urumqi, China, 2006. [Google Scholar]
  42. Jiao, P.; Li, Z. Study on poopulation biology of endangered species Ammmopiptanthus nanus (M. Pop.) Cheng f. J. Anhui Agric. Sci. 2010, 38, 355–360. [Google Scholar] [CrossRef]
  43. Jixian, W. Save rare plants Ammopiptanthus nanus (M. Pop.) Cheng f. For. People 1995, 1, 27. [Google Scholar]
  44. Liu, H.; Niu, T.; Yu, Q.; Yang, L.; Ma, J.; Qiu, S.; Wang, R.; Liu, W.; Li, J. Spatial and temporal variations in the relationship between the topological structure of eco-spatial network and biodiversity maintenance function in China. Ecol. Indic. 2022, 139, 108919. [Google Scholar] [CrossRef]
  45. Sun, X.; Xiao, Y. Vegetation Growth Trends of Grasslands and Impact Factors in the Three Rivers Headwater Region. Land 2022, 11, 2201. [Google Scholar] [CrossRef]
  46. Chaiyarat, R.; Wettasin, M.; Youngpoy, N.; Cheachean, N. Use of Human Dominated Landscape as Connectivity Corridors among Fragmented Habitats for Wild Asian Elephants (Elephas maximus) in the Eastern Part of Thailand. Diversity 2023, 15, 6. [Google Scholar] [CrossRef]
  47. Xiao, Y.; Xiao, Q.; Zhang, J. Balancing the international benefits and risks associated with implementation of ecological policy on the Qinghai-Tibet Plateau, China. Gondwana Res. 2023, 115, 183–190. [Google Scholar] [CrossRef]
  48. Karstens, S.; Dorow, M.; Bochert, R.; Stybel, N.; Schernewski, G.; Mühl, M. Stepping Stones Along Urban Coastlines—Improving Habitat Connectivity for Aquatic Fauna with Constructed Floating Wetlands. Wetlands 2022, 42, 76. [Google Scholar] [CrossRef]
Figure 1. Flowers of A. nanus.
Genes 14 01020 g001
Figure 2. UPGMA clustering between populations of A. nanus based on genetic distance.
Genes 14 01020 g002
Figure 3. A. nanus at its habitat. (a) Effect of flooding; A. nanus is indicated by the red arrow. (b) Destroyed plants. (c) Effect of logging; the incision is indicated by red arrow. (d) Effect of grazing; A. nanus is indicated by the red arrow. (e) Effect of insect feeding; the seed of A. nanus is indicated by the red arrow and the insect is indicated by the blue arrow. (f) Broken by rocks; A. nanus is indicated by the red arrow and the blue arrow shows the gully.
Genes 14 01020 g003aGenes 14 01020 g003b
Table 1. Sampling locations for A. nanus.
Collection SiteLongitudeLatitudeAltitude (m)Number of Samples
Tuopa75°34′54.62″39°46′26.11″201820
Akeqi75°35′24.26″39°49′54.45″205920
Heiziwei75°18′58.45″39°48′9.34″240220
Kangsu75°03′22.00″39°42′12.00″216120
Ohsalur74°45′18.00″39°39′30.00″220220
Xiaoerbulak75°00′53.41″39°41′47.35″221720
Table 2. Primer information.
PrimersStrios NumberPolymorphic BandPercentage of Polymorphic BandsPrimer Sequences
(From 5′ End to 3′ End)
Fire Retardant Temperature
UBC80716956.25%AGA GAG AGA GAG AGA GT53 °C
UBC81015853.33%GAG AGA GAG AGA GAG AT50 °C
UBC811161062.50%GAG AGA GAG AGA GAG AC45 °C
UBC8226350.00%TCT CTC TCT CTC TCT CA50 °C
UBC83413753.85%AGAGAGAGAGAGAGAGYT49 °C
UBC83513646.15%AGAGAGAGAGAGAGAGYC52 °C
UBC84014857.14%GAGAGA GAG AGA GAG AYT50 °C
UBC84415853.33%CTC TCT CTC TCT CTC TRC49 °C
UBC88814535.71%BDB CAC ACA CAC ACA CA41 °C
UBC89114642.86%HVH TGT GTG TGT GTG TG55 °C
Total1367051.47%
Note: B = (C, G, T) (i.e., not A), D = (A, G, T) (i.e., not C), H = (A, C, T) (i.e., not G), Y = (C, T).
Table 3. Genetic diversity of A. nanus at the species and population levels.
Population/SpeciesP (%)NANEHI
PopulationTuopa22.79 1.23 ± 0.42 ab1.16 ± 0.32 a0.09 ± 0.17 ab0.13 ± 0.25 ab
Akeqi43.381.43 ± 0.50 b1.26 ± 0.35 b0.15 ± 0.20 c0.23 ± 0.28 c
Heiziwei31.621.32 ± 0.47 b 1.17 ± 0.29 a0.11 ± 0.17 b0.16 ± 0.25 b
Kangsu28.681.29 ± 0.45 b1.16 ± 0.30 a0.09 ± 0.17 ab0.14 ± 0.24 ab
Ohsalur17.651.18 ± 0.38 a1.10 ± 0.24 a0.06 ± 0.14 a0.09 ± 0.21 a
Xiaoerbulak16.911.17 ± 0.38 a1.12 ± 0.30 a0.07 ± 0.16 ab0.10 ± 0.23 ab
Mean26.841.271.160.100.14
Species 51.701.991.600.350.52
Note: P: percentage of polymorphic loci; NA: observed number of alleles; NE: effective number of alleles; H: Nei’s gene diversity index; I: Shannon’s information index. The different lowercase letters mean there are significant differences among the populations.
Table 4. Genetic differentiation among populations.
HtHsGstNm
0.35 ± 0.020.10 ± 0.010.730.19
Note: Ht: overall genetic diversity; Hs: genetic diversity within a population; Gst: genetic differentiation coefficient among populations; Nm: gene flow.
Table 5. Nei’s genetic similarity and the genetic distances of the six populations.
PopulationsTuopaAkeqiHeiziweiKangsuOhsalurXiaoerbulak
Tuopa******0.6100.6220.6130.5610.618
Akeqi0.495******0.6690.6740.8040.729
Heiziwei0.4750.402******0.6470.6810.701
Kangsu0.4890.3950.435******0.6720.663
Ohsalur0.5780.2180.3850.397******0.675
Xiaoerbulak0.4810.3160.3560.4110.393******
Note: Genetic similarity is above the diagonal, and genetic distance is below the diagonal, ****** representing the demarcation line.
Disclaimer/Publisher’s Note: The statements, opinions and data contained in all publications are solely those of the individual author(s) and contributor(s) and not of MDPI and/or the editor(s). MDPI and/or the editor(s) disclaim responsibility for any injury to people or property resulting from any ideas, methods, instructions or products referred to in the content.

