Abstract
A complete mitochondrial genome (mitogenome) can provide important information for gene rearrangement, molecular evolution and phylogenetic analysis. Currently, only a few mitogenomes of hermit crabs (superfamily Paguridae) in the infraorder Anomura have been reported. This study reports the first complete mitogenome of the hermit crab Diogenes edwardsii assembled using high-throughput sequencing. The mitogenome of Diogenes edwardsii is 19,858 bp in length and comprises 13 protein-coding genes, 2 ribosomal RNA genes, and 22 transfer RNA genes. There are 28 and six genes observed on the heavy and light strands, respectively. The genome composition was highly A + T biased (72.16%), and exhibited a negative AT-skew (−0.110) and positive GC-skew (0.233). Phylogenetic analyses based on the nucleotide dataset of 16 Anomura species indicated that D. edwardsii was closest related to Clibanarius infraspinatus in the same family, Diogenidae. Positive selection analysis showed that two residues located in cox1 and cox2 were identified as positively selected sites with high BEB value (>95%), indicating that these two genes are under positive selection pressure. This is the first complete mitogenome of the genus Diogenes, and this finding helps us to represent a new genomic resource for hermit crab species and provide data for further evolutionary status of Diogenidae in Anomura.
1. Introduction
In the past twenty years, the mitochondrial genome (mitogenome) has been widely used in the studies of molecular evolution and reconstruction of phylogeny [1,2]. Nucleotide sequences or amino acid data, gene arrangement and RNA secondary structures of mitogenomes are greatly useful for exploring the relationships between metazoan lineages [2,3]. Generally, a metazoan mitogenome is a closed circular DNA molecule, ranging in size from 14 to 20 kb, and typically contains 37 genes: 13 protein-coding genes (PCGs) (cob, cox1-3, atp6, atp8, nad1-6, and nad4l), 2 rRNA genes (rrnS and rrnL), and 22 tRNA genes [4]. In addition, there are always several noncoding regions in the mitogenome, and the longest noncoding “AT-rich” region is known as the control region, which contains some of the initiation sites for genome transcription and replication [4]. Mitochondrial DNA generally forms an independent unit of genetic information that evolves independently of the nuclear genome [5]. Due to their haploid characteristics, maternal inheritance, limited recombination and rapid rate of evolution, mitogenomes have been commonly used for evolutionary and phylogenetic studies [6]. With the rapid development of sequencing technology, next-generation sequencing has become a fast and low-cost method to provide complete mitogenomes [7].
The infraorder Anomura is a collection of diverse crustaceans placed within the Decapoda with over 2500 species [8]. Anomura species have an exceptional range of body forms and can be found in diverse habitats including hydrothermal vents, freshwater bodies, and terrestrial environments [9]. The latest classification scheme divides Anomura into seven superfamilies: Aegloidea, Chirostyloidea, Galatheoidea, Hippoidea, Lithodoidea, Lomisoidea, and Paguroidea. Hermit crabs (the superfamily Paguroidea Latreille, 1802) are one of the best known and most diverse consisting of Coenobitidae, Diogenidae, Paguridae, Parapaguridae, Pylochelidae, and Pylojacquesidae, with more than 1100 species inhabiting diverse biotopes from intertidal to deep seas [10]. The hermit crabs represent an intermediate group of crustaceans from Macrura to Brachyura, which occupy a key position in crustacean evolution [11]. These species are unique because they have asymmetrical bodies that allow them to live in gastropod shells. However, merely a few of the evolutionary relationships of hermit crabs at taxonomic levels have been investigated, which are still waiting for researchers to further resolve [12,13,14].
Diogenidae Ortmann, 1892 is the second largest family of the superfamily Paguroidea, including 22 genera and 482 species worldwide (http://www.marinespecies.org/, accessed on 28 September 2022). Within Diogenidae, hermit crabs of the diogenid genus Diogenes Dana, 1851 contains about 60 species [15,16]. Most studies of species in the genus Diogenes were described based on their morphology [15,17,18], and the mitogenomes of the species in genus Diogenes have never been reported, nor have their phylogenies within the infraorder Anomura. The species Diogenes edwardsii was considered to constitute a scavenging force as important as nassariid gastropods, showing an important ecological value in the marine ecosystem [19]. Up to now, only some morphological features and feeding behavior information of D. edwardsii have been investigated [19]. As reported, D. edwardsii is characteristic in the spinose left chela, lacking a distinct crest on the outer surface, having possession of one prominent spine on the ventromesial margin proximally on the merus of the left cheliped, and the propodus of the left third pereopod being armed with additional rows of spinules on the lateral surface [19].
Prior to this study, the mitogenomic characteristics of D. edwardsii have never been reported. We newly sequenced and annotated the first complete mitogenome of the hermit crab D. edwardsii based on specimen from the Bohai Bay in China. The mitogenome organization and codon usage of D. edwardsii were revealed. The phylogenetic relationships of Anomura were reconstructed based on published mitogenomes to explore the potential status of D. edwardsii. We also performed positive selection analysis of Anomura mitochondrial PCGs to understand the adaptive evolution of D. edwardsii in Anomura.
2. Materials and Methods
2.1. Sample Collection and DNA Extraction
An adult female D. edwardsii was collected form Bohai Bay (38°32.12′ N, 118°1.50′ E), China, in November 2021. Species-level morphological identification was carried out according to the main ideas of Komai et al. [18]. The specimen was preserved in 95% ethanol and stored at −80 °C in dark. Genomic DNA was extracted from the specimen’s muscle tissue using the SDS method [20]. The harvested DNA was detected using agarose gel electrophoresis and quantified by a Qubit® 2.0 Fluorometer (Thermo Scientific, Shanghai, China). The DNA and voucher specimen of D. edwardsii was deposited in the College of Environmental Science and Engineering at Nankai University (Tianjin, China).
2.2. Mitogenome Sequencing and Assembly
After DNA isolation, 1 μg of purified DNA was fragmented. Paired-end libraries (450 bp) were prepared following the manufacturer’s instructions, then sequenced on the Illumina NovaSeq 6000 at Shanghai BIOZERON Co., Ltd. (Shanghai, China).
Raw reads were filtered into clean reads prior to assembly, and then undesirable reads were removed. These were reads with adaptors; low quality reads (i.e., those showing a quality score below 20 (Q < 20)); reads which comprised more than 10% of unknown bases (N); and any duplicated sequences. The mitochondrial genome was reconstructed using a combination of de novo and reference-guided assemblies, and the following three steps were performed to assemble the mitogenome. Firstly, the filtered reads were assembled into contigs using SPAdes 3.14.1 (http://bioinf.spbau.ru/spades, accessed on 24 March 2022). Then, BLAST (https://blast.ncbi.nlm.nih.gov/Blast.cgi, accessed on 24 March 2022) was used to align contigs with reference mitogenomes from Anomura species, and aligned contigs (≥80% similarity and query coverage) were ordered according to the reference mitogenomes. Finally, GapCloser 1.12 with default parameters were used to map the clean reads to the assembled mitogenome, and most gaps were filled with local assembly.
The mitochondrial genes were annotated using the online MITOS tool (http://mitos.bioinf.uni-leipzig.de/index.py, accessed on 24 March 2022), and the protein-coding genes, transfer RNA (tRNA) genes, and ribosome RNA (rRNA) genes were predicted with default parameters. BLAST searches for reference mitochondrion genes were used to determine the location of each coding gene. Manual corrections of genes for start/stop codons were performed in SnapGene Viewer by referring to the reference mitogenomes. The circular map of mitogenome of D. edwardsii was drawn by the CGview tool (http://stothard.afns.ualberta.ca/cgview_server/, accessed on 24 March 2022).
2.3. Sequence Analysis
The nucleotide composition and codon usage were computed using DnaSP 5.1 [21]. The AT and GC skews were calculated with the following formulas: AT skew = (A − T)/(A + T) and GC skew = (G − C)/(G + C) [22], where A, T, G, and C are the occurrences of the four nucleotides. The complete mitochondrial DNA sequence was deposited in GenBank with the accession number OP047688.
2.4. Phylogenetic Analysis
Along with the complete mitogenome DNA sequence from D. edwardsii, all currently complete mitochondrial sequences of 16 Anomura species were used in phylogenetic analysis (Table 1). Ovalipes punctatus (GenBank: NC_042695) and Callinectes sapidus (GenBank: NC_006281) were used as outgroups (Table 1). Our data set was based on nucleotide sequences from 13 mitochondrial PCGs (cox1, cox2, cox3, cob, atp6, atp8, nad1, nad2, nad3, nad4, nad4l, nad5, and nad6). Multiple alignments of the whole 13 genes were conducted using MUSCLE 3.8.31. Ambiguously aligned regions and gaps in aligned sequences were removed using Gblocks server 0.91b [21] with the default setting. ModelTest 2.1.10 [22] was used to select the best-fit evolutionary models GTR + I + G for the nucleotide dataset. The Maximum likelihood (ML) analysis of phylogenetic trees and model parameters were performed by RAxML 8.2.8 [23], and the best model was determined through AIC and BIC scores. Topological robustness for the ML analysis was evaluated with 100 replicates of bootstrap support. The phylogenetic tree (http://www.atgc-montpellier.fr/phyml/, accessed on 22 July 2022) was constructed by PhyML v3.0 and graphically edited with the iTOL 3.4.3 (https://itol.embl.de/itol.cgi, accessed on 22 July 2022).

Table 1.
List of Anomura species with their GenBank accession numbers.
2.5. Positive Selection Analysis
As reported in [24], comparing the nonsynonymous/synonymous substitution ratios (ω = dN/dS) has become a useful approach for quantifying the effect of natural selection on molecular evolution: ω > 1, =1 and <1 represent positive selection, neutrality and purifying selection, respectively [25]. The codon-based maximum likelihood (CodeML) method implemented in the PAML package [26] was applied to estimate the dN/dS ratio ω. The combined database of 13 mitochondrial PCGs was used for the selection pressure analyses. The ML phylogenetic tree was used as the working topology in the CodeML analyses.
We used branch models in the present study to evaluate positive selection in the infraorder Anomura. First, under an assumption of no adaptive evolution in the gene sequences, the one-ratio model (M0) estimated the distribution of ω values as a benchmark, which assumes a single ω ratio for all branches in the phylogenetic relationships [27]. Then, the two-ratio model (M2) that allows the background lineages and foreground lineages to have distinctive ω ratio values was used to detect positive selection acting on branches of interest [28,29]. Last, a free-ratio model (M1), which allows ω ratio variation among branches, was used to estimate ω values on each branch [29]. The one-ratio model (M0) and the free-ratio model (M1) were compared to determine whether different clades in Anomura had different ω values. In addition, the one-ratio model (M0) and the two-ratio model (M2) were used to compare whether Paguroidea species underwent more selection pressure than other Anomura species. Here, ω0 and ω1 represent the values for the background branch and foreground branch, respectively. Pairwise models were compared with the critical values of the Chi square (χ2) distribution using likelihood ratio tests (LRTs). The test statistic was estimated as twice the difference in log likelihood (2ΔL) and the degrees of freedom were estimated as the difference in the number of parameters for each model.
Additionally, branch-site models were fitted to examine the positive selection on some sites among the Anomura species. Branch-site models allow ω to vary both among sites in the protein and across branches on the tree. Branch-site model A (positive selection model) was used to identify the positive selected sites among the lineages of Paguroidea species (marked as foreground lineages). The sites with ω > 1 suggest that model A fits the data significantly better than the corresponding null model. Bayes Empirical Bayes analysis was used to calculate posterior probabilities to identify positive selection sites on the foreground lineages if the LRTs was significant [30].
3. Results and Discussion
3.1. Dedwardsii Mitogenome Organization
The Illumina HiSeq runs resulted in 59,106,998 paired-end reads from the D. edwardsii library with an insert size of approximately 450 bp. Selective-assembly analysis showed that 185,891 reads were assembled into a 19,858 bp circular molecule, representing the complete mitogenome of D. edwardsii (Figure 1 and Table 2). This length is longer than the mitogenome length of other reported Anomura species, which ranges from 15,324 bp in N. maculatus to 17,910 bp in Munidaisos (Table 1). The genome encodes 37 genes, including 13 PCGs, 2 rRNA genes, and 22 tRNA genes. A total of 28 genes are encoded on the heavy (H) strand, and nine genes are encoded on the light (L) strand (Table 2). The intergenic regions are distributed in 28 locations, and the longest region is 1971 bp (between trnS2-tca and nad1). Meanwhile, 31 overlapping nucleotides are located in four pairs of neighboring genes for the mitogenome. These overlapping nucleotides vary in length from 1 to 18 bp, and the longest overlap is located between rrnL and trnV-gta. The D. edwardsii mitogenome has a nucleotide composition of 32.11% A, 10.68% C, 17.16% G, and 40.05% T and an overall AT content of 72.16%. For the D. edwardsii mitogenome, the AT skew is −0.110, and the GC skew is 0.233, which indicates bias toward T and G. This asymmetry often occurs on Anomura species [11,26,31,32]. In mammals, the duration of single-stranded state of the “heavy-stranded” genes during mitochondrial DNA replication can explain this asymmetry [32]. Whether or not the same explanation works on our results remains difficult to predict at this time due to the scarcity of information regarding DNA replication of invertebrate mitochondria.
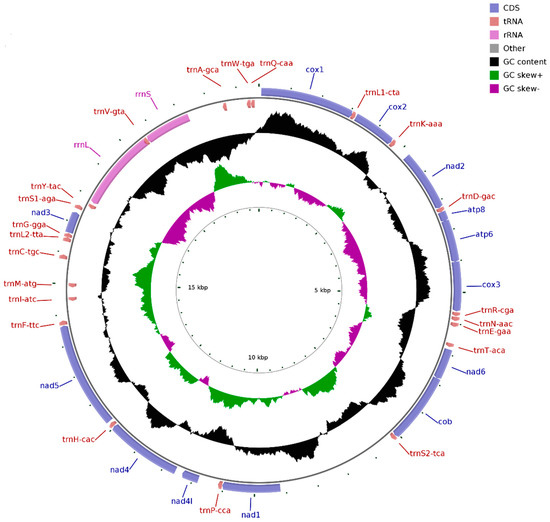
Figure 1.
Complete mitogenome map of D. edwardsii. A total of 28 genes are encoded on the heavy (H) strand and nine genes are encoded on the light (L) strand. Genes for proteins and rRNAs are represented with standard abbreviations. Genes for tRNAs are shown in a single letter for the corresponding amino acid, with two leucine tRNAs and two serine tRNAs distinguished by numerals.
Table 2.
Mitogenome organization of D. edwardsii.
For most families of the order Decapoda, congeners belonging to the same family generally possess identical gene arrangement [11], which has particularly been confirmed based on the reported crab mitogenomes [26,27,28]. However, comparing with the reported mitogenomes of the species C. infraspinatus and D. arrosor belonging to the same family Diogenidae, the D. edwardsii mitogenome possesses a distinctive gene arrangement [11,29]. For instance, nad5 is located between trnH-cac and trnF-ttc in the mitogenome of D. edwardsii, instead of the common location between trnF-phe and trnH-his in the mitogenomes of C. infraspinatus and D. arrosor. The gene rearrangement found in the D. edwardsii mitogenome deepens our understanding of this genomic feature about hermit crabs, and represents a special gene order in the genus Diogenes.
3.2. Protein-Coding Genes
The total length of all 13 PCGs of D. edwardsii is 10,888 bp, accounting for 54.83% of the complete length of the mitogenome (Table 2). The 13 PCGs ranged in size from 159 bp (atp8) to 1707 bp (nad5), and all 13 PCGs are encoded on the heavy strand (Table 2). Furthermore, there are two reading-frame overlaps on the same strand: atp6 and atp8, and atp6 and cox3 each share seven and one nucleotides (Table 2). The PCGs encode 3629 amino acids, among which Ser (16.19%) and Leu (9.84%) are the most and frequently used, and Met (1.64%) and Trp (1.64%) are the least frequently used, respectively. The A + T contents of PCGs and third codon positions in D. edwardsii mitogenome are 69.08% and 72.30%, respectively. The strong AT-bias in the third codon positions is similar to many species in the infraorder Anomura, i.e., D. arrosor, Shinkaia crosnieri and P. longicarpus [11,31,32].
Codon usage bias is a phenomenon in which specific codons are used more frequently than other synonymous codons by certain organisms during the translation of genes to proteins [11]. As shown in Figure 2, a total of 61 available codons are used in D. edwardsii mitogenome. Start and stop codons varied among the PCGs. Four of 13 PCGs use ATT (cox1, atp8, nad6, and nad1) and ATA (nad2, cob, nad4, and nad5) as start codons, and three PCGs use ATG (cox2, atp6, and cox3) and nad3 uses GTG. Seven of 13 PCGs use TAA (cox1, cox2, atp6, cox3, cob, nad1, and nad4l) as a stop codon, and five PCGs use TAG (nad2, atp8, nad4, nad5, and nad3). Finally, nad6 exhibits an incomplete (A) stop codon. The presence of an incomplete stop codon is a common phenomenon in both invertebrate and vertebrate mitochondrial genes [30,33,34]. It is assumed that truncated stop codons are completed via post-transcriptional polyadenylation [35]. Previous studies have shown that truncated stop codons were common in the metazoan mitogenomes and may be corrected by post-transcriptional polyadenylation [36,37]. The relative synonymous codon usage (RSCU) values indicated that the six most commonly used codons are TTA(Leu), TCT(Ser), CCT(Pro), ACT(Thr), GCT(Ala), and AGA(Ser) (Figure 2). Based on RSCU and amino acid composition in the PCGs, comparative analyses showed that the acid composition kept similar with most hermit crabs, whereas the codon usage pattern of D. Edwardsii is unidentified with some Paguroidea species. The codon TCT(Ser) instead of TTA(Leu) was often found to be used most frequently in Paguroidea species mitogenomes, i.e., D. arrosor, B. latro, P. longicarpus, and Coenobita rugpsus [9,11,32,38], while without the most frequency in D. edwardsii.
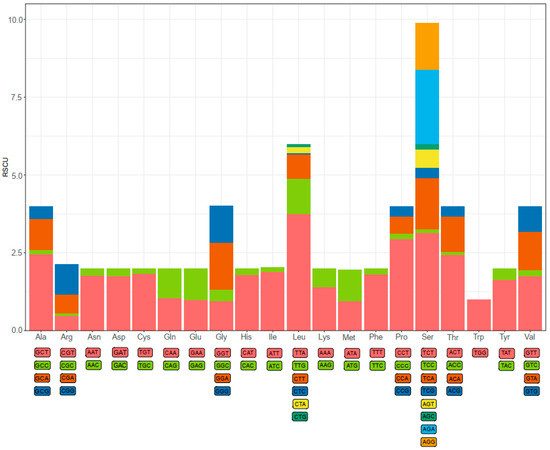
Figure 2.
The relative synonymous codon usage (RSCU) of the D. edwardsii mitogenome.
3.3. Ribosomal RNA and Transfer RNA Genes
The rrnL and rrnS genes of D. edwardsii are 1370 bp (AT% = 67.2) and 796 bp (AT% = 67.7) in length, respectively. The total length of rRNA genes accounts for 10.09% of the D. edwardsii mitogenome. Both of the two genes are encoded on the light strand. The AT and GC content of rRNAs are 77.42% and 22.58%, and the AT skew and GC skew are −0.008 and 0.010, respectively, suggesting a slight bias toward the use of T and G.
A total of 22 tRNA genes were identified in the mitogenome of D. edwardsii (Table 2). The length of tRNA genes is 1491 bp, accounting for 7.51% of the complete length of the mitogenome. A total of 15 genes (trnL1-cta, trnK-aaa, trnD-gac, trnR-cga, trnN-aac, trnE-gaa, trnT-aca, trnS2-tca, trnP-cca, trnH-cac, trnF-ttc, trnC-tgc, trnL2-tta, trnG-gga, trnS1-aga) are encoded on the heavy strand and the rest four genes (trnL-atc, trnM-atg, trnY-tac, trnV-gta) are encoded on the light strand. The AT skew of tRNA genes is 0.013, and the GC skew is 0.108, indicating a bias toward A and G. In addition, the codons with A and T in the third position are used more frequently than other synonymous codons. These characteristics reflect codon usage with A and T bias at the third codon position, similar to the bias found in many metazoans [39,40,41].
3.4. Phylogenetic Relationships
In the present study, the phylogenetic relationship of D. edwardsii was constructed on the sequences of the concentrated 13 PCGs from the mitochondrial genomes of 16 Anomura species and two outgroups (Figure 3). Phylogenetic analyses were carried out based on nucleotide sequences of 13 PCGs by the ML method. Anomura was divided into two main branches in our phylogenetic tree, which was identified in the previous researches [24,42]. The first clade comprised five families (Porcellanidae, Munididae, Paguridae, Lithodidae, and Kiwaidae) and the second clade contained two families (Coenobitidae and Diogenidae). It is not difficult to find that the two families of the superfamily Paguroidea belong to two branches of the phylogenetic tree, which presents challenges for the current classification based on the morphology. Even if inter-superfamiliar relationships are not fully resolved, clear trends become visible. The phylogenetic relationships of these seven families show as being ((((Porcellanidae + Munididae) + Paguridae) + Lithodidae) + Kiwaidae) + (Coenobitidae + Diogenidae).
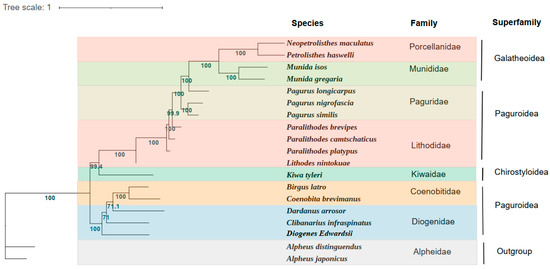
Figure 3.
Phylogenetic tree derived from Maximum likelihood (ML) analysis based on 13 mitochondrial PCGs (atp6, atp8, cox1, cox2, cox3, cob, nad1, nad2, nad3, nad4, nad4L, nad5, and nad6). Species belonging to the same superfamily are marked with the same color. Numbers on branches are Bayesian posterior probabilities (percent).
Consistent with the traditional morphological classification, the phylogenetic analyses based on molecular methods showed that D. edwardsii clustered with the Diogenidae species C. infraspinatus and D. arrosor. However, the members of the family Coenobitidae B. latro and C. brevimanus are clustered within the same clade. As reported, C. infraspinatus possesses a favor of codon TAT(Ser) and owns the highest Ser content in amino acid composition [29], which showed the same pattern with D. edwardsii. This supports the phylogenetic analysis result that these two species possess a close relationship. The ML bootstrap values supporting D. edwardsii and C. infraspinatus as well as D. arrosor were not high (<80), which may be explained by the different gene arrangements between D. edwardsii and these two species, as discussed in Section 3.1. Thus, more species mitogenomes in the family Diogenidae still need to be investigated to fulfill the systematic phylogeny within the infraorder Anomura. Our newly acquired mitogenome data and phylogenetic results can also be better used to provide a basis for studies of the mitochondrial evolution of Anomura.
3.5. Positive Selection Analysis
The ω(dN/dS) ratio calculated in branching model analysis D. edwardsii’s 13 mitochondrial PCGs was 0.02684 under the one-ratio model (M0) (Table 3), indicating that these genes undergo constrained selection pressure to maintain primary function. When using two-ratio model, the ω ratio of the D. edwardsii branch possess no significant difference compared with that in another branch (ω1 = 0.02703 and ω0 = 0.02683), indicating similarity in the selection pressure between the species in the family Coenobitidae and Diogenidae and other Anomura species. However, in the comparison of the one-ratio model (M0) and the free-ratio model (M1), the LRTs indicated that the free-ratio model fit the data better than the one-ratio model (Table 3), representing that the ω ratios are distinctive among different lineages.
Table 3.
CodeML analyses of selection pressure on mitochondrial genes in Paguroidea lineage.
Positive selection often occurs over a short evolutionary time and performs on only a few sites [43,44]. Thus, the signals of positive selection are often overwhelmed by those for successive purifying selection that occur at most sites in the gene sequence [43,44,45]. In the current study, branch-site models were used to determine possible positively selected sites in D. edwardsii (Table 4). Two residues, located in cox1 and cox2, were identified as positive selected sites in D. edwardsii (>95%), respectively, indicating that these two genes are under positive selection pressure. It is known that mitochondrial PCGs are crucial in the oxidative phosphorylation pathway. Cytochrome c oxidase catalyzes the oxygen terminal reduction, and the catalytic core is encoded by three mitochondrial PCGs (cox1, cox2, and cox3) [45,46]. Cytochrome c oxidase is confirmed to be a particularly important site of the positive selection in marine anoxic adaptation [47,48]. This study also indicates the mechanism applicability of Cytochrome c oxidase on the hermit crabs living in the specific marine environment.
Table 4.
Possible sites under positive selection in Paguroidea lineage.
The cytochrome c oxidase requires reactive oxygen species (ROS) when the living cells are exposed to anoxia. The increase in ROS concentration helps to stabilize Hif-1α, which then results in the induction of Hif-1-dependent nuclear hypoxic genes [48,49,50]. In this study, the positive selection sites in cox1 and cox2 of D. edwardsii indicate a phylogenetic adaption of ATP synthase of hermit crabs in the presence of reduced oxygen availability or increased energy requirements. Cox1 and cox2 in mitochondrion are involved in the regulation of platelet aggregation and vasomotor to maintain the stability of physiological functions of cells and tissues [45]. Functional modification mediated by positive selection pressure in D. edwardsii may increase the affinity between the enzyme and oxygen, and then efficiently maintain basic metabolic levels under a hypoxia environment in the marine [45]. The marine environment is characterized by a lack of high pressure and low dissolved oxygen, both of which could directly affect the mitochondrial aerobic respiration process [51]. The positive selected sites found in cox1 and cox2 may be associated with the adaptive evolution of D. edwardsii within the hermit crabs living in the marine environment. Our study provides a foundation for understanding the mitochondrial evolution mechanisms of D. edwardsii to obtain adequate energy and maintain essential metabolic levels in specific marine ecosystem.
4. Conclusions
In this study, we determined and described the complete mitogenome of D. edwardsii, supplementing the first mitogenome information of the genus Diogenes (Anomura: Paguroidea: Diogenidae). Our phylogenetic tree based on molecular methods showed that D. edwardsii possessed the closest relationship with the species C. infraspinatus in the same family. Positive selection analysis showed that cox1 and cox2 of D. edwardsii were under positive selection pressure, indicating the potential mechanisms of this species that efficiently maintain basic metabolic levels under a hypoxia environment in the marine ecosystem. Our results provide useful mitogenome information for a better understanding of the hermit crabs, as well as the phylogenetics of D. edwardsii in the infraorder Anomura.
Author Contributions
Conceptualization, X.P.; methodology, X.P.; resources, W.F., J.F. and B.G.; writing—original draft preparation, X.P.; writing—review and editing, X.L. (Xiaolong Lin) and X.L. (Xueqiang Lu); supervision, X.L. (Xueqiang Lu). All authors have read and agreed to the published version of the manuscript.
Funding
This research was funded by National Key Research &Development Program of China, grant number 2019YFE0122300.
Institutional Review Board Statement
Not applicable.
Informed Consent Statement
Not applicable.
Data Availability Statement
The mitochondrial genome has been deposited in the NCBI with accession number OP047688.
Conflicts of Interest
The authors declare no conflict of interest. The funders had no role in the design of the study; in the collection, analyses, or interpretation of data; in the writing of the manuscript; or in the decision to publish the results.
References
- Boore, J.L.; Brown, W.M. Big trees from little genomes: Mitochondrial gene order as a phylogenetic tool. Curr. Opin. Genet. Dev. 1998, 8, 668–674. [Google Scholar] [CrossRef]
- Boore, J.L.; Macey, J.R.; Medina, M. Sequencing and comparing whole mitochondrial genomes of animals. Mol. Evol. Prod. Biochem. Data: Part B 2005, 395, 311–348. [Google Scholar]
- Boore, J.L.; Lavrov, D.V.; Brown, W.M. Gene translocation links insects and crustaceans. Nature 1998, 392, 667–668. [Google Scholar] [CrossRef] [PubMed]
- Boore, J.L. Animal mitochondrial genomes. Nucleic Acids Res. 1999, 27, 1767–1780. [Google Scholar] [CrossRef] [PubMed]
- Lu, J.Y.; Xia, L.P.; Liu, X.J.; Ma, Y.W.; Li, J.J.; Ye, Y.Y.; Guo, B.Y. The mitochondrial genome of Grapsus albolineatus (Decapoda: Brachyura: Grapsidae) and phylogenetic associations in Brachyura. Sci. Rep. 2022, 12, 2104. [Google Scholar] [CrossRef]
- Sato, M.; Sato, K. Maternal inheritance of mitochondrial DNA by diverse mechanisms to eliminate paternal mitochondrial DNA. Biochim. Biophys. Acta-Mol. Cell Res. 2013, 1833, 1979–1984. [Google Scholar] [CrossRef]
- Tan, M.H.; Gan, H.M.; Lee, Y.P.; Bracken-Grissom, H.; Chan, T.Y.; Miller, A.D.; Austin, C.M. Comparative mitogenomics of the Decapoda reveals evolutionary heterogeneity in architecture and composition. Sci. Rep. 2019, 9, 10756. [Google Scholar] [CrossRef]
- Bracken-Grissom, H.D.; Cannon, M.E.; Cabezas, P.; Feldmann, R.M.; Schweitzer, C.E.; Ahyong, S.T.; Felder, D.L.; Lemaitre, R.; Crandall, K.A. A comprehensive and integrative reconstruction of evolutionary history for Anomura (Crustacea: Decapoda). BMC Evol. Biol. 2013, 13, 128. [Google Scholar] [CrossRef] [PubMed]
- Tan, M.H.; Gan, H.M.; Lee, Y.P.; Linton, S.; Grandjean, F.; Bartholomei-Santos, M.L.; Miller, A.D.; Austin, C.M. ORDER within the chaos: Insights into phylogenetic relationships within the Anomura (Crustacea: Decapoda) from mitochondrial sequences and gene order rearrangements. Mol. Phylogenet. Evol. 2018, 127, 320–331. [Google Scholar] [CrossRef]
- De Grave, S.; Pentcheff, N.D.; Ahyong, S.T.; Chan, T.Y.; Crandall, K.A.; Dworschak, P.C.; Felder, D.L.; Feldmann, R.M.; Fransen, C.; Goulding, L.Y.D.; et al. A classification of living and fossil genera of decapod crustaceans. Raffles Bull. Zool. 2009, 1–109. [Google Scholar]
- Zhang, Y.; Meng, L.; Wei, L.M.; Lu, X.T.; Liu, B.J.; Liu, L.Q.; Lu, Z.M.; Gao, Y.; Gong, L. Different gene rearrangements of the genus Dardanus (Anomura: Diogenidae) and insights into the phylogeny of Paguroidea. Sci. Rep. 2021, 11, 21833. [Google Scholar] [CrossRef] [PubMed]
- McLaughlin, P.A. Illustrated keys to families and genera of the Superfamily Paguroidea (Crustacea: Decapoda: Anomura), with diagnoses of genera of Paguridae. Mem. Mus. Vic. 2003, 60, 111–144. [Google Scholar] [CrossRef]
- McLaughlin, P.A.; Lemaitre, R. Carcinization in the Anomura—Fact or fiction? I. Evidence from adult morphology. Contrib. Zool. 1997, 67, 79–123. [Google Scholar] [CrossRef]
- McLaughlin, P.A.; Lemaitre, R.; Sorhannus, U. Hermit crab phylogeny: A reappraisal and its “fall-out”. J. Crustac. Biol. 2007, 27, 97–115. [Google Scholar] [CrossRef]
- Asakura, A.; Tachikawa, H. Diogenes holthuisi, a new species of hermit crab (Decapoda, Anomura, Diogenidae) from shallow waters of the Ogasawara (Bonin) Islands, Japan. Crustaceana Monogr. 2010, 14, 133–144. [Google Scholar]
- McLaughlin, P.A.; Lemaitre, R.; Crandall, K.A. Annotated checklist of anomuran decapod crustaceans of the world (exclusive of the Kiwaoidea and families Chirostylidae and Galatheidae of the Galatheoidea) Part I—Lithodoidea, Lomisoide and Paguroidea. Raffles Bull. Zool. 2010, 5, 107. [Google Scholar]
- Korn, O.M.; Kornienko, E.S.; Komai, T. A reexamination of adults and larval stages of Diogenes nitidimanus (Crustacea: Decapoda: Anomura: Diogenidae). Zootaxa 2008, 1693, 1–26. [Google Scholar] [CrossRef]
- Komai, T.; Liang, J.Z.; Yang, T.B. Records of four species of the shallow water hermit crab genus Diogenes (Crustacea: Decapoda: Anomura: Diogenidae) from southern China, with description of a new species. J. Nat. History 2012, 46, 1219–1248. [Google Scholar] [CrossRef]
- Morton, B.; Yuen, W.Y. The feeding behaviour and competition for carrion between two sympatric scavengers on a sandy shore in Hong Kong: The gastropod, Nassarius festivus (Powys) and the hermit crab, Diogenes edwardsii (De Haan). J. Exp. Mar. Biol. Ecol. 2000, 246, 1–29. [Google Scholar] [CrossRef]
- Lim, H.J.; Lee, E.H.; Yoon, Y.; Chua, B.; Son, A. Portable lysis apparatus for rapid single-step DNA extraction of Bacillus subtilis. J. Appl. Microbiol. 2016, 120, 379–387. [Google Scholar] [CrossRef]
- Talavera, G.; Castresana, J. Improvement of phylogenies after removing divergent and ambiguously aligned blocks from protein sequence alignments. Syst. Biol. 2007, 56, 564–577. [Google Scholar] [CrossRef] [PubMed]
- Darriba, D.; Taboada, G.L.; Doallo, R.; Posada, D. JModelTest 2: More models, new heuristics and parallel computing. Nat. Methods 2012, 9, 772. [Google Scholar] [CrossRef]
- Stamatakis, A. RAxML version 8: A tool for phylogenetic analysis and post-analysis of large phylogenies. Bioinformatics 2014, 30, 1312–1313. [Google Scholar] [CrossRef] [PubMed]
- Wang, Q.; Li, Y.J.; Tang, D.; Wang, J.; Xu, J.Y.; Xu, X.Y.; Wang, Z.F. Sequencing and analysis of the complete mitochondrial genome of Coenobita brevimanus. Mitochondrial DNA Part B-Resour. 2019, 4, 2645–2646. [Google Scholar] [CrossRef] [PubMed]
- Reyes, A.; Gissi, C.; Pesole, G.; Saccone, C. Asymmetrical directional mutation pressure in the mitochondrial genome of mammals. Mol. Biol. Evol. 1998, 15, 957–966. [Google Scholar] [CrossRef]
- Tang, B.P.; Xin, Z.Z.; Liu, Y.; Zhang, D.Z.; Wang, Z.F.; Zhang, H.B.; Chai, X.Y.; Zhou, C.L.; Liu, Q.N. The complete mitochondrial genome of Sesarmops sinensis reveals gene rearrangements and phylogenetic relationships in Brachyura. PLoS ONE 2017, 12, e0179800. [Google Scholar] [CrossRef]
- Wang, Z.F.; Wang, Z.Q.; Shi, X.J.; Wu, Q.; Tao, Y.T.; Guo, H.Y.; Ji, C.Y.; Bai, Y.Z. Complete mitochondrial genome of Parasesarma affine (Brachyura: Sesarmidae): Gene rearrangements in Sesarmidae and phylogenetic analysis of the Brachyura. Int. J. Biol. Macromol. 2018, 118, 31–40. [Google Scholar] [CrossRef]
- Xin, Z.Z.; Liu, Y.; Zhang, D.Z.; Chai, X.Y.; Wang, Z.F.; Zhang, H.B.; Zhou, C.L.; Tang, B.P.; Liu, Q.N. Complete mitochondrial genome of Clistocoeloma sinensis (Brachyura: Grapsoidea): Gene rearrangements and higher-level phylogeny of the Brachyura. Sci. Rep. 2017, 7, 4128. [Google Scholar] [CrossRef] [PubMed]
- Gan, H.Y.; Gan, H.M.; Tan, M.H.; Lee, Y.P.; Austin, C.M. The complete mitogenome of the hermit crab Clibanarius infraspinatus (Hilgendorf, 1869), (Crustacea; Decapoda; Diogenidae)—A new gene order for the Decapoda. Mitochondrial DNA Part A 2016, 27, 4099–4100. [Google Scholar] [CrossRef] [PubMed]
- Hamasaki, K.; Iizuka, C.; Sanda, T.; Imai, H.; Kitada, S. Phylogeny and phylogeography of the land hermit crab Coenobita purpureus (Decapoda: Anomura: Coenobitidae) in the Northwestern Pacific Region. Mar. Ecol. Evol. Perspect. 2017, 38, e12369. [Google Scholar] [CrossRef]
- Yang, J.S.; Yang, W.J. The complete mitochondrial genome sequence of the hydrothermal vent galatheid crab Shinkaia crosnieri (Crustacea: Decapoda: Anomura): A novel arrangement and incomplete tRNA suite. BMC Genom. 2008, 9, 504. [Google Scholar] [CrossRef]
- Hickerson, M.J.; Cunningham, C.W. Dramatic mitochondrial gene rearrangements in the hermit crab Pagurus longicarpus (Crustacea, Anomura). Mol. Biol. Evol. 2000, 17, 639–644. [Google Scholar] [CrossRef] [PubMed]
- Gong, L.; Lu, Z.M.; Guo, B.Y.; Ye, Y.Y.; Liu, L.Q. Characterization of the complete mitochondrial genome of the tidewater goby, Eucyclogobius newberryi (Gobiiformes; Gobiidae; Gobionellinae) and its phylogenetic implications. Conserv. Genet. Resour. 2018, 10, 93–97. [Google Scholar] [CrossRef]
- Wu, X.Y.; Xiao, S.; Li, X.L.; Li, L.; Shi, W.; Yu, Z.N. Evolution of the tRNA gene family in mitochondrial genomes of five Meretrix clams (Bivalvia, Veneridae). Gene 2014, 533, 439–446. [Google Scholar] [CrossRef]
- Baeza, J.A. The complete mitochondrial genome of the Caribbean spiny lobster Panulirus argus. Sci. Rep. 2018, 8, 17690. [Google Scholar] [CrossRef]
- Ojala, D.; Montoya, J.; Attardi, G. tRNA punctuation model of RNA processing in human mitochondria. Nature 1981, 290, 470–474. [Google Scholar] [CrossRef]
- Dreyer, H.; Steiner, G. The complete sequences and gene organisation of the mitochondrial genomes of the heterodont bivalves Acanthocardia tuberculata and Hiatella arctica--and the first record for a putative Atpase subunit 8 gene in marine bivalves. Front. Zool. 2006, 3, 13. [Google Scholar] [CrossRef]
- Veldsman, W.P.; Wang, Y.Q.; Niu, J.J.; Baeza, J.A.; Chu, K.H. Characterization of the complete mitochondrial genome of a coconut crab, Birgus latro (Linnaeus, 1767) (Decapoda: Anomura: Coenobitidae), from Okinawa, Japan. J. Crustac. Biol. 2020, 40, 390–400. [Google Scholar] [CrossRef]
- Chai, H.N.; Du, Y.Z.; Zhai, B.P. Characterization of the complete mitochondrial genomes of Cnaphalocrocis medinalis and Chilo suppressalis (Lepidoptera: Pyralidae). Int. J. Biol. Sci. 2012, 8, 561–579. [Google Scholar] [CrossRef]
- Zhang, B.; Zhang, Y.H.; Wang, X.; Zhang, H.X.; Lin, Q. The mitochondrial genome of a sea anemone Bolocera sp. exhibits novel genetic structures potentially involved in adaptation to the deep-sea environment. Ecol. Evol. 2017, 7, 4951–4962. [Google Scholar] [CrossRef]
- Sun, S.E.; Hui, M.; Wang, M.X.; Sha, Z.L. The complete mitochondrial genome of the alvinocaridid shrimp Shinkaicaris leurokolos (Decapoda, Caridea): Insight into the mitochondrial genetic basis of deep-sea hydrothermal vent adaptation in the shrimp. Comp. Biochem. Physiol. D-Genom. Proteom. 2018, 25, 42–52. [Google Scholar] [CrossRef] [PubMed]
- Lee, C.W.; Song, J.H.; Min, G.S.; Kim, S. The complete mitochondrial genome of squat lobster, Munida gregaria (Anomura, Galatheoidea, Munididae). Mitochondrial DNA Part B-Resour. 2016, 1, 204–206. [Google Scholar] [CrossRef] [PubMed]
- Shen, Y.Y.; Liang, L.; Zhu, Z.H.; Zhou, W.P.; Irwin, D.M.; Zhang, Y.P. Adaptive evolution of energy metabolism genes and the origin of flight in bats. Proc. Natl. Acad. Sci. USA 2010, 107, 8666–8671. [Google Scholar] [CrossRef] [PubMed]
- Zhang, J.Z.; Nielsen, R.; Yang, Z.H. Evaluation of an improved branch-site likelihood method for detecting positive selection at the molecular level. Mol. Biol. Evol. 2005, 22, 2472–2479. [Google Scholar] [CrossRef]
- Yang, M.; Gong, L.; Sui, J.X.; Li, X.Z. The complete mitochondrial genome of Calyptogena marissinica (Heterodonta: Veneroida: Vesicomyidae): Insight into the deep-sea adaptive evolution of vesicomyids. PLoS ONE 2019, 14, e0217952. [Google Scholar] [CrossRef] [PubMed]
- Luo, Y.J.; Gao, W.X.; Gao, Y.Q.; Tang, S.; Huang, Q.Y.; Tan, X.L.; Chen, J.; Huang, T.S. Mitochondrial genome analysis of Ochotona curzoniae and implication of cytochrome c oxidase in hypoxic adaptation. Mitochondrion 2008, 8, 352–357. [Google Scholar] [CrossRef]
- Mahalingam, S.; McClelland, G.B.; Scott, G.R. Evolved changes in the intracellular distribution and physiology of muscle mitochondria in high-altitude native deer mice. J. Physiol. 2017, 595, 4785–4801. [Google Scholar] [CrossRef]
- Pang, X.K.; Han, C.L.; Guo, B.A.; Liu, K.F.; Lin, X.L.; Lu, X.Q. The first complete mitochondrial genome of Eucrate crenata (Decapoda: Brachyura: Goneplacidae) and phylogenetic relationships within infraorder Brachyura. Genes 2022, 13, 1127. [Google Scholar] [CrossRef]
- Chandel, N.S.; Maltepe, E.; Goldwasser, E.; Mathieu, C.E.; Simon, M.C.; Schumacker, P.T. Mitochondrial reactive oxygen species trigger hypoxia-induced transcription. Proc. Natl. Acad. Sci. USA 1998, 95, 11715–11720. [Google Scholar] [CrossRef] [PubMed]
- Dirmeier, R.; O’Brien, K.M.; Engle, M.; Dodd, A.; Spears, E.; Poyton, R.O. Exposure of yeast cells to anoxia induces transient oxidative stress—Implications for the induction of hypoxic genes. J. Biol. Chem. 2002, 277, 34773–34784. [Google Scholar] [CrossRef]
- Mu, W.D.; Liu, J.; Zhang, H.B. Complete mitochondrial genome of Benthodytes marianensis (Holothuroidea: Elasipodida: Psychropotidae): Insight into deep sea adaptation in the sea cucumber. PLoS ONE 2018, 13, e0208051. [Google Scholar] [CrossRef] [PubMed]


Disclaimer/Publisher’s Note: The statements, opinions and data contained in all publications are solely those of the individual author(s) and contributor(s) and not of MDPI and/or the editor(s). MDPI and/or the editor(s) disclaim responsibility for any injury to people or property resulting from any ideas, methods, instructions or products referred to in the content. |
© 2023 by the authors. Licensee MDPI, Basel, Switzerland. This article is an open access article distributed under the terms and conditions of the Creative Commons Attribution (CC BY) license (https://creativecommons.org/licenses/by/4.0/).