Article

Characterization of the Complete Mitochondrial Genome of a Flea Beetle Luperomorpha xanthodera (Coleoptera: Chrysomelidae: Galerucinae) and Phylogenetic Analysis

1
Institute of Entomology, Guizhou University, Guiyang 550025, China
2
Guizhou Provincial Key Laboratory for Agricultural Pest Management of the Mountainous Region, Guiyang 550025, China
3
Plant Protection Research Center, Shenzhen Polytechnic, Shenzhen 518055, China
*
Author to whom correspondence should be addressed.
Genes 2023, 14(2), 414; https://doi.org/10.3390/genes14020414
Submission received: 16 December 2022 / Revised: 27 January 2023 / Accepted: 2 February 2023 / Published: 4 February 2023
(This article belongs to the Special Issue Genetics, Phylogeny, and Evolution of Insects)

Abstract

:
In this study, the mitochondrial genome of Luperomorpha xanthodera was assembled and annotated, which is a circular DNA molecule including 13 protein-coding genes (PCGs), 22 transfer RNA (tRNA) genes, 2 ribosomal RNA genes (12S rRNA and 16S rRNA), and 1388 bp non-coding regions (A + T rich region), measuring 16,021 bp in length. The nucleotide composition of the mitochondrial genome is 41.3% adenine (A), 38.7% thymine (T), 8.4% guanine (G), and 11.6% cytosine (C). Most of the protein-coding genes presented a typical ATN start codon (ATA, ATT, ATC, ATG), except for ND1, which showed the start codon TTG. Three-quarters of the protein-coding genes showed the complete stop codon TAR (TAA, TAG), except the genes COI, COII, ND4, and ND5, which showed incomplete stop codons (T- or TA-). All the tRNA genes have the typical clover-leaf structure, except tRNASer1 (AGN), which has a missing dihydrouridine arm (DHU). The phylogenetic results determined by both maximum likelihood and Bayesian inference methods consistently supported the monophyly of the subfamily Galerucinae and revealed that the subtribe Luperina and genus Monolepta are polyphyletic groups. Meanwhile, the classification status of the genus Luperomorpha is controversial.

1. Introduction

The insect mitochondrial DNA (mtDNA) is a double-stranded circular DNA molecule, with the maternal inheritance features of a relatively small molecular mass, a relatively conservative gene arrangement, and a rapid rate of gene evolution, etc. [1]. The mitochondrial genes have been widely used in species identification, the estimation of evolutionary relationships, and the recognition of population structure and phylogeography [2]. The mitogenome contains 13 protein-coding genes (PCGs), 2 ribosomal RNA genes (rRNAs), 22 transfer RNA genes (tRNAs), and 1 A + T-rich region [3]. Nowadays, mitochondrial DNAs (mtDNAs) have been commonly used as molecular markers for reconstructing phylogenetic relationships, revealing population genetic structures, estimating divergence times, identifying relatedness between recently diverged species, etc. [4,5].
The invasive flea beetle, Luperomorpha xanthodera (Coleoptera: Chrysomelidae: Galerucinae), was originally described by Fairmaire [6] in Jiangxi Province of China [7]. It has previously been recorded in 16 provinces in China, distributing throughout Jilin, Gansu, Shanxi, Shandong, Jiangsu, Zhejiang, Hubei, Jiangxi, Hunan, Fujian, Taiwan, Guangdong, Guangxi, Sichuan, Guizhou, and Yunnan. It has also been found in many other countries, such as Korea, Japan, Italy, France, the Netherlands, and Poland [8,9,10,11,12]. This flea beetle is a crucial pest of economic crop, such as roses (Rosa) and Zanthoxylum spp. Their larvae are commonly found concealed in the roots of plants, while the adults feed on grasses, shrubs, and trees flowers. Luperomorpha xanthodera has been reported to feed on 21 different plants, including white mustard (Sinapis alba L., Brassicaceae), hyssop (Hyssopus officinalis L.), and Monarda spp. (Lamiaceae), etc. [8]. To our knowledge, in the natural population of Luperomorpha xanthodera, the females constituted the vast majority [13]. This means that this species is highly susceptible to outbreaks.
In the past, the species of the genus Luperomorpha Weise were placed among the Alticinae (currently known as Alticini) due to the presence of the metafemoral spring. However, some scholars [14,15] studied the morphological characters of Galerucinae and Alticinae (currently known as Galerucini and Alticini), and they discovered that the metafemoral spring could not be the sole trait that divides the two subfamilies. In a later paper, it was noted that although Luperomorpha has a metafemoral spring, it only has one basal patch at the base of the ventral side of the sheath wing and should be transferred to Galerucinae. However, the classification and taxonomic position of the genus Luperomorpha has continued to prove problematic. Nowadays, only one species of Luperomorpha has been reported for a complete mitogenome.
For the present study, we sequenced and annotated Luperomorpha xanthodera’s complete mitogenome and studied its characteristics. This study aimed to acquire the data on mitochondrial genome, additional analyses of the composition of the Luperomorpha xanthodera mitochondrial genome, the values of the relative synonymous codon usage (RSCU), the evolutionary rate of Luperomorpha and the phylogenetic relationship, etc. We believe such results will be helpful in studies of the population genetics and phylogenetic relationships of this species, as well as studies on other flea beetles in the future. We adopted Nie’s classification system [16] to conduct the subsequent analyses.

2. Materials and Methods

2.1. Sample Collection and DNA Extraction

The invasive flea beetle, Luperomorpha xanthodera, was collected on the Zanthoxylum planispinum from Zhenfeng county, Guizhou, China (25°24′ N, 105°35′ E), on 23 June 2021. The total DNA was extracted from the entire body without the abdomen using the DNeasy Blood & Tissue Kit (Cat. No. 69504) (Qiagen, Hilden, Germany), as per the manufacturer’s protocol. The voucher specimen’s genome DNA and male genitalia were deposited at the Institute of Entomology, Guizhou University, Guiyang, China (GUGC). The identification of adult specimens was based on morphological characteristics [8,10].

2.2. Genome Sequencing, Assembly and Annotation

Illumina TruSeq libraries with an average insert size of 300 bp were prepared and sequenced on the Illumina NovaSeq 6000 platform (Beijing Berry Bioinformatics Technology Co., Ltd., Beijing, China), obtaining 150 bp paired-end reads. The mitogenome was preliminarily annotated by Mitoz 2.4-α [17], with the invertebrate mitochondrial genetic codes. The MITOS web server (http://mitos.bioinf.uni-leipzig.de/index.py, accessed on 14 December 2021) [18] and the tRNAscan-SE search server (http://lowelab.ucsc.edu/tRNAscan-SE/, accessed on 14 December 2021) [19,20] were used to reconfirm and predict the locations and secondary structures of the tRNA genes, and then the tRNA secondary structures were visualized using Adobe Illustrator. The circular mitogenome maps were visualized using Geneious Prime [21].

2.3. Mitogenome Sequence Analyses

MEGA 7.0 [22] was used to obtain the nucleotide composition statistics, relative synonymous codon usage (RSCU) of all the protein-coding genes (PCGs), and the base composition. The following formula was used to calculate the strand asymmetry: AT skew = [A − T]/[A + T] and GC skew = [G − C]/[G + C] [23]. In the A + T rich region, the tandem repeat elements were verified using the Tandem Repeats Finder program (http://tandem.bu.edu/trf/trf.html, accessed on 23 December 2021) [24]. The non-synonymous substitutions (Ka) and synonymous substitutions (Ks) of 13 PCGs of 3 species (A. zanthoxylumi, A. planipennis, and A. ornatus) were calculated using DnaSP v 5 [25].

2.4. Phylogenetic Analysis

For the phylogenetic analysis, 24 additional mitogenome sequences were downloaded from GenBank, and we selected Chrysomela vigintipunctata and Chrysolina aeruginosa as the outgroups (Table 1). The L-INS-I strategy in MAFFT software was used for the sequences of amino acids of 13 PCGs, trimmed using trimAl v1.4.1 [26] with the heuristic method ‘automated1’ to eliminate the gap-only and ambiguous-only locations, and was concatenated using FASconCAT g v1.04 [27].
Using the amino acid sequence with 13 PCGs in the phylogenetic analysis, the maximum likelihood (ML) and Bayesian inference (BI) were used to create phylogenetic trees. The ML analyses were carried out using IQ-TREE V1.6.3 [28] and 1000 ultrafast bootstrap [29] and 1000 SHaLRT replicates [30]. The best model was determined through the AIC and BIC scores. The PMSF model [31] was used for the amino acid sequence matrix with 13 PCGs by specifying the profile mixture model with the option “-mtInv + C60 + FO + R”. Under the CAT + GTR model [32], the amino acid sequence matrix with 13 PCGs was further analyzed with Bayesian inference using PhyloBayes MPI v1.8b [33] and independently run for 10,000 generations for two separate chains. We calculated the largest discrepancy (maxdiff) across all the bipartitions using the bpcomp program. When the maxdiff was <0.3, runs were considered to achieve a good convergence. The tracecomp program was also used to evaluate the discrepancy between two independent runs. The minimum effective size >50 was recognized to be a good run. In this study, values greater than 98 percent (SH-aLRT, UFBoot2) and 0.99 (posterior probability) are considered to be of a “high” support; values of 80 percent to 98 percent for SH-aLRT, 95 percent to 98 percent for UFBoot2, and 0.95 percent to 0.99 percent for the posterior probability are considered to be of a “moderate” support; and values of 95 percent for UFBoot2 and 0.95 percent for the posterior probability are considered to be of a “low” support. The resulting trees were visualized and edited using FigTree v.1.4.2.

3. Results and Discussion

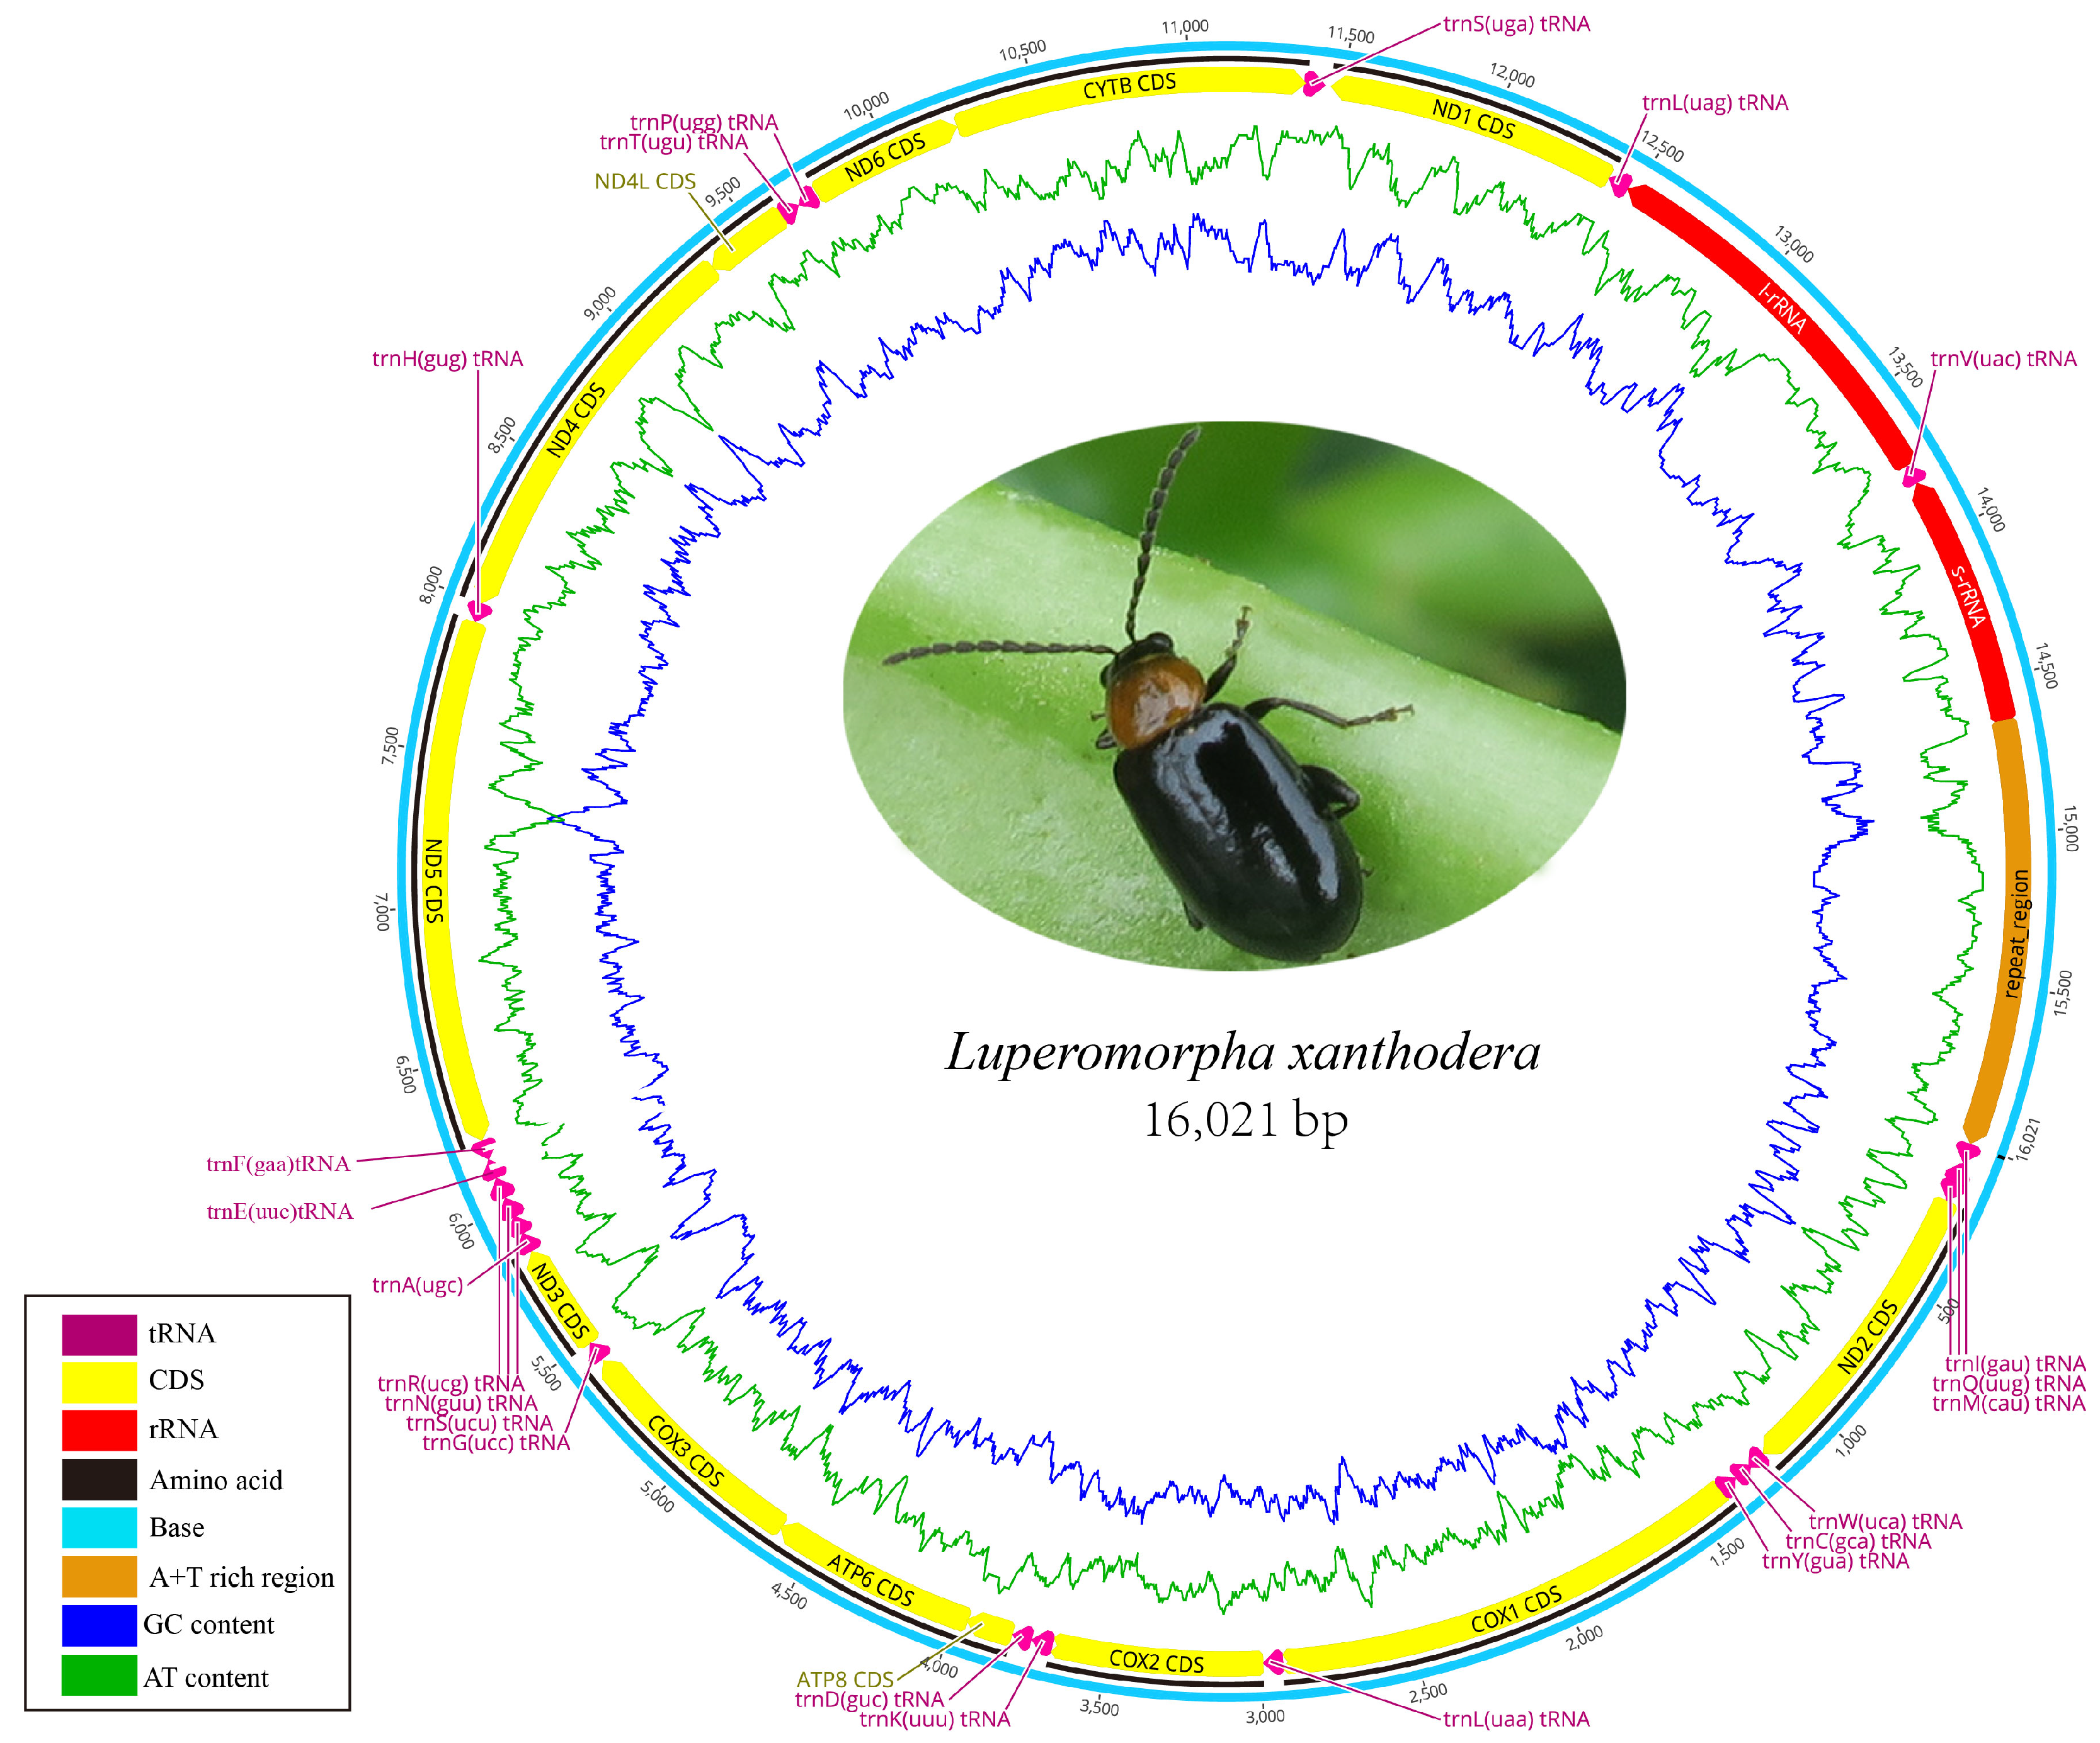
3.1. Mitogenome Organization and Nucleotide Composition

In this study, the complete mitogenome of Luperomorpha xanthodera was successfully obtained and uploaded to GenBank under the accession number ON631248 (Table 1; Figure 1). It has a total length of 16,021 bp and includes 37 genes, including 13 protein-coding genes (PCGs), 2 ribosomal RNA (rRNA) genes, and 22 transfer RNA (tRNA) genes, as well as a noncoding control region (A + T-rich region). The gene order of the Luperomorpha xanthodera mitogenome was consistent with the ancestral gene order of Drosophila yakuba, this is thought to be the ground pattern for insect mitogenomes. As with most galerucine species, 23 genes were on the majority strand (F-strand), and the other 14 genes (tRNAGln, tRNACys, tRNATyr, tRNAPhe, ND5, tRNAHis, ND4, ND4L, tRNAPro, ND1, tRNALeu, 16S rRNA, tRNAVal, 12S rRNA) were on the minority strand (R-strand) (Table 2).
The Luperomorpha xanthodera mitogenome contained 41 bp overlapping regions in 11 pairs of neighboring genes ranging in length from 1 to 8 bp. The longest overlapping region of 8 bp was located between tRNATrp and tRNACys and tRNATyr and COⅠ, respectively. A total of 34 bp intergenic nucleotides (IGN) ranging in size from 1 to 17 bp were distributed across seven locations. The longest intergenic spacer was found between the tRNASer and ND1 (Table 2). These overlapping and intergenic regions are very frequent in flea beetle mitochondrial genomes [34,35,36]. The start codons and termination codons of all the PCGs genes coincided with the typical coleopteran [37] (truncated termination codons).
The overall nucleotide composition of Luperomorpha xanthodera is 41.3% A, 38.7% T, 11.6% C, and 8.4% G and includes a high A + T content (80%) and positive AT skew (0.032) and negative GC skew values (−0.160), this is comparable to other flea beetles. For instance, all the 27 flea beetles we analyzed had positive AT skews and negative GC skews, indicating that the base compositions of the flea beetle mitogenomes were, overall, biased towards A and C (Table 1). Furthermore, the A + T content of the third codon position was the highest (92.2%), while the A + T content of the second codon position was the lowest (69.0%). The AT skews of all the codon positions are positive, indicating a slightly higher occurrence of a likeness to T nucleotides. Meanwhile, the GC skews of the first codon position are positive, but the other two codon positions are negative.

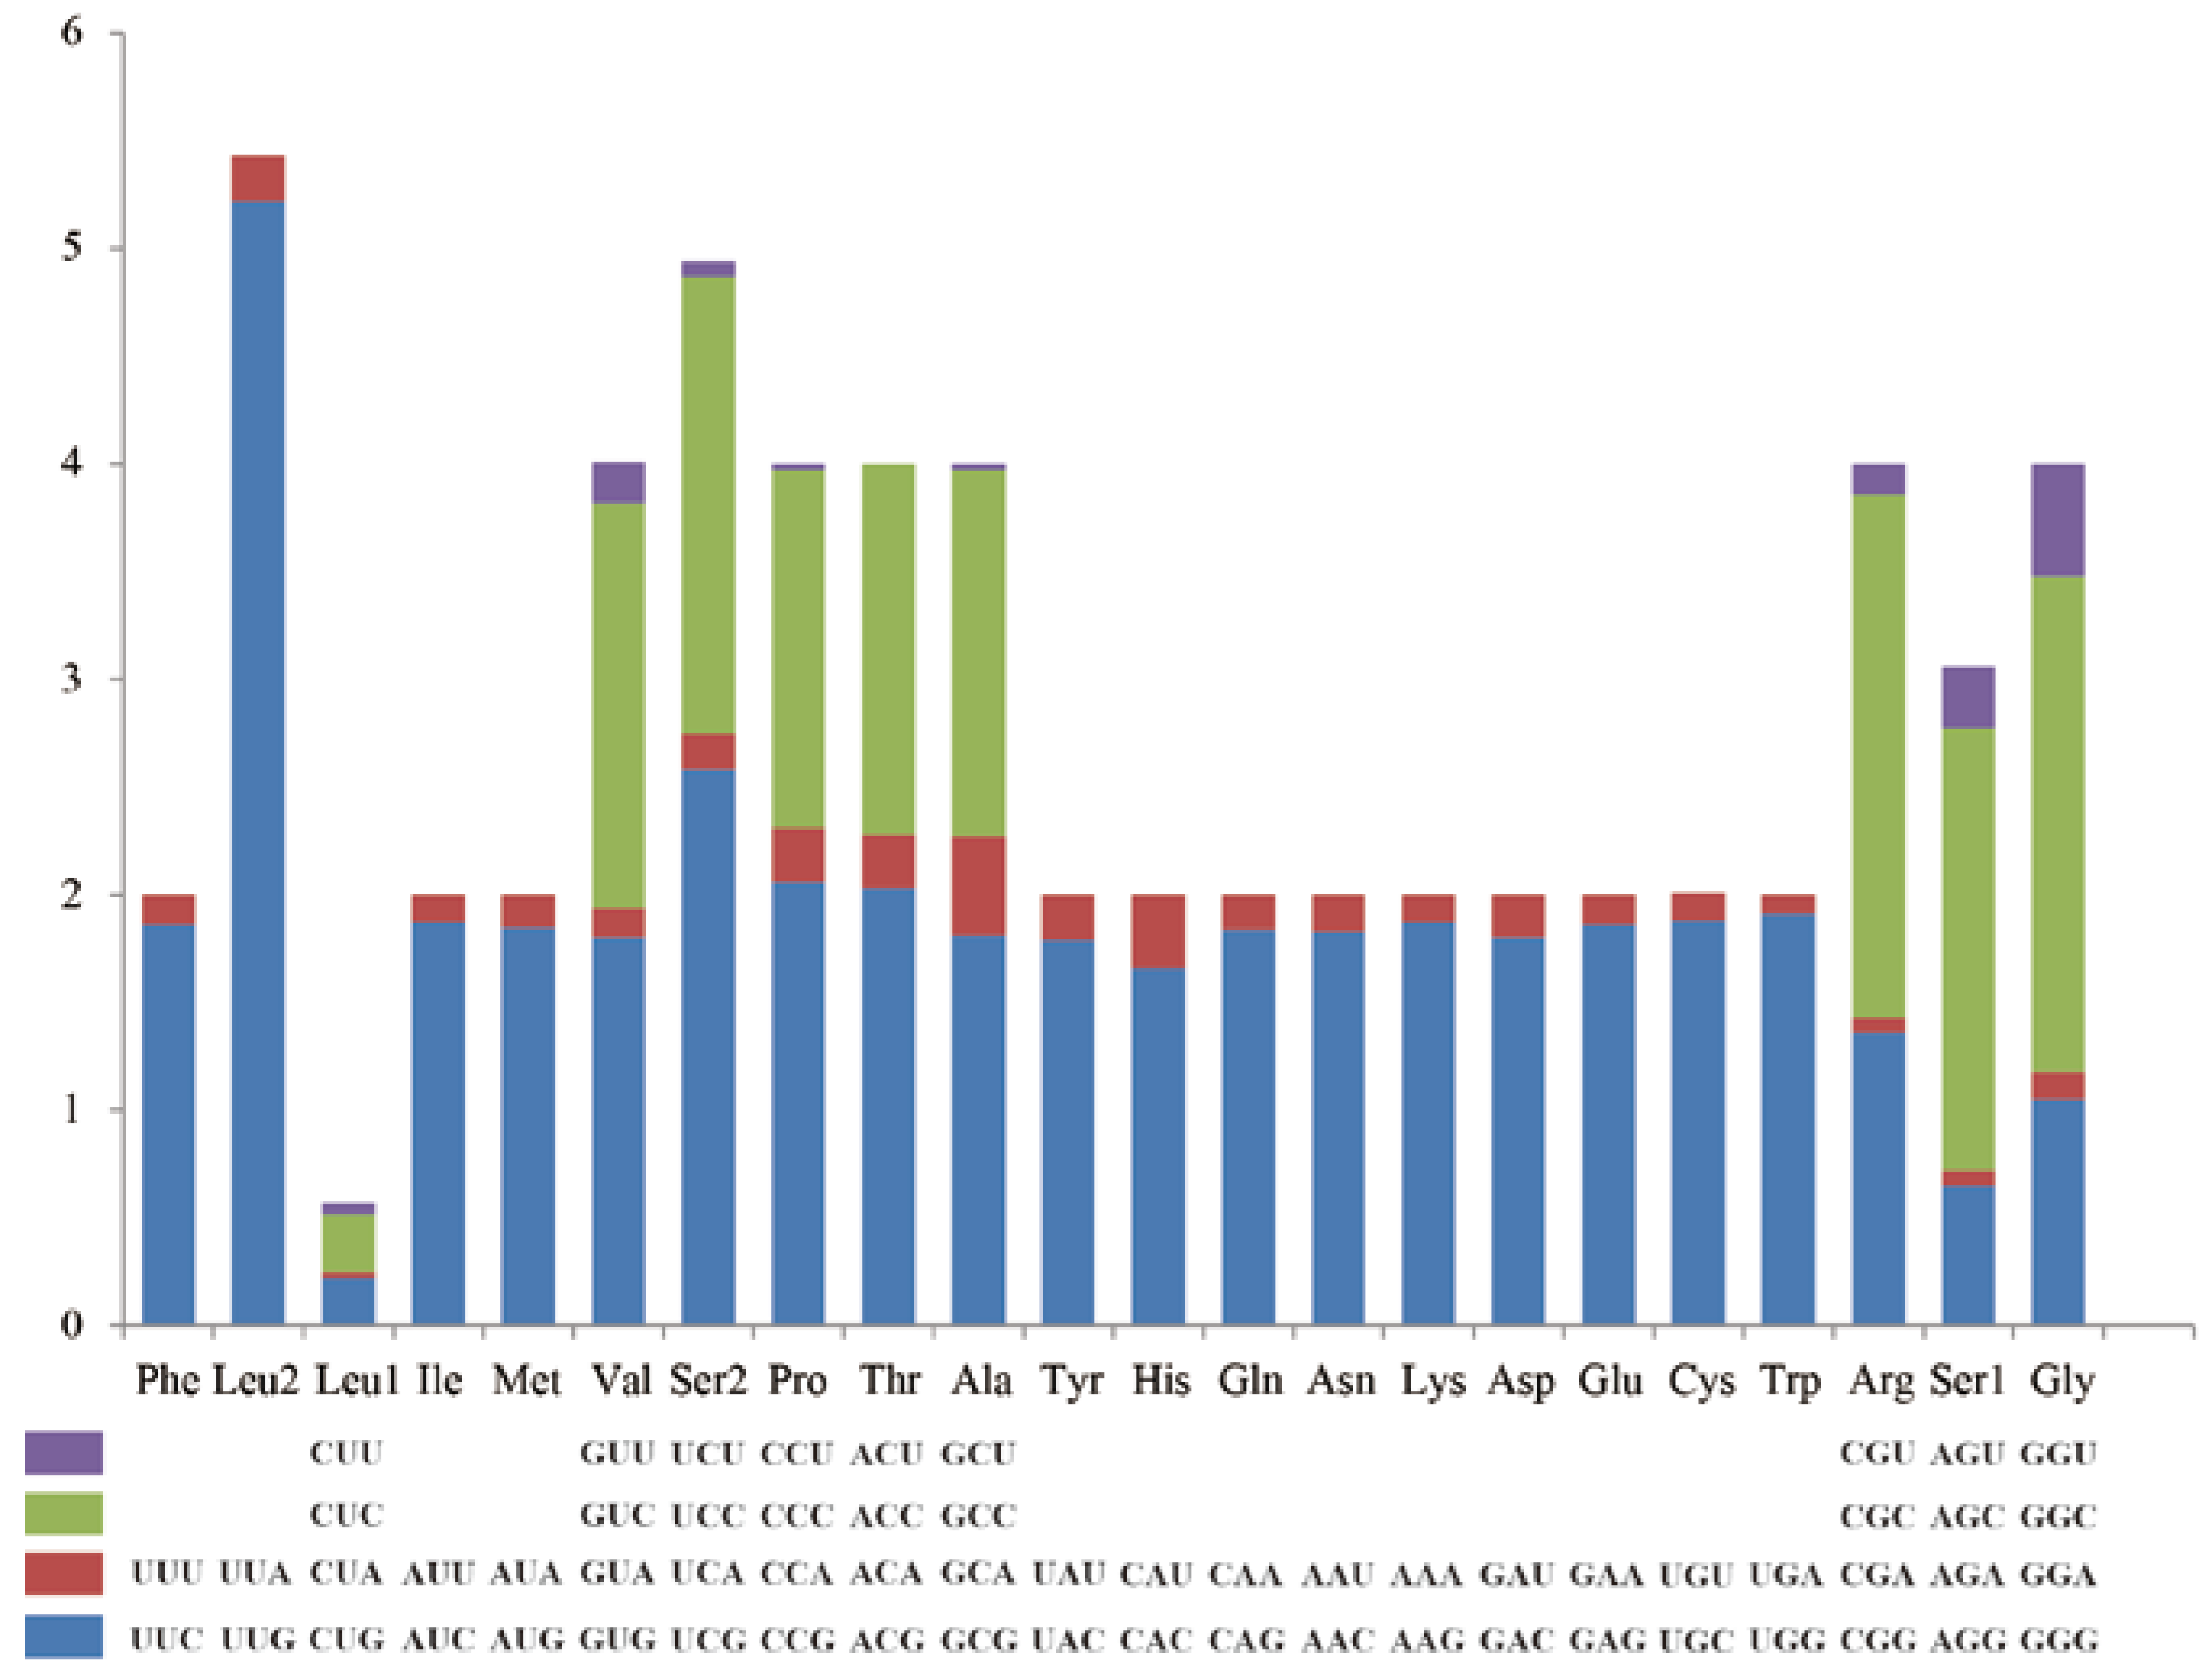
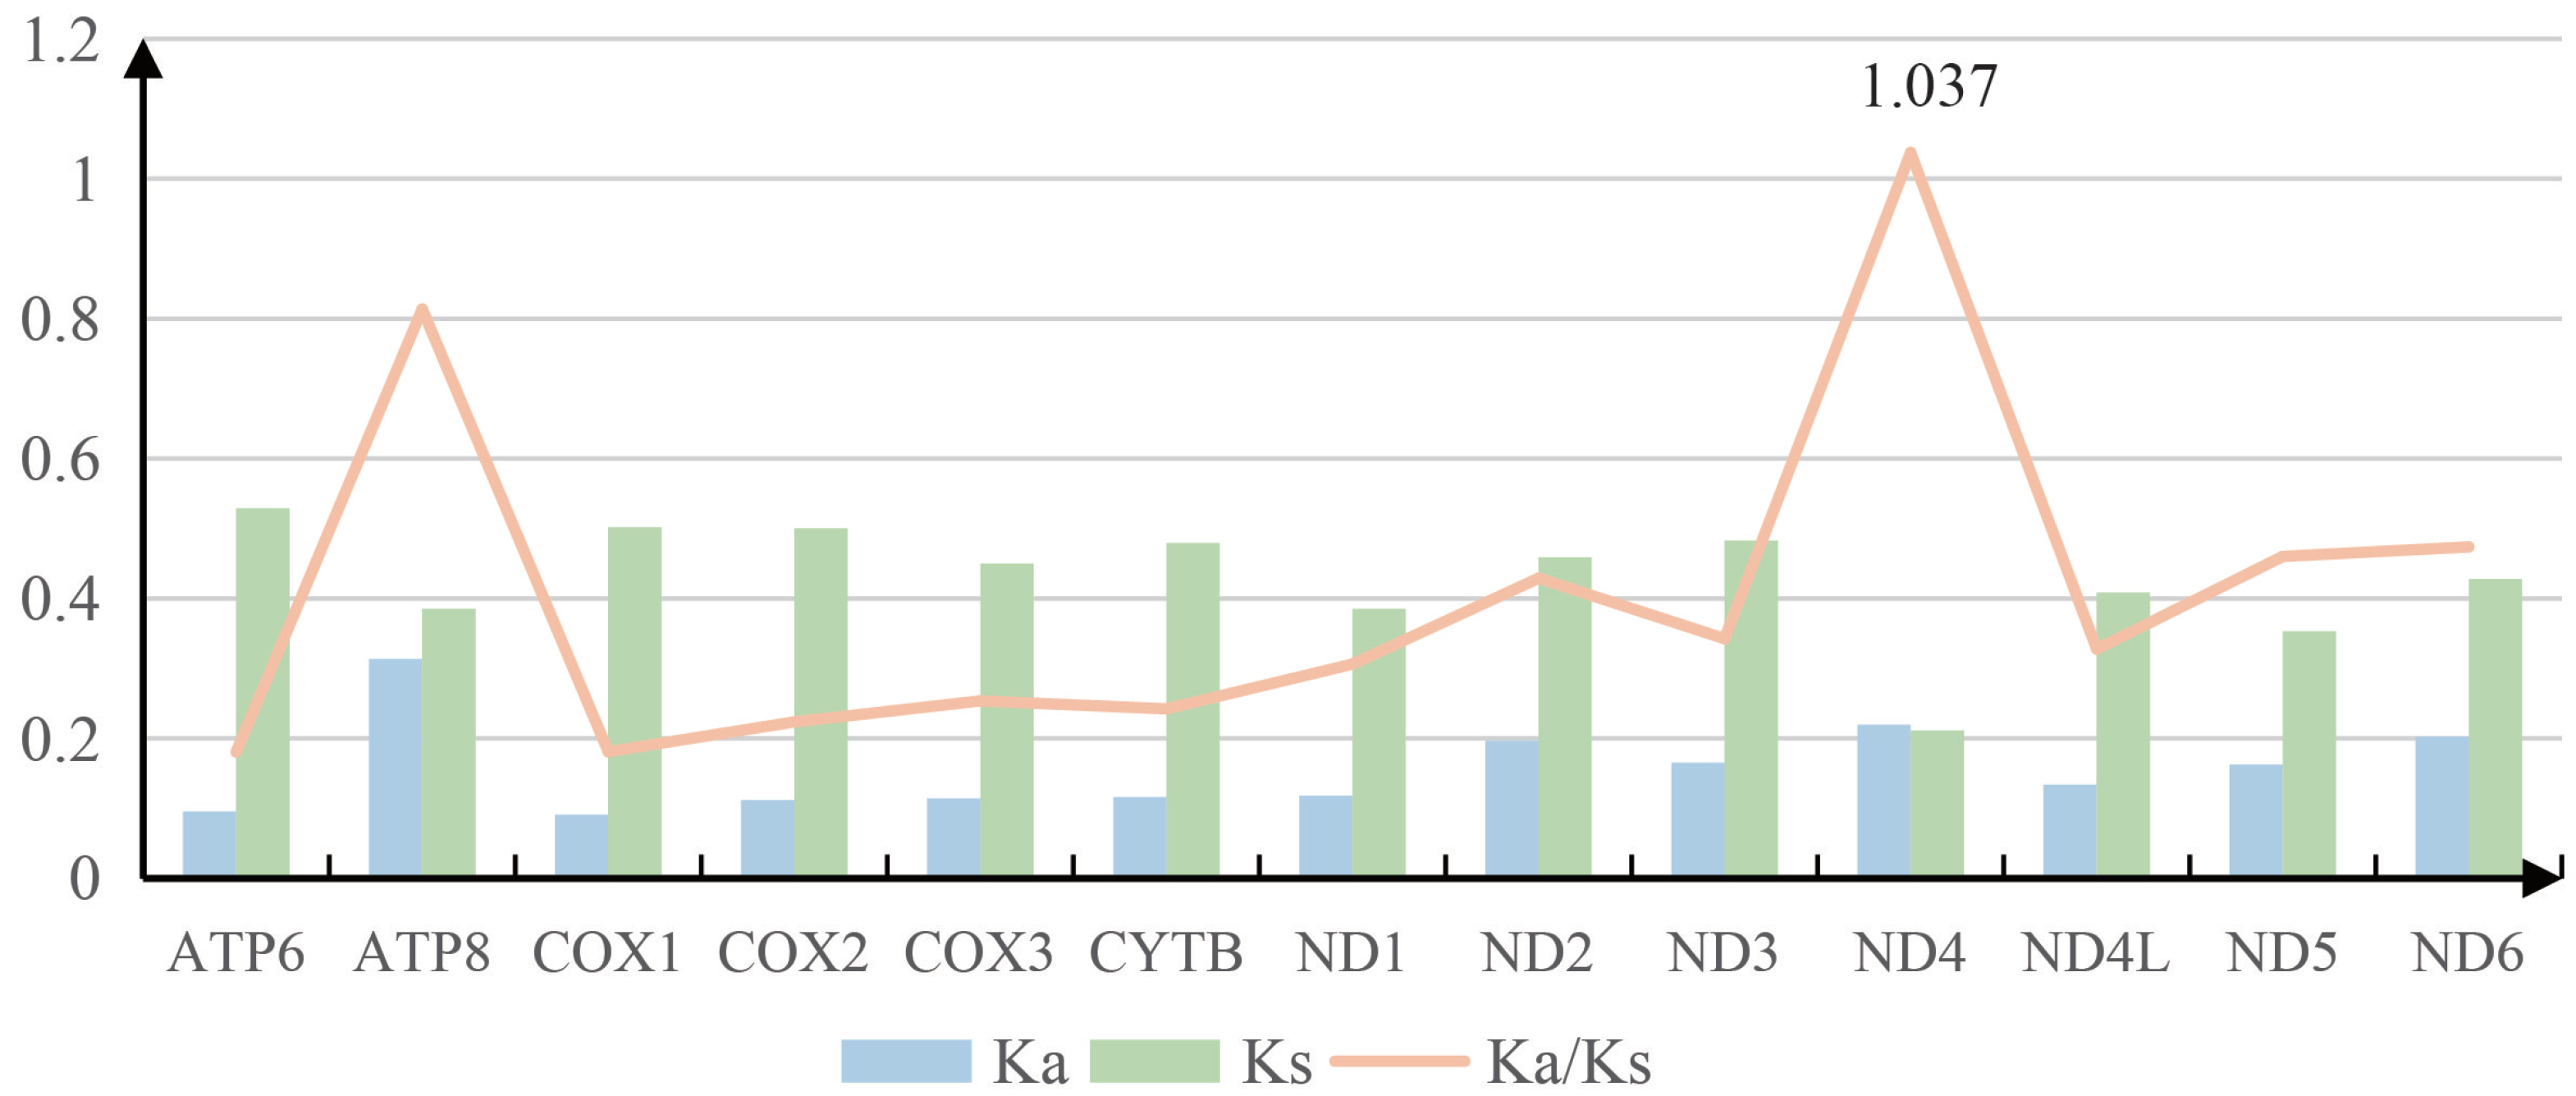
3.2. Protein-Coding Genes and Codon Usage

The PCGs include seven NADH dehydrogenases (ND1-ND6 and ND4L), three cytochrome c oxidases (COⅠ-COⅢ), two ATPases (ATP6 and ATP8), and one cytochrome b (CYTB). The total length of the 13 PCGs of Luperomorpha xanthodera was 11,116 bp, with an A + T content of 78.2%. Additionally, nine of its genes (ND2, COⅠ, COⅡ, ATP8, ATP6, COⅢ, ND3, ND6, CYTB) are located on the major strand (F-strand), and the others (ND5, ND4, ND4L, ND1) are located on the minor strand (R-strand). The ND5 gene was the longest at 1705 bp, and the smallest was the ATP8 gene at 156 bp. The base compositions of the 13 PCG genes were as follows: 40.2% A, 38.0% T, 9.4% G, and 12.5% C (Table 3). Most PCGs of Luperomorpha xanthodera were initiated with the typical ATN codon (except ND1 with TTG). Most PCGs (ND2, ATP8, ATP6, COⅢ, ND3, ND4L, ND6, CYTB, and ND1) had the complete stop codon of TAA or TAG, whereas four PCGs (COⅠ, COⅡ, ND4, and ND5) ended with the incomplete stop codon (T-). Some scholars believe that incomplete termination codons will be repaired by polyadenylation after transcription [38,39]. Based on 3698 codons, the 13 PCGs’ relative synonymous codon usage (RSCU) values were determined. UUU (Phe), UUA (Leu2), AUU (Ile), and AUA (Met) were the four most common codons. The preferred codons all ended in A or U, contributing to the overall A + T bias of the mitogenomes. (Table 4; Figure 2).
We calculated the nonsynonymous substitution rate (Ka), synonymous substitution rate (Ks), and the ratio of Ka/Ks for each PCG in three species (Figure 3). In all PCGs, the highest Ks value was exhibited by ATP6, whereas the Ka value of ATP8 was distinctly higher than others (Figure 3). The average Ka/Ks ranged from 0.181 (ATP6) to 1.037 (ND4). It is noteworthy that with the exception of ND4, all other PCGs of Ka/Ks values are lower than 1, demonstrating that the mutations were exchanged out by synonymous substitutions (Figure 3). The ND4 gene reached 1.037; this result provides an indication that positive selection had a dominating impact on the evolution of ND4 gene. The smallest Ka/Ks -values were 0.181 for COX1 and ATP6, which was considered to be a strong purifying selection.

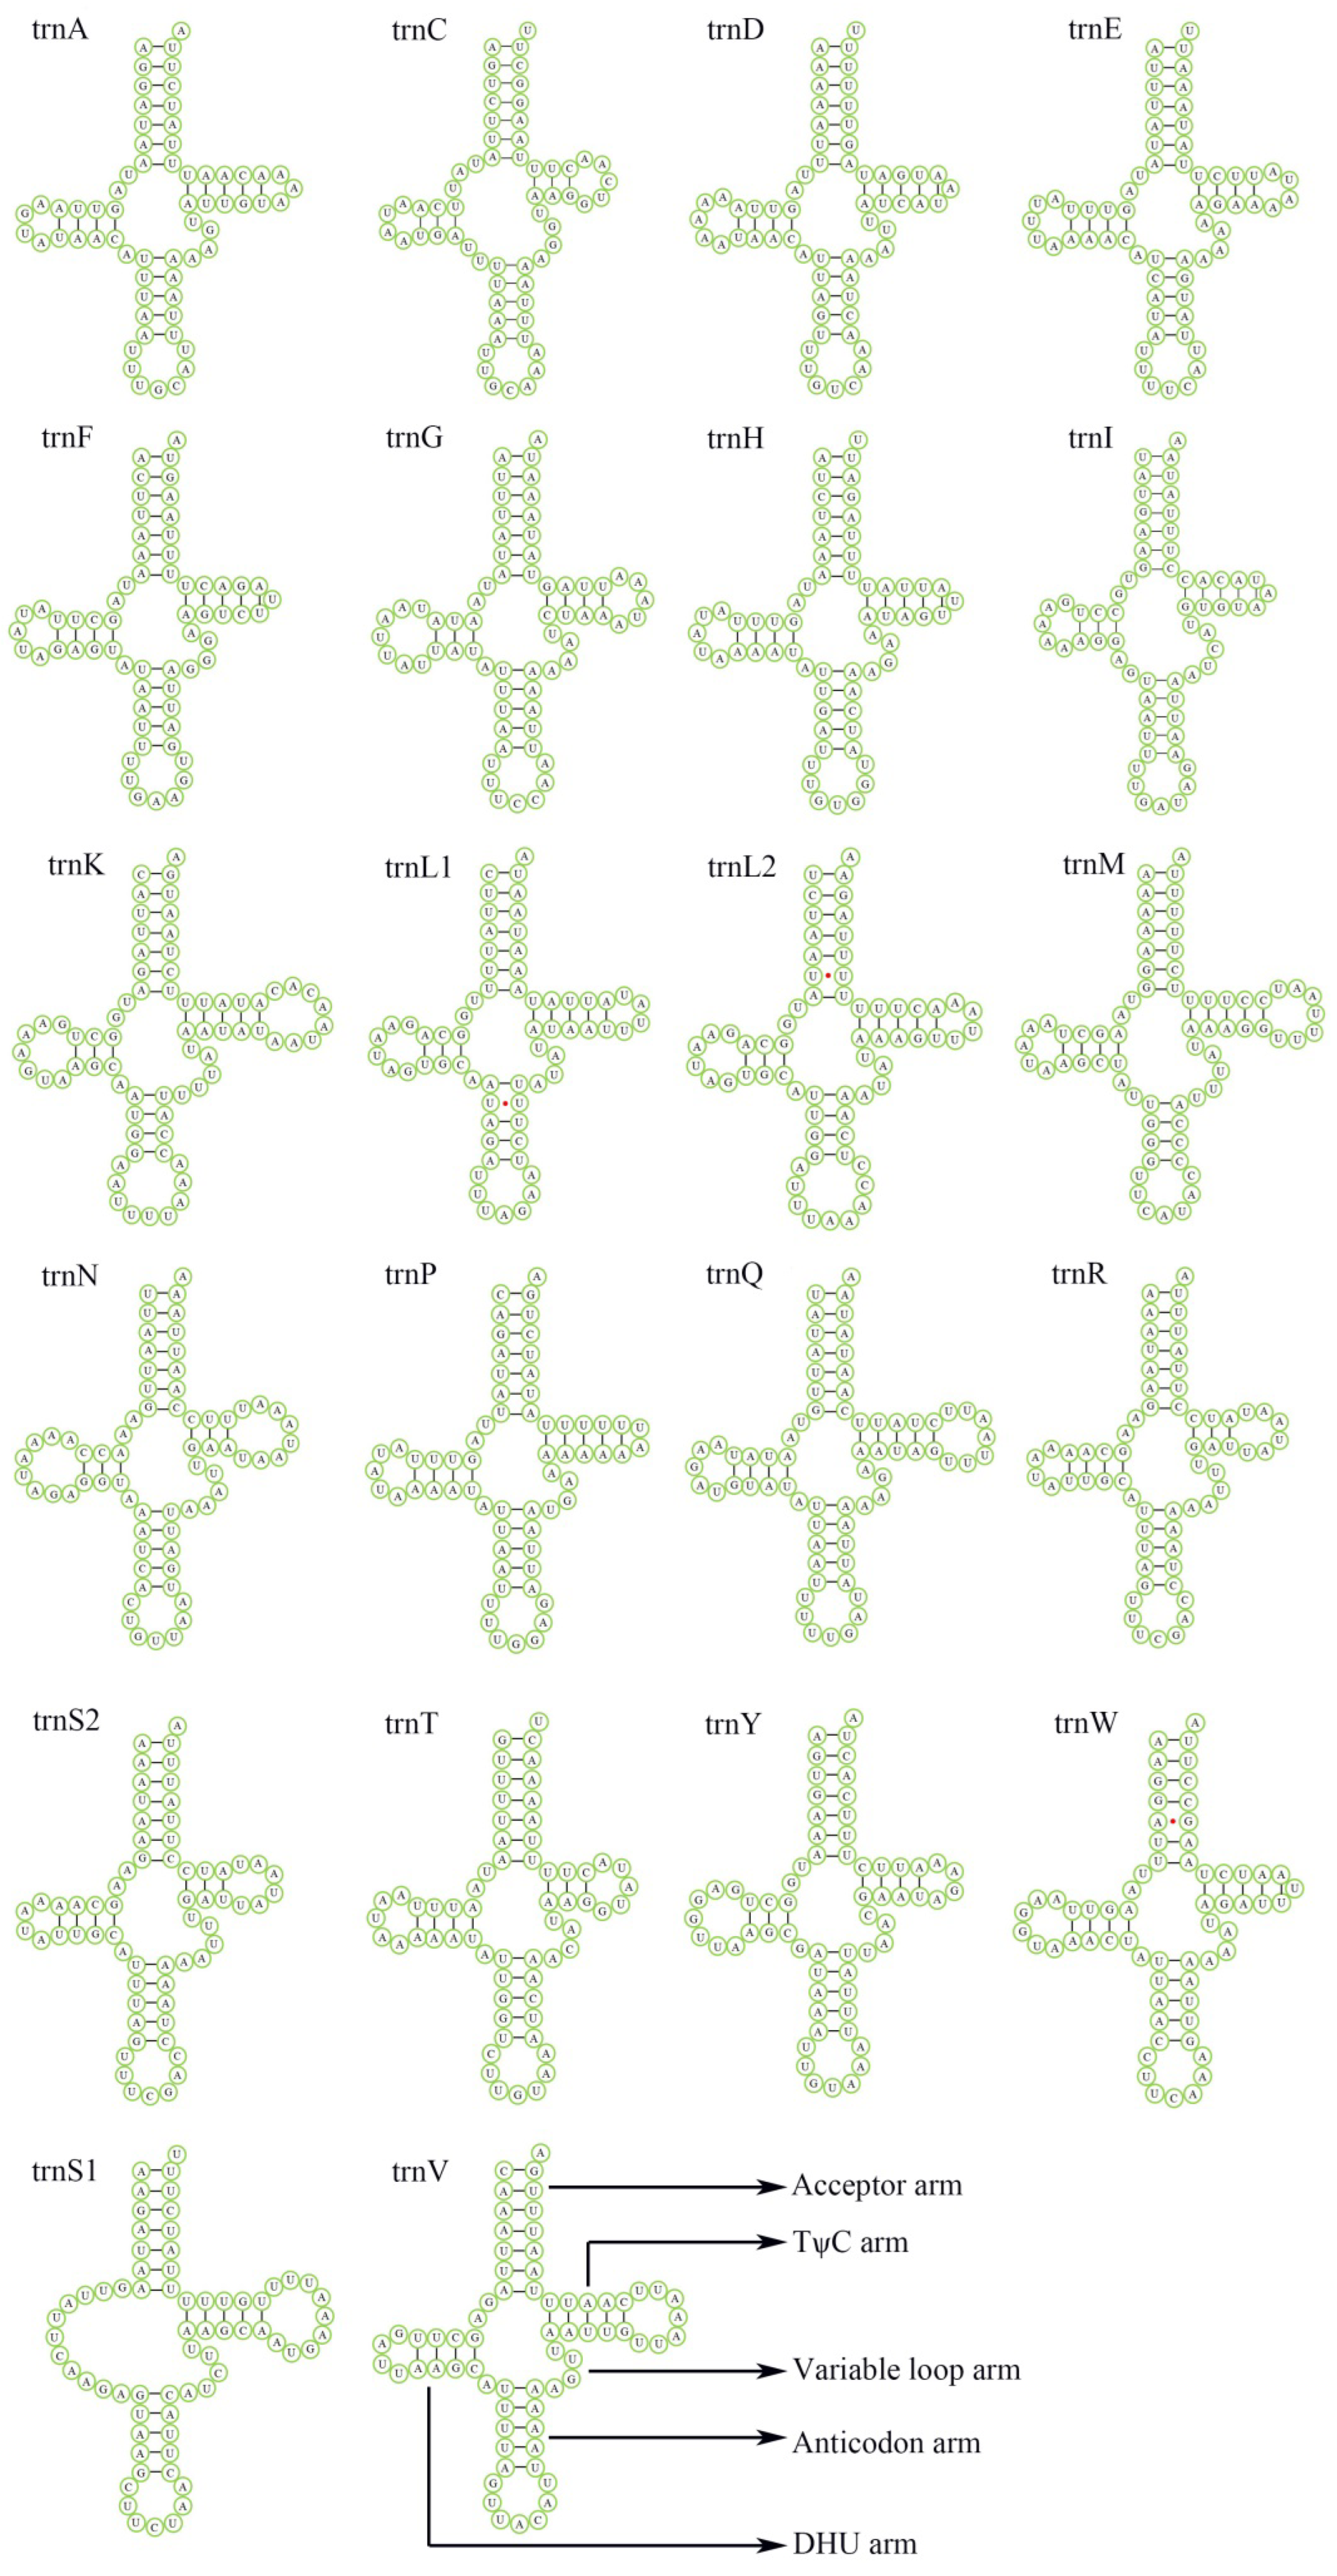
3.3. Transfer and Ribosomal RNA Genes

The length of the 22 tRNA genes of Luperomorpha xanthodera range from 62 bp (tRNAIle) to 70 bp (tRNALys), comprising 8.94% of the complete mitogenome (Table 2), of which all the tRNA genes can be folded into the typical cloverleaf structure, except for trnS1(AGN), whose dihydrouridine (DHU) arm is converted to a simple loop (Figure 4)—this characteristic is frequent in flea beetle mitogenomes [40]. The anticodon of tRNALys mutations is TTT, and when we identified the insects of Chrysomelidae, using this would be one of the quickest methods [16].
The Luperomorpha xanthodera of ribosomal RNA (rRNA) is composed of 16S rRNA (situated between tRNALeu and tRNAVal) and 12S rRNA (situated between tRNAVal and the A + T rich region). The size of the two genes was 1280 bp (16S rRNA) and 812 bp (12S rRNA), respectively. The A + T content reached 84.2% in Luperomorpha xanthodera. Furthermore, the two rRNAs contained a positive AT skew and negative GC skew (Table 3).

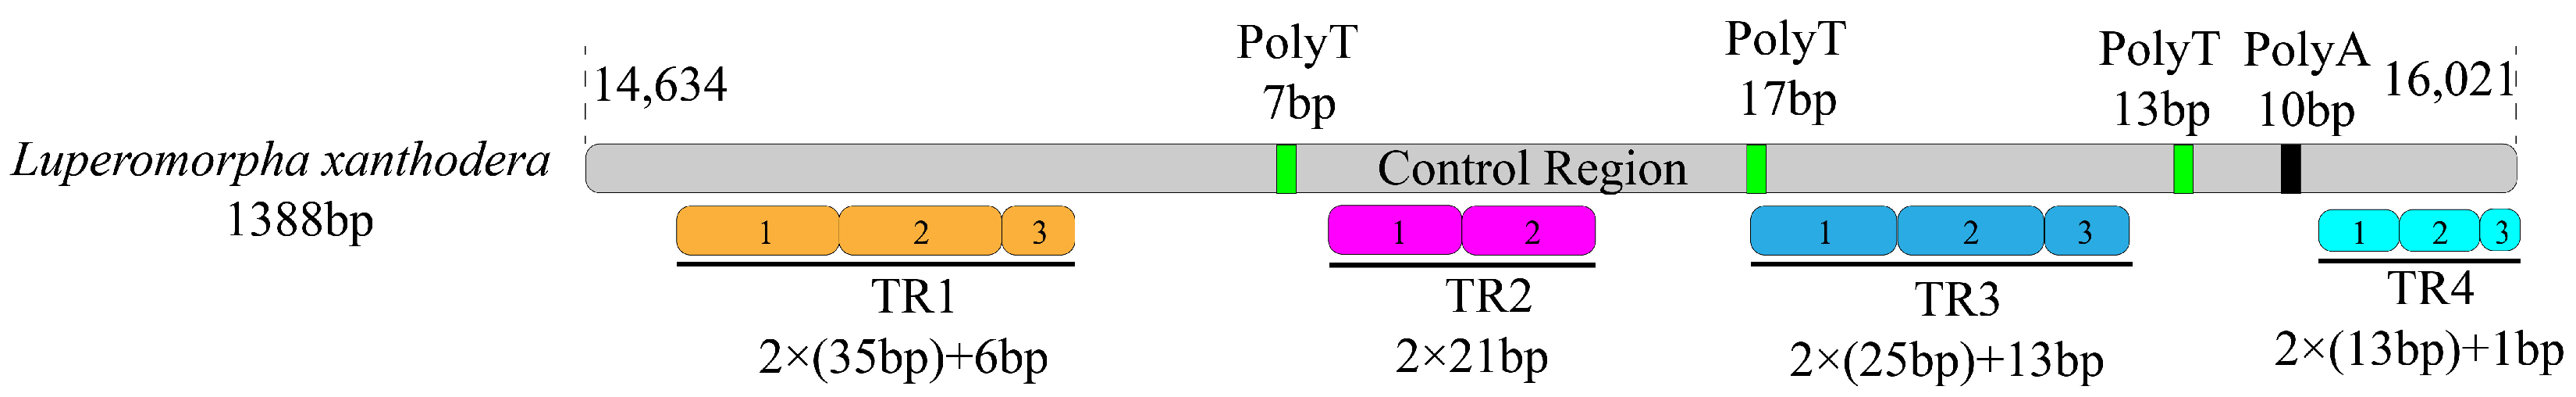
3.4. A + T Rich Region

The A + T-rich region is an important noncoding region in insect mitogenome, which regulates the mitochondrial DNA (mtDNA) transcription and replication [41,42,43]. The A + T rich region of Luperomorpha xanthodera is located between 12S rRNA and tRNAIle and is 1388 bp in length (Table 2). Meanwhile, the A + T content was 87.3%, with positive AT skews (0.010) and negative GC skews (−0.213) (Table 3). Of note, we found four tandem repeat units in the control region, ranging from 13 to 35 bp. Furthermore, a poly-A region and three poly-T regions were found in the control region (Figure 5).

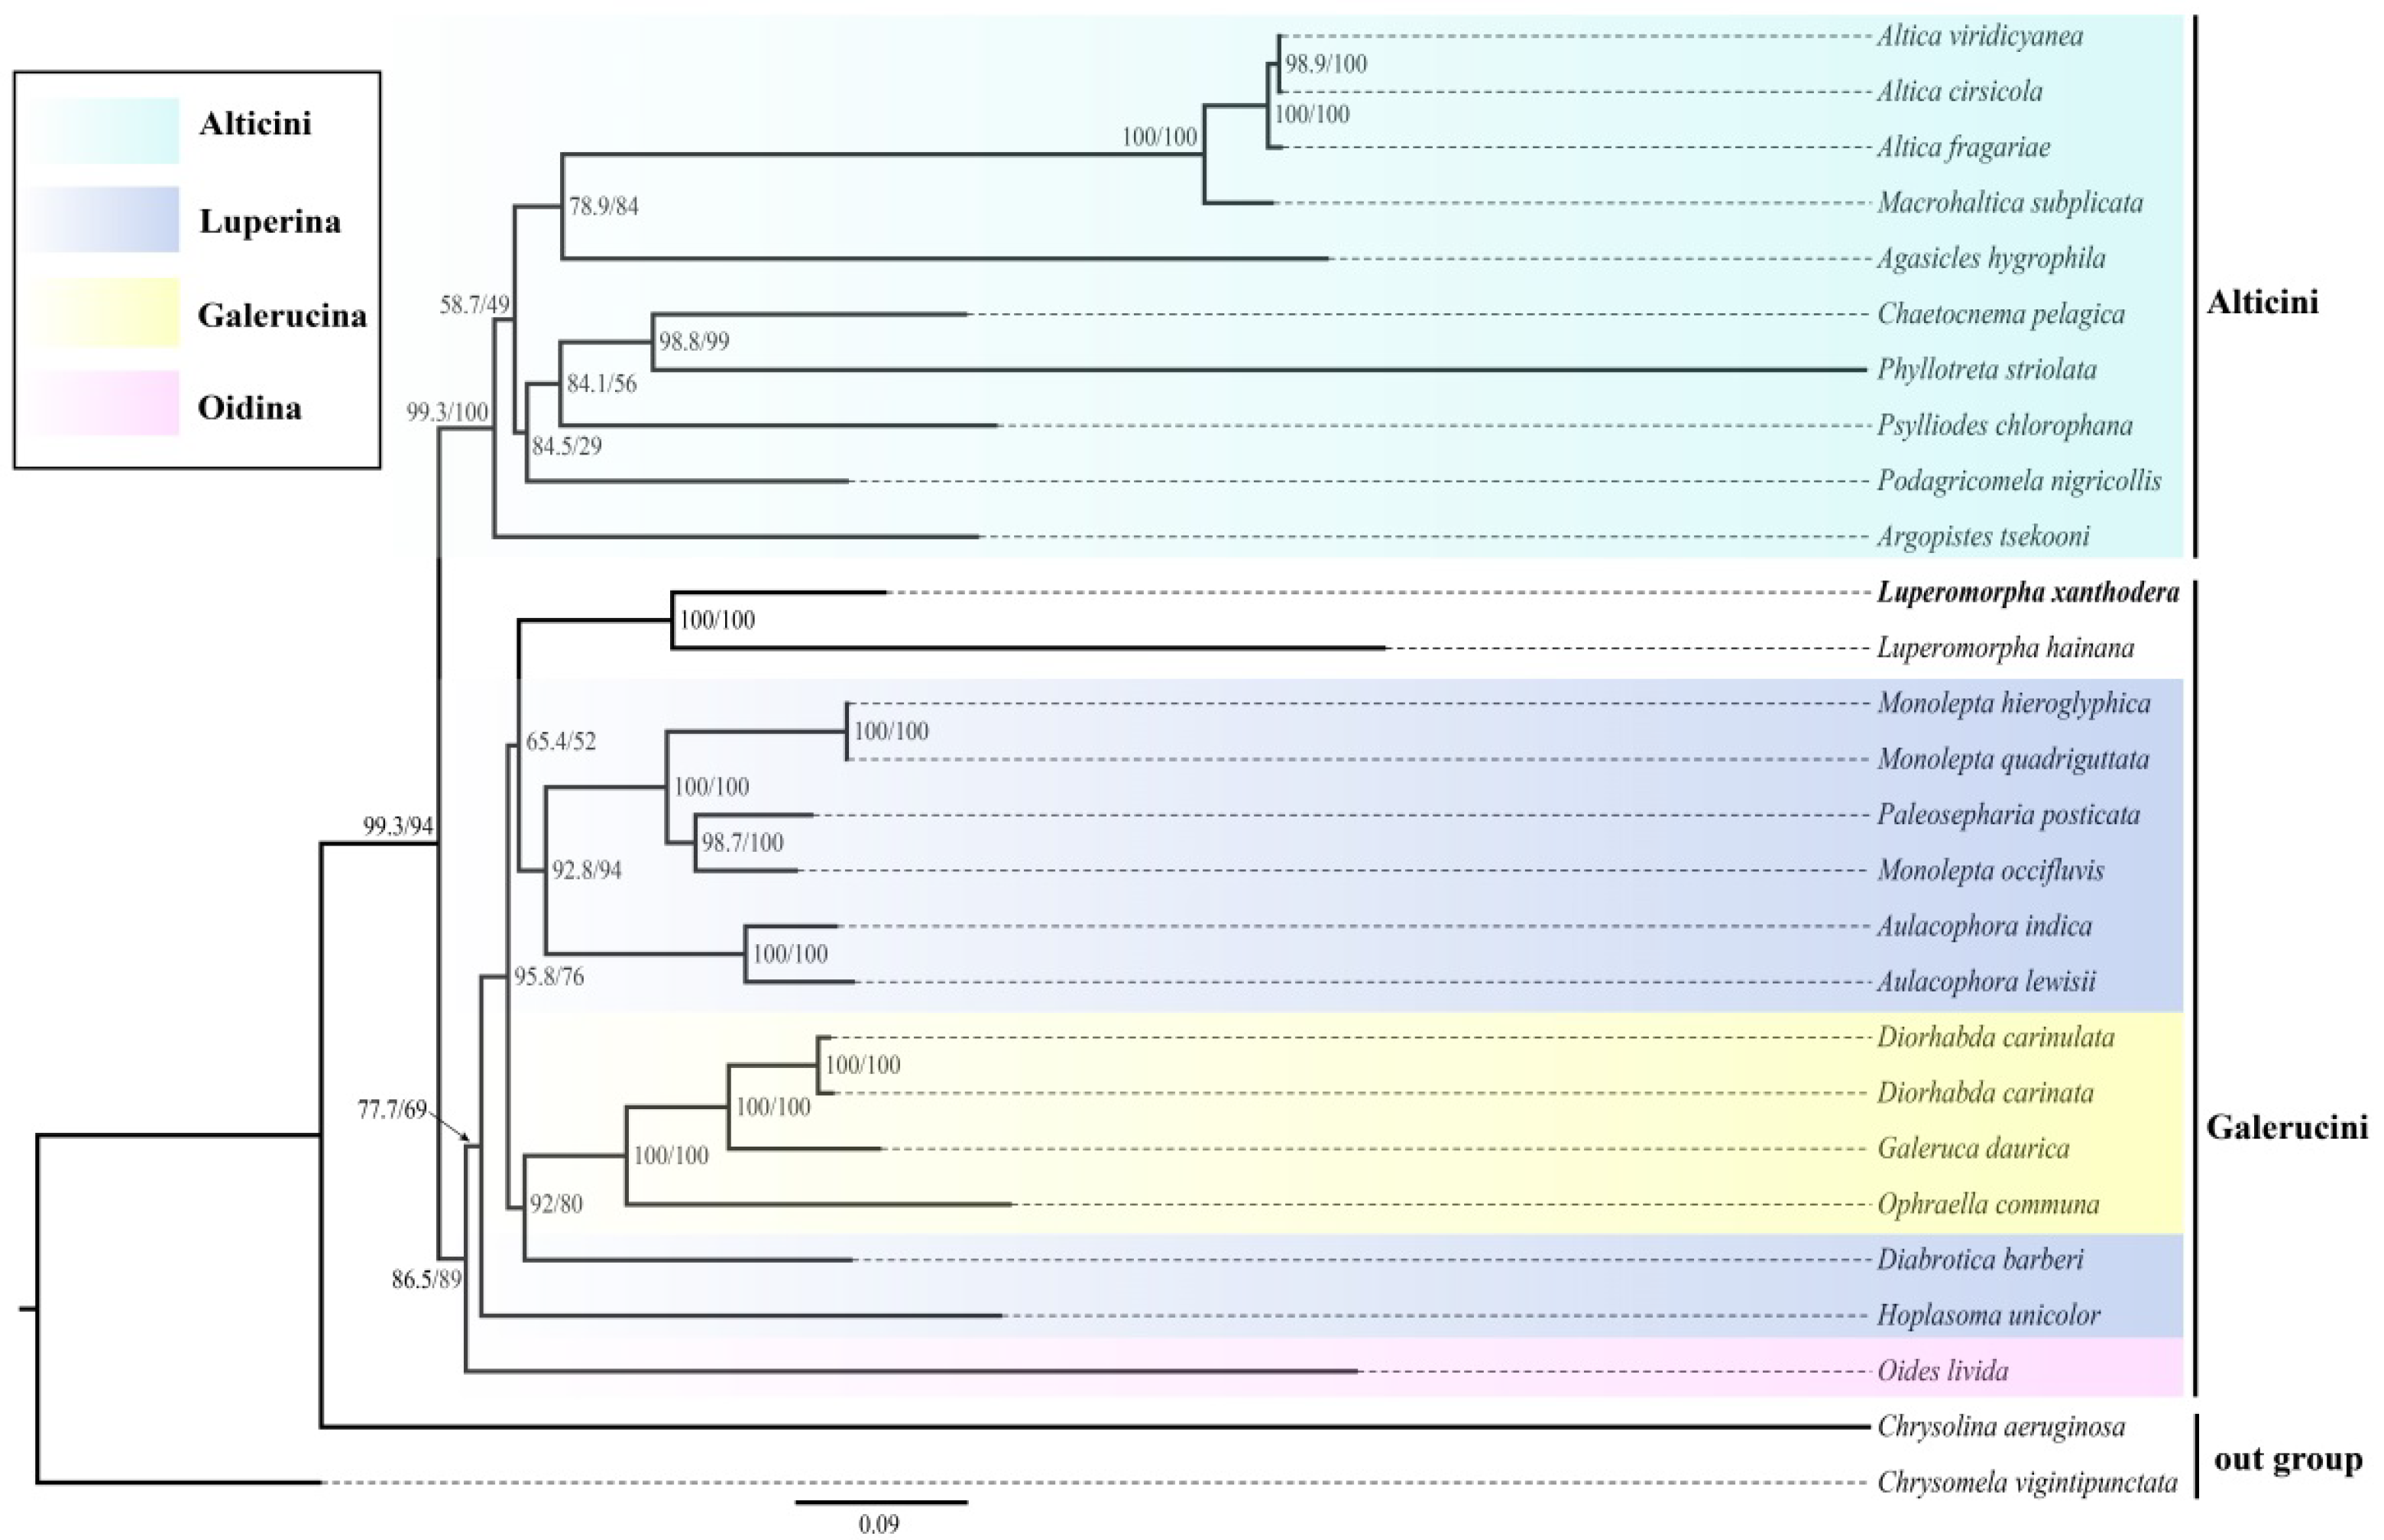
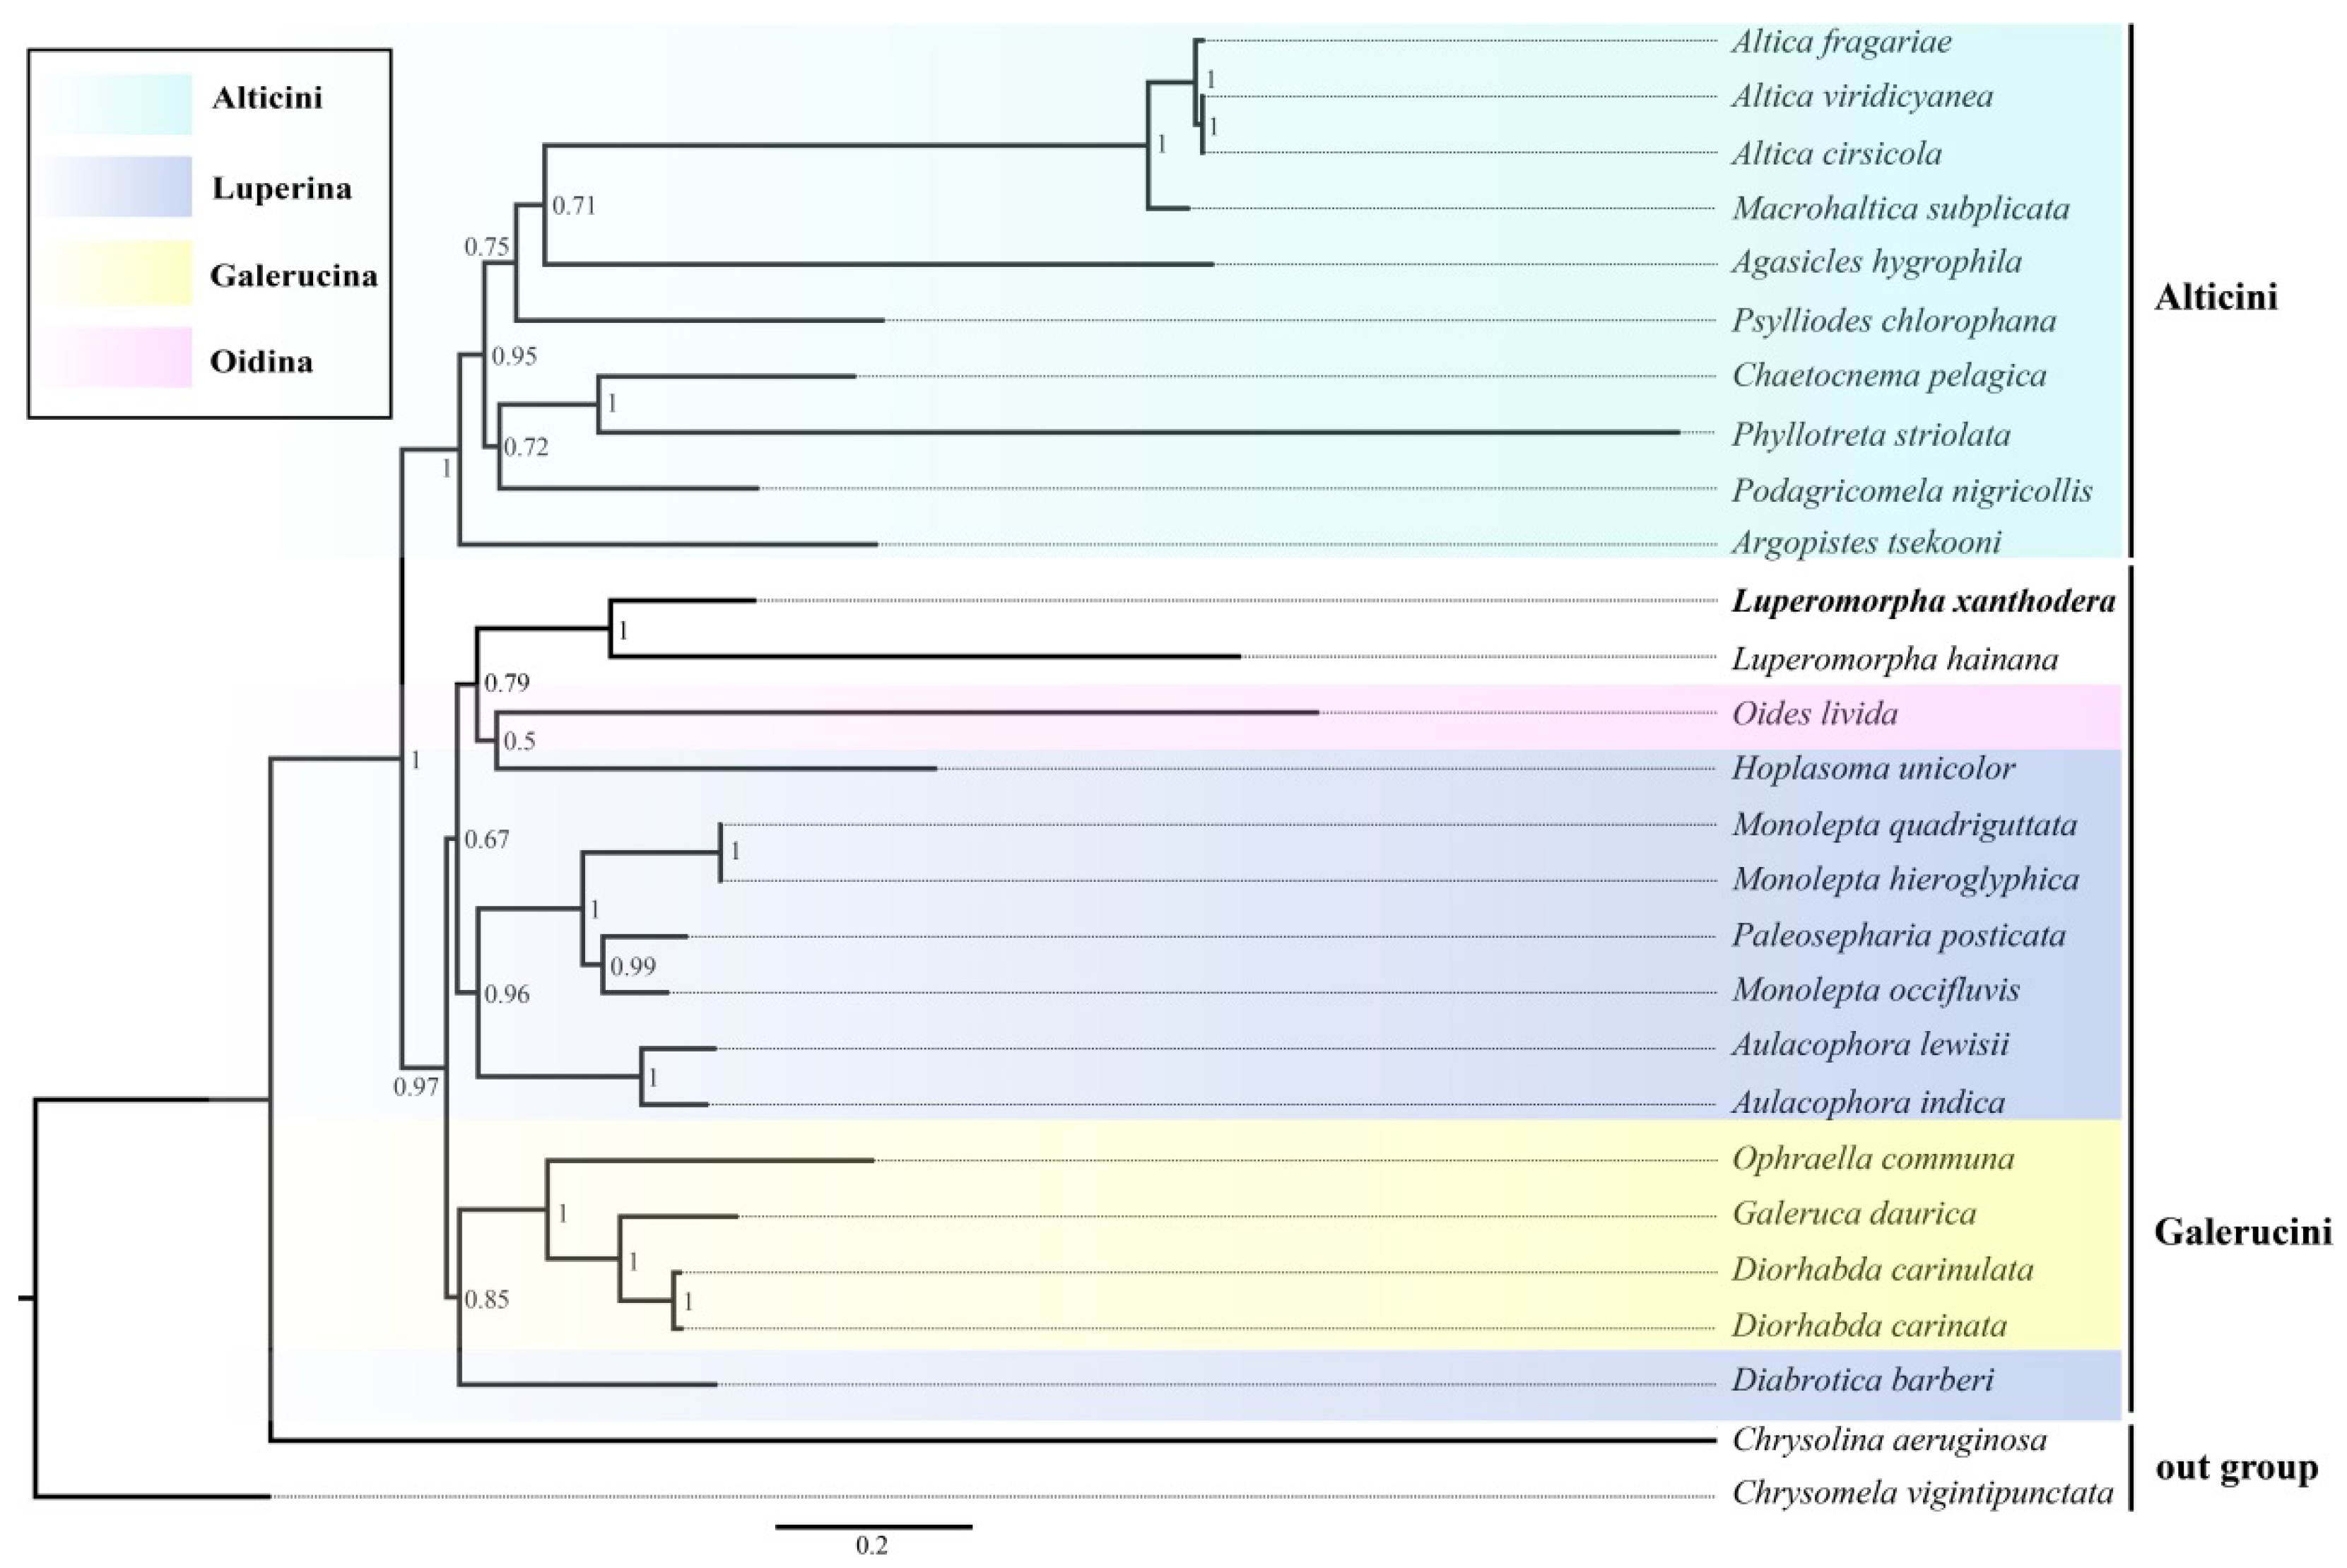
3.5. Phylogenetic Relationships

In the past two decades, molecular systematic approaches are widely used for disclosing unsettled classification and phylogenetic relationships in Insecta [44,45]. The phylogenetic trees of 37 mitochondrial genes (including one newly generated sequence, 24 other Chrysomelidae sequences from GenBank and two outgroup sequences) were generated from a single dataset (amino acids sequence with the 13 PCGs) using maximum likelihood (ML) and Bayesian inference; the BI tree and ML tree are shown in this paper (Figure 6 and Figure 7). The two phylogenetic trees produced consistent results: (1) the Galerucinae is represented as a monophyletic group; (2) the Alticini were clustered into a monophyletic clade and formed sister groups with other subtribes of the Galerucini; (3) the Luperina was the polyphyletic group, which was consistent with the results of Gillespie et al. [46]; and (4) Monolepta occifluvis does not cluster with the other two species of the genus Monolepta but is instead sister to Paleosepharia posticata with high support values (0.99/98.7/100). These findings are consistent with earlier mitogenome-based research [47], which indicates that Monolepta is a polyphyletic genus. There are distinctions between the two trees as well. In the BI tree, the Hoplasoma unicolor is recovered as the sister group of the Oises livida, and their combined clade is grouped with Luperomorpha Weise. In the ML tree, Luperomorpha and Luperina showed a closer relationship.
According to our phylogenetic tree, the two Luperomorpha species are nested in Galerucini. The cladistic taxonomic position of several genera (including Luperomorpha Weise) has been rotating between Galerucini and Alticini in evolutionary studies of Chrysomelidae [48,49,50], and these genera are known as the ‘problematic’ genera [15]. As research on these two tribes has progressed, their taxonomic basis has shifted from a single character analysis (metafemoral spring) to a combination of characters (metafemoral spring, hind wing venation, female spermatheca, male aedeagus, etc.), resulting in Luperomorpha Weise being removed from Alticinae (currently Alticini) and added to Galerucinae (currently Galerucini) [51]. Some phylogenetic studies also support the Luperomorpha Weise being attributed to Galerucini [16,52].

4. Conclusions

At present, we sequenced and analyzed Luperomopha xanthodera’s complete mitogenome. The complete mitochondrial genome of Luperomopha xanthodera has a final size of 16,021 bp, with 80% AT content. The circular mitogenome encoded a typical set of 37 genes (13 PCGs, two rRNAs, 22 tRNAs, and one control region). The majority of PCGs use ATN (except ND1 with TTG) as their start codon and TAA/TAG/T- as the stop codons. For the analysis of the selective pressure, we discovered that most of the 13 PCGs of Luperomorpha were less than one, particularly COX1 and ATP6 genes, which had the lowest value, indicating a high conservation. This revealed that PCGs were subjected to purifying selection in the genus, while the ND4 gene has a high value, demonstrating that it may have been mutated during the evolution process. Phylogenetic trees based on the mitogenomes of 27 species contributed to the scientific classification of Luperomopha xanthodera. Our study identified a close relationship between Luperomopha Weise and Luperini (currently Luperina). Overall, our results provide a hint for the phylogenetic position of Luperomorpha, and they have provided basic genetic information for understanding the phylogeny and evolution of leaf beetles.

Author Contributions

Conceptualization: J.L., B.Y. and M.Y.; methodology: J.L. and B.Y.; software: J.L., B.Y., H.H. and X.X.; data curation: J.L. and B.Y.; writing—original draft preparation: J.L. and B.Y.; writing—review and editing: J.L., Y.R., B.Y. and M.Y. All authors have read and agreed to the published version of the manuscript.

Funding

This study was supported by the Guizhou Province Science and Technology Plan Project (Qian Ke He Zhicheng [2021] Yiban221) and Guizhou Province Science and Technology Innovation Talent Team Project (Qian Ke He Pingtai Rencai-CXTD [2021]004).

Institutional Review Board Statement

Not applicable.

Informed Consent Statement

Informed consent was obtained from all subjects involved in the study.

Data Availability Statement

The Luperomorpha xanthodera sequenced mitogenome was submitted to the GenBank database (ON631248), the multiple sequence alignment used for phylogentic analysis are avalable on FigShare at this weblink: https://doi.org/10.6084/m9.figshare.21957440.v1, accessed on 23 December 2021.

Conflicts of Interest

The authors declare no conflict of interest.

References

  1. Zhongying, Q.; Huihui, C.; Hao, Y.; Yuan, H.; Huimeng, L.; Xia, L.; Xingchun, G. Comparative mitochondrial genomes of four species of Sinopodisma and phylogenetic implications (Orthoptera, Melanoplinae). Zookeys 2020, 2020, 23–42. [Google Scholar] [CrossRef] [PubMed]
  2. Liu, Q.N.; Zhu, B.J.; Dai, L.S.; Liu, C.L. The complete mitogenome of Bombyx mori strain Dazao (Lepidoptera: Bombycidae) and comparison with other lepidopteran insects. Genomics 2013, 101, 64–73. [Google Scholar] [CrossRef] [PubMed]
  3. Yi, M.R.; Hsu, K.C.; Gu, S.; He, X.B.; Luo, Z.S.; Lin, H.D.; Yan, Y.R. Complete mitogenomes of four Trichiurus species: A taxonomic review of the T.lepturus species complexe. ZooKeys 2022, 1084, 1–26. [Google Scholar] [CrossRef] [PubMed]
  4. Wang, B.; Nishikawa, K.; Matsui, M.; Nguyen, T.Q.; Xie, F.; Li, C.; Khatiwada, J.R.; Zhang, B.; Gong, D.; Mo, Y.; et al. Phylogenetic surveys on the newt genus Tylototriton sensu lato (Salamandridae, Caudata) reveal cryptic diversity and novel diversification promoted by historical climatic shifts. PeerJ 2018, 2018, e4384. [Google Scholar] [CrossRef]
  5. Rancilhac, L.; Irisarri, I.; Angelini, C.; Arntzen, J.W.; Babik, W.; Bossuyt, F.; Kunzel, S.; Luddecke, T.; Pasmans, F.; Sanchez, E.; et al. Phylotranscriptomic evidence for pervasive ancient hybridization among Old World salamanders. Mol. Phylogenet Evol 2021, 155, 106967. [Google Scholar] [CrossRef]
  6. Fairmaire, L. Coléoptères de l’intérieur de la Chine. Annls. Soc. Ent. Belg 1887, 31, 87–136. [Google Scholar]
  7. Bieñkowski, A.O.; Orlova-Bienkowskaja, M.J. Quick spread of the invasive rose flea beetle Luperomorpha Xanthodera (Fairmaire, 1888) in Europe and its first record from Russia: (Coleoptera, Chrysomelidae, Galerucinae, Alticini). Spixiana 2018, 41, 99–104. [Google Scholar]
  8. Del Bene, G.; Conti, B. Notes on the biology and ethology of Luperomorpha Xanthodera, a flea beetle recently introduced into Europe. Bull. Insectology 2009, 62, 61–68. [Google Scholar]
  9. Beenen, R.; Roques, A. Leaf and seed beetles (Coleoptera, Chrysomelidae). BioRisk 2010, 4, 267–292. [Google Scholar] [CrossRef]
  10. Kozlowski, M.W.; Legutowska, H. The invasive flea beetle Luperomorpha Xanthodera (Coleoptera: Chrysomelidae: Alticinae), potentially noxious to ornamental plants-first record in Poland. J. Plant Prot. Res. 2014, 54, 106–107. [Google Scholar] [CrossRef]
  11. Yang, X.; Siqin, G.; Nie, R.; Ruan, Y.; Li, W. Chinese Leaf Beetles; Science Press: Beijing, China, 2015; 504p. [Google Scholar]
  12. Fagot, J.; Libert, P. Entretiens sur les Chrysomelidae de Belgique et des régions limitrophes 6. Luperomorpha Xanthodera (Fairmaire, 1888), espèce nouvelle pour la faune belge (Chrysomelidae, Alticinae). Entomol. Faun. Entomol. 2016, 69, 81–82. [Google Scholar]
  13. Sady, E.A.; Kiełkiewicz, M.; Kozłowski, M.W. The rose flea beetle (Luperomorpha xanthodera, Coleoptera: Chrysomelidae), an alien species in central Poland − from an episodic occurrence in an established population. J. Plant Prot. Res. 2020, 60, 86–97. [Google Scholar] [CrossRef]
  14. Furth, D.G. Relationships of Palearctic and Nearctic genera of Alticinae (Coleoptera: Chrysomelidae). Entomography 1985, 3, 375–392. [Google Scholar]
  15. Furth, D.G.; Suzuki, K. Character correlation studies of problematic genera of Alticinae in relation to Galerucinae (Coleoptera: Chrysomelidae). Proc. Third Int. Symp. Chrysomelidae Beijing 1992, 1994, 116–135. [Google Scholar]
  16. Nie, R.E.; Breeschoten, T.; Timmermans, M.J.T.N.; Nadein, K.; Xue, H.J.; Bai, M.; Huang, Y.; Yang, X.K.; Vogler, A.P. The phylogeny of Galerucinae (Coleoptera: Chrysomelidae) and the performance of mitochondrial genomes in phylogenetic inference compared to nuclear rRNA genes. Cladistics 2018, 34, 113–130. [Google Scholar] [CrossRef]
  17. Meng, G.; Li, Y.; Yang, C.; Liu, S. MitoZ: A toolkit for animal mitochondrial genome assembly, annotation and visualization. Nucleic Acids Res. 2019, 47, 1–7. [Google Scholar] [CrossRef] [Green Version]
  18. Bernt, M.; Donath, A.; Jühling, F.; Externbrink, F.; Florentz, C.; Fritzsch, G.; Pütz, J.; Middendorf, M.; Stadler, P.F. MITOS: Improved de novo metazoan mitochondrial genome annotation. Mol. Phylogenet. Evol. 2013, 69, 313–319. [Google Scholar] [CrossRef]
  19. Lowe, T.M.; Eddy, S.R. tRNAscan-SE: A program for improved detection of transfer RNA genes in genomic sequence. Nucleic Acids Res. 1997, 25, 955–964. [Google Scholar] [CrossRef]
  20. Lowe, T.M.; Chan, P.P. tRNAscan-SE On-line: Integrating search and context for analysis of transfer RNA genes. Nucleic Acids Res. 2016, 44, W54–W57. [Google Scholar] [CrossRef]
  21. Kearse, M.; Moir, R.; Wilson, A.; Stones-Havas, S.; Cheung, M.; Sturrock, S.; Buxton, S.; Cooper, A.; Markowitz, S.; Duran, C.; et al. Geneious Basic: An integrated and extendable desktop software platform for the organization and analysis of sequence data. Bioinformatics 2012, 28, 1647–1649. [Google Scholar] [CrossRef] [PubMed]
  22. Kumar, S.; Stecher, G.; Tamura, K. MEGA7: Molecular evolutionary genetics analysis version 7.0 for bigger datasets. Mol. Biol. Evol. 2016, 33, 1870–1874. [Google Scholar] [CrossRef]
  23. Perna, N.T.; Kocher, T.D. Patterns of nucleotide composition at fourfold degenerate sites of animal mitochondrial genomes. J. Mol. Evol. 1995, 41, 353–358. [Google Scholar] [CrossRef] [PubMed]
  24. Benson, G. Tandem repeats finder: A program to analyze DNA sequences. Nucleic Acids Res. 1999, 27, 573–580. [Google Scholar] [CrossRef]
  25. Librado, P.; Rozas, J. DnaSP v5: A Software for Comprehensive Analysis of DNA Polymorphism Data. Bioinformatics 2009, 25, 1451–1452. [Google Scholar] [CrossRef] [PubMed]
  26. Capella-Gutiérrez, S.; Silla-Martínez, J.M.; Gabaldón, T. TrimAl: A tool for automated alignment trimming in large-scale phylogenetic analyses. Bioinformatics 2009, 25, 1972–1973. [Google Scholar] [CrossRef]
  27. Kück, P.; Longo, G.C. FASconCAT-G: Extensive functions for multiple sequence alignment preparations concerning phylogenetic studies. Front. Zool. 2014, 11, 1–8. [Google Scholar] [CrossRef] [Green Version]
  28. Nguyen, L.T.; Schmidt, H.A.; Von Haeseler, A.; Minh, B.Q. IQ-TREE: A fast and effective stochastic algorithm for estimating maximum-likelihood phylogenies. Mol. Biol. Evol. 2015, 32, 268–274. [Google Scholar] [CrossRef]
  29. Hoang, D.T.; Chernomor, O.; Von Haeseler, A.; Minh, B.Q.; Vinh, L.S. UFBoot2: Improving the ultrafast bootstrap approximation. Mol. Biol. Evol. 2018, 35, 518–522. [Google Scholar] [CrossRef]
  30. Guindon, S.; Dufayard, J.F.; Lefort, V.; Anisimova, M.; Hordijk, W.; Gascuel, O. New algorithms and methods to estimate maximum-likelihood phylogenies: Assessing the performance of PhyML 3.0. Syst. Biol. 2010, 59, 307–321. [Google Scholar] [CrossRef]
  31. Wang, H.C.; Minh, B.Q.; Susko, E.; Roger, A.J. Modeling site heterogeneity with posterior mean site frequency profiles accelerates accurate phylogenomic estimation. Syst. Biol. 2018, 67, 216–235. [Google Scholar] [CrossRef] [PubMed]
  32. Lartillot, N.; Philippe, H. A Bayesian mixture model for across-site heterogeneities in the amino-acid replacement process. Mol. Biol. Evol. 2004, 21, 1095–1109. [Google Scholar] [CrossRef] [PubMed]
  33. Lartillot, N.; Rodrigue, N.; Stubbs, D.; Richer, J. PhyloBayes MPI: Phylogenetic reconstruction with infinite mixtures of profiles in a parallel environment. Syst. Biol. 2013, 62, 611–615. [Google Scholar] [CrossRef] [PubMed]
  34. Stahlke, A.R.; Ozsoy, A.Z.; Bean, D.W.; Hohenlohe, P.A. Mitochondrial genome sequences of Diorhabda Carinata and Diorhabda Carinulata, two beetle species introduced to North America for biological control. Microbiol. Resour. Announc. 2019, 8, 7–8. [Google Scholar] [CrossRef] [PubMed]
  35. Li, J.H.; Shi, Y.X.; Song, L.; Zhang, Y.; Zhang, H.F. The complete mitochondrial genome of an important agricultural pest Monolepta Hieroglyphica (Coleoptera: Chrysomelidae: Galerucinae). Mitochond. DNA Part B 2020, 5, 1820–1821. [Google Scholar] [CrossRef]
  36. Nie, R.E.; Wei, J.; Zhang, S.K.; Vogler, A.P.; Wu, L.; Konstantinov, A.S.; Li, W.Z.; Yang, X.K.; Xue, H.J. Diversification of mitogenomes in three sympatric Altica flea beetles (Insecta, Chrysomelidae). Zool. Scr. 2019, 48, 657–666. [Google Scholar] [CrossRef]
  37. Sheffield, N.C.; Song, H.; Cameron, S.L.; Whiting, M.F. A comparative analysis of mitochondrial genomes in coleoptera (Arthropoda: Insecta) and genome descriptions of six new beetles. Mol. Biol. Evol. 2008, 25, 2499–2509. [Google Scholar] [CrossRef] [Green Version]
  38. Ojala, D.; Montoya, J.; Attardi, G. tRNA punctuation model of RNA processing in human mitochondria. Nature 1981, 290, 470–474. [Google Scholar] [CrossRef]
  39. Boore, J.L. Complete mitochondrial genome sequence of Urechis caupo, a representative of the phylum Echiura. BMC Genom. 2004, 5, 67. [Google Scholar] [CrossRef]
  40. Wang, Q.; Tang, G. The mitochondrial genomes of two walnut pests, Gastrolina Depressa Depressa and G. Depressa Thoracica (Coleoptera: Chrysomelidae), and phylogenetic analyses. PeerJ 2018, 6, e4919. [Google Scholar] [CrossRef] [PubMed]
  41. Cameron, S.L. Insect mitochondrial genomics: Implications for evolution and phylogeny. Annu. Rev. Entomol. 2014, 59, 95–117. [Google Scholar] [CrossRef]
  42. Boore, J.L. Animal mitochondrial genomes. Nucleic Acids Res. 1999, 27, 1767–1780. [Google Scholar] [CrossRef] [PubMed]
  43. Zhang, D.X.; Hewitt, G.M. Insect mitochondrial control region: A review of its structure, evolution and usefulness in evolutionary studies. Biochem. Syst. Ecol. 1997, 25, 99–120. [Google Scholar] [CrossRef]
  44. Lee, S.; Leschen, R.A.B.; Lee, S. Evolution of feeding habits of sap beetles (Coleoptera: Nitidulidae) and placement of Calonecrinae. Syst. Entomol. 2020, 45, 911–923. [Google Scholar] [CrossRef]
  45. Gimmel, M.L.; Bocakova, M.; Gunter, N.L.; Leschen, R. Comprehensive phylogeny of the Cleroidea (Coleoptera: Cucujiformia). Syst. Entomol. 2019, 44, 527–558. [Google Scholar] [CrossRef]
  46. Gillespie, J.J.; Tallamy, D.W.; Riley, E.G.; Cognato, A.I. Molecular phylogeny of rootworms and related Galerucine beetles (Coleoptera: Chrysomelidae). Zool. Scr. 2008, 37, 195–222. [Google Scholar] [CrossRef]
  47. Lee, C.F. The genus Paleosepharia Laboissière, 1936 in Taiwan: Review and nomenclatural changes (Coleoptera, Chrysomelidae, Galerucinae). Zookeys 2018, 19, 19–41. [Google Scholar] [CrossRef] [Green Version]
  48. Ge, D.; Gómez-Zurita, J.; Chesters, D.; Yang, X.; Vogler, A.P. Suprageneric systematics of flea Beetles (Chrysomelidae: Alticinae) inferred from multilocus sequence data. Mol. Phylogenet. Evol. 2012, 62, 793–805. [Google Scholar] [CrossRef]
  49. Gillespie, J.J.; Kjer, K.M.; Duckett, C.N.; Tallamy, D.W. Convergent evolution of cucurbitacin feeding in spatially isolated rootworm taxa (Coleoptera: Chrysomelidae; Galerucinae, Luperini). Mol. Phylogenet. Evol. 2003, 29, 161–175. [Google Scholar] [CrossRef]
  50. Kim, S.J.; Kjer, K.M.; Duckett, C.N. Comparison between molecular and morphological-based phylogenies of Galerucine/Alticine leaf beetles (Coleoptera: Chrysomelidae). Insect Syst. Evol. 2003, 34, 53–64. [Google Scholar] [CrossRef]
  51. Ge, D.; Chesters, D.; Zhang, L.; Yang, X.; Alfried, P. Anti-predator defence drives parallel morphological evolution in flea beetles. Proc. R. Soc. B Biol. Sci. 2011, 278, 2133–2141. [Google Scholar] [CrossRef] [PubMed]
  52. Chaboo, C.S.; Clark, S. Beetles (Coleoptera) of Peru: A survey of the families. Chrysomelidae: Galerucinae (not including Alticini). J. Kansas Entomol. Soc. 2015, 88, 361–367. [Google Scholar] [CrossRef]
Figure 1. Complete mitogenome map of Luperomorpha xanthodera. The majority strand (F-strand) encodes 14 genes, while the minority strand (R-strand) encodes 23 genes. Protein and rRNA genes are denoted using standard abbreviations. tRNA genes are represented by a single letter for each amino acid, with two leucine tRNAs and two serine tRNAs separated by numbers.
Genes 14 00414 g001
Figure 2. Relative synonymous codon usage (RSCU) of mitogenome of Luperomorpha xanthodera. Codon families are depicted in boxes below the x-axis; the box colors represent the stacked columns; and the values of RSCU are shown on the y-axis.
Genes 14 00414 g002
Figure 3. Evolutionary rates of 13 PCGs in between Luperomorpha xanthodera and Luperomorpha hainana. A blue boxes, green boxes, and orange line indicate the non-synonymous substitutions rate (Ka), the synonymous substitutions rate (Ks), and the ratio of the rate of non-synonymous substitutions to the rate of synonymous substitutions (Ka/Ks), respectively.
Genes 14 00414 g003
Figure 4. Predicted secondary structures of 22 tRNAs in Luperomorpha xanthodera. Lines (-) indicate Watson–Crick base pairings, whereas dots () indicate unmatched base pairings. The uppercase letter indicate the identity of each tRNA genes. Structural elements in tRNA arms and loops are illustrated as for trnV.
Genes 14 00414 g004
Figure 5. A + T-rich region of Luperomorpha xanthodera mitogenome. Gray blocks represent the A + T rich region. The numbers at the beginning and end of the gray blocks show the position of the control region in the Luperomorpha xanthodera mitogenome. R stands for repeat unit, and the number denotes the number of repeats. The black and green blocks represent the structures of poly-A and poly-T, respectively.
Genes 14 00414 g005
Figure 6. ML analysis was conducted using IQ-TREE with the dataset of amino acids of 13 PCGs. Note: Name in black bold show the phylogenetic position of Luperomorpha xanthodera that we sequenced in this research. The numbers on the nodes are the SH-aLRT support (%) and ultrafast bootstrap support (%).
Genes 14 00414 g006
Figure 7. BI analysis was conducted using PhyloBayes with the dataset of amino acids of 13 PCGs. Note: Name in black bold show the phylogenetic position of Luperomorpha xanthodera that we sequenced in this research. The numbers on the nodes are the posterior probability.
Genes 14 00414 g007
Table 1. Mitochondrial genomes were used for the phylogenetic analyses in this research.
SubfamilyTribeSpeciesLength (bp)G + C%A + T%AT-SkewGC-SkewGenBank No.
GalerucinaeAlticiniAgasicles hygrophila15,91724.975.20.05−0.19NC_028332
Altica cirsicola15,86422.277.80.03−0.21NC_042876
Altica fragariae16,22022.0780.03−0.22NC_042875
Altica viridicyanea16,70622.377.80.04−0.23NC_048472
Argopistes tsekooni16,55220.579.50.04−0.19NC_045929
Chaetocnema pelagica16,33123.176.90.06−0.20NC_041170
Macrohaltica subplicata15,84022.0780.02−0.22NC_041169
Phyllotreta striolata15,68924.275.80.05−0.26NC_045901
Psylliodes chlorophana14,56123.776.30.05−0.22NC_053362
Luperomorpha hainana16,08122.277.80.05−0.25MF960124
Luperomorpha xanthodera16,02120800.03−0.16ON631248
Incertae sedisPaleosepharia posticata15,72920.279.80.02−0.17NC_033532
Podagricomela nigricollis16,75621.378.80.05−0.18NC_041423
GaleruciniDiorhabda carinata16,23222.177.90.03−0.19NC_042945
Diorhabda carinulata16,2982178.90.03−0.18NC_042946
Galeruca daurica16,61521.878.10.04−0.20NC_027114
Ophraella communa16,55322.677.40.06−0.18NC_039710
LuperiniAulacophora indica16,24621.478.60.03−0.20NC_047467
Aulacophora lewisii15,69121.178.90.03−0.18NC_039712
Diabrotica barberi16,36620.879.20.04−0.18NC_022935
Hoplasoma unicolor14,56822.277.80.05−0.23NC_041168
Monolepta hieroglyphica15,96319.780.30.02−0.18NC_057489
Monolepta occifluvis15,99820.779.20.03−0.20NC_045838
Monolepta quadriguttata16,13019.780.30.02−0.19NC_039711
OidiniOides livida16,12720.079.90.05−0.14MF960098
ChrysomelinaeChrysomeliniChrysomela vigintipunctata17,47421.778.20.04−0.21NC_050933
Chrysolina aeruginosa16,33524.575.50.07−0.25NC_052915
Table 2. Organization of the Luperomorpha xanthodera mitochondrial genome. IGN: intergenic nucleotides. Negative values refer to overlapping nucleotides. dots (•) indicate no value, hyphens (-) represent the size of overlapping regions.
GeneDirectionLocation (bp)Size (bp)CodonAnti-CodonIGN
fromtoStartStop
tRNAIleF16262GAT
tRNAGlnR6313169TTG0
tRNAMetF13119969CAT-1
ND2F20012101011ATTTAA0
tRNATrpF1211127464TCA0
tRNACysR1267132862GCA-8
tRNATyrR1329139163GTA0
COⅠF138429261543ATTT-8
tRNALeuF2927299165TAA0
COⅡF29923676685ATGT0
tRNALysF3677374670TTT0
tRNAAspF3747380963GTC0
ATP8F38103965156ATCTAA0
ATP6F39594633675ATGTAA-7
COⅢF46335421789ATGTAA-1
tRNAGlyF5424548865TCC2
ND3F54895842354ATTTAG0
tRNAAlaF5841590464TGC-2
tRNAArgF5905596864TCG0
tRNAAsnF5966603368GTT-3
tRNASerF6034610067TCT0
tRNAGluF6102616564TTC1
tRNAPheR6165622763GAA-1
ND5R622879321705ATTT0
tRNAHisR7933799563GTG0
ND4R800593251321ATGT9
ND4LR93199600282ATGTAA-7
tRNAThrF9603966563TGT2
tRNAProR9666972964TGG0
ND6F973210,235504ATTTAA2
CYTBF10,23511,3741140ATGTAG-1
tRNASerF11,37311,43967TGA-2
ND1R11,45712,407951TTGTAG17
tRNALeuR12,40912,47365TAG1
16S rRNAR12,47413,75312800
tRNAValR13,75413,82168TAC0
12S rRNAR13,82214,6338120
A + T rich regionF14,63416,02113880
Table 3. Nucleotide composition of the Luperomorpha xanthodera mitogenomes.
GenesSize (bp)Nucleotides CompositionATskewGCskew
A (%)T (%)G (%)C (%)A + T (%)G + C (%)
Complete mitogenome16,02141.338.78.411.680200.032−0.160
PCGs11,12533.944.311.110.778.221.8−0.1330.018
1st codon position371135.038.216.710.173.226.8−0.0430.247
2nd codon position370721.147.913.417.569.029−0.388−0.135
3rd codon position370745.546.73.24.692.27.8−0.014−0.181
tRNA143241.938.88.710.680.719.30.038−0.098
rRNA209244.639.65.510.384.215.80.059−0.304
16S rRNA128045.138.75.710.583.816.20.076−0.296
12S rRNA81243.841.05.210.084.815.20.033−0.316
A + T rich region138844.143.25.07.787.312.70.010−0.213
Table 4. Relative synonymous codon usage (RSCU) of Luperomorpha xanthodera mitochondrial PCGs. The asterisk (*) represent Termination codon.
Amino AcidCodonCountRSCUAmino AcidCodonCountRSCU
PheUUU3251.86TyrUAU1621.79
UUC240.14 UAC190.21
Leu2UUA5245.22HisCAU591.66
UUG210.21 CAC120.34
Leu1CUU220.22GlnCAA571.84
CUC30.03 CAG50.16
CUA270.27AsnAAU1901.83
CUG50.05 AAC180.17
IleAUU3911.87LysAAA1021.87
AUC270.13 AAG70.13
MetAUA2411.85AspGAU621.8
AUG200.15 GAC70.13
ValGUU661.8GluGAA691.86
GUC50.14 GAG50.14
GUA691.88CysUGU301.88
GUG70.19 UGC20.13
Ser2UCU1072.58TrpUGA881.91
UCC70.17 UGG40.09
UCA882.12ArgCGU191.36
UCG30.07 CGC10.07
ProCCU662.06 CGA342.43
CCC80.25 CGG20.14
CCA531.66Ser1AGU270.56
CCG10.03 AGC30.07
ThrACU902.03 AGA852.05
ACC110.25 AGG120.29
ACA761.72GlyGGU501.05
ACG00 GGC60.13
AlaGCU631.81 GGA1102.3
GCC160.46 GGG250.52
GCA591.7*UAA00
GCG10.03 UAG00
Disclaimer/Publisher’s Note: The statements, opinions and data contained in all publications are solely those of the individual author(s) and contributor(s) and not of MDPI and/or the editor(s). MDPI and/or the editor(s) disclaim responsibility for any injury to people or property resulting from any ideas, methods, instructions or products referred to in the content.

