Article

ABCB1 Amplicon Contains Cyclic AMP Response Element-Driven TRIP6 Gene in Taxane-Resistant MCF-7 Breast Cancer Sublines

1
Department of Biochemistry, Cell and Molecular Biology, Third Faculty of Medicine, Charles University, 100 00 Prague, Czech Republic
2
Toxicogenomics Unit, National Institute of Public Health, 100 00 Prague, Czech Republic
3
Laboratory of Pharmacogenomics, Biomedical Center, Faculty of Medicine, Charles University, 323 00 Pilsen, Czech Republic
4
Department of Cytogenetics, Institute of Hematology and Blood Transfusion, 128 00 Prague, Czech Republic
5
Department of Chemistry, Institute of Chemical Biology & Drug Discovery, Stony Brook University—State University of New York, Stony Brook, NY 11794, USA
6
Department of Cell Biology, Faculty of Science, Charles University, 128 00 Prague, Czech Republic
7
Department of Cancer Genetics, Institute for Cancer Research, Oslo University Hospital, 0310 Oslo, Norway
8
Department of Medical Genetics, Institute of Clinical Medicine, Faculty of Medicine, University of Oslo, 0424 Oslo, Norway
*
Author to whom correspondence should be addressed.
Genes 2023, 14(2), 296; https://doi.org/10.3390/genes14020296
Submission received: 12 December 2022 / Revised: 18 January 2023 / Accepted: 19 January 2023 / Published: 23 January 2023
(This article belongs to the Section Molecular Genetics and Genomics)

Abstract

:
A limited number of studies are devoted to regulating TRIP6 expression in cancer. Hence, we aimed to unveil the regulation of TRIP6 expression in MCF-7 breast cancer cells (with high TRIP6 expression) and taxane-resistant MCF-7 sublines (manifesting even higher TRIP6 expression). We found that TRIP6 transcription is regulated primarily by the cyclic AMP response element (CRE) in hypomethylated proximal promoters in both taxane-sensitive and taxane-resistant MCF-7 cells. Furthermore, in taxane-resistant MCF-7 sublines, TRIP6 co-amplification with the neighboring ABCB1 gene, as witnessed by fluorescence in situ hybridization (FISH), led to TRIP6 overexpression. Ultimately, we found high TRIP6 mRNA levels in progesterone receptor-positive breast cancer and samples resected from premenopausal women.

1. Introduction

Thyroid hormone receptor interactor 6 (TRIP6, 7q22.1) gene encodes for highly conserved 50 kDa protein (476 amino acid residues). TRIP6 is structurally organized into an N-terminal proline-rich domain, Crm-1-dependent nuclear export signal (NES), and three tandemly arrayed LIM domains (lin-11, Isl-1, and mec-3) followed by PDZ-binding motif TTDC (PSD95, Dlg1, ZO-1) at its C terminus [1,2]. TRIP6 belongs to small zyxin family (zyxin, ajuba, lipoma-preferred partner 1, LIM domain-containing protein 1, Wilms tumor 1-interacting protein, filamin-binding LIM protein 1) due to the presence of LIM domains [3].
Due to various modules, TRIP6 interacts with a plethora of partners extensively summarized elsewhere [4]. TRIP6 resides in the cell cytoplasm, where it accumulates at focal adhesions [5] and adherent junctions [6,7,8], the sites associated with the actin cytoskeleton. Additionally, TRIP6 has been described to shuttle between the cell nucleus and cytoplasm [2]. The N-terminally truncated isoform of TRIP6 (nTRIP6) entirely localizes in the cell nucleus, where it promotes transcription of myogenesis regulatory genes [9,10,11]. Recently, Shukla et al. demonstrated that half of the TRIP6 knock-out mice developed hydrocephalus as a result of impaired ciliogenesis in ependymal brain cells [12]. In conclusion, TRIP6 participates in multiple cellular processes, cell motility [6,13,14,15], signaling [15,16], regulation of transcription [5,9], and telomere protection [17]. Thus, TRIP6 represents an attractive molecule in cancer research.
Several lines of evidence underpin high TRIP6 expression in MCF-7 cells. The Human Protein Atlas displays TRIP6 mRNA as the most expressed in MCF-7 cells “https://www.proteinatlas.org/ENSG00000087077-TRIP6/cell+line (accessed on 19 January 2023)” [18]. Analysis of publicly available single cell transcriptomic data “https://bcatlas.tigem.it/tigem/dibernardo/AIRC_atlas_32_ccls/?ds=Atlas_32_ccls&gene=TRIP6 (accessed on 19 January 2023)” showed ubiquitous TRIP6 expression in 32 evaluated breast cancer cell lines [19]. Nevertheless, BT549, MCF-7 and HCC70 cells expressed more TRIP6 mRNA than any other breast cancer cells in the study. In line with this finding, Zhao et al. reported high TRIP6 expression in several breast cancer cell lines [20]. Furthermore, we revealed TRIP6 overexpression in paclitaxel-resistant MCF-7/PacR subline [21], yet the molecular mechanism(s) that drive TRIP6 expression in MCF-7 cells as well in paclitaxel-resistant cells have not been described in detail.
To date, a few studies have investigated the regulation of TRIP6 expression by microRNA (miRNA), in particular, miR-138-5p [22], miR-485-3p [23] in neural stem cells, and miR-7 in colorectal cancer [24]. Recently, Gou et al. demonstrated that tocopherol α transfer protein-like TTPAL protects TRIP6 from ubiquitin-mediated degradation in colorectal cancer [25].
Breast cancer is the most diagnosed cancer worldwide [25]. It exhibits a heterogeneous nature concerning histological, genetic, and clinical behavior, thus emphasizing the need for patient-tailored therapy [26]. Cost-effective but less accurate immunohistochemical and in situ hybridization methods allow systematic categorization of breast cancer into estrogen receptor-positive (ER+) luminal, HER2-positive, and triple-negative subtypes, reflecting the type of adjuvant therapy in the clinics [27]. Although molecular assays (Mammaprint®, Oncotype DX®) predict the outcome of patients with ER+ disease, they are not widespread in hospitals due to the high costs, especially in less developed countries [27], and also add limited information to existing clinical tests [28].
Notably, modern omics studies have allowed a more detailed look at breast cancer categorization and highlighted a few novel targets for its therapy [29,30]. Despite these advances, we lack data concerning the regulation of individual gene expression in the context of known drivers such as PIK3CA and TP53 and more data are needed considering other less recognized or unknown drivers.
Here, we exploited parental taxane-sensitive MCF-7 cells and two taxane-resistant sublines, MCF-7/PacR (named as “PacR” subline) and MCF-7/SB-T-0035R (named as “0035R” sublines), to elucidate mechanisms regulating TRIP6 expression in breast cancer. We discovered cis-acting regulatory motifs in TRIP6 proximal promoter and clarified its function by dual-luciferase reporter assay. Consequently, we revealed stable hypomethylation in TRIP6 proximal promoter in tested MCF-7 cells. We found a few TRIP6 loci localized in der(7)t(7;7)ins(7;15) and one TRIP6 locus in normal chromosome 7 in MCF-7 cell line. Co-amplified TRIP6/ABCB1 region formed homogeneously stained region inserted in chromosome 3 (PacR subline) and chromosome 19 (0035R subline). Analysis of TRIP6 expression in 95 breast cancer samples revealed associations of the TRIP6 mRNA expression level with progesterone receptor positivity and premenopausal status.

2. Materials and Methods

2.1. Materials

Unless otherwise specified, all chemicals and oligonucleotides were purchased from Merck KGaA (Darmstadt, Germany). Stony Brook Taxane SB-T-0035 was synthesized and kindly provided by Professor Iwao Ojima [31].

2.2. Cell Culture

Human breast cancer cell line MCF-7 (RRID: CVCL_0031) was purchased from ATCC. Paclitaxel-resistant MCF-7/PacR (RRID: CVCL_B7P7) (shortened “PacR” in this study) and Stony Brook taxane 0035-resistant MCF-7/SB-T-0035R (RRID: CVCL_C0CU) (shortened “0035R” in this study) sublines were established by multi-step selection on mass populations of MCF-7 cells [32,33,34]. MCF-7 cells were maintained in RPMI-1640 medium supplemented with 10% fetal bovine serum and streptomycin-penicillin mix. Taxane-resistant MCF-7 sublines were cultured in the same medium supplemented with 300 nM paclitaxel (PacR subline) or 300 nM SB-T-0035 (0035R subline). The cell stocks used in this study were independently authenticated (Figures S1–S3).

2.3. Collection and Processing of Breast Cancer Tissue Samples

Breast cancer tissue samples (N = 95) were collected and snap-frozen during primary surgery in The Faculty Hospital Motol and Institute for the Care for Mother and Child (Prague, Czech Republic) between 2003 and 2009. Sample processing was described in detail previously [35,36]. Samples from 82 patients were collected during the primary surgery before any chemotherapy or hormonal therapy (adjuvant group; ACT group). Samples from the second group of patients (N = 13) were collected during the primary surgery after neoadjuvant cytotoxic therapy with regimens containing taxanes or taxanes in combination with 5-fluorouracil and/or anthracycline, and cyclophosphamide (NACT group), a standard regimen in the period of sample collection. Noteworthy, the current guidelines do not support the addition of 5-fluorouracil to the anthracycline (Doxorubicin/Epirubicin)-cyclophosphamide regimen.
A response to NACT was evaluated pre- and post-therapy by ultrasonography. Histological classification of carcinomas was performed according to standard diagnostic procedures [37]. The expression of estrogen and progesterone receptors was assessed immunohistochemically (IHC) with the 1% cut-off value for classification of tumors as hormone receptor positive. ERBB2 status was defined as positive in samples with IHC score 2+ or 3+ confirmed by fluorescence in situ hybridization or silver in situ hybridization. The cut-off between high and low expression of proliferative marker Ki-67 was 13.25% [38]. Samples were subtyped according to hormone receptor and ERBB2 expression as triple-negative (TNBC) subtype, ERBB2 subtype and luminal subtype [39]. Disease-free survival (DFS) was defined as the time elapsed between surgery and disease recurrence.

2.4. Isolation of Nucleic Acids and Proteins

Cultured cells were harvested by trypsin-EDTA solution and washed. Breast cancer tissue samples were grounded to powder by mortar and pestle under liquid nitrogen. Nucleic acids and protein were isolated using Allprep DNA/RNA/protein Kit (Qiagen, Hilden, Germany) following the manufacturer’s instructions. Nucleic acids were quantified using Quanti-iTTM PicoGreenTM dsDNA Assay Kit (InvitrogenTM, Carlsbad, CA, USA) and Quant-iT RiboGreen RNA Assay Kit (Invitrogen) in Infinite M200 microplate reader (Tecan Group Ltd., Männendorf, Switzerland). RNA integrity was checked by Agilent 2100 Bioanalyzer and Agilent RNA 6000 Nano Assay Kit (Agilent Technologies, Santa Clara, Inc., CA, USA).

2.5. Quantitative Reverse Transcription PCR (qRT-PCR)

The real-time PCR study design adhered to the Minimum Information for Publication of Quantitative Real-Time PCR Experiments guidelines [40]. The synthesis of complementary DNA (cDNA) is described in Table S1. The used TaqMan® Gene Expression probes and PCR conditions are specified in Tables S2 and S3. IPO8 and MRPL19 were used as reference genes in patient cohorts based on their stability, as previously published [35]. To achieve the best reaction efficiency (>90%), we optimized the cycling conditions of each assay using a calibration curve as described previously [41,42]. For cell lines, the threshold cycle (Ct) of the gene of interest (GOI) was normalized to the reference gene (REF) by the following formula Δ C t = C t R E F C t G O I   . To compare gene expression between MCF-7 cells and taxane-resistant MCF-7 sublines, we calculated the ΔΔCt value by the following formula Δ Δ C t = Δ C t R E S Δ C t M C F 7 . Otherwise, to compare gene expression, fold change was calculated using the 2 −ΔΔCt method [43].

2.6. Assessment of Gene Copy Number

Genomic DNA (10 ng per reaction) was subjected to amplification as triplicate in ABI-PRISM 7500 Fast Real-time PCR System (Thermo Fisher Scientific, Waltham, MA, USA) with Predesigned TaqMan® Copy Number Assays (TRIP6 FAM-MGB, Cat. No. Hs02120646_cn; ABCB1 FAM-MGB, Cat. No. Hs04962504_cn) and Reference Assays (TERT VIC-TAMRA, Cat. No. 4403316; RPPH1 VIC-TAMRA, Cat. No. 4403326). The threshold cycle (Ct) value of a gene of interest (GOI) in a sample was normalized to the reference gene (REF) by the following formula Δ C t = C t R E F C t G O I   . For ABCB1 in the 0035R subline, data were not corrected by the TERT reference gene DNA level as the TERT copy number likely altered in these cells (Figure A1). To estimate gene copy number gain or loss in taxane-resistant sublines, we subtracted the normalized (ΔCt) values as follows this formula Δ Δ C t = Δ C t R E S Δ C t M C F 7   , where RES means taxane-resistant MCF-7 subline.

2.7. Western Blot Analysis

Western blot was performed as described elsewhere [44]. The primary antibodies that were used were anti-P-glycoprotein (ab3366, RRID: AB_303744), anti-actin (ab11003, RRID: AB_297660) from Abcam (Cambridge, UK), and anti-TRIP6 (HPA052813, RRID: AB_2681961) from Atlas Antibodies (Bromma, Sweden). SuperSignal™ West Pico PLUS Chemiluminescent Substrate or West Femto Maximum Sensitivity Substrate (Pierce, Rockford, IL, USA) were applied on a membrane to detect the chemiluminescence signal of secondary HRP-conjugated goat anti-mouse (SA00001-1, RRID: AB_272565) and HRP-conjugated goat anti-rabbit (SA00001-2, RRID: AB_272564) from Proteintech (Rosemont, IL, USA). Images were obtained using ChemiDoc MP imaging system (Biorad, Hercules, CA, USA).

2.8. Fluorescence In Situ Hybridization (FISH) Analysis

MCF-7 cells (60% confluency) were incubated with colchicine (0.2 µg/mL) and taxane-resistant MCF-7 sublines were incubated with colchicine and zosuquidar hydrochloride (100 nM) for 1 h. Harvested cells were resuspended in hypotonic buffer (100 mM KCl, 5 mM HEPES, 1 mM EGTA, pH 7.3) and fixed in methanol–glacial acetic acid (3:1). BAC probe mix ABCB1(spectrum green)/TRIP6(spectrum aqua) was purchased from Empire Genomics (Williamsville, NY, USA) (Figure S4). 24XCyte and XCyte 7 mBAND probes were purchased from MetaSystems (Altlussheim, Germany). All available metaphases were scanned using Metafer AxioImager Z2 – automatic mitoses finder and AxioImager Z1 fluorescence microscope (Carl Zeiss, Oberkochen, Germany) and further analyzed using Isis computer analysis system (MetaSystems). The findings are described according to ISCN2020 [45].

2.9. Cloning

pGL3-Promoter, pGL4.10[luc2], pGL4.24[luc2P/minP], and pNL1.1TK[Nluc/TK] vectors were purchased from Promega (Madison, WI, USA). 5′ flanking sequence of the TRIP6 was taken from Ensembl genome browser (Homo sapiens GRCh38.p12) for TRIP6-201 transcript (ENST00000200457.9). Sequence −936/+111 (where +1 means TRIP6 transcription start) was amplified from MCF-7/PacR genomic DNA by PCR and cloned into pGL3-Promoter vector via KpnI and NcoI sites. The inserted sequence was subcloned by PCR into pGL4.10[luc2] and pGL4.24 vectors (Figure S5). Mutagenesis of the CRE motif was achieved by cleavage with AatII-HF enzyme followed by 3′ overhangs removal (Large Klenow Fragment, NEB). The construction of plasmids, primers and PCR conditions are summarized in Figure S5 and Tables S4–S8. The constructs have been verified by restriction endonuclease cleavage and insert sequencing (LightRun, SupremeRun, Eurofins Genomics, Ebersberg, Germany).

2.10. Dual-Luciferase Reporter Assay

Cells (2.0 × 10⁵) were seeded into wells of NuncTM F96 MicroWellTM plate (Cat. No. 236105, Thermo Fisher Scientific) in paclitaxel-free medium. After 24 h, enabling cells to attach to a surface, the cells were co-transfected with 100 ng of DNA per well at a 100:1 ratio (reporter to co-reporter) using jetPRIME® transfection reagent (Polyplus-Transfection, Illkirch, France) following the manufacturer’s instructions. After 4 h, the transfection mix was replaced by a fresh paclitaxel-free cell culture medium. After 48 h post-transfection, samples were assayed by Nano-Glo® Dual-Luciferase Assay System I (Promega). Plates were read after 10 min of incubation in M200 Pro Plate Reader (Tecan Group Ltd.).

2.11. DNA Methylation Profiling

Bisulfite conversion of 500 ng DNA was performed with a EZ DNA MethylationTM Kit (Zymo Research, Irvine, CA, USA), according to the manufacturer’s protocol. The genome-wide DNA methylation was assessed by the Infinium Human MethylationEPIC BeadChip platform (Illumina, San Diego, CA, USA) following the manufacturer’s instructions. The microarray was scanned by the Illumina iScan system. The obtained data were further processed using the R language [46]. Quality control and data normalization were carried out in the minfi package as described previously [47,48]. Raw data were converted into β values for further analysis [49,50]. Probes mapped to single nucleotide polymorphism were removed from the analysis [51]. Differentially methylated probes were defined with |Δβ| > 0.2 (20% difference). The β value is defined as the ratio between methylated versus unmethylated alleles.

2.12. Bisulfite Sequencing

Extracted DNA (1 µg) was bisulfite converted using the Epitect Bisulfite Kit (Qiagen) following the manufacturer’s instructions. Then, 100 ng of converted DNA was subjected to 42 cycles of amplification (95 °C for 5 min, 95 °C for 30 s, 57 °C for 30 s, 68 °C for 60 s) with Epimark® Hot Start Taq DNA polymerase (NEB), pair of primers (forward: 5′-AGAAATGGTAGTTTAGGGTTTAGGGGGTTA-3′; reverse: 5′-AACCTCTAACCTTCACCCCCTCTTC-3′) in a 50 µL reaction. PCR product was cloned into pGEM® T-Easy vector (Promega). Transformed DH5α Max Efficiency Competent Cells (Thermo Fisher Scientific) were selected on X-Gal/ampicillin plates. Sequencing data were analyzed in Quma online tool [52]. The clones with more than 93% cytosines converted outside CpG were analyzed.

2.13. Statistical Analysis

Graphs and statistical analysis were generated in Graph Pad Prism 9.2.0 (GraphPad Software, San Diego, CA, USA) regarding the recommendations described by others [53]. The SPSS v16.0 program (SPSS Inc, Chicago, IL, USA) was used for whole gene CpG methylation data and associations with breast cancer clinic pathological data. The normality of data was tested by the Shapiro–Wilk test prior to statistical analysis. Associations of transcripts with clinical data were assessed by the non-parametric Mann–Whitney, Kruskal–Wallis, and Spearman rank test. All p-values were obtained by two-sided tests. A p-value of <0.05 was considered statistically significant.
Variances were compared by F-test prior to unpaired t-test analysis. The distribution of residuals was checked by residual plot, homoscedasticity plot, and QQ plot. Individual statistical analysis is specified in each figure or table legend.

3. Results

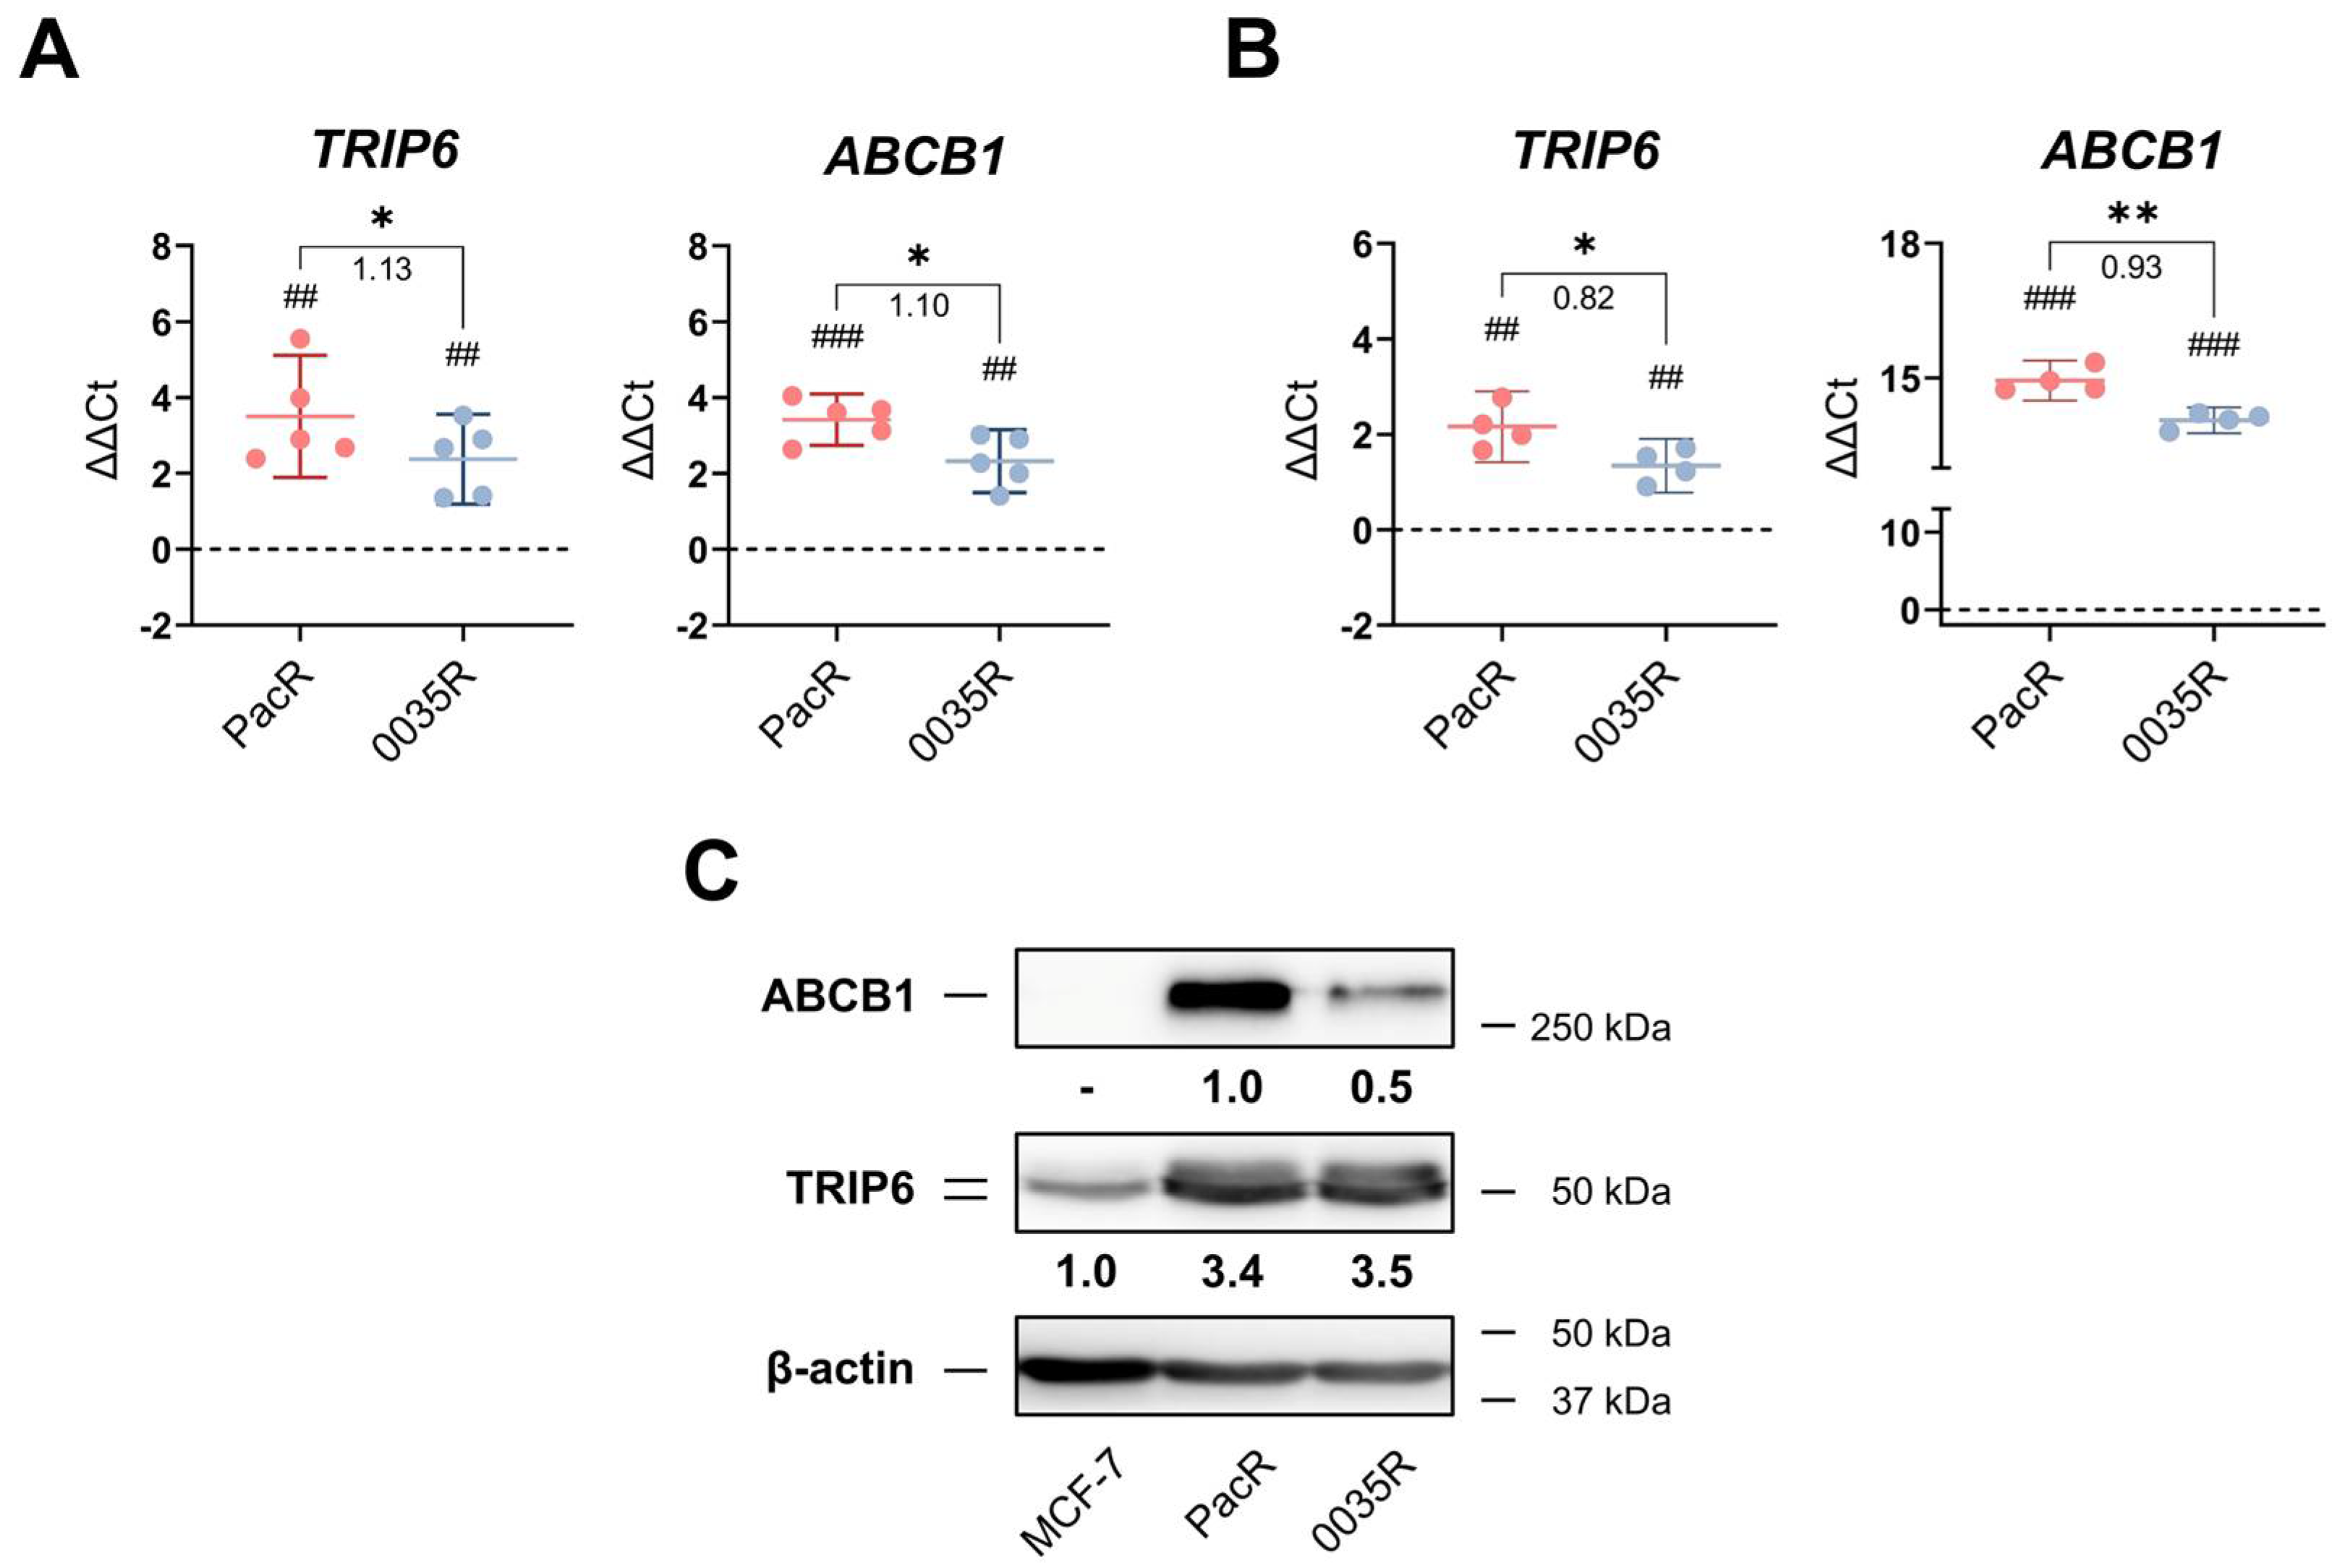
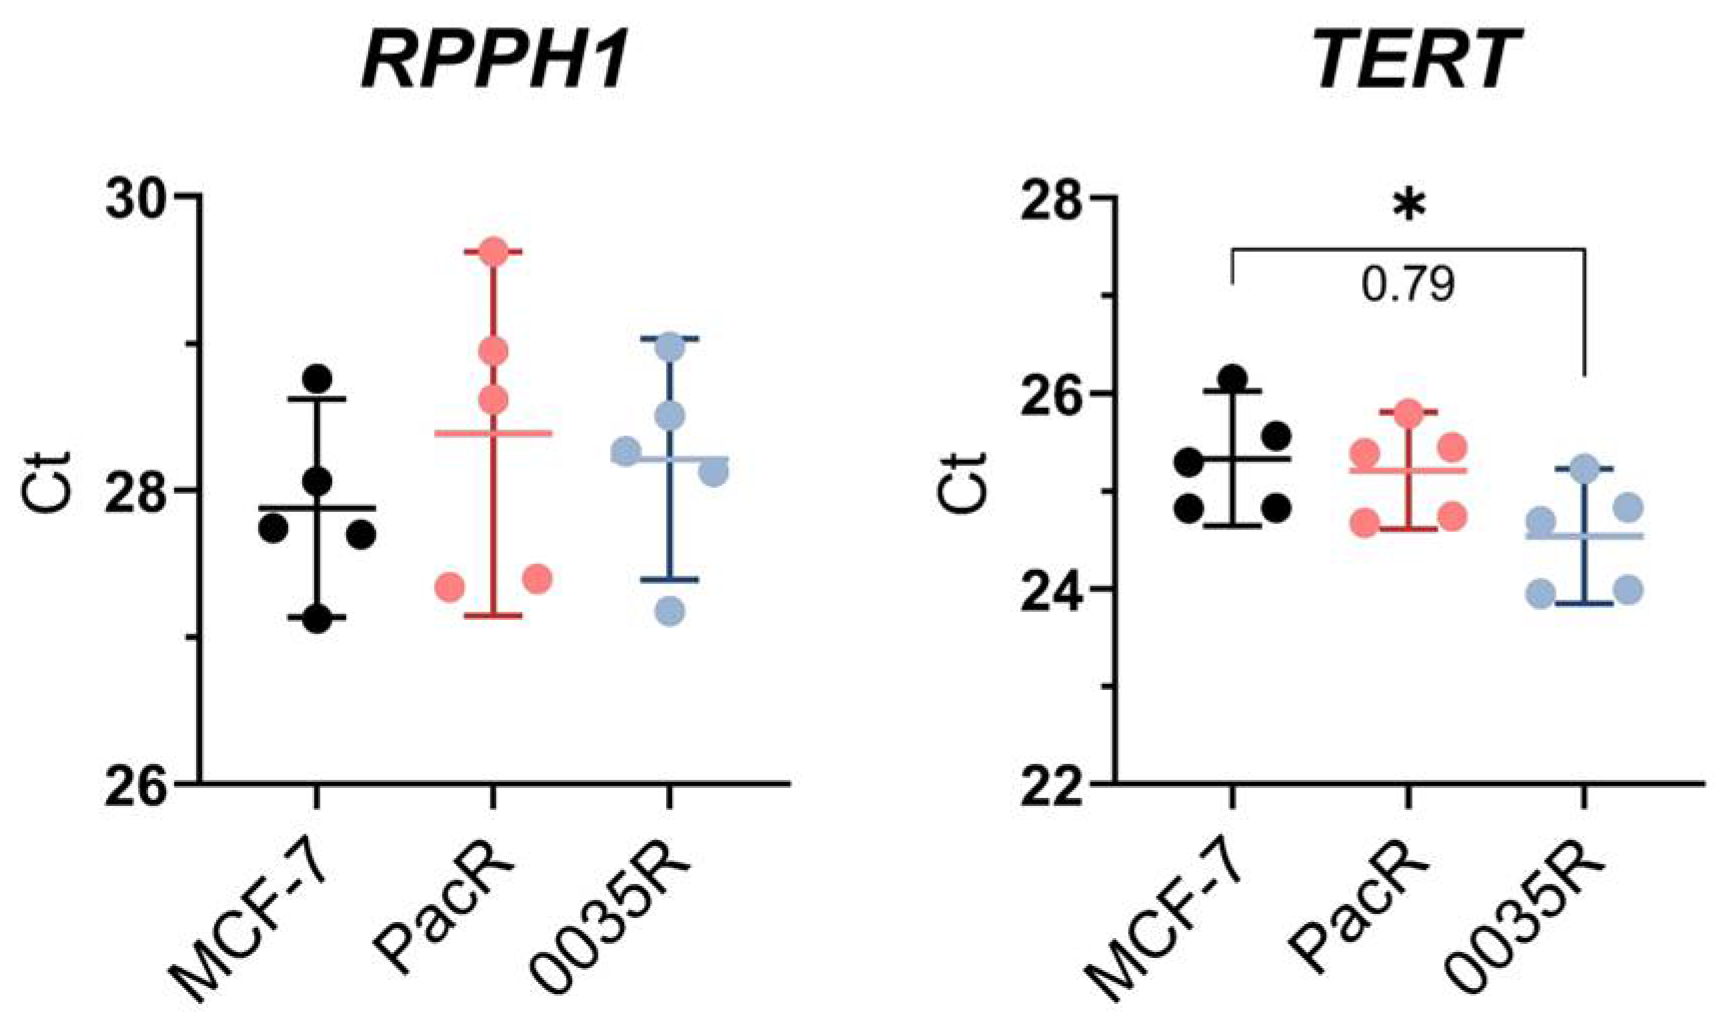
3.1. TRIP6 as Well as ABCB1 Are Overexpressed in Taxane-Resistant MCF-7 Sublines

Recently, we established Stony Brook 0035-resistant MCF-7 subline (0035R subline) from the same parental MCF-7 cells as paclitaxel-resistant MCF-7 subline (PacR) [34]. SB-T-0035 is a paclitaxel derivative in that a dimethyl carbamoyl group replaces the methyl group at the C10 position of the baccatin core (Figure 1).
We were interested in whether the TRIP6 gene (7q22.1, 100.8Mb) is overexpressed in 0035R subline similarly to the already described PacR subline [21], and we wanted to identify what mechanisms underpin TRIP6 overexpression in taxane-resistant MCF-7 sublines. Regarding de novo expression of the adjacent ABCB1 gene (7q21.12, 87.5Mb), we hypothesized that co-amplification could drive enhanced levels of TRIP6 and ABCB1 in PacR cells [33,34].
We compared TRIP6 and ABCB1 copy number (Figure 2A), mRNA level (Figure 2B), and protein level (Figure 2C) between MCF-7 cells and taxane-resistant MCF-7 sublines. Due to both the target (TRIP6, ABCB1) and reference (RPPH1, TERT) gene copy numbers being unknown in all assayed cell samples, we roughly estimated copy number gain or loss from ΔΔCt values obtained by duplex real-time TaqMan® PCR (Figure 2A, Figure A1). The ABCB1 and TRIP6 gene copy number increased in 0035R cells (ΔΔCtABCB1 = 2.32, ΔΔCtTRIP6 = 2.38) although less than in PacR cells (ΔΔCtABCB1 = 3.42, ΔΔCtTRIP6 = 3.50). The level of TRIP6 mRNA increased in 0035R cells (ΔΔCtTRIP6 = 1.35) although less than in PacR cells (ΔΔCtTRIP6 = 2.16) compared to MCF-7 cells. The level of TRIP6 protein increased approximately by 3.5-fold in both taxane-resistant MCF-7 sublines compared to MCF-7 cells (Figure 2B).
Furthermore, we also found markedly elevated levels of ABCB1 mRNA and protein in 0035R cells, although it was two-fold lower compared to PacR cells (Figure 2B,C).
Collectively, TRIP6 copy number, mRNA level, and protein level increased in line with ABCB1 copy number, mRNA, and protein level, suggesting that co-amplification is accountable for their increased expression.

3.2. A Few TRIP6 Loci Pre-Exists in MCF-7 Cell Line

Variation in TRIP6 copy number might underlie high TRIP6 mRNA and protein expression even in parental MCF-7 cells. In addition, the massive distribution and subcultivation of MCF-7 cells during the last 50 years resulted in enormous MCF-7 cell line heterogeneity [54]. Thus, we first determined the karyotype of MCF-7 cells used in this study.
The composite karyotype of MCF-7 cells assembled from 20 mitoses (of 52 analyzed) counted 67 to 69 chromosomes (Table 1). Chromosomes X, 6, 7, 9, 14, and 21 were disomic. All chromosomes possessed numerical and structural aberrations. Derivative chromosomes were formed predominantly by unbalanced translocations (Figure 3A, Table 1), while reciprocal translocations between t(3;6) and t(4;5) occurred. Chromosome 7 p- and q-arm segments translocated to chromosomes X, 2, 7, 10, and 22 (Figure 3B, Figure A2). Subsequent multicolor banding (mBAND) analysis revealed rearrangements in der(7)t(7;7)ins(7;15) (Figure 3B). We detected a few ABCB1 (7q21.12) and TRIP6 (7q22.1) loci on both arms of der(7)t(7;7)ins(7;15). Interestingly, the other copy of chromosome 7 was intact and carried ABCB1 and TRIP6 loci in situ (Figure 3C).

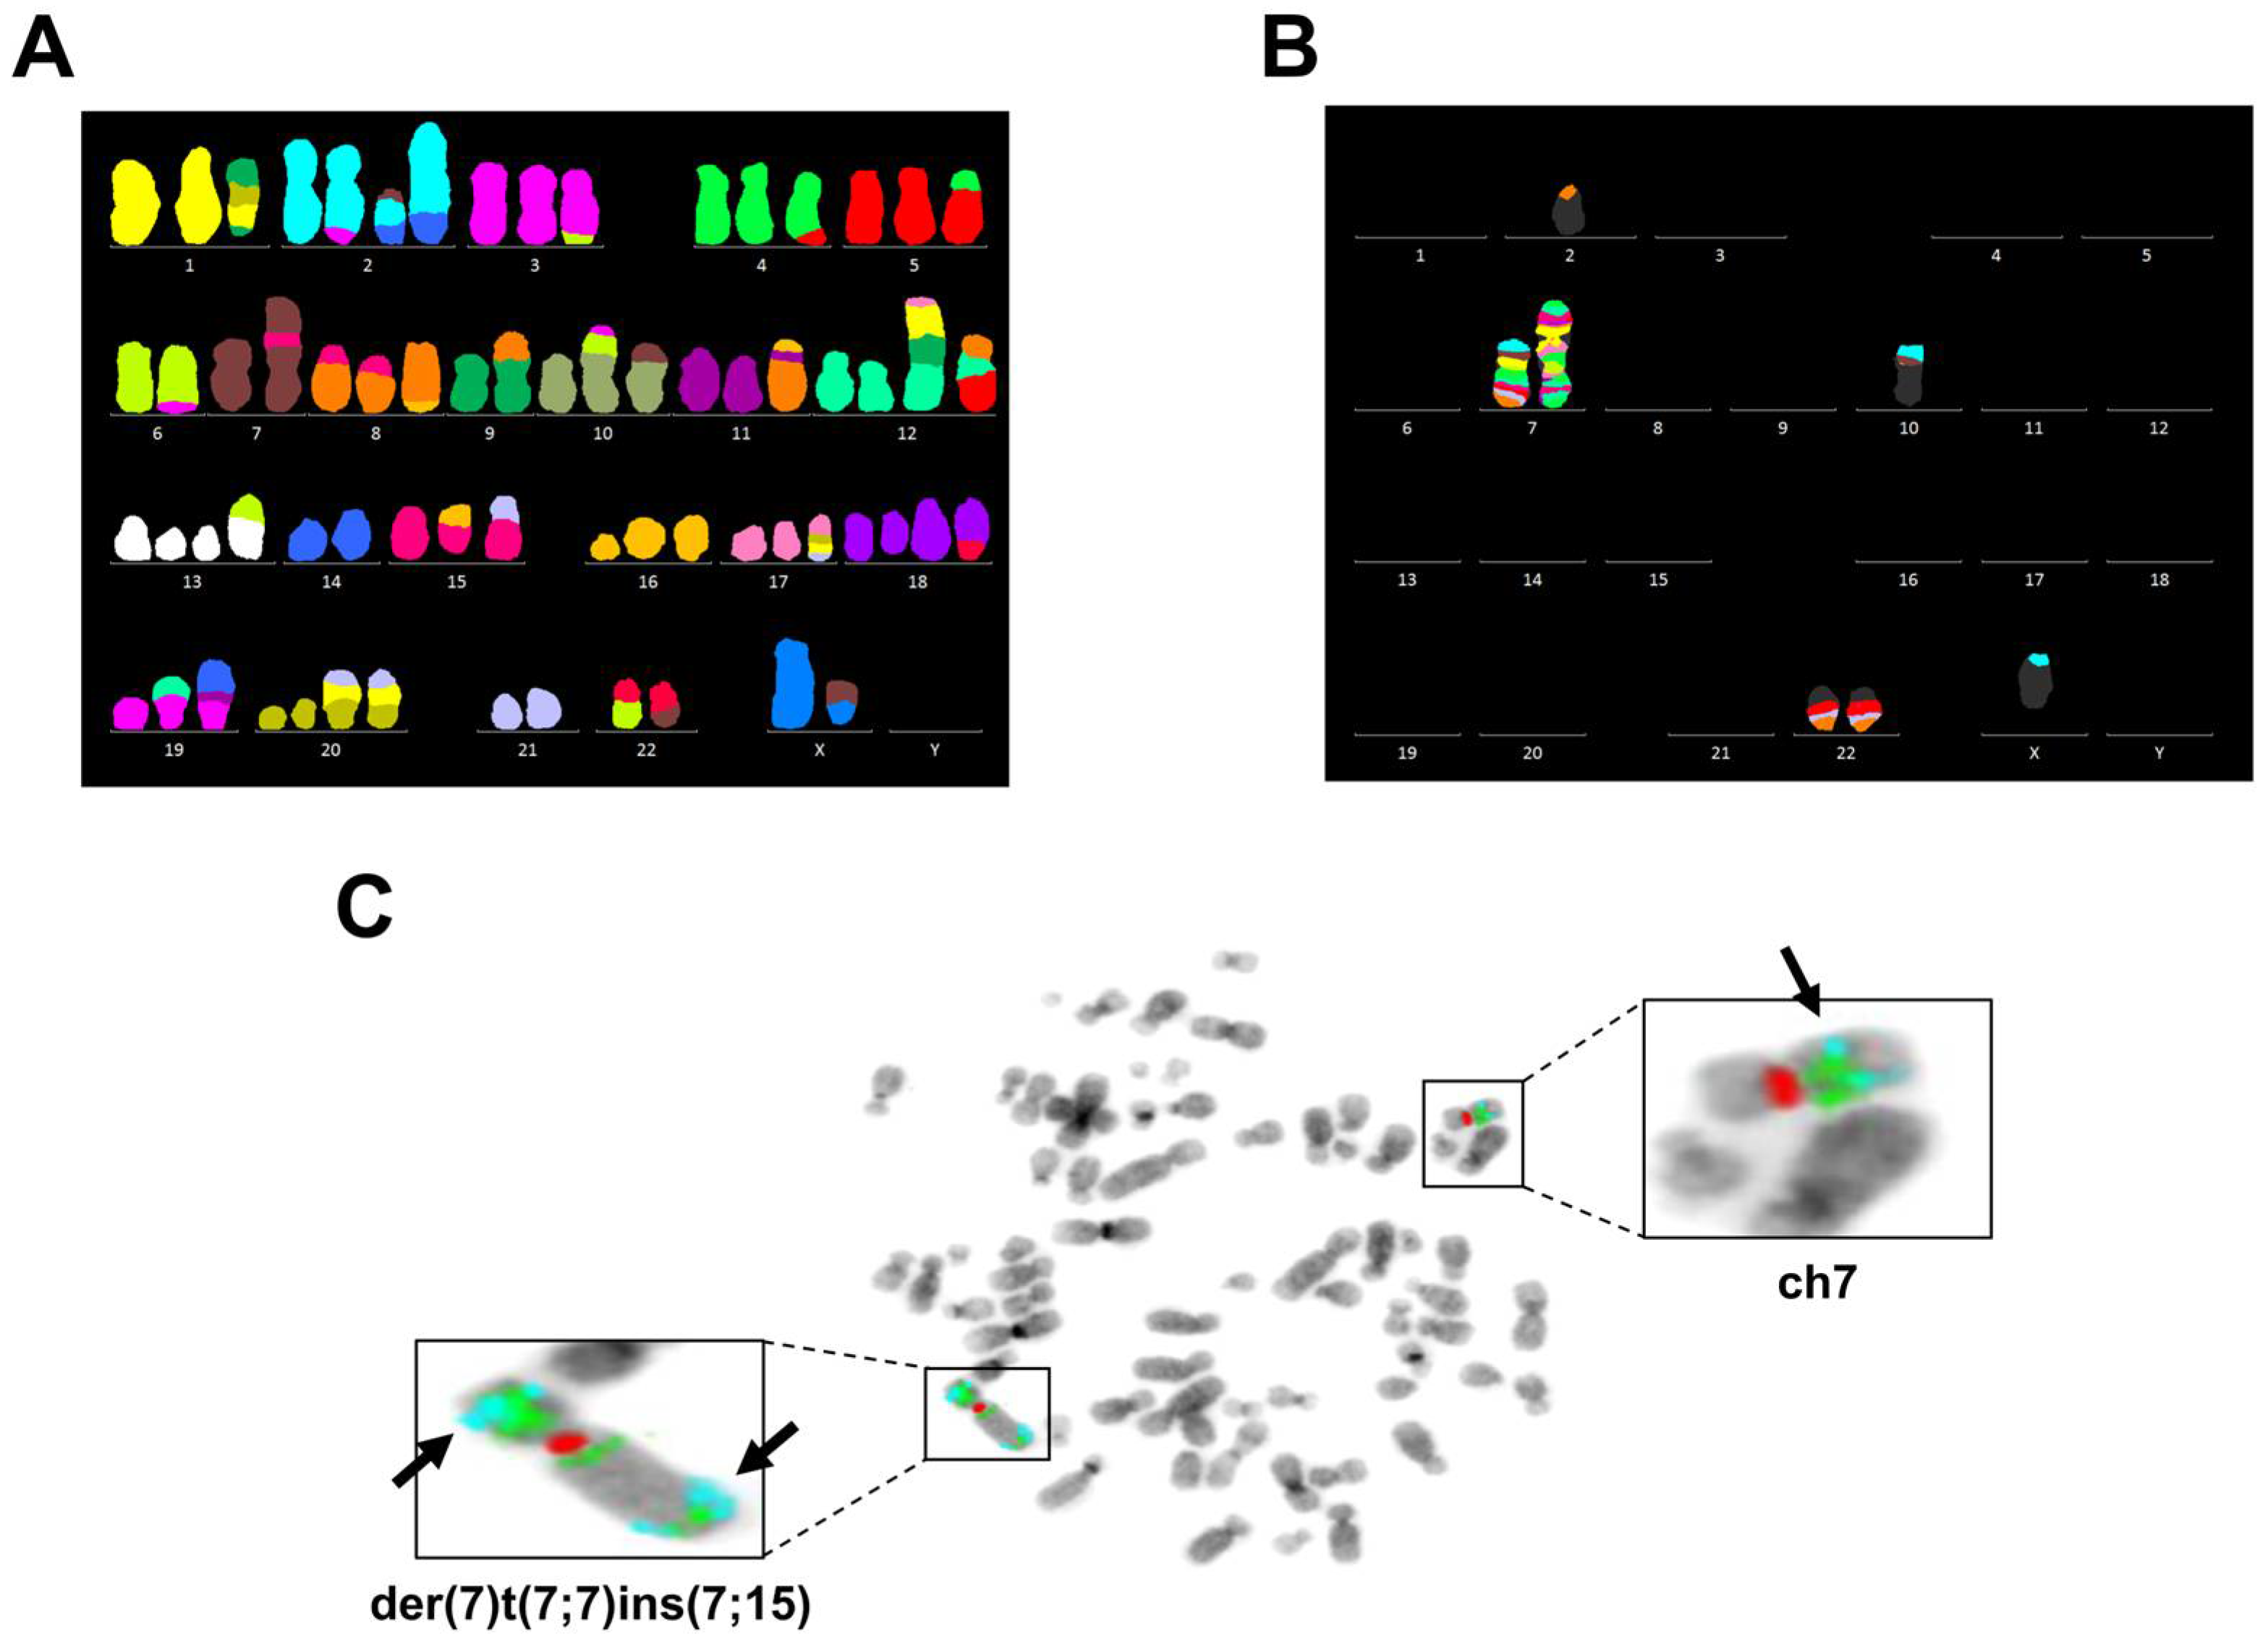
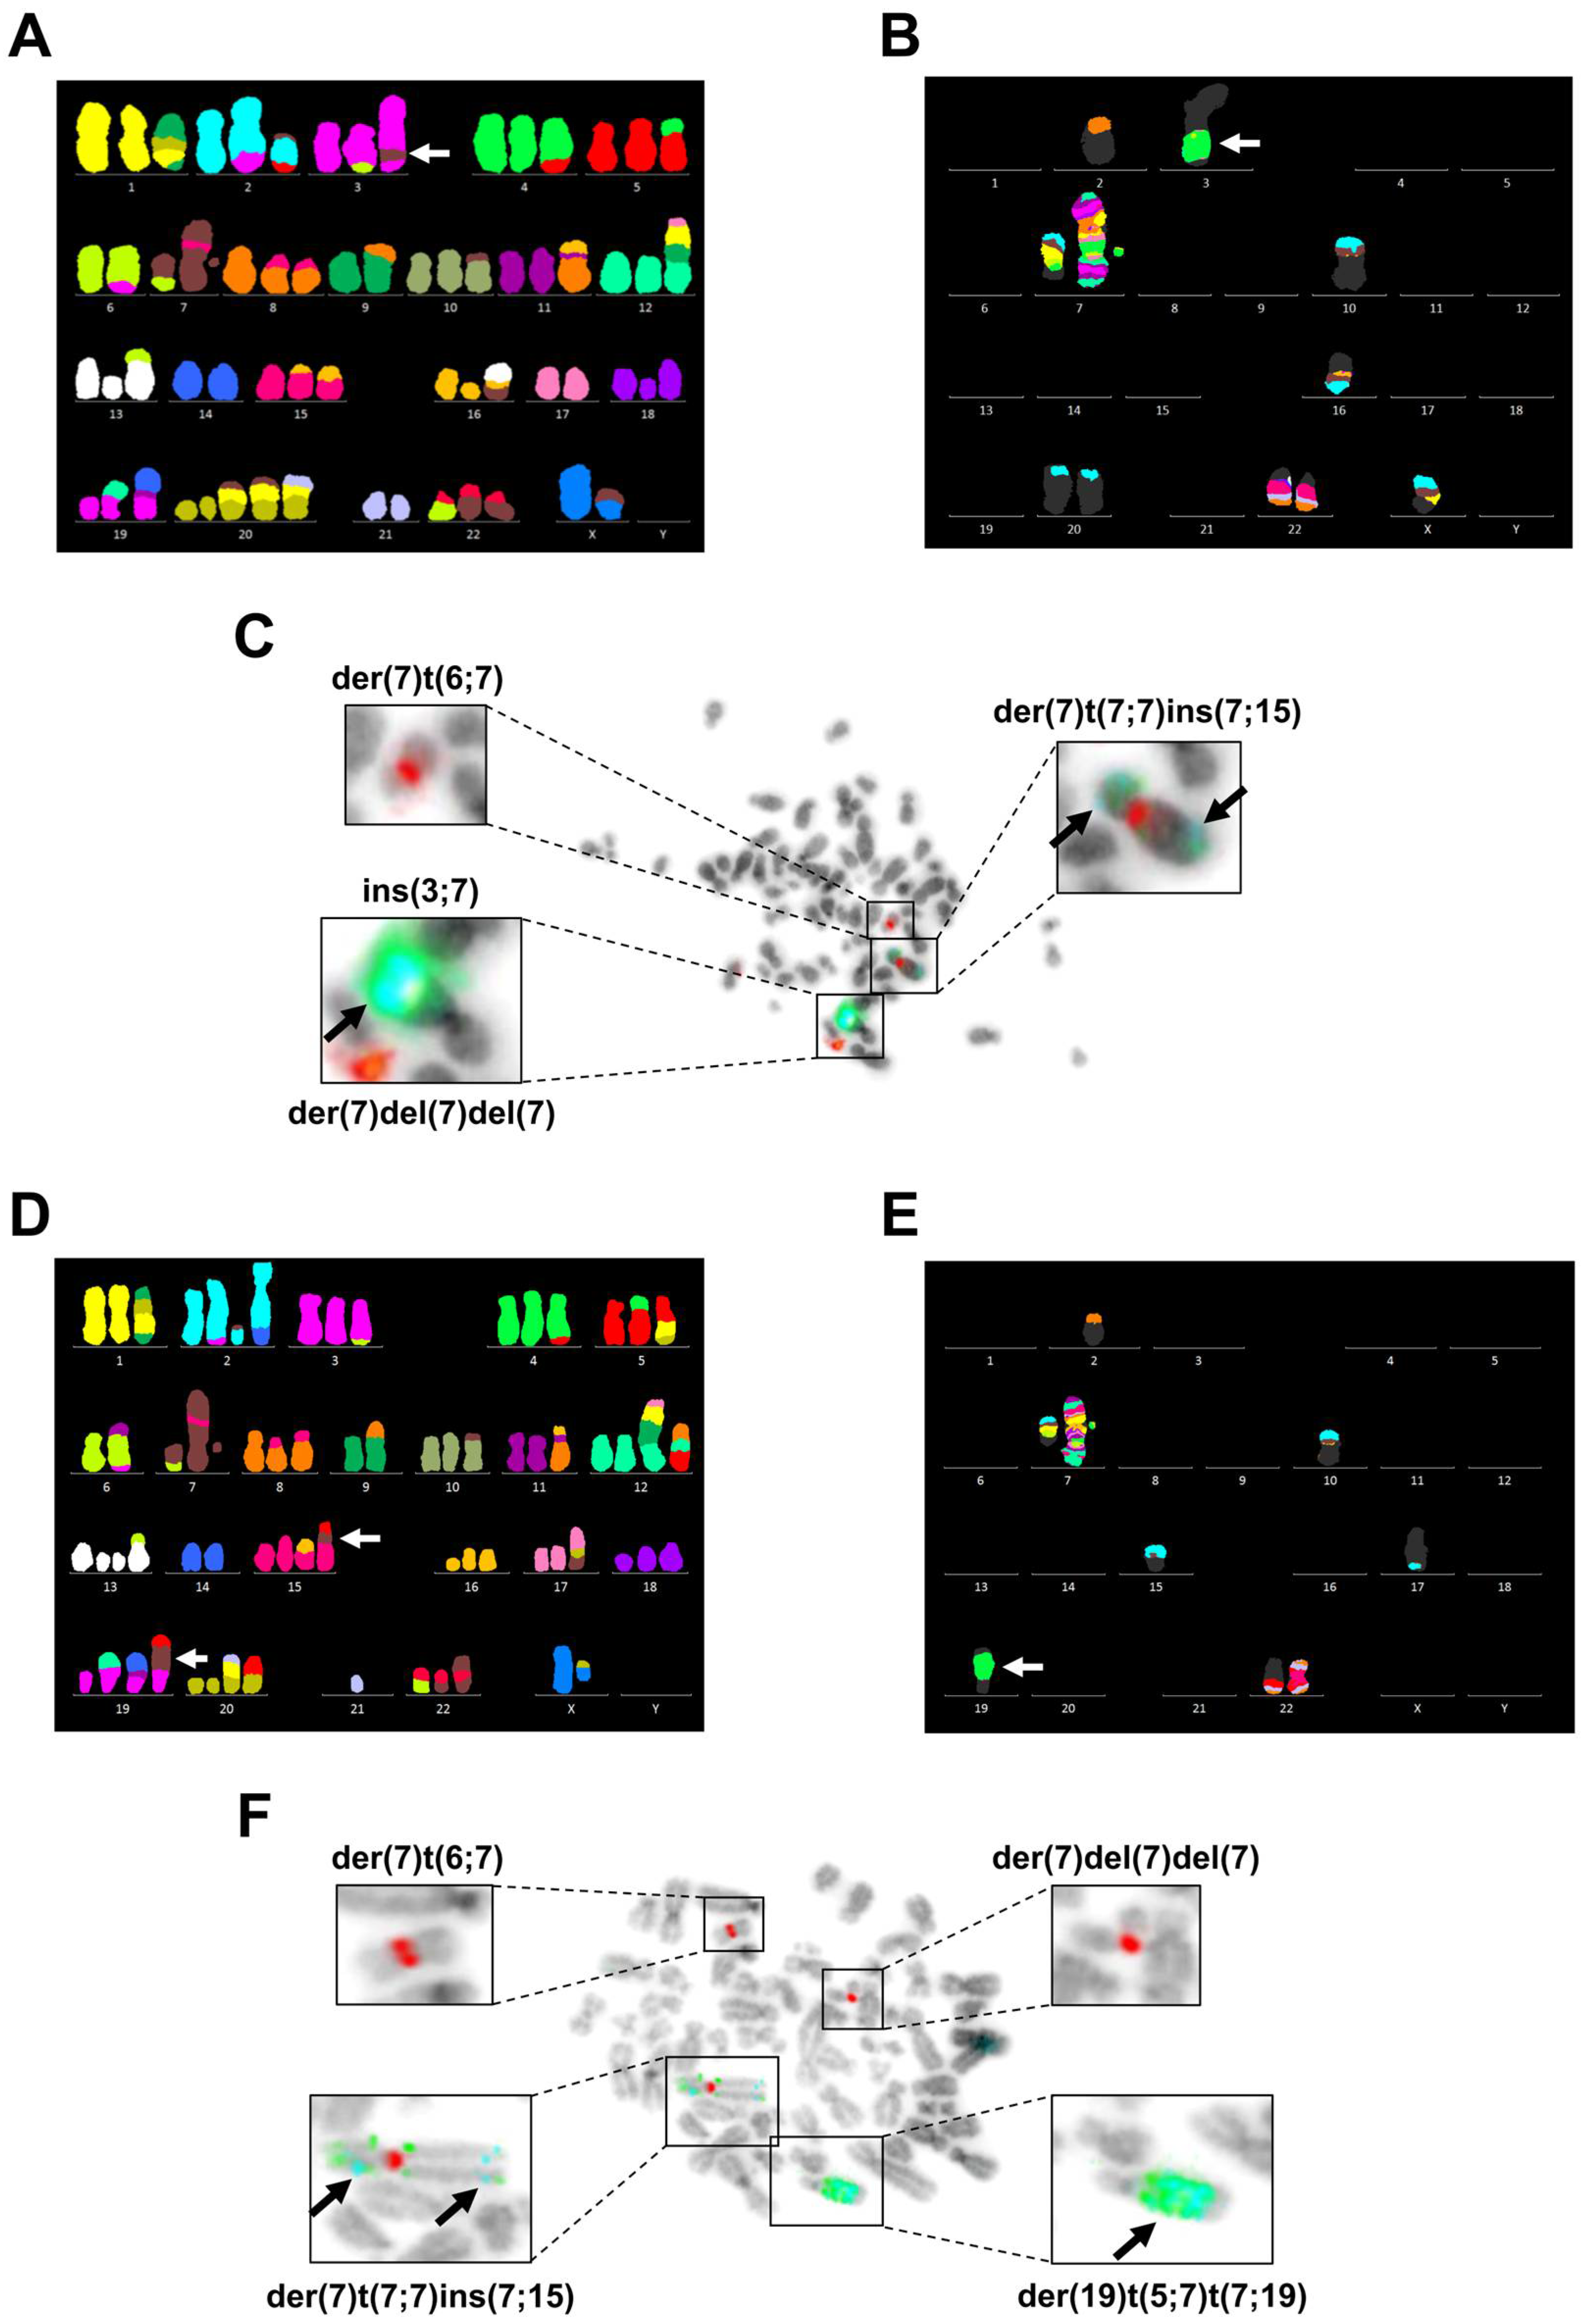
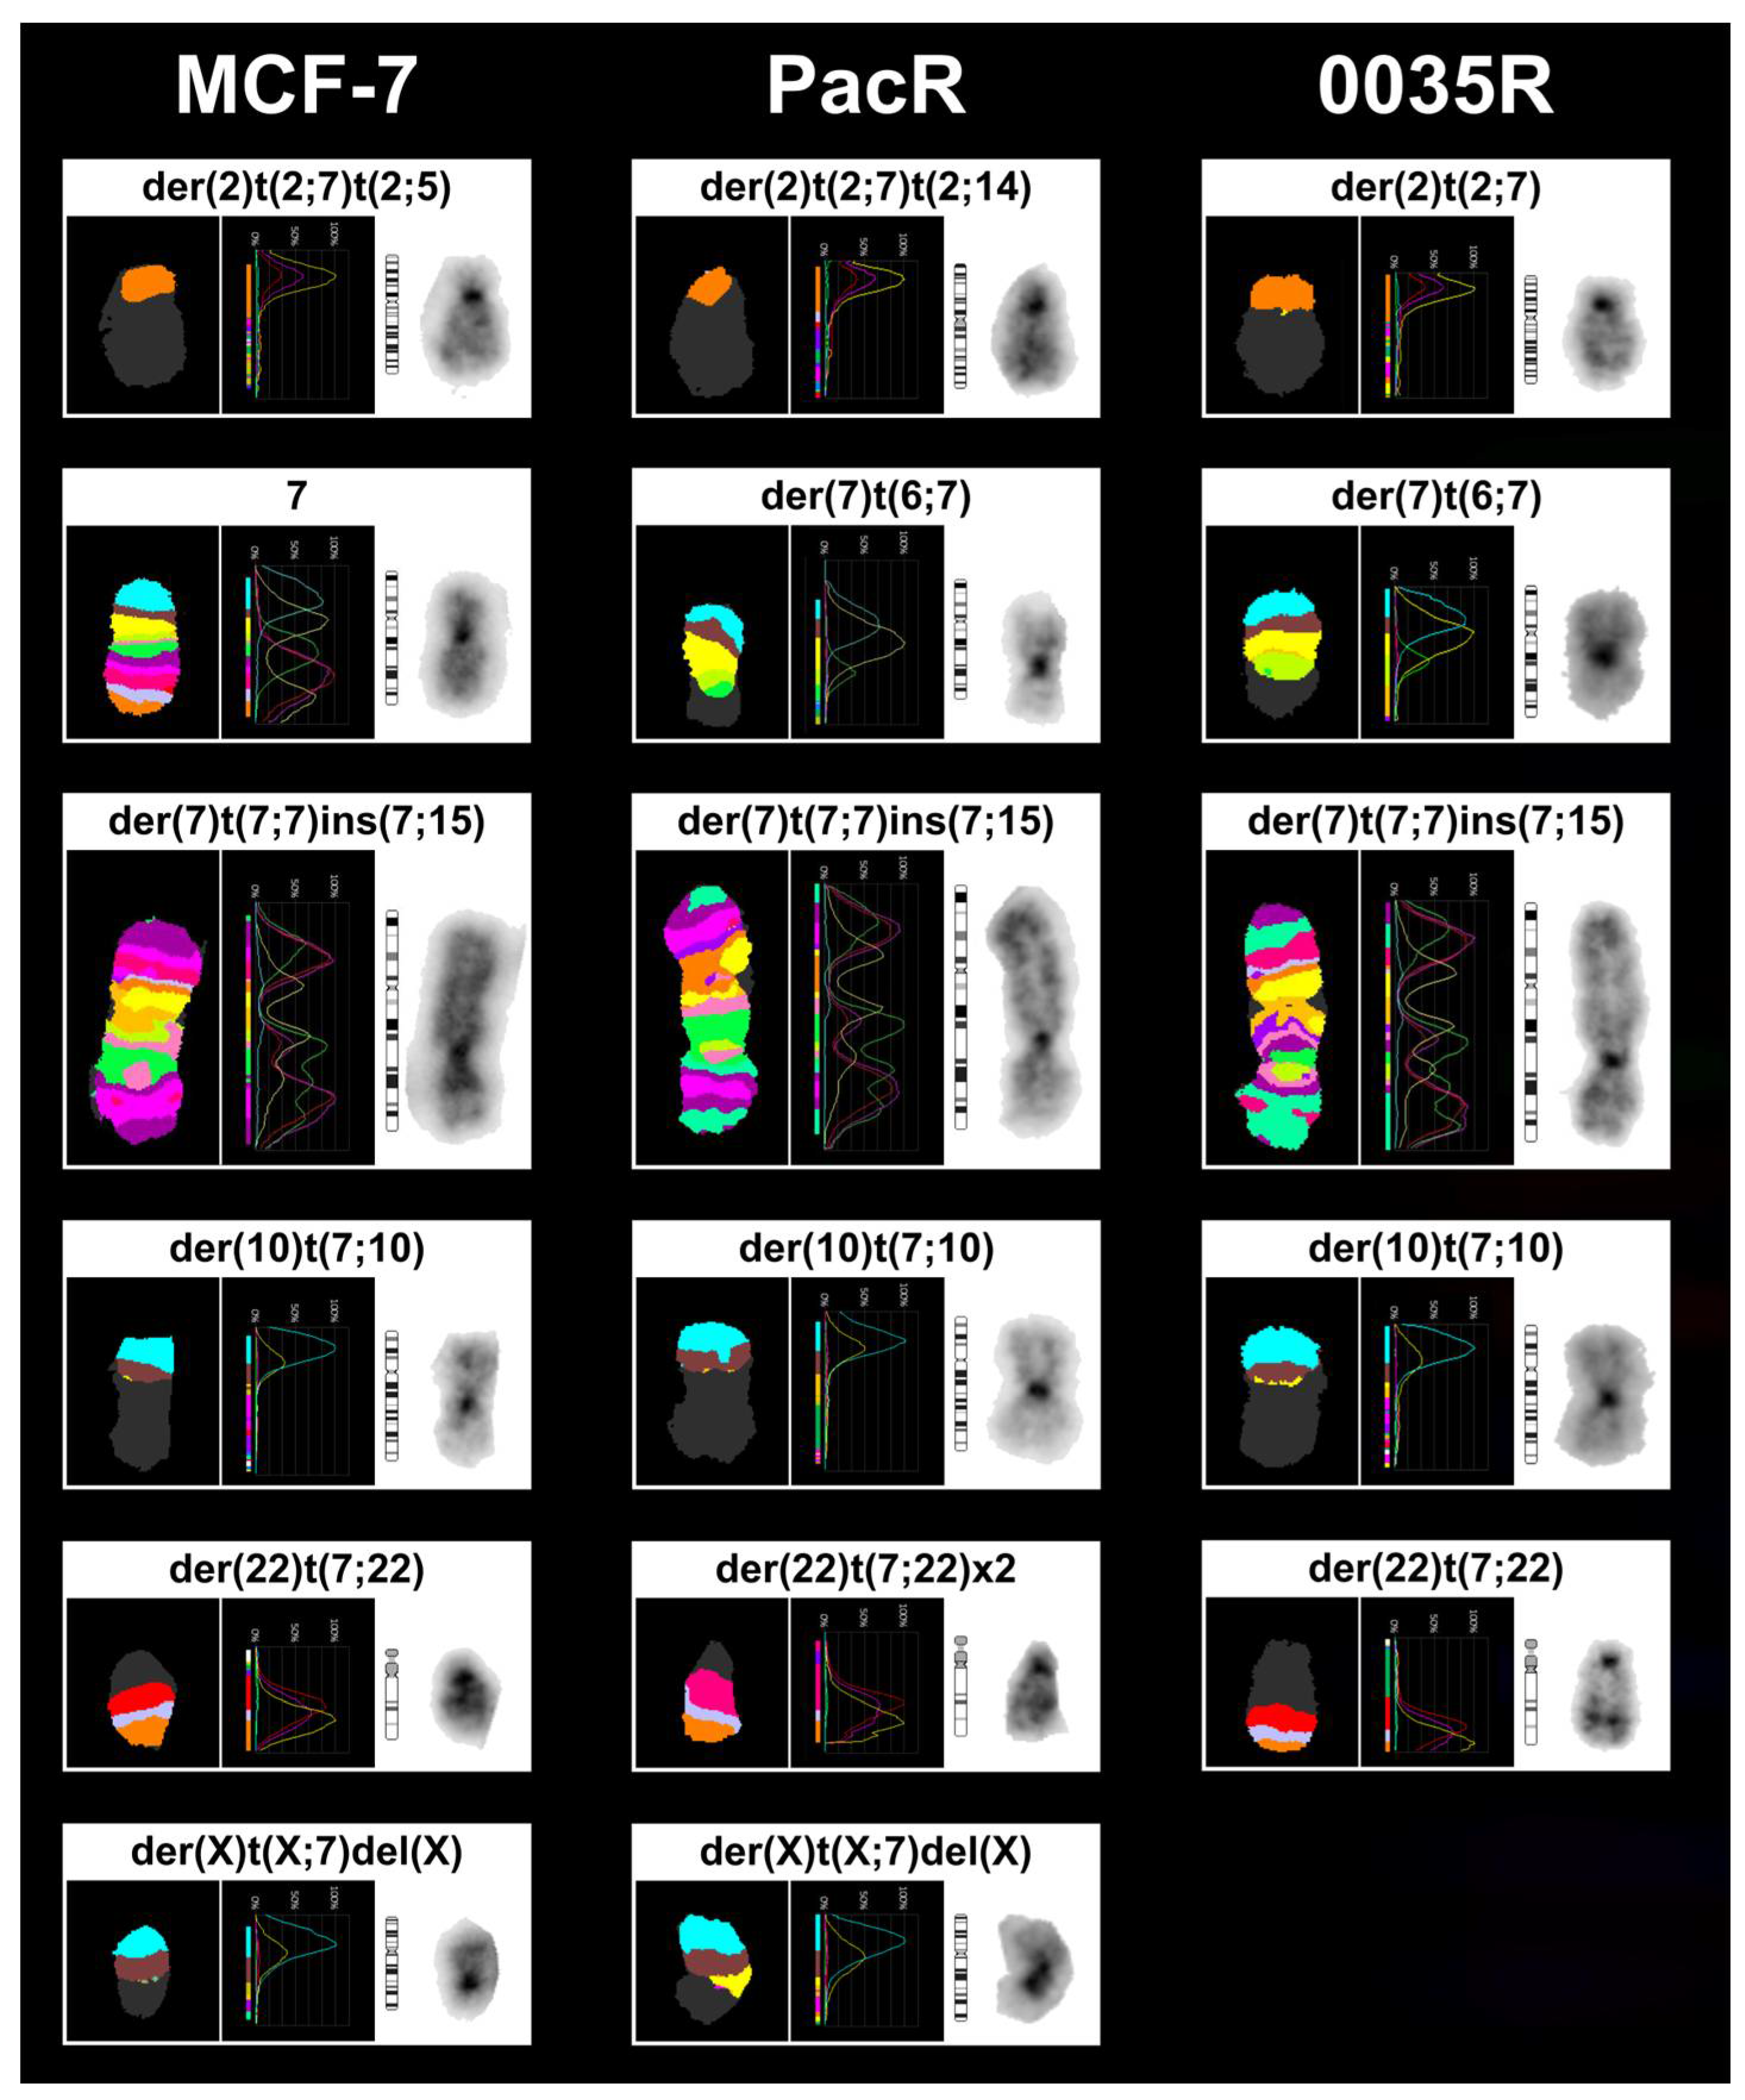
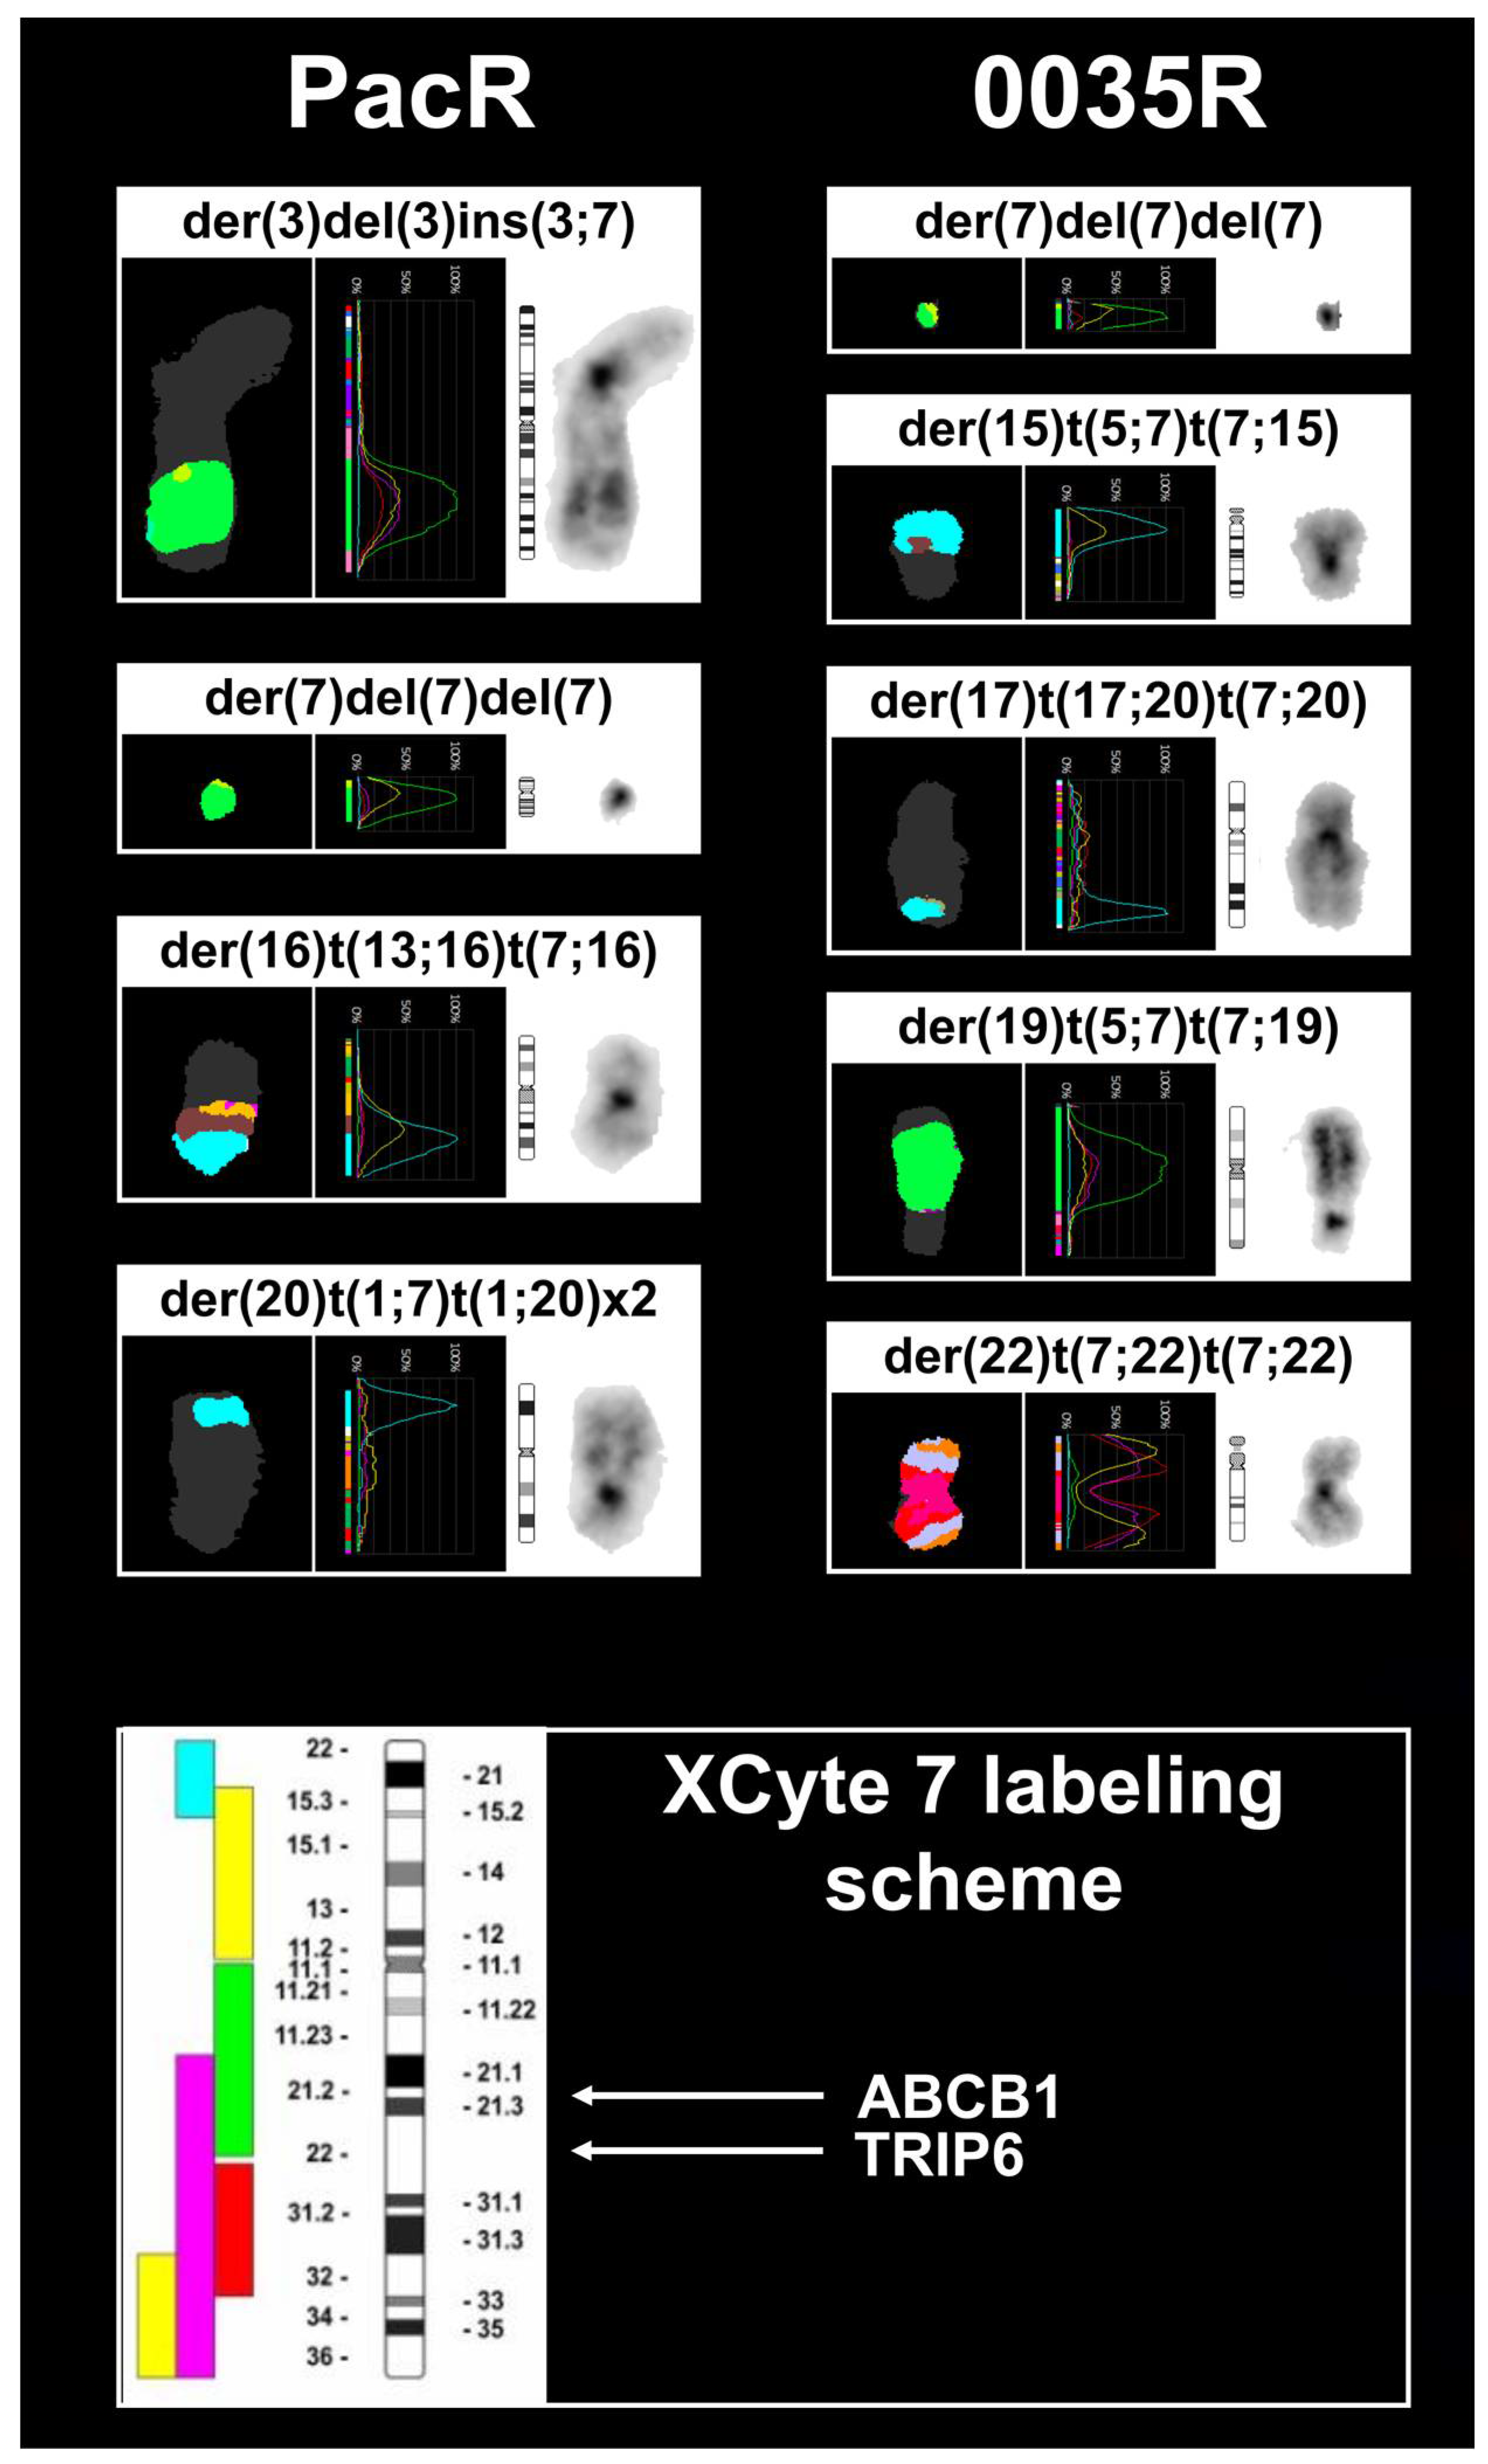
3.3. Chromosome 7 Is Rearranged in Taxane-Resistant MCF-7 Sublines

To validate amplification of the region encompassing TRIP6 and ABCB1, we carried out similar FISH analyses in taxane-resistant MCF-7 sublines.
We karyotyped 8 mitoses (of 34 analyzed) of PacR cells, and 12 mitoses (of 36 analyzed) of 0035R cells (Figure 4, Table 2). The modal chromosome number of taxane-resistant MCF-7 sublines slightly varies from parental MCF-7 cells. Nevertheless, most derivative chromosomes have been preserved (Figure 4, Figure A2). Notably, a breakage at 7q11.2 in the intact chromosome 7 resulted in novel der(7)t(6;7) and der(7)del(7)(p12)del(7)(q11.1) in taxane-resistant MCF-7 sublines (Figure 4, Figure A3). We detected TRIP6 co-amplification with ABCB1 (Figure 4C,F) as a homogeneously stained region (HSR) translocated to chromosome 3 (PacR subline) or chromosome 19 (0035R subline). In a few mitoses of 0035R cells, we unambiguously detected HSR in chromosome 15 (Figure 4D), indicating that 0035R subline might consist of two subclones.

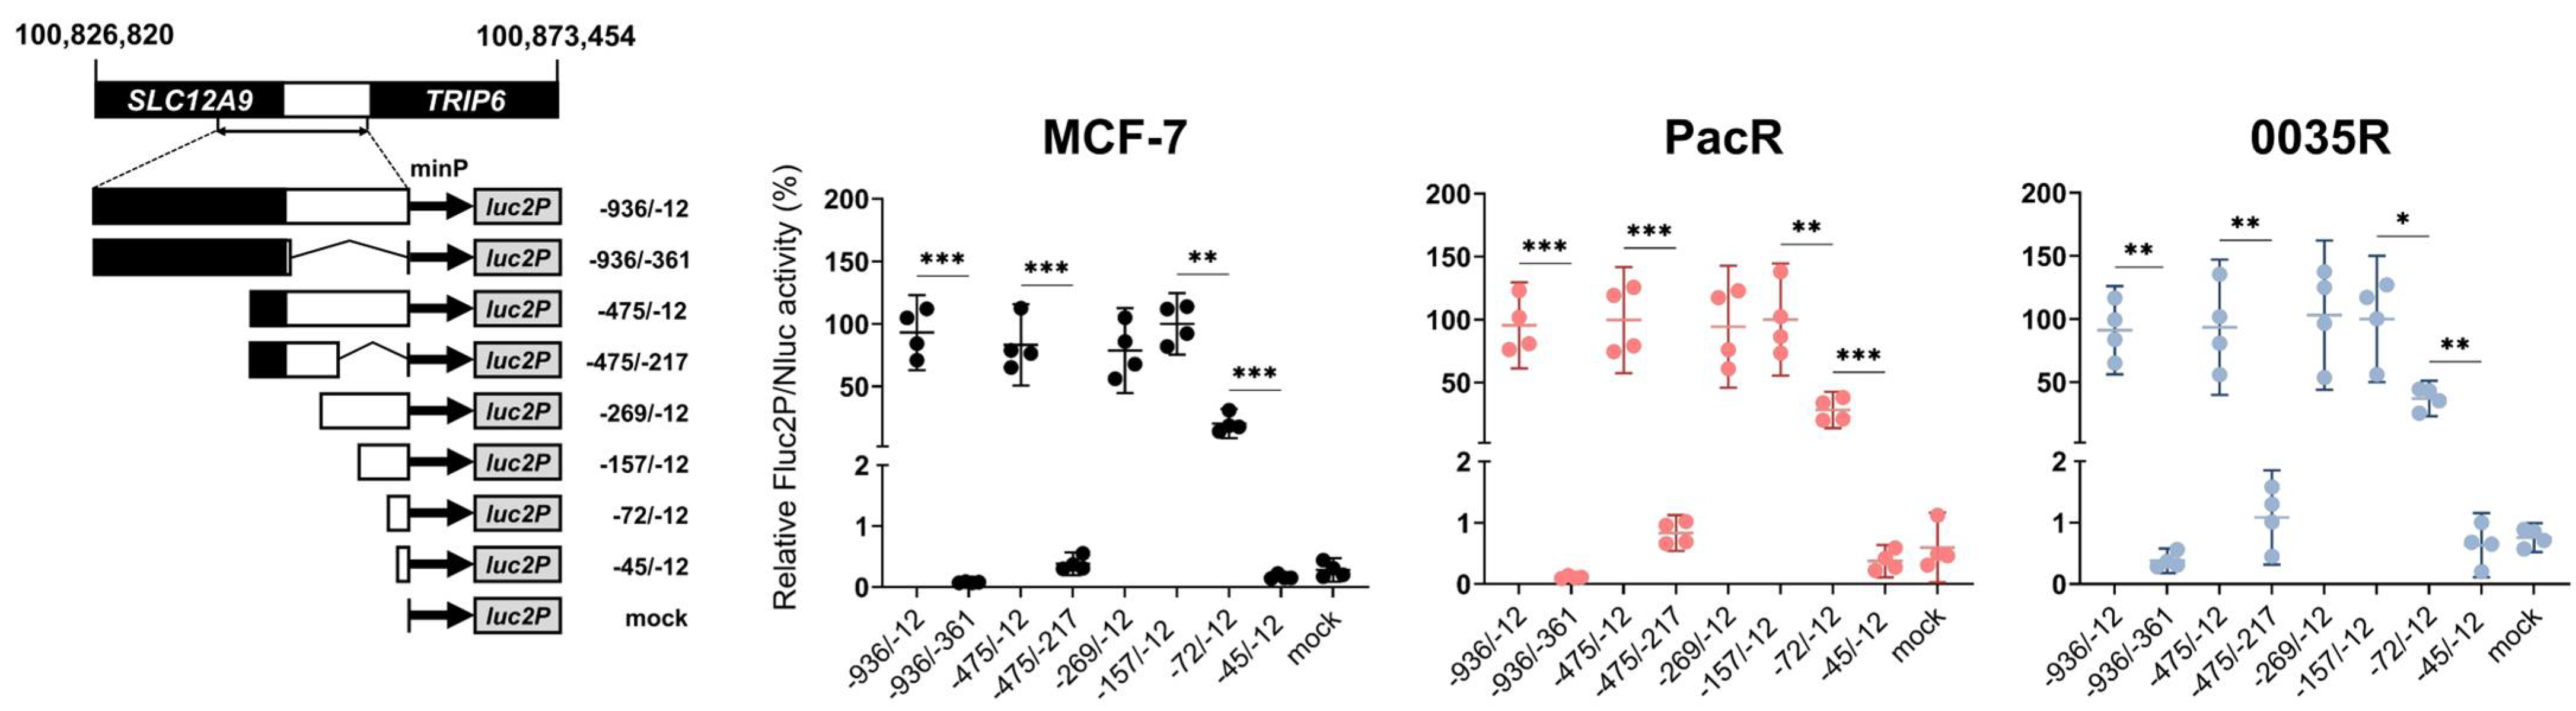
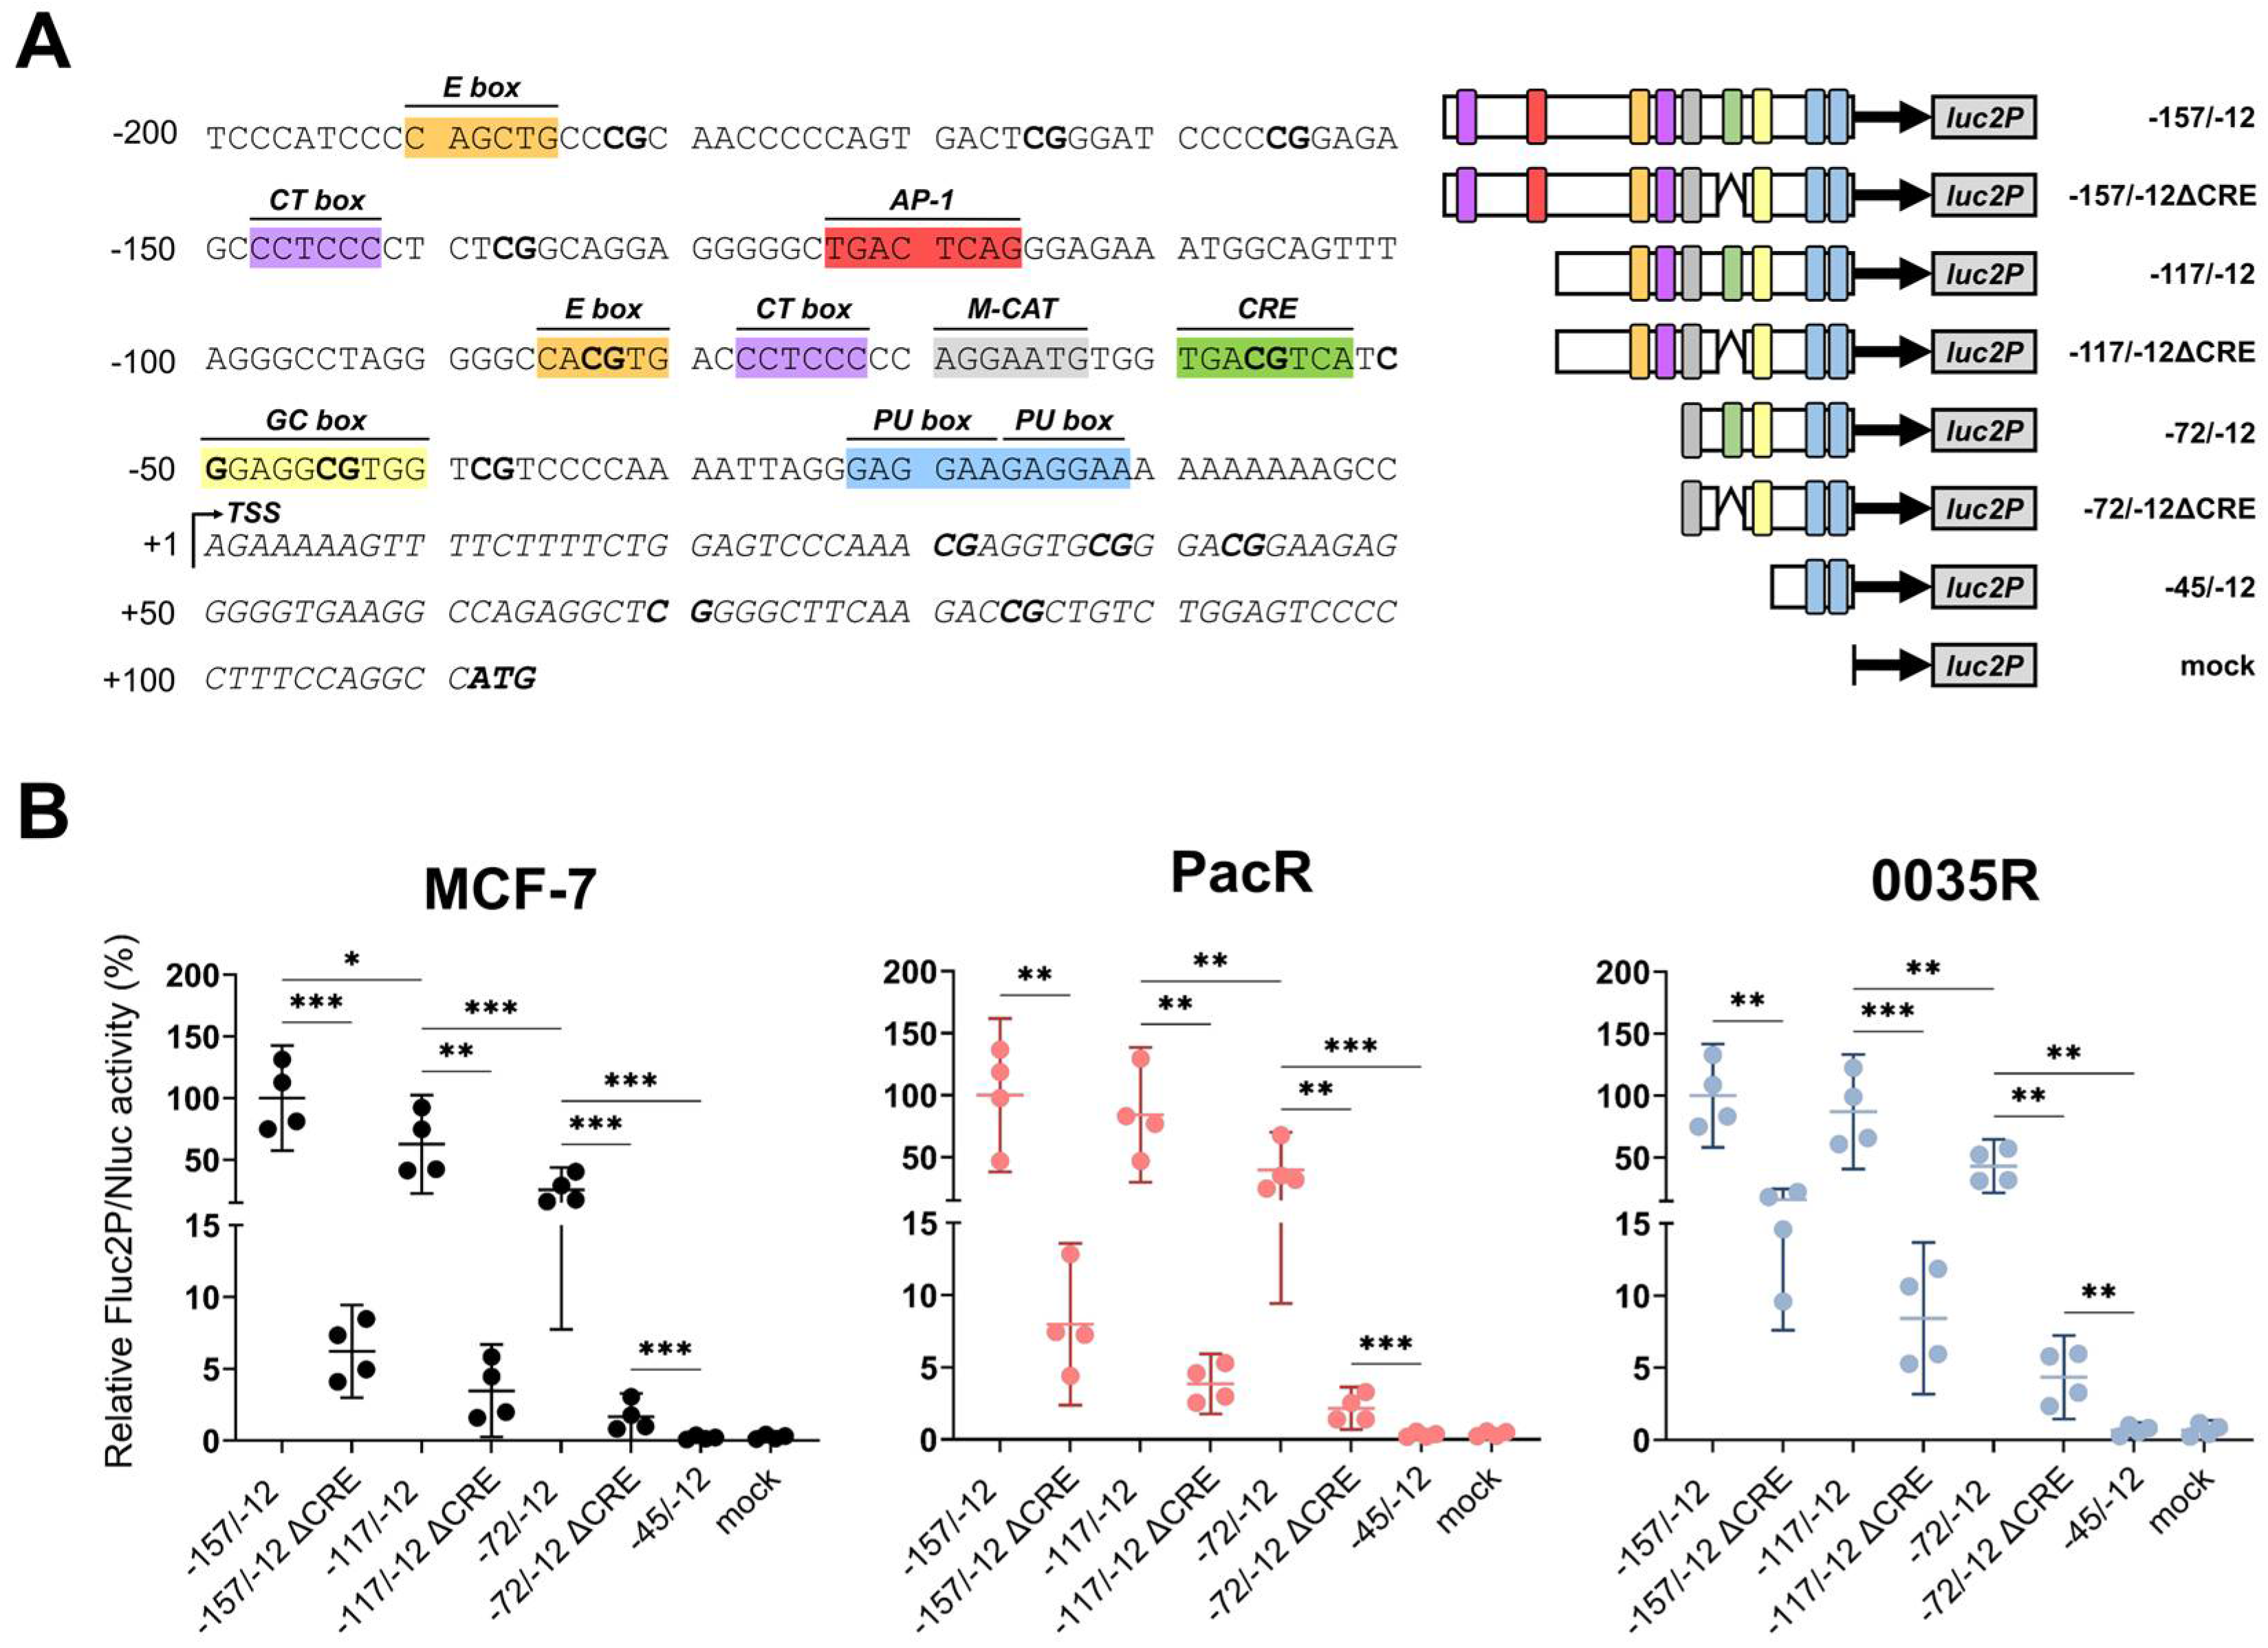
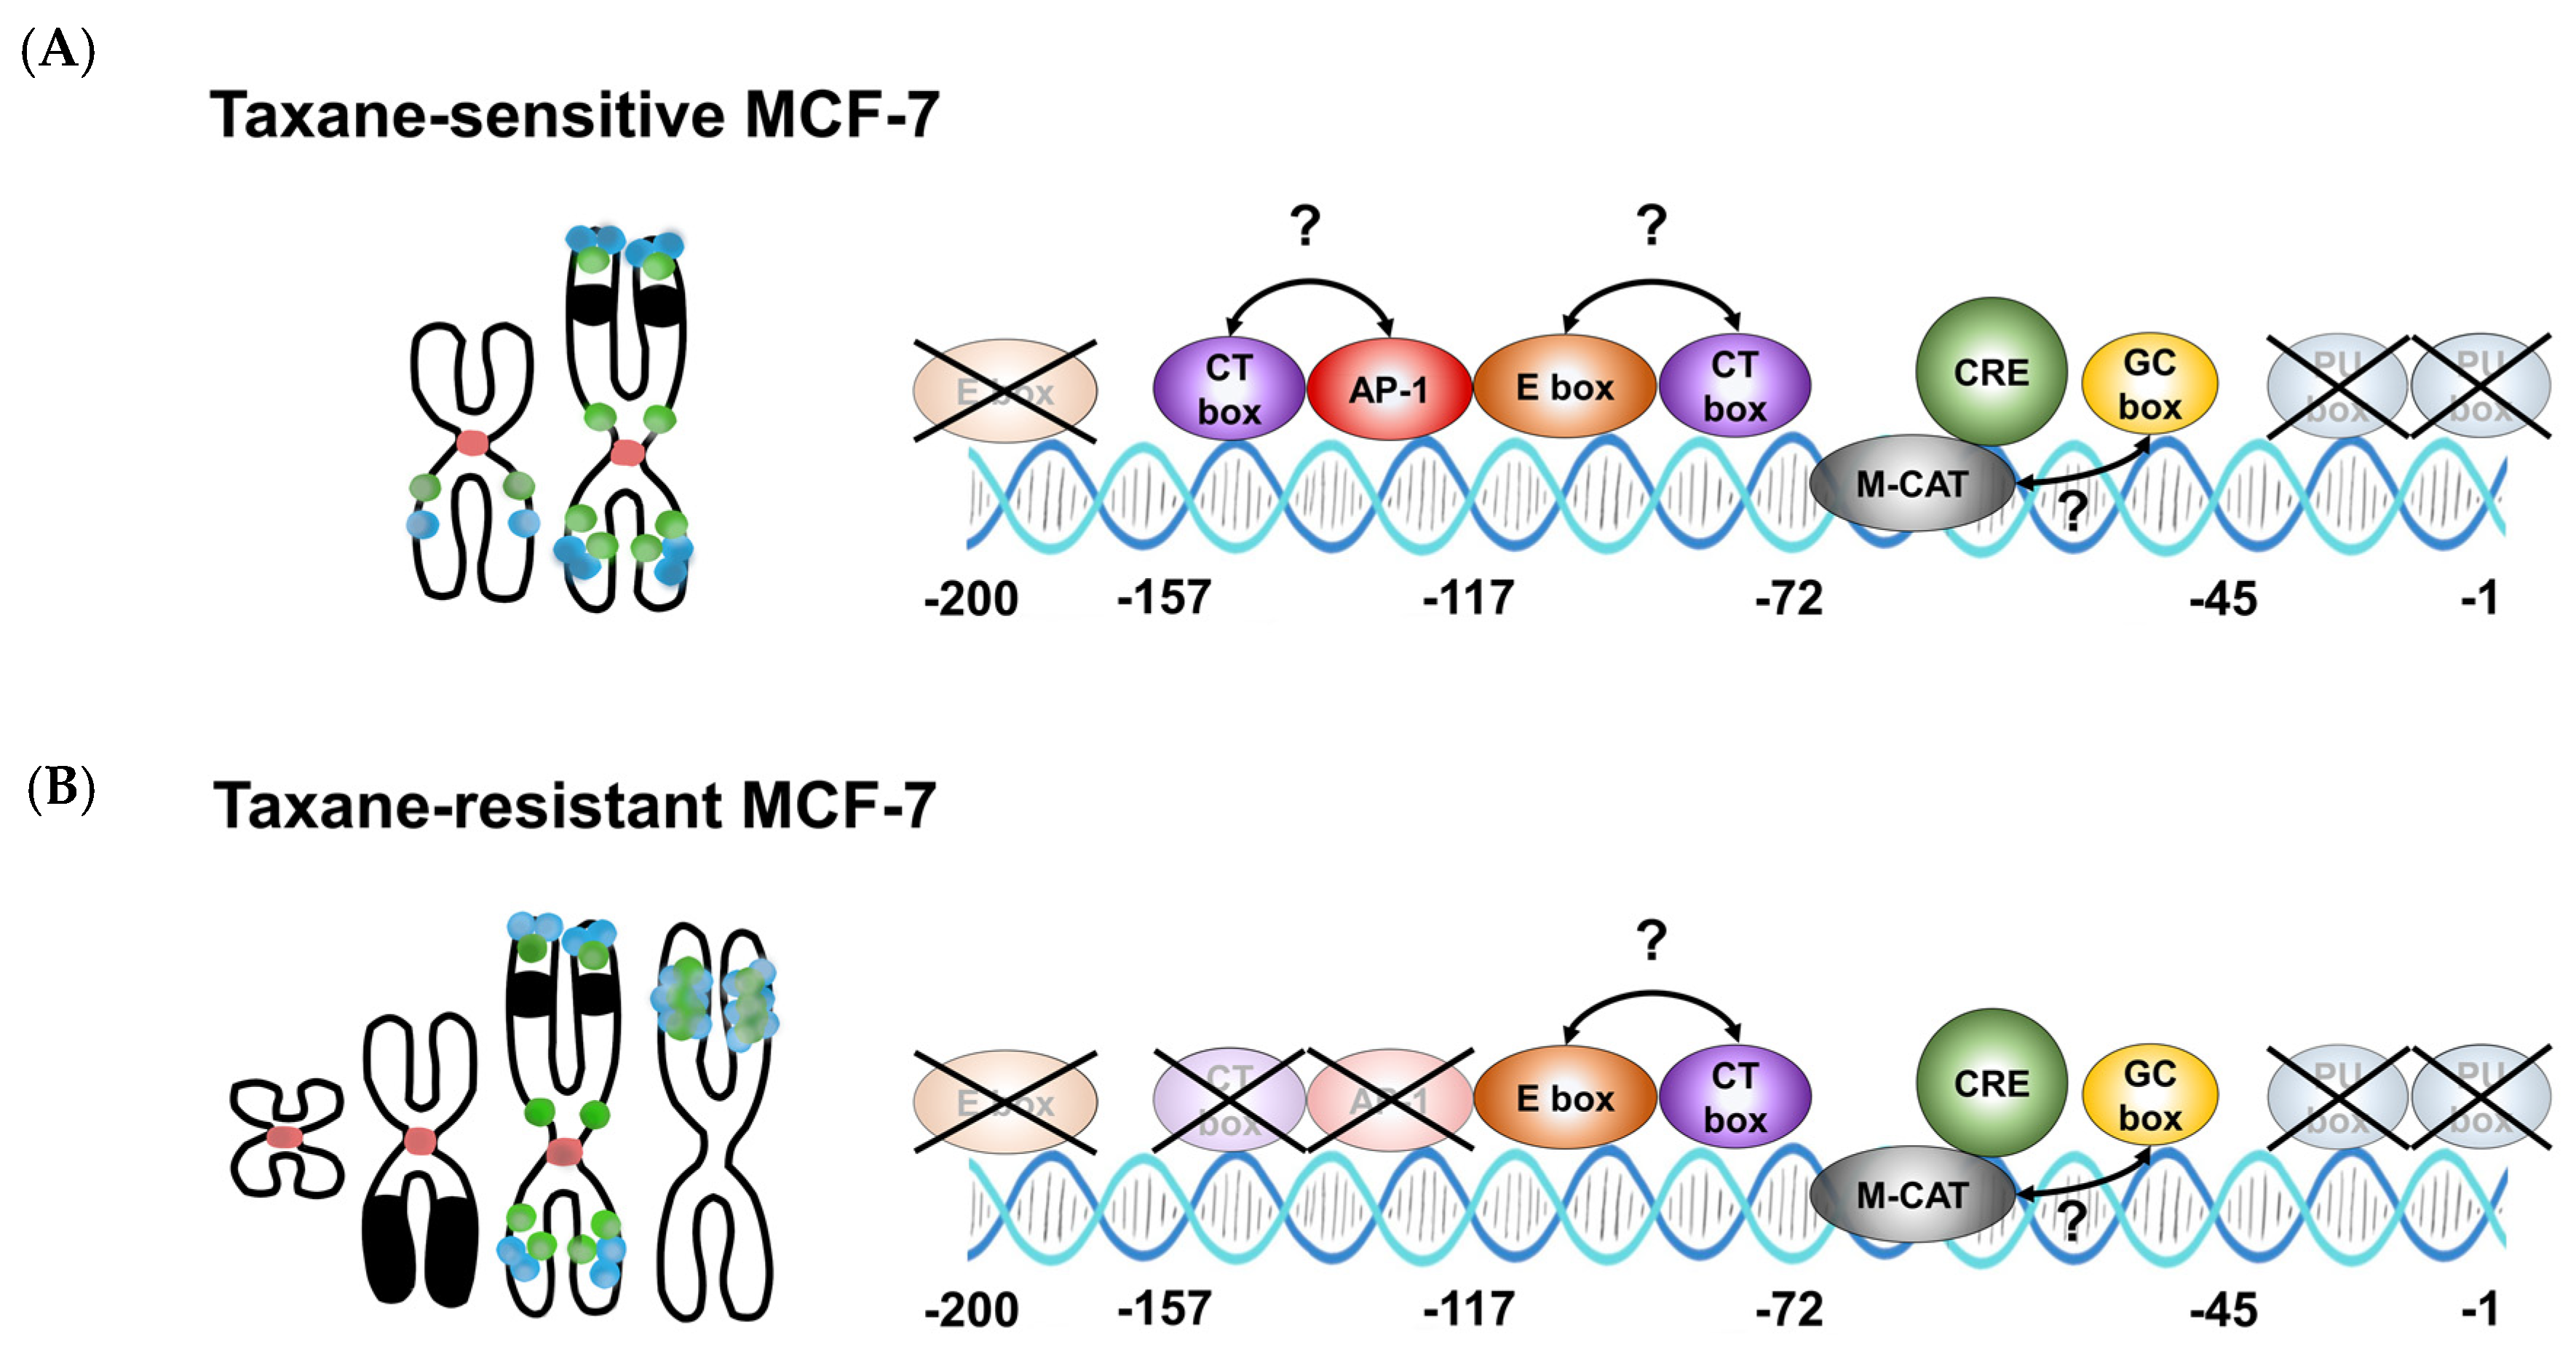
3.4. TRIP6 Expression Is Regulated by Cyclic AMP Response Element (CRE)

TRIP6 promoter has not been functionally characterized yet. Hence, we generated 5′ and 3′ truncated TRIP6 promoter reporter constructs by cloning a human TRIP6 promoter sequence upstream of the minimal synthetic promoter (minP) in pGL4.24[luc2P/minP] vector (Figure S5). In fact, the cloned full-length TRIP6 promoter sequence encompassed SLC12A9 exon 14 (sequence −936 to −376, relative to TRIP6 transcription start, TSS) and SLC12A9-TRIP6 intergenic region (sequence −375 to −1) (Figure 5).
We assessed firefly (Fluc2P) and deep-sea shrimp Nanoluc (Nluc) luciferase activities in MCF-7 cells and taxane-resistant MCF-7 sublines co-transfected with a series of 5′ and 3′ truncated constructs and the normalization pNL1.1.TK[Nluc/TK] vector. Firstly, the experiments showed that the TRIP6 proximal promoter (sequence −157 to −12 relative to the TRIP6 transcription start) but not the TRIP6 distal promoter (sequence −936 to −157) is sufficient to drive TRIP6 expression in both MCF-7 cells and taxane-resistant MCF-7 sublines (Figure 5). Secondly, the construct −72/−12 achieved significant Fluc2P/Nluc activity (20%, 28%, and 37% of relative Fluc2P/Nluc activity of the −157/−12 construct in MCF-7, PacR, and 0035R cells, respectively).
To identify cis-acting regulatory elements in the active human TRIP6 proximal promoter, we scanned the −200 to −1 sequence with Jaspar 2022 transcription factor binding profiles (≥93% relative profile score threshold) (Table S9) [55]. We manually identified core elements within most of the predicted binding sites (Figure 6A). Remarkably, we discovered a full cyclic AMP response element (CRE) motif at position −60 to −53, corresponding to the −72/−12 construct with marked activity. Mutagenesis of CRE demonstrated a 6- to 21-fold reduction in Fluc2P/Nluc activity in 5′ truncated constructs (−157/−12ΔCRE, −117/−12ΔCRE, and −72/−12ΔCRE) (Figure 6B), indicating that CRE is crucial to TRIP6 transcription in MCF-7 cells.
Furthermore, the −117/−72 construct exhibited a two-fold increase in Fluc2P/Nluc activity compared to the −72 /−12 construct in all tested cells (Figure 6B). The region −117 to −72 encompasses an enhancer box (E box) and CT box [56]. Furthermore, activating protein 1 (AP-1) motif located within the region −157 to −117 weakly stimulated (1.6-fold, p = 0.036) Fluc2P/Nluc activity in MCF-7 cells but not in PacR and 0035R cells (1.2-fold, p = 0.60, 1.1-fold, p = 0.33, respectively). Yet, the other element(s), probably the GC box [57] or M-CAT [58], increased basal expression as seen in the −72/−12ΔCRE construct. We recurrently detected no stimulatory activity in the region −45 to −12 in all tested cells.
Collectively, CRE unambiguously promotes TRIP6 transcription in MCF-7 cells and taxane-resistant MCF-7 sublines. The predicted E box, GC box, CT box, and M-CAT might contribute to the TRIP6 promoter activity; however, there would still be other unidentified motifs. In addition, the AP1 site likely enhances TRIP6 transcription only in MCF-7 cells, as it does not appear to modulate the response in PacR and 0035R cells.

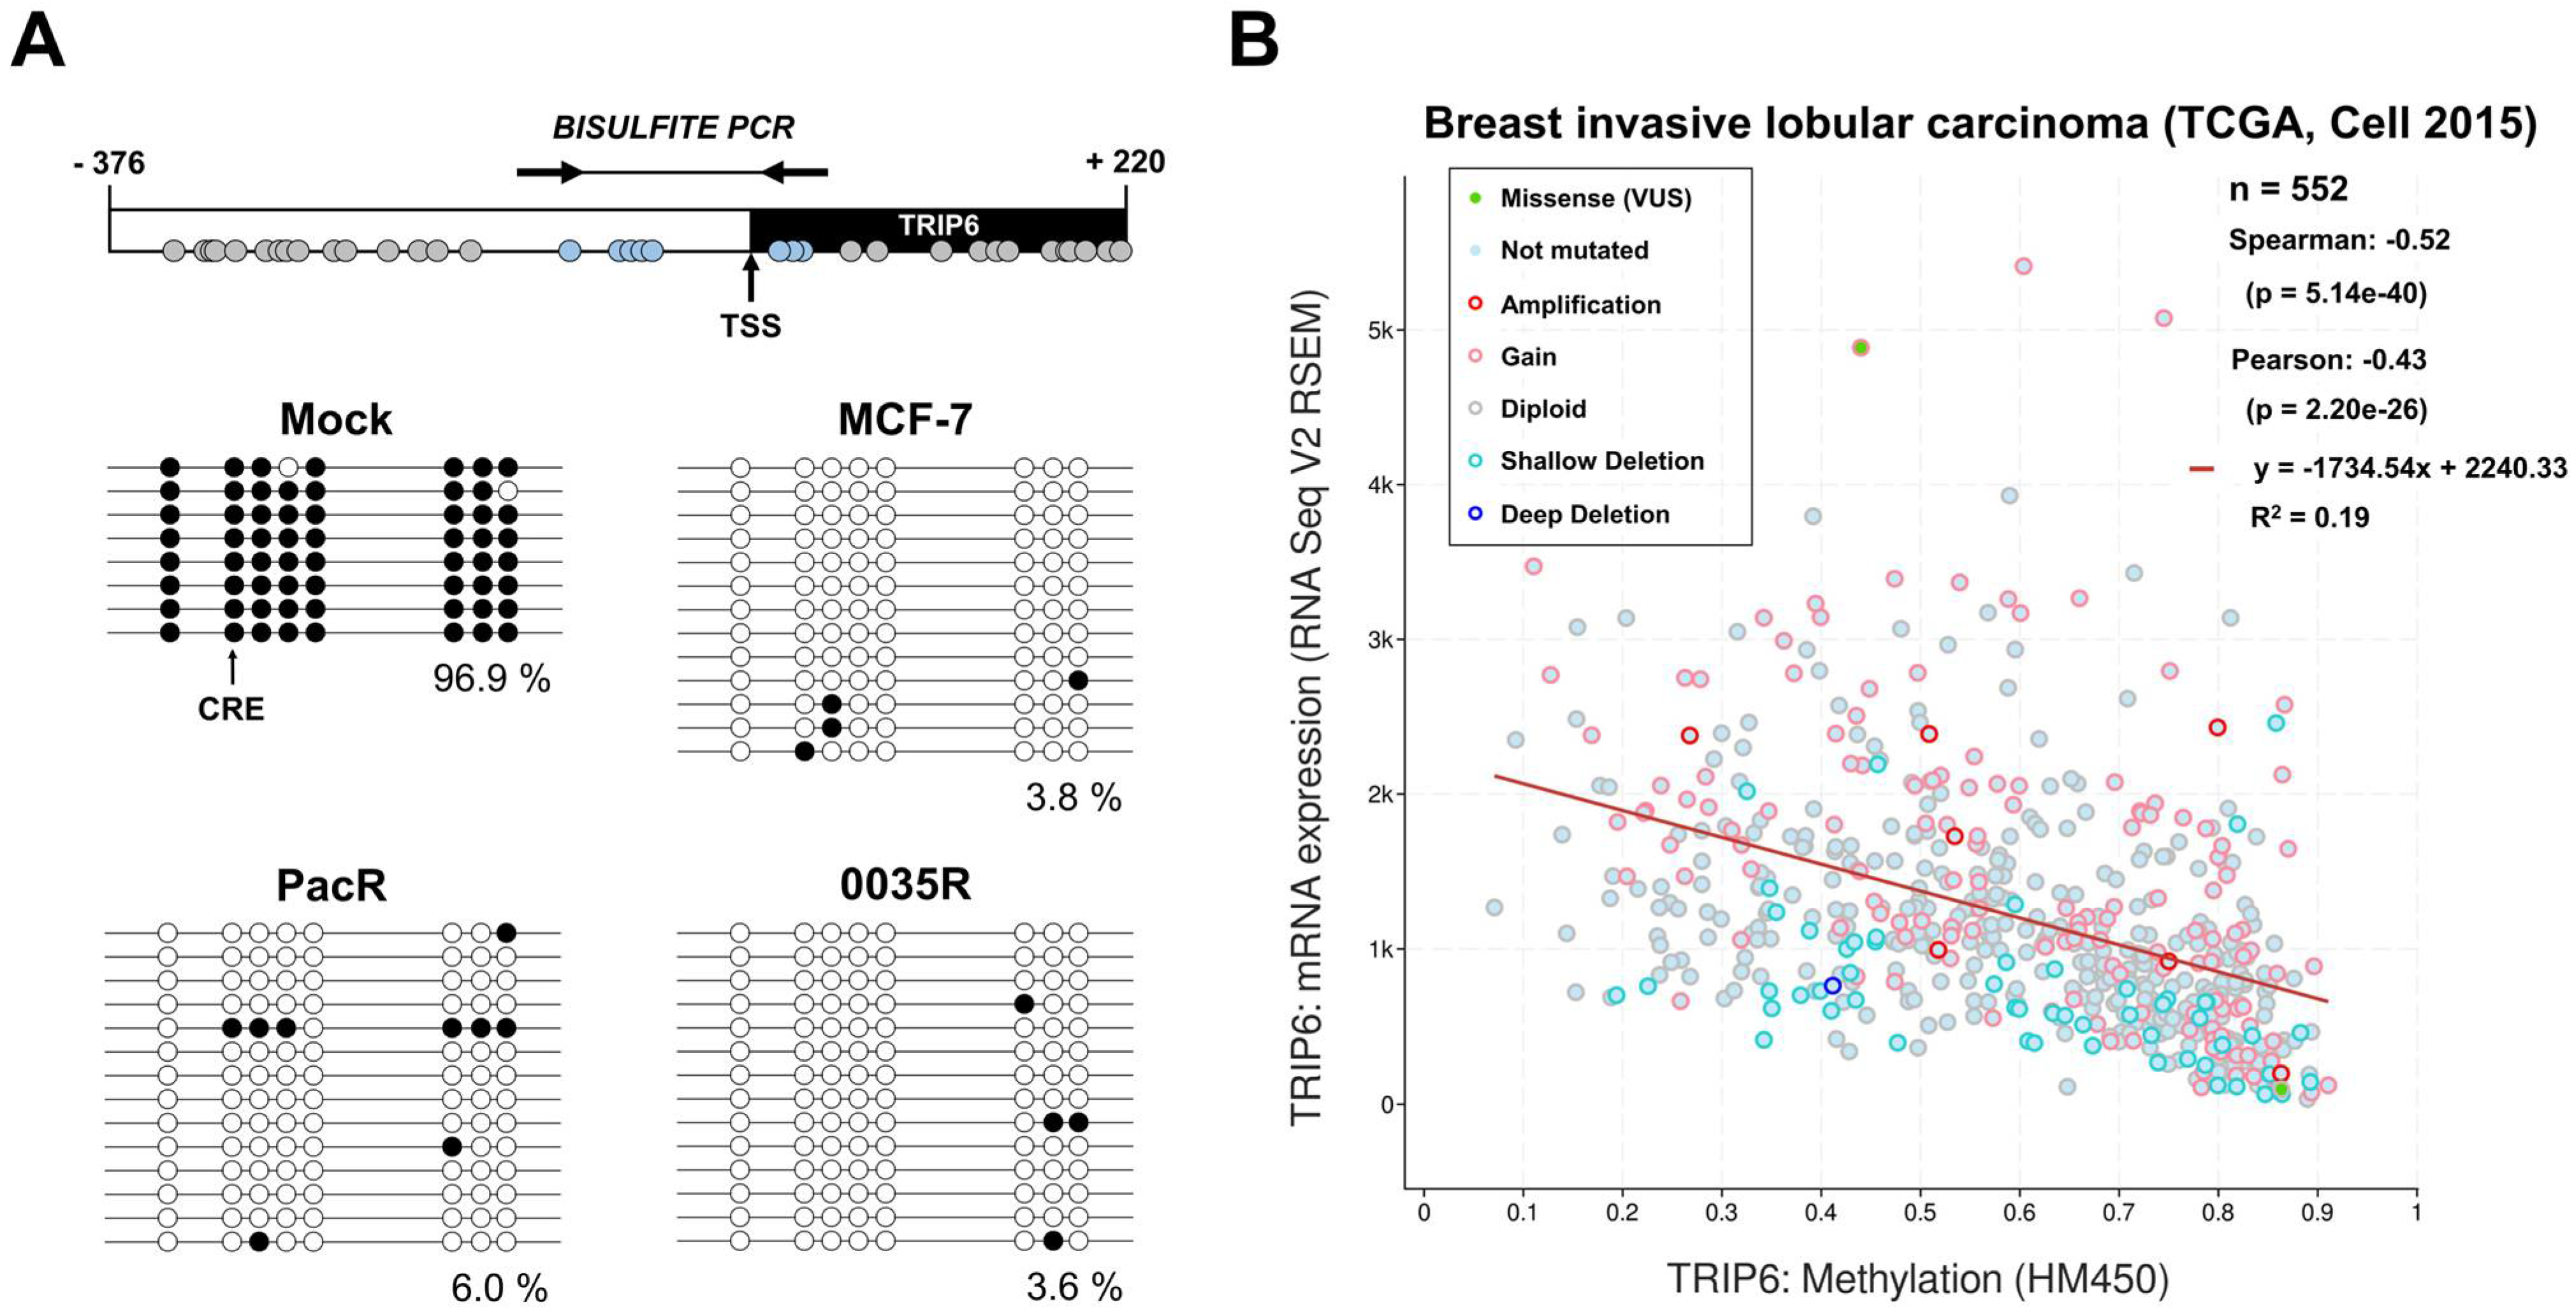
3.5. TRIP6 Proximal Promoter Is Hypomethylated in Taxane-Resistant MCF-7 Sublines

Methylation of CpG site in CRE motif hampers transcription in cis [59]. Considering TRIP6 dependence on the CRE motif (Figure 6), we assessed the methylation of 8 CpG sites within the TRIP6 proximal promoter by bisulfite PCR. As it is shown in Figure 7A, the analyzed region exhibits hypomethylation in MCF-7 cells (3.8%), PacR subline (6.0 %), and 0035R subline. Importantly, we detected an unmethylated CpG in the CRE motif in all tested cells (Figure 7A).
Furthermore, we assessed TRIP6 methylation in clinical breast cancer samples (TCGA study) (Figure 7B). TRIP6 mRNA expression negatively correlated (Spearman’s coefficient = −0.52, p < 0.001) with CpG methylation level, indicating that DNA methylation might regulate TRIP6 expression also in breast tumors.
To explore TRIP6 differential methylation between MCF-7 cells and taxane-resistant MCF-7 sublines (PacR, 0035R), we employed 16 probes that targeted to defined gene regions TSS200 (−200 bases to TSS, i.e., proximal promoter), TSS1500 (−1500 to −200, i.e., distal promoter), 1st Exon, gene body (region between ATG and stop codon), and 5′ and 3′ untranslated regions (UTRs). It is worth noting that the distal promoter region substantially overlaps with the last exon of the SLC12A9 gene. Although the whole TRIP6 gene sequence analysis showed higher methylation in PacR cells (p = 0.004, FDR = 0.025), in fact, methylation of the distal TRIP6 promoter region (TSS1500) significantly changed. We found no differential methylation between MCF-7 cells and taxane-resistant MCF-7 sublines in the TRIP6 proximal promoter (TSS200), gene body, and 1st exon, in line with bisulfite sequencing data (Table 3).
These findings suggest that the TRIP6 proximal promoter is stably hypomethylated, thereby contributing to high TRIP6 expression in MCF-7 cells and taxane-resistant MCF-7 sublines.

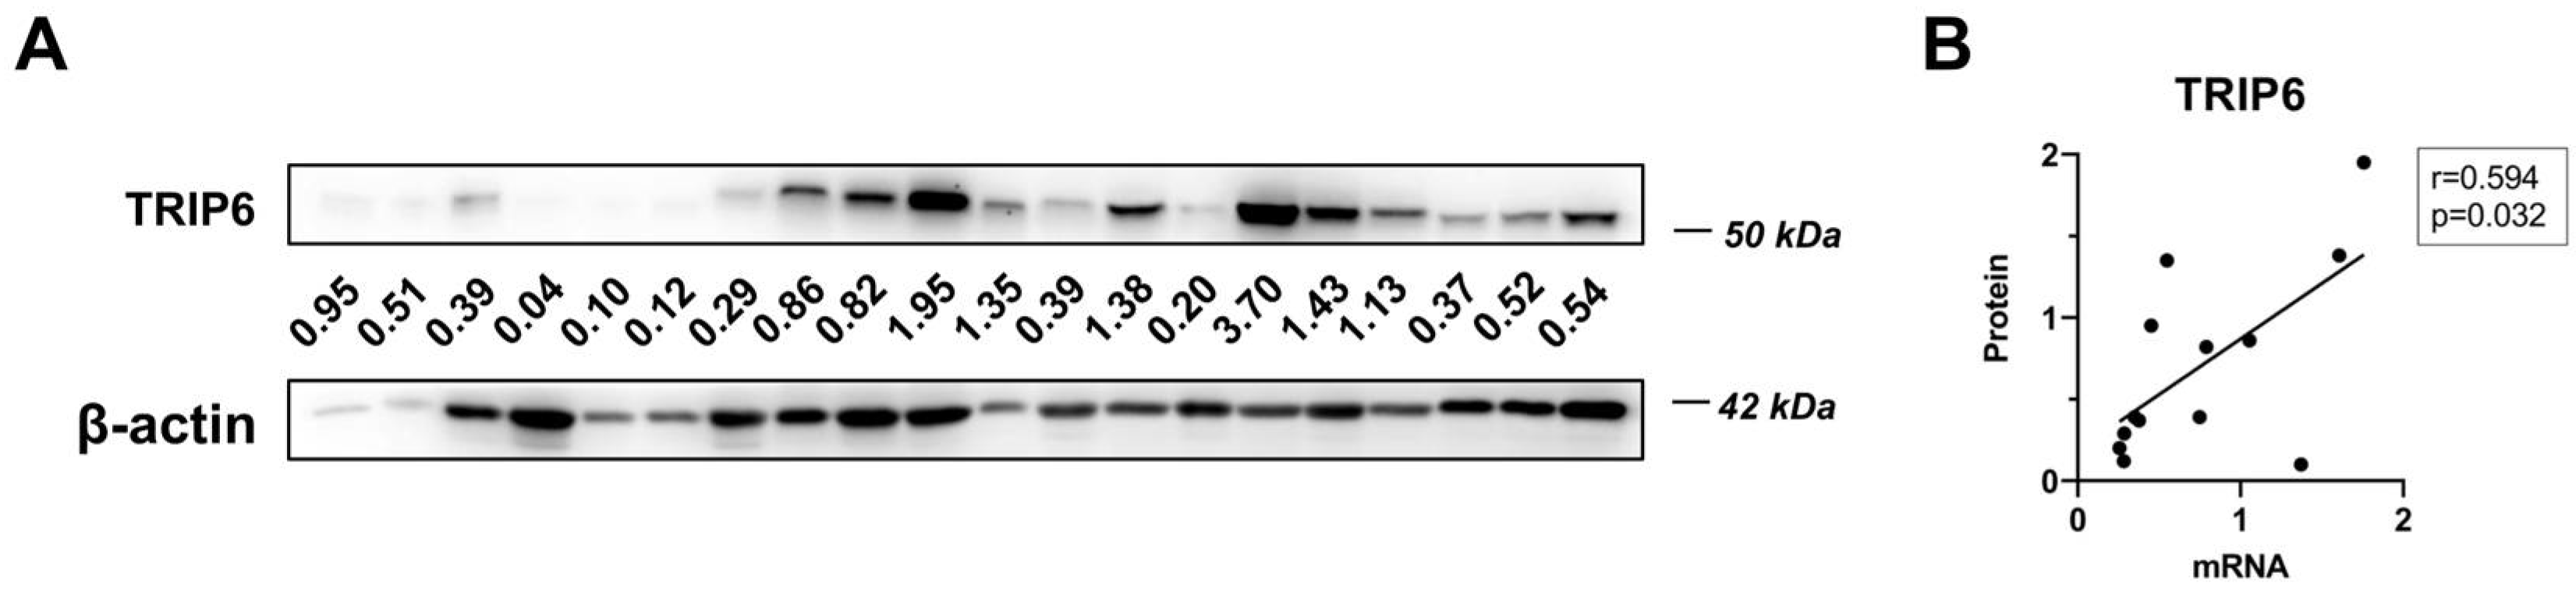
3.6. Associations of TRIP6 mRNA Level with Clinicopathological Features of Breast Cancer

In a recent study, Zhao et al. postulated TRIP6 as a putative prognostic biomarker in breast cancer [20]. Therefore, we aimed to validate this finding by evaluating TRIP6 expression in 95 breast tumor tissue samples and 6 non-tumor tissues collected in the Czech Republic.
Table 4 summarizes clinical data, response to the therapy, and survival of patients who provided breast cancer tissues. The median age (± SD) of patients with a breast cancer diagnosis was 56.0 ± 10.7 years. Most individuals were diagnosed with invasive ductal carcinoma (84.2%), grade 1 or 2 (75.8%), and stage II (62.1%). Nearly all breast cancer tissues expressed estrogen receptor (ER, 90.5% of samples) and progesterone receptor (PR, 70% of samples), meaning that luminal molecular subtype (91.6%) prevailed in evaluated samples. The median of disease-free survival (DFS) (± SD) of patients was 61.1 ± 28.4 months, and overall survival was 70.9 ± 28 months. Unfortunately, disease progression occurred in 9 of the 95 patients, and 8 patients died.
We assessed TRIP6 mRNA expression in all collected breast tissue samples (N = 95) and protein expression only in a small number of samples (N = 20) due to limitations in sample size. Whereas all breast tumor tissues expressed TRIP6 mRNA, we detected TRIP6 protein expression by immunoblotting in 17 of the 20 examined samples (Figure 8A). TRIP6 mRNA and protein level correlated intermediately (Spearman’s coefficient 0.594, p = 0.032) in breast cancer tissues. (Figure 8B).
We found no difference in TRIP6 mRNA expression levels between adjuvant (N = 82) and neoadjuvant (N = 13) cohorts (p = 0.86). Furthermore, we found no statistically significant correlation between TRIP6 mRNA level and DFS or OS, independent of the type of therapy. High TRIP6 mRNA expression was observed in premenopausal (p = 0.033) and progesterone receptor positive (p = 0.020) breast cancer in the adjuvant cohort of breast cancer patients but not in the neoadjuvant cohort (p = 0.50 and p = 0.77, respectively) (Table 5).

4. Discussion

An early study demonstrated a ubiquitous 1.8-Kb TRIP6 mRNA expression in human organs except for skeletal muscle, brain, and leukocytes [60]. Recently, Shukla et al. detected TRIP6 in ependymal and choroid plexus cells of embryonic and early post-natal (to P10) mice brains [12]. Additionally, observations of enhanced TRIP6 expression in various neoplasms might indicate disrupted gene regulatory mechanisms during cancerogenesis [20,61]. Furthermore, we found TRIP6 overexpression in paclitaxel-resistant MCF-7/PacR subline [62], yet the molecular mechanism(s) that drive TRIP6 expression in MCF-7 cells as well in paclitaxel-resistant cells have not been described in detail.
Herein, we revealed that TRIP6 copy number gain and the activity of the cyclic-AMP response element in the hypomethylated TRIP6 proximal promoter contribute to the high TRIP6 protein level in parental MCF-7 cells. Although the AP-1 motif seems more important in parental MCF-7 cells, copy number gain but not altered regulation of the TRIP6 promoter instead contribute to TRIP6 overexpression in both taxane-resistant MCF-7 sublines (Figure 9).
While TRIP6 mRNA levels differed between PacR cells and 0035R cells, TRIP6 protein abundance was identical and markedly higher compared to parental MCF-7 cells (Figure 2). This discrepancy might indicate the differential TRIP6 post-transcription regulation, for instance, by putative differential TRIP6 mRNA base modifications, miRNA, or recently observed TRIP6 ubiquitin-mediated degradation [24]. Concerning miRNA, it was reported that miR-7, miR-138-5p, miR-485-3p, and miR-589-5p regulate TRIP6 gene expression; unfortunately, their function related to TRIP6 in breast cancer has not been investigated [21,22,23,63]. However, our preliminary data suggest that miR-138-5p is not expressed in MCF-7 cells and taxane-resistant MCF-7 sublines (personal communication Dr. R. Václavíková).
Strikingly, the TRIP6 (100.8 Mb, 7q22.1) gene copy number and mRNA level increased in parallel with the ABCB1 (87.5 Mb, 7q21.12) gene copy number and mRNA level. In agreement, FISH analyses unambiguously validate TRIP6/ABCB1 co-amplification in taxane-resistant MCF-7 sublines (Figure 4). Despite TRIP6 amplification, our findings indicate that TRIP6 is not involved in resistance to taxanes, as silencing of the TRIP6 does not seem to affect the response of the 0035R cells to SB-T-0035 compound (Figure S6). To date, upregulation of the TRIP6 gene occurred in daunorubicin- (EPG85-257RDB) and mitoxantrone-resistant (EPG85-257RNOV) human gastric carcinoma cells, the former cells having also upregulated ABCB1 [64].
The ABCB1 amplified region, referred to as ABCB1 amplicon, is often documented in drug-resistant sublines [64,65,66,67]. By retrospective analysis, Genovese et al. defined the ABCB1 amplicon core as a 1 Mb region commonly detected in ABCB1 overexpressing cells [65]. By contrast, the largest reported ABCB1 amplicon was bordered by semaphorin 3D (SEMA3D, 84.3 Mb) and cyclin-dependent kinase 6 (CDK6, 92.1 Mb) [66]. The occurrence of TRIP6 (7q22.1, 100.8Mb) might indicate the extraordinary size of the ABCB1 amplicon in MCF-7 sublines.
The most famous breakage–fusion–break (BFB) mechanism of amplicon formation leverages specific sequences referred to as fragile sites [68]. What mechanism specifies fragile site selection is not well known. The breaks likely occurred at the FRA7F aphidicolin site (98.7–107.4 Mb) and the 7q11.2 region. The order of events is challenging due to the utilization of multiple selection steps and no direct observation of fusion bridges. Nevertheless, numerical aberration of chromosome 7 in taxane-resistant MCF-7 sublines might be a remnant of dicentric chromosome 7.
Beyond ABCB1/TRIP6 co-amplification, we noticed the loss of der(18)t(18;22) in both taxane-resistant MCF-7 sublines. The impact of this aberration in the context of taxane resistance is unknown.
Since the enhanced TRIP6 expression could theoretically be caused by different transcriptional regulations at the TRIP6 promoter level, we analyzed the responsiveness of the TRIP6 promoter by dual-luciferase assay. The TRIP6 proximal promoter region (−157 to −45) controlled luciferase expression in MCF-7 cells (Figure 5). The most active segment spanning −72 to −45 nucleotides harbors the M-CAT motif, cyclic AMP response element (CRE), and GC box (Figure 6). Disrupting the CRE motif by mutagenesis reduced luciferase activity, highlighting its pivotal role in TRIP6 transcription regulation (Figure 6). A genome-wide analysis has previously identified identical CRE motif within the TRIP6 proximal promoter [69], but its role has remained elusive. The cis-regulating activity of the CRE motif relies on its position (< 250 bases) relative to gene transcription start [70] and methylation of the inner CpG site [59]. As tested by bisulfite sequencing (Figure 7A), the CpG site within the CRE motif was not methylated in MCF-7 cells and in both taxane-resistant cells; however, whether this particular methylation affects the expression of TRIP6 remains to be determined in further studies.
Finally, we evaluated the clinical data of breast cancer patients with TRIP6 mRNA expression. Recently, we revealed no clinicopathological association of the TRIP6 mRNA expression level in ovarian cancer [71]. To highlight our findings concerning the regulation of TRIP6 expression in sensitive and taxane-resistant MCF-7 breast cancer cell lines, we evaluated TRIP6 mRNA expression against clinical data of breast cancer patients who had undergone taxane-containing regimens. So far, Zhao et al. have analyzed TRIP6 protein expression in breast cancer from the Chinese cohort [20]. Unfortunately, our data did not validate most of the published results, likely due to the small number of patients in our study and the heterogenous nature of breast cancer.

5. Conclusions

This study presents compelling evidence that the cyclic AMP response element (CRE) located within the stable hypomethylated proximal promoter controls TRIP6 expression in MCF-7 cells. Furthermore, increased TRIP6 copy number contributes to high TRIP6 expression in MCF-7 cells in vitro. Co-amplification of TRIP6 with ABCB1 underlies TRIP6 upregulation in two taxane-resistant MCF-7 sublines. Cytogenetic analyses showed that amplicon arose from intact chromosome 7. In addition, we observed a loss of derivative chromosome der(18)t(18;22) in both sublines, with an unknown relation to taxane resistance. Moreover, the present study has not found direct prognostic or predictive relevance of TRIP6 for better tailoring breast cancer management at the clinics. Instead, the analysis of breast tumor of a neoadjuvant cohort revealed TRIP6 mRNA expression level associations with positive progesterone receptor expression status and premenopausal status.
Collectively, we propose that TRIP6 proximal promoter might act as another important regulatory site in regulation of TRIP6 expression. The relevance of our functionally valid observation for clinical course of breast and other cancer(s), including eventual utility of TRIP6 as a target for new therapy design, shall be evaluated by follow-up studies.

Supplementary Materials

The following supporting information can be downloaded at: https://www.mdpi.com/article/10.3390/genes14020296/s1, Figure S1: Authentication report MCF-7; Figure S2: Authentication report MCF-7/PacR subline; Figure S3: Authentication report MCF-7/0035R subline; Figure S4: Empire Genomics Certificate; Figure S5: Cloning scheme; Figure S6: Effect of TRIP6 silencing; Table S1: Synthesis of complementary DNA; Table S2: TaqMan® Gene Expression probes list; Table S3: Reaction conditions for quantitative PCR; Table S4: Oligonucleotides used for TRIP6 promoter cloning; Table S5: TRIP6 promoter constructs generated by PCR fragment cloning; Table S6: PCR components and cycling conditions used for amplification of TRIP6 sequence; Table S7: Constructs generated by restriction endonuclease cleavage and blunting; Table S8: Constructs generated by restriction endonuclease cleavage; Table S9: Predicted transcription factor binding sites.

Author Contributions

Conceptualization, P.D. and J.K.; methodology, T.T. and T.F.; formal analysis, R.V., K.Š. and T.F.; investigation, P.D., K.B., R.V., K.Š., M.J., Š.R. and M.V.; resources, L.W., T.F., T.T. and I.O.; data curation, R.V.; writing—original draft preparation, P.D., R.V., K.Š. and Š.R.; writing—review and editing, J.K. and R.V.; visualization, P.D., Š.R. and M.V.; supervision, J.K., P.S., V.N.K. and I.O.; project administration, J.K. and P.S. All authors have read and agreed to the published version of the manuscript.

Funding

This work was supported by the Czech Science Foundation grant 19-03063S, by the Czech Ministry Of Education, Youth And Sports, Inter-Excellence LTA-USA, grant number 19032, by the Charles University In Prague, Cooperation Program MED ONCO 39, by the National Institutes of Health/National Cancer Institute grant, CA103314, and by the European Union–Next Generation EU, National Institute for Research of Metabolic and Cardiovascular Diseases (Programme EXCELES, ID Project No. LX22NPO5104). The APC was funded by the Charles University In Prague, Cooperation Program MED ONCO 39.

Institutional Review Board Statement

Procedures performed in the present study followed the 1964 Helsinki Declaration of the National Institute of Public Health in Prague, approved the study protocol (approval code no. 9799-4 (issued on 30 January 2008), 15-25618A (6 August 2014), and 17-28470A (22 June 2016)).

Informed Consent Statement

Informed consent was obtained from all subjects involved in the study.

Data Availability Statement

Not applicable.

Acknowledgments

The methylation array was performed at the Genomics Core Facility, Oslo University Hospital (http://oslo.genomics.no/).

Conflicts of Interest

The authors declare no conflict of interest.

Appendix A

Figure A1. The DNA level of ribonuclease P RNA component H1 (RPPH1) and telomerase reverse transcriptase (TERT) plotted as Ct values (N = 5, 3 technical replicates). The mean and 95% CI are shown. The number below the zig–zag line represent DNA level difference between MCF-7 cells and 0035R cells. Statistical analysis was performed using the one-way ANOVA with Dunnett’s post hoc correction test (*).
Genes 14 00296 g0a1
Figure A2. Multicolor fluorescence in situ hybridization (mFISH) of human chromosome 7. Displayed derivative chromosomes harboring chromosome 7 region that are present in parental taxane-sensitive MCF-7 cell line (MCF-7), paclitaxel-resistant MCF-7/PacR cell subline (PacR) and Stony Brook Taxane MCF-7/SB-T-0035R subline (0035R).
Genes 14 00296 g0a2
Figure A3. Multicolor fluorescence in situ hybridization (mFISH) of human chromosome 7. Displayed (top) novel derivative chromosomes harboring chromosome 7 region in paclitaxel-resistant MCF-7/PacR cell subline (PacR) and Stony Brook Taxane MCF-7/SB-T-0035R subline (0035R). Labeling scheme and position of the ABCB1 and TRIP6 genes in human chromosome 7 (bottom).
Genes 14 00296 g0a3

References

  1. Yi, J.; Beckerle, M.C. The human TRIP6 gene encodes a LIM domain protein and maps to chromosome 7q22, a region associated with tumorigenesis. Genomics 1998, 49, 314–316. [Google Scholar] [CrossRef]
  2. Wang, Y.; Gilmore, T.D. LIM domain protein Trip6 has a conserved nuclear export signal, nuclear targeting sequences, and multiple transactivation domains. Biochim. Biophys. Acta 2001, 1538, 260–272. [Google Scholar] [CrossRef] [PubMed] [Green Version]
  3. Siddiqui, M.Q.; Badmalia, M.D.; Patel, T.R. Bioinformatic Analysis of Structure and Function of LIM Domains of Human Zyxin Family Proteins. Int. J. Mol. Sci. 2021, 22, 2647. [Google Scholar] [CrossRef] [PubMed]
  4. Lin, V.T.; Lin, F.T. TRIP6: An adaptor protein that regulates cell motility, antiapoptotic signaling and transcriptional activity. Cell Signal. 2011, 23, 1691–1697. [Google Scholar] [CrossRef] [PubMed] [Green Version]
  5. Xu, J.; Lai, Y.J.; Lin, W.C.; Lin, F.T. TRIP6 enhances lysophosphatidic acid-induced cell migration by interacting with the lysophosphatidic acid 2 receptor. J. Biol. Chem. 2004, 279, 10459–10468. [Google Scholar] [CrossRef] [PubMed] [Green Version]
  6. Chastre, E.; Abdessamad, M.; Kruglov, A.; Bruyneel, E.; Bracke, M.; Di Gioia, Y.; Beckerle, M.C.; van Roy, F.; Kotelevets, L. TRIP6, a novel molecular partner of the MAGI-1 scaffolding molecule, promotes invasiveness. FASEB J. 2009, 23, 916–928. [Google Scholar] [CrossRef] [PubMed]
  7. Dutta, S.; Mana-Capelli, S.; Paramasivam, M.; Dasgupta, I.; Cirka, H.; Billiar, K.; McCollum, D. TRIP6 inhibits Hippo signaling in response to tension at adherens junctions. EMBO Rep. 2018, 19, 337–350. [Google Scholar] [CrossRef] [PubMed]
  8. Venkatramanan, S.; Ibar, C.; Irvine, K.D. TRIP6 is required for tension at adherens junctions. J. Cell Sci. 2021, 134, jcs247866. [Google Scholar] [CrossRef]
  9. Kassel, O.; Schneider, S.; Heilbock, C.; Litfin, M.; Göttlicher, M.; Herrlich, P. A nuclear isoform of the focal adhesion LIM-domain protein Trip6 integrates activating and repressing signals at AP-1- and NF-kappaB-regulated promoters. Genes Dev. 2004, 18, 2518–2528. [Google Scholar] [CrossRef] [Green Version]
  10. Kemler, D.; Dahley, O.; Roßwag, S.; Litfin, M.; Kassel, O. The LIM domain protein nTRIP6 acts as a co-repressor for the transcription factor MEF2C in myoblasts. Sci. Rep. 2016, 6, 27746. [Google Scholar] [CrossRef]
  11. Abbariki, T.N.; Gonda, Z.; Kemler, D.; Urbanek, P.; Wagner, T.; Litfin, M.; Wang, Z.Q.; Herrlich, P.; Kassel, O. The LIM domain protein nTRIP6 modulates the dynamics of myogenic differentiation. Sci. Rep. 2021, 11, 12904. [Google Scholar] [CrossRef] [PubMed]
  12. Shukla, S.; Haenold, R.; Urbánek, P.; Frappart, L.; Monajembashi, S.; Grigaravicius, P.; Nagel, S.; Min, W.K.; Tapias, A.; Kassel, O.; et al. TRIP6 functions in brain ciliogenesis. Nat. Commun. 2021, 12, 5887. [Google Scholar] [CrossRef] [PubMed]
  13. Yi, J.; Kloeker, S.; Jensen, C.C.; Bockholt, S.; Honda, H.; Hirai, H.; Beckerle, M.C. Members of the Zyxin family of LIM proteins interact with members of the p130Cas family of signal transducers. J. Biol. Chem. 2002, 277, 9580–9589. [Google Scholar] [CrossRef] [Green Version]
  14. Takizawa, N.; Smith, T.C.; Nebl, T.; Crowley, J.L.; Palmieri, S.J.; Lifshitz, L.M.; Ehrhardt, A.G.; Hoffman, L.M.; Beckerle, M.C.; Luna, E.J. Supervillin modulation of focal adhesions involving TRIP6/ZRP-1. J. Cell Biol. 2006, 174, 447–458. [Google Scholar] [CrossRef] [Green Version]
  15. Lai, Y.J.; Lin, V.T.; Zheng, Y.; Benveniste, E.N.; Lin, F.T. The adaptor protein TRIP6 antagonizes Fas-induced apoptosis but promotes its effect on cell migration. Mol. Cell. Biol. 2010, 30, 5582–5596. [Google Scholar] [CrossRef] [PubMed] [Green Version]
  16. Yang, Y.; Li, X.M.; Wang, J.R.; Li, Y.; Ye, W.L.; Wang, Y.; Liu, Y.X.; Deng, Z.Y.; Gan, W.J.; Wu, H. TRIP6 promotes inflammatory damage via the activation of TRAF6 signaling in a murine model of DSS-induced colitis. J. Inflamm. 2022, 19, 1. [Google Scholar] [CrossRef] [PubMed]
  17. Sheppard, S.A.; Loayza, D. LIM-domain proteins TRIP6 and LPP associate with shelterin to mediate telomere protection. Aging 2010, 2, 432–444. [Google Scholar] [CrossRef] [PubMed] [Green Version]
  18. Thul, P.J.; Åkesson, L.; Wiking, M.; Mahdessian, D.; Geladaki, A.; Blal, H.A.; Alm, T.; Asplund, A.; Björk, L.; Breckels, L.M.; et al. A subcellular map of the human proteome. Science 2017, 356, eaal3321. [Google Scholar] [CrossRef] [PubMed]
  19. Gambardella, G.; Viscido, G.; Tumaini, B.; Isacchi, A.; Bosotti, R.; di Bernardo, D. A single-cell analysis of breast cancer cell lines to study tumour heterogeneity and drug response. Nat. Commun. 2022, 13, 1714. [Google Scholar] [CrossRef]
  20. Zhao, X.; Jiang, C.; Xu, R.; Liu, Q.; Liu, G.; Zhang, Y. TRIP6 enhances stemness property of breast cancer cells through activation of Wnt/β-catenin. Cancer Cell Int. 2020, 20, 51. [Google Scholar] [CrossRef]
  21. Wang, J.; Li, J.; Yang, J.; Zhang, L.; Gao, S.; Jiao, F.; Yi, M.; Xu, J. MicroRNA-138-5p regulates neural stem cell proliferation and differentiation in vitro by targeting TRIP6 expression. Mol. Med. Rep. 2017, 16, 7261–7266. [Google Scholar] [CrossRef] [PubMed] [Green Version]
  22. Gu, J.; Shao, R.; Li, M.; Yan, Q.; Hu, H. MiR-485-3p modulates neural stem cell differentiation and proliferation via regulating TRIP6 expression. J. Cell. Mol. Med. 2020, 24, 398–404. [Google Scholar] [CrossRef] [PubMed] [Green Version]
  23. Ling, Y.; Cao, C.; Li, S.; Qiu, M.; Shen, G.; Chen, Z.; Yao, F.; Chen, W. TRIP6, as a target of miR-7, regulates the proliferation and metastasis of colorectal cancer cells. Biochem. Biophys. Res. Commun. 2019, 514, 231–238. [Google Scholar] [CrossRef]
  24. Gou, H.; Liang, J.Q.; Zhang, L.; Chen, H.; Zhang, Y.; Li, R.; Wang, X.; Ji, J.; Tong, J.H.; To, K.F.; et al. TTPAL Promotes Colorectal Tumorigenesis by Stabilizing TRIP6 to Activate Wnt/β-Catenin Signaling. Cancer Res. 2019, 13, 3332–3346. [Google Scholar] [CrossRef] [PubMed] [Green Version]
  25. Sung, H.; Ferlay, J.; Siegel, R.L.; Laversanne, M.; Soerjomataram, I.; Jemal, A.; Bray, F. Global Cancer Statistics 2020: GLOBOCAN Estimates of Incidence and Mortality Worldwide for 36 Cancers in 185 Countries. CA Cancer J. Clin. 2021, 71, 209–249. [Google Scholar] [CrossRef] [PubMed]
  26. Turner, K.M.; Yeo, S.K.; Holm, T.M.; Shaughnessy, E.; Guan, J.L. Heterogeneity within molecular subtypes of breast cancer. Am. J. Physiol. Cell Physiol. 2021, 321, C343–C354. [Google Scholar] [CrossRef]
  27. Burstein, H.J.; Curigliano, G.; Thürlimann, B.; Weber, W.P.; Poortmans, P.; Regan, M.M.; Senn, H.J.; Winer, E.P.; Gnant, M.; Panelists of the St Gallen Consensus Conference. Customizing local and systemic therapies for women with early breast cancer: The St. Gallen International Consensus Guidelines for treatment of early breast cancer 2021. Ann. Oncol. 2021, 32, 1216–1235. [Google Scholar] [CrossRef]
  28. Lashen, A.; Toss, M.S.; Fadhil, W.; Oni, G.; Madhusudan, S.; Rakha, E. Evaluation Oncotype DX® 21-Gene Recurrence Score and Clinicopathological Parameters: A single institutional experience. Histopathology, 2023; accepted. [Google Scholar] [CrossRef]
  29. Cancer Genome Atlas Network. Comprehensive molecular portraits of human breast tumours. Nature 2012, 490, 61–70. [Google Scholar] [CrossRef] [Green Version]
  30. Pereira, B.; Chin, S.F.; Rueda, O.M.; Vollan, H.K.; Provenzano, E.; Bardwell, H.A.; Pugh, M.; Jones, L.; Russell, R.; Sammut, S.J.; et al. The somatic mutation profiles of 2,433 breast cancers refines their genomic and transcriptomic landscapes. Nat. Commun. 2016, 7, 11479. [Google Scholar] [CrossRef]
  31. Ojima, I.; Fumero-Oderda, C.L.; Kuduk, S.D.; Ma, Z.; Kirikae, F.; Kirikae, T. Structure-activity relationship study of taxoids for their ability to activate murine macrophages as well as inhibit the growth of macrophage-like cells. Bioorg. Med. Chem. 2003, 11, 2867–2888. [Google Scholar] [CrossRef]
  32. Calcagno, A.M.; Ambudkar, S.V. Molecular mechanisms of drug resistance in single-step and multi-step drug-selected cancer cells. Methods Mol. Biol. 2010, 596, 77–93. [Google Scholar] [CrossRef] [PubMed] [Green Version]
  33. Němcová-Fürstová, V.; Kopperová, D.; Balušíková, K.; Ehrlichová, M.; Brynychová, V.; Václavíková, R.; Daniel, P.; Souček, P.; Kovář, J. Characterization of acquired paclitaxel resistance of breast cancer cells and involvement of ABC transporters. Toxicol. Appl. Pharmacol. 2016, 310, 215–228. [Google Scholar] [CrossRef] [PubMed]
  34. Jelínek, M.; Balušíková, K.; Daniel, P.; Němcová-Fürstová, V.; Kirubakaran, P.; Jaček, M.; Wei, L.; Wang, X.; Vondrášek, J.; Ojima, I.; et al. Substituents at the C3′ and C3′N positions are critical for taxanes to overcome acquired resistance of cancer cells to paclitaxel. Toxicol. Appl. Pharmacol. 2018, 347, 79–91. [Google Scholar] [CrossRef] [PubMed]
  35. Brynychová, V.; Hlaváč, V.; Ehrlichová, M.; Václavíková, R.; Pecha, V.; Trnková, M.; Wald, M.; Mrhalová, M.; Kubáčková, K.; Pikus, T.; et al. Importance of transcript levels of caspase-2 isoforms S and L for breast carcinoma progression. Future Oncol. 2013, 9, 427–438. [Google Scholar] [CrossRef]
  36. Hubackova, M.; Vaclavikova, R.; Ehrlichova, M.; Mrhalova, M.; Kodet, R.; Kubackova, K.; Vrána, D.; Gut, I.; Soucek, P. Association of superoxide dismutases and NAD(P)H quinone oxidoreductases with prognosis of patients with breast carcinomas. Int. J. Cancer 2012, 130, 338–348. [Google Scholar] [CrossRef]
  37. Tavassoli, F.A.; Devilee, P. International Agency for Research on Cancer; World Health Organization. In Pathology and Genetics of Tumours of the Breast and Female Genital Organs; IARC Press: Lyon, France, 2003; 432p. [Google Scholar]
  38. Cheang, M.C.; Chia, S.K.; Voduc, D.; Gao, D.; Leung, S.; Snider, J.; Watson, M.; Davies, S.; Bernard, P.S.; Parker, J.S.; et al. Ki67 index, HER2 status, and prognosis of patients with luminal B breast cancer. J. Natl. Cancer Inst. 2009, 101, 736–750. [Google Scholar] [CrossRef] [Green Version]
  39. Goldhirsch, A.; Winer, E.P.; Coates, A.S.; Gelber, R.D.; Piccart-Gebhart, M.; Thürlimann, B.; Senn, H.J.; Panel members. Personalizing the treatment of women with early breast cancer: Highlights of the St Gallen International Expert Consensus on the Primary Therapy of Early Breast Cancer 2013. Ann. Oncol. 2013, 24, 2206–2223. [Google Scholar] [CrossRef]
  40. Bustin, S.A.; Benes, V.; Garson, J.A.; Hellemans, J.; Huggett, J.; Kubista, M.; Mueller, R.; Nolan, T.; Pfaffl, M.W.; Shipley, G.L.; et al. The MIQE guidelines: Minimum information for publication of quantitative real-time PCR experiments. Clin. Chem. 2009, 55, 611–622. [Google Scholar] [CrossRef] [Green Version]
  41. Hlaváč, V.; Brynychová, V.; Václavíková, R.; Ehrlichová, M.; Vrána, D.; Pecha, V.; Koževnikovová, R.; Trnková, M.; Gatěk, J.; Kopperová, D.; et al. The expression profile of ATP-binding cassette transporter genes in breast carcinoma. Pharmacogenomics 2013, 14, 515–529. [Google Scholar] [CrossRef]
  42. Elsnerova, K.; Mohelnikova-Duchonova, B.; Cerovska, E.; Ehrlichova, M.; Gut, I.; Rob, L.; Skapa, P.; Hruda, M.; Bartakova, A.; Bouda, J.; et al. Gene expression of membrane transporters: Importance for prognosis and progression of ovarian carcinoma. Oncol. Rep. 2016, 35, 2159–2170. [Google Scholar] [CrossRef] [Green Version]
  43. Livak, K.J.; Schmittgen, T.D. Analysis of relative gene expression data using real-time quantitative PCR and the 2(-Delta Delta C(T)). Methods 2001, 25, 402–408. [Google Scholar] [CrossRef] [PubMed]
  44. Daniel, P.; Halada, P.; Jelínek, M.; Balušíková, K.; Kovář, J. Differentially Expressed Mitochondrial Proteins in Human MCF7 Breast Cancer Cells Resistant to Paclitaxel. Int. J. Mol. Sci. 2019, 20, 2986. [Google Scholar] [CrossRef] [PubMed] [Green Version]
  45. McGowan-Jordan, J.; Hastings, R.J.; Moore, S.; International Standing Committee on Human Cytogenomic nomenclature. ISCN 2020: An International System for Human Cytogenomic Nomenclature; Karger: Basel, Switzerland, 2020; 170p. [Google Scholar]
  46. R Core Team. R: A Language and Environment for Statistical Computing; R Foundation for Statistical Computing: Vienna, Austria, 2020. [Google Scholar]
  47. Touleimat, N.; Tost, J. Complete pipeline for Infinium® Human Methylation 450K BeadChip data processing using subset quantile normalization for accurate DNA methylation estimation. Epigenomics 2012, 4, 325–341. [Google Scholar] [CrossRef] [PubMed] [Green Version]
  48. Fleischer, T.; Frigessi, A.; Johnson, K.C.; Edvardsen, H.; Touleimat, N.; Klajic, J.; Riis, M.L.; Haakensen, V.D.; Wärnberg, F.; Naume, B.; et al. Genome-wide DNA methylation profiles in progression to in situ and invasive carcinoma of the breast with impact on gene transcription and prognosis. Genome Biol. 2014, 15, 435. [Google Scholar] [CrossRef] [Green Version]
  49. Fortin, J.P.; Triche, T.J., Jr.; Hansen, K.D. Preprocessing, normalization and integration of the Illumina HumanMethylationEPIC array with minfi. Bioinformatics 2017, 33, 558–560. [Google Scholar] [CrossRef] [Green Version]
  50. Maksimovic, J.; Gordon, L.; Oshlack, A. SWAN: Subset-quantile within array normalization for illumina infinium HumanMethylation450 BeadChips. Genome Biol. 2012, 13, R44. [Google Scholar] [CrossRef] [Green Version]
  51. Pidsley, R.; Zotenko, E.; Peters, T.J.; Lawrence, M.G.; Risbridger, G.P.; Molloy, P.; Van Djik, S.; Muhlhausler, B.; Stirzaker, C.; Clark, S.J. Critical evaluation of the Illumina MethylationEPIC BeadChip microarray for whole-genome DNA methylation profiling. Genome Biol. 2016, 17, 208. [Google Scholar] [CrossRef] [Green Version]
  52. Kumaki, Y.; Oda, M.; Okano, M. QUMA: Quantification tool for methylation analysis. Nucleic Acids Res. 2008, 36, W170–W175. [Google Scholar] [CrossRef]
  53. Weissgerber, T.L.; Milic, N.M.; Winham, S.J.; Garovic, V.D. Beyond bar and line graphs: Time for a new data presentation paradigm. PLoS Biol. 2015, 13, e1002128. [Google Scholar] [CrossRef]
  54. Comşa, Ş.; Cîmpean, A.M.; Raica, M. The Story of MCF-7 Breast Cancer Cell Line: 40 years of Experience in Research. Anticancer Res. 2015, 35, 3147–3154. [Google Scholar]
  55. Fornes, O.; Castro-Mondragon, J.A.; Khan, A.; van der Lee, R.; Zhang, X.; Richmond, P.A.; Modi, B.P.; Correard, S.; Gheorghe, M.; Baranašić, D.; et al. JASPAR 2020: Update of the open-access database of transcription factor binding profiles. Nucleic Acids Res. 2020, 48, D87–D92. [Google Scholar] [CrossRef]
  56. Lutz, W.; Schwab, M. In vivo regulation of single copy and amplified N-myc in human neuroblastoma cells. Oncogene 1997, 15, 303–315. [Google Scholar] [CrossRef] [PubMed] [Green Version]
  57. Ji, C.; Casinghino, S.; McCarthy, T.L.; Centrella, M. Multiple and essential Sp1 binding sites in the promoter for transforming growth factor-β type I receptor. J. Biol. Chem. 1997, 272, 21260–21267. [Google Scholar] [CrossRef] [PubMed] [Green Version]
  58. Mar, J.H.; Ordahl, C.P. M-CAT binding factor, a novel trans-acting factor governing muscle-specific transcription. Mol. Cell. Biol. 1990, 10, 4271–4283. [Google Scholar] [CrossRef] [PubMed]
  59. Iguchi-Ariga, S.M.; Schaffner, W. CpG methylation of the cAMP-responsive enhancer/promoter sequence TGACGTCA abolishes specific factor binding as well as transcriptional activation. Genes Dev. 1989, 3, 612–619. [Google Scholar] [CrossRef] [PubMed] [Green Version]
  60. Zhao, M.K.; Wang, Y.; Murphy, K.; Yi, J.; Beckerle, M.C.; Gilmore, T.D. LIM domain-containing protein trip6 can act as a coactivator for the v-Rel transcription factor. Gene Expr. 1999, 8, 207–217. [Google Scholar] [PubMed]
  61. Zhu, L.; Xu, X.; Tang, Y.; Zhu, X. TRIP6 functions as a potential oncogene and facilitated proliferation and metastasis of gastric cancer. Biologics 2019, 13, 101–110. [Google Scholar] [CrossRef] [PubMed]
  62. Pavlíková, N.; Bartoňová, I.; Balušíková, K.; Kopperová, D.; Halada, P.; Kovář, J. Differentially expressed proteins in human MCF-7 breast cancer cells sensitive and resistant to paclitaxel. Exp. Cell Res. 2015, 333, 1–10. [Google Scholar] [CrossRef]
  63. Wang, Y.; Dong, L.; Liu, Y. Targeting Thyroid Receptor Interacting Protein 6 by MicroRNA-589-5p Inhibits Cell Proliferation, Migration, and Invasion in Endometrial Carcinoma. Cancer Biother. Radiopharm. 2019, 34, 529–536. [Google Scholar] [CrossRef]
  64. Heim, S.; Lage, H. Transcriptome analysis of different multidrug-resistant gastric carcinoma cells. In Vivo 2005, 19, 583–590. [Google Scholar]
  65. Genovese, I.; Ilari, A.; Assaraf, Y.G.; Fazi, F.; Colotti, G. Not only P-glycoprotein: Amplification of the ABCB1-containing chromosome region 7q21 confers multidrug resistance upon cancer cells by coordinated overexpression of an assortment of resistance-related proteins. Drug Resist. Updat. 2017, 32, 23–46. [Google Scholar] [CrossRef] [PubMed]
  66. Wang, Y.C.; Juric, D.; Francisco, B.; Yu, R.X.; Duran, G.E.; Chen, K.G.; Chen, X.; Sikic, B.I. Regional activation of chromosomal arm 7q with and without gene amplification in taxane-selected human ovarian cancer cell lines. Genes Chromosom. Cancer 2006, 45, 365–374. [Google Scholar] [CrossRef] [PubMed]
  67. Lombard, A.P.; Lou, W.; Armstrong, C.M.; D’Abronzo, L.S.; Ning, S.; Evans, C.P.; Gao, A.C. Activation of the ABCB1 Amplicon in Docetaxel- and Cabazitaxel-Resistant Prostate Cancer Cells. Mol. Cancer. Ther. 2021, 20, 2061–2070. [Google Scholar] [CrossRef] [PubMed]
  68. Kumar, R.; Nagpal, G.; Kumar, V.; Usmani, S.S.; Agrawal, P.; Raghava, G.P.S. HumCFS: A database of fragile sites in human chromosomes. BMC Genom. 2019, 19, 985. [Google Scholar] [CrossRef] [PubMed] [Green Version]
  69. Zhang, X.; Odom, D.T.; Koo, S.H.; Conkright, M.D.; Canettieri, G.; Best, J.; Chen, H.; Jenner, R.; Herbolsheimer, E.; Jacobsen, E.; et al. Genome-wide analysis of cAMP-response element binding protein occupancy, phosphorylation, and target gene activation in human tissues. Proc. Natl. Acad. Sci. USA 2005, 102, 4459–4464. [Google Scholar] [CrossRef] [Green Version]
  70. Tinti, C.; Yang, C.; Seo, H.; Conti, B.; Kim, C.; Joh, T.M.; Kim, K.S. Structure/function relationship of the cAMP response element in tyrosine hydroxylase gene transcription. J. Biol. Chem. 1997, 272, 19158–19164. [Google Scholar] [CrossRef] [Green Version]
  71. Seborova, K.; Kloudova-Spalenkova, A.; Koucka, K.; Holy, P.; Ehrlichova, M.; Wang, C.; Ojima, I.; Voleska, I.; Daniel, P.; Balusikova, K.; et al. The Role of TRIP6, ABCC3 and CPS1 Expression in Resistance of Ovarian Cancer to Taxanes. Int. J. Mol. Sci. 2021, 23, 73. [Google Scholar] [CrossRef]
Figure 1. Structural formulas of taxanes used in the study. (A) Paclitaxel; (B) Stony Brook Taxane 0035 (SB-T-0035). Substituents bound at the C10 position of the baccatin III core are highlighted by the red frame.
Genes 14 00296 g001
Figure 2. TRIP6 and ABCB1 are overexpressed in paclitaxel-resistant MCF-7 subline (PacR) and SB-T-0035-resistant MCF-7 (0035R) subline. (A) The DNA level of TRIP6 and ABCB1 plotted as ΔΔCt values (N = 5, 3 technical replicates). The dashed line represents the DNA level in parental MCF-7 cells. For ABCB1 in the 0035R subline, data were not corrected by the TERT reference gene DNA level. The numbers below the zig–zag lines represent DNA level difference between PacR and 0035R sublines. Statistical analysis was performed using the one-sample t-test (#) and paired t-test (*). (B) TRIP6 and ABCB1 mRNA expression level was plotted as delta-delta threshold cycle (ΔΔCt) values (N = 4, 3 technical replicates). Dashed lines represent TRIP6 or ABCB1 expression in MCF-7 cells. The mean and 95% confidence interval (CI) are shown. The numbers below the zig–zag lines represent the mRNA expression level difference between PacR and 0035R sublines. Statistical significance was tested using the one-sample t-test (#) and paired t-test (*). (C) Western blot analysis of ABCB1 transporter and TRIP6 in MCF-7 cells and taxane-resistant MCF-7 sublines. The numbers displayed below each representative Western blot mean the fold change of band volume normalized to β-actin level (N = 4); (D) * p < 0.05, ** p < 0.01. ## p < 0.01, ### p < 0.001.
Genes 14 00296 g002
Figure 3. TRIP6 and ABCB1 possess increased copy numbers in parental MCF-7 cell line. (A) Multicolor fluorescence in situ hybridization (FISH) analysis of representative metaphase chromosomes of MCF-7 cells. (B) Multicolor banding (mBAND) of chromosome 7 analysis of representative metaphase chromosomes of MCF-7 cells. (C) Dual FISH analysis of representative metaphase chromosomes of MCF-7 cells. Labeled chromosomes are shown in detail. Arrows point to TRIP6 loci. Detected signals come from a probe specific to ABCB1 (green), TRIP6 (aqua), and the centromere of chromosome 7 (red).
Genes 14 00296 g003
Figure 4. Co-amplification of TRIP6 and ABCB1 genes in taxane-resistant MCF-7 sublines (PacR, 0035R). Representative metaphase chromosomes of PacR subline analyzed by (A) multicolor fluorescence in situ hybridization (mFISH), (B) multicolor band (mBAND) of chromosome 7, and (C) dual FISH. Representative metaphase chromosome of 0035R subline analyzed by (D) mFISH, (E) mBAND of chromosome 7, and (F) dual FISH.The white arrows point at homogeneously staining regions (HSRs) harboring the ABCB1 and TRIP6 genes. Labeled chromosomes are shown in detail. Detected signals come from a probe specific to ABCB1 (green), TRIP6 (aqua), and the centromere of chromosome 7 (red).
Genes 14 00296 g004
Figure 5. The TRIP6 proximal promoter governs TRIP6 transcription in parental MCF-7 cell line as well as in taxane-resistant MCF-7 sublines (PacR, 0035R). Schematic diagrams of the 5′ and 3′ truncated constructs (on the left) and scatter dot plots showing normalized luciferase activities (Fluc2P/Nluc) relative to the construct −157/−12 (on the right). The cloned sequence −936/−12 encompasses an intergenic region (white box, sequence −12 to −375) and a part of the SLC12A9 upstream gene (black box, sequence −376 to −936). minP refers to synthetic minimal TATA box promoter. The mean and 95% confidence interval (CI) are displayed for each construct (N = 4, 3 technical replicates). Empty vector pGL4.24[luc2P/minP] served as a mock. Statistical significance was tested using the one-way blocked ANOVA with Geisser–Greenhouse correction followed by Tukey’s post hoc test on log-transformed data. * p < 0.05, ** p < 0.01, *** p < 0.001.
Genes 14 00296 g005
Figure 6. Cyclic AMP response element (CRE) regulates TRIP6 proximal promoter activity in parental MCF-7 cell line as well as in taxane-resistant MCF-7 sublines (PacR, 0035R). (A) Predicted cis-regulatory elements in the human TRIP6 proximal promoter sequence (GRCh38.p12) (on the left). The sequence also includes a 5′ untranslated region and TRIP6 start codon. CpG dinucleotides and start codon are highlighted in bold. TSS means TRIP6 transcription start. E box refers to enhancer box, CT box refers to CT-rich sequence, AP-1 site refers to Activator protein 1, M-CAT refers to muscle-CAT element (in reverse orientation), CRE refers to cyclic AMP response element, GC-box refers to GC-rich sequence. Schematic diagrams of the TRIP6 proximal promoter with wild-type CRE or mutated CRE motif (on the right). Colored rectangles correspond to predicted cis-acting gene regulatory elements positioned at the 5′ flanking sequence of TRIP6. (B) Scatter dot plots showing Fluc2P/Nluc activities relative to the −157/−12 construct (on the right). minP refers to synthetic minimal TATA box promoter. The mean and 95% confidence interval (CI) are displayed for each construct (N = 4, 3 technical replicates). Empty vector pGL4.24[luc2P/minP] served as a mock. Statistical significance was tested using the one-way blocked ANOVA with Geisser–Greenhouse correction followed by Tukey’s post hoc test on log-transformed data. * p < 0.05, ** p < 0.01, *** p < 0.001.
Genes 14 00296 g006
Figure 7. The TRIP6 proximal promoter is stable hypomethylated in parental MCF-7 cell line as well as in taxane-resistant MCF-7 sublines (PacR, 0035R); (A) Schematic diagram (top) displaying the position of individual CpG dinucleotides (grey circles) in TRIP6-SLC12A9 intergenic region (white rectangle, −376 to −1) and TRIP6 exon 1 (black rectangle, +1 to +220). Methylation status of CpG sites estimated by bisulfite sequencing (bottom). In vitro methylated human diploid DNA served as an internal control (mock). The black arrow points CpG dinucleotide within the CRE motif. The white circles depict non-methylated CpG dinucleotides. Black circles depict methylated CpG dinucleotides. Analyzed CpG dinucleotides are shown as blue circles. Arrows indicate the position of the used primer pair. TSS means TRIP6 transcription start. (B) Correlation of TRIP6 mRNA level (normalized to RNA-Seq by Expectation–Maximization method, RSEM) with TRIP6 methylation (HM450 Illumina Platform) in The Cancer Genome Atlas (TCGA) breast cancer study (N = 552). VUS refers to a variant of unknown significance. Shallow deletion refers to possible heterozygous deletion. Deep deletion refers to possible homozygous deletion. The graph was generated in the cBioPortal platform.
Genes 14 00296 g007
Figure 8. TRIP6 expression in breast cancer samples. (A) TRIP6 protein expression in 20 breast tumor samples. The numbers displayed below the TRIP6 Western blot represent the TRIP6 level normalized to the β-actin level. (B) Correlation of TRIP6 mRNA level versus TRIP6 protein in 13 breast cancer samples. Spearman’s correlation coefficient and statistical significance (p-value) are shown.
Genes 14 00296 g008
Figure 9. Chromosomal aberrations and cis-regulatory elements in the TRIP6 promoter contribute to enhanced TRIP6 expression in parental MCF-7 cells and taxane-resistant MCF-7 sublines. (A) In MCF-7 cells, copy number gain (on the left) and the activity of the cyclic AMP response element (on the right) in the hypomethylated TRIP6 proximal promoter contribute to high TRIP6 expression. The role of other putative transcription factor binding sites remains elusive. (B) In MCF-7 sublines, TRIP6/ABCB1 co-amplification led to the formation of a homogeneously stained region in chromosome 3 (PacR) or 19 (0035R) (on the left). In contrast, the activity of elements in the hypomethylated TRIP6 promoter remained unchanged except for the region containing the putative AP-1 site (on the right). Dots represent TRIP6 loci (blue) and ABCB1 loci (green). The red area refers to chromosome 7 centromere. The black area refers to chromosome 15 (in MCF-7 and taxane-resistant MCF-7 cells) or chromosome 6 segments (in taxane-resistant MCF-7 cells only).
Genes 14 00296 g009
Table 1. Composite karyotype of parental MCF-7 cell line. Differences to taxane-resistant MCF-7 sublines are highlighted in bold.
Cell LineComposite Karyotype
MCF-7
67~69 <3n>
X,-X,der(X)t(X;7)(p11.2;p15.3)del(X)(q21.3q28),der(1)t(9;20)(?;?)t(1;20)(p12;?)t(1;9)(q21;?),+2,der(2)t(2;3)(q?34;?),der(2)t(2;7)(p?;q32)t(2;14)(q36;q?),der(2)t(2;14)(q36;q?),der(3)del(3)(p?13p?26)t(3;6)(q27;q25),t(4;5)(q?31;p13),-6,der(6)t(3;6)(q27;q25),-7,der(7)t(7;7)(p15;?)ins(7;15)(p;?),der(8)t(8;15)(p11.2;q?)x2,der(8)t(8;16)(q?24;?),-9,der(9)t(8;9)(q?;p22),der(10)t(3;6)(?;?)t(6;10)(?;p14),der(10)t(7;10)(p21,p14),der(11)t(11;16)(p11.2;?)t(8;11)(q11.2;q13),+12,der(12)t(1;17)(?;?)t(1;9)(?;?)t(9;12)(?;p11.2),der(12)t(8;12)(?;p11.2)t(5;12)(?;q?21),+13,del(13)(q?22q?34)x2,der(13)t(6;13)(?;p11.2),-14,+15,der(15)t(15;16)(p11.2;q?)del(15)(q?22.3q?26),der(15)t(15;21)(p11.2;q?21),der(16)del(16)(p?13)del(16)(q?21),der(17)t(17;20)(q?24;?)t(1;20)(?;?)t(1;21)(?;?),+18,der(18)del(18)(p?11.2)del(18)(q?11.2),dup(18)(q?q?),der(18)t(18;22)(p11.2;q11.2),der(19)t(12;19)(q13;p13.3),der(19)t(11;14)(?;q?)t(11;19)(?;p12),+20,der(20)t(1;21)(?;q?)t(1;20)(?;p11.2)x2,-21,der(22)t(6;22)(?;q11.2),der(22)t(7;22)(q22;q11.2)x2[cp20]
Table 2. Composite karyotype of taxane-resistant MCF-7 sublines. Differences to parental MCF-7 cell line are highlighted in bold.
Cell SublineComposite Karyotype
PacR
67-68 <3n>
X,-X,der(X)t(X;7)(p11.2;p15.3)del(X)(q21.3q28),der(1)t(9;20)(?;?)t(1;20)(p12;?)t(1;9)(q21;?),+2,der(2)t(2;3)(q?34;?),der(2)t(2;7)(p?;q32)t(2;5)(q?;?),der(2)t(2;14)(q36;q?),der(3)del(3)(p?13p?26)t(3;6)(q27;q25),ins(3;7)(q?23;q11.2q22),t(4;5)(q?31;p13),-6,der(6)t(3;6)(q27;q25),der(7)t(6;7)(?;q11.2),der(7)t(7;7)(p15;?)ins(7;15)(p;?),der(7)del(7)(p12)del(7)(q11.1),der(8)t(8;15)(p11.2;q?)x2,-9,der(9)t(8;9)(q?;p22),der(10)t(7;10)(p21;p14),der(11)t(11;16)(p11.2;?)t(8;11)(q11.2;q13),+12,der(12)t(1;17)(?;?)t(1;9)(?;?)t(9;12)(?;p11.2),der(12)t(8;12)(?;p11.2)t(5;12)(?;q?21),del(13)(q?22q?34),der(13)t(6;13)(?;p11.2),-14,der(15)t(15;16)(p11.2;q?),der(15)t(15;16)(p11.2;q?)del(15)(q?22.3q?26),+16,der(16)del(16)(p?13)del(16)(q?21)x2,der(16)t(13;16)(q?12;p11.2)t(7;16)(p15.3;q?13),-17,der(18)del(18)(p?11.2)del(18)(q?11.2),dup(18)(q?q?),der(19)t(12;19)(q13;p13.3),der(19)t(11;14)(?;q?)t(11;19)(?;p12),+20x2,der(20)t(1;7)(?;p21)t(1;20)(?;p11.2)x2,der(20)t(1;21)(?;q?)t(1;20)(?;p11.2),-21,der(22)t(6;22)(?;q11.2),der(22)t(7;22)(q22;q11.2)x2[cp8]
0035R
67~70 <3n>
X,-X,der(X)t(X;20)(p11.2;?)del(X)(q21.3q28),der(1)t(9;20)(?;?)t(1;20)(p12;?)t(1;9)(q21;?),+2,der(2)t(2;3)(q?34;?),der(2)t(2;7)(p?12;q32)del(2)(q36),der(2)t(2;14)(q36;q?),der(3)del(3)(p?13p?26)t(3;6)(q27;q25),t(4;5)(q?31;p13),der(5)t(1;5)(q?13)t(1;20)(?;q?),-6,der(6)t(6;11)(p?21;q?)t(3;6)(q27;q25),der(7)t(6;7)(?;q11.2),der(7)t(7;7)(p15;?)ins(7;15)(p;?),der(7)del(7)(p12)del(7)(q11.1),der(8)t(8;15)(p11.2;q?)x2,-9,der(9)t(8;9)(q?;p22),der(10)t(7;10)(p21;p14),der(11)t(11;16)(p11.2;?)t(8;11)(q11.2;q13),+12,der(12)t(1;17)(?;?)t(1;9)(?;?)t(9;12)(?;p11.2),der(12)t(8;12)(?;p11.2)t(5;12)(?;q?21),+13,del(13)(q?22q?34)x2,der(13)t(6;13)(?;p11.2),-14,+15,der(15)t(15;16)(p11.2;q?)del(15)(q?22.3q?26),der(15)t(5;7)(?;p22)t(7;15)(p22;p11.2),der(16)del(16)(p?13)del(16)(q?21),der(17)t(17;20)(q?24;?)t(7;20)(p22;?),der(18)del(18)(p?11.2)del(18)(q?11.2),dup(18)(q?q?),+19,der(19)t(12;19)(q13;p13.3),der(19)t(11;14)(?;q?)t(11;19)(?;p12),der(19)t(5;7)(?;q21)t(7;19)(q21;p13.3),+20,der(20)t(1;21)(?;q?)t(1;20)(?;p11.2),der(20)t(5;20)(?;p?12),-21,der(22)t(6;22)(?;q11.2),der(22)t(7;22)(q22;q11.2),der(22)t(7;22)(q22;p11.2)t(7;22)(q22;q11.2)[cp12]
Table 3. Altered TRIP6 methylation level between parental MCF-7 cells and taxane-resistant MCF-7 sublines (PacR, 0035R). The absolute β value (|Δβ|) is defined as difference between β value of MCF-7 cells and PacR cells, or MCF-7 cells and 0035R cells. Statistical analysis results include p-value and false discovery rate (FDR). Ns means statistically insignificant result.
Region *MCF-7 vs. PacRMCF-7 vs. 0035R
|Δβ|p-ValueFDR|Δβ|p-ValueFDR
Whole gene0.410.0040.0250.360.2ns
1st exon0.230.121ns0.010.439ns
Body0.120.248ns0.110.248ns
TSS15000.490.020.0250.360.0020.008
TSS2000.400.05ns0.050.05ns
* Gene regions as defined in Results section.
Table 4. Clinicopathological characteristics of 95 breast carcinoma patients.
CharacteristicsBreast Carcinoma Set
Mean age at diagnosis, years56.0 ± 10.7
Menopausal statusN (%)
Premenopausal27 (28.4)
Postmenopausal66 (69.5)
Not available2 (2.1)
Histological typeN (%)
Invasive ductal carcinoma80 (84.2)
Others15 (15.8)
Histological gradeN (%)
G113 (13.7)
G259 (62.1)
G322 (23.1)
Not available1 (1.1)
StageN (%)
I31 (32.6)
II59 (62.1)
III4 (4.2)
IV1 (1.1)
Estrogen receptor statusN (%)
Positive86 (90.5)
Negative9 (9.5)
Progesterone receptor statusN (%)
Positive70 (73.7)
Negative25 (26.3)
ERBB2 statusN (%)
Positive27 (28.4)
Negative68 (71.6)
Ki67 status1N (%)
Positive70 (73.7)
Negative13 (13.7)
Unknown12 (12.6)
Molecular subtypeN (%)
Luminal A60 (63.2)
Luminal B26 (27.3)
ERBB27 (7.4)
Triple negative2 (2.1)
Therapeutic regimensN (%)
Neoadjuvant (NACT) 213 (13.7)
Adjuvant (ACT)82 (86.3)
RelapseN (%)
Yes9 (9.5)
No86 (90.5)
Overall survival (OS)
Mean (months) ± SD70.9 ± 28.0
Disease-free survival (DFS)
Mean (months) ± SD61.1 ± 28.4
1 The cut-off score was 13.25% [38]. 2 Including the individual in stage IV and undergoing a palliative care.
Table 5. Significant associations of intratumoral TRIP6 mRNA level with clinical data of breast carcinoma patients in the adjuvant chemotherapy group (N = 82).
CharacteristicsTRIP6 Expression Relative to IPO8 and MRPL19Significance
(Mann–Whitney)
Premenopausal1.05 ± 0.590.033
Postmenopausal0.77 ± 0.49
Progesterone receptor
positive
0.93 ± 0.560.020
Progesterone receptor
negative
0.61 ± 0.34
Disclaimer/Publisher’s Note: The statements, opinions and data contained in all publications are solely those of the individual author(s) and contributor(s) and not of MDPI and/or the editor(s). MDPI and/or the editor(s) disclaim responsibility for any injury to people or property resulting from any ideas, methods, instructions or products referred to in the content.

