
Optical Genome Mapping as a Tool to Unveil New Molecular Findings in Hematological Patients with Complex Chromosomal Rearrangements

 ,
,  ,
,  ,
,  ,
,  ,
,  ,
,  , and
, and 
Abstract
1. Introduction
2. Materials and Methods
2.1. Patients
2.1.1. Case 1
2.1.2. Case 2
2.2. Chromosome Banding Analysis (CBA)
2.3. Fluorescence In Situ Hybridization (FISH) Analysis
2.4. Multicolor FISH (M-FISH) Studies
2.5. Optical Genome Mapping (OGM) Analysis
2.6. Expression Analysis by Reverse Transcription-PCR (RT-PCR)
2.7. Immunohistochemistry (IHC) Experiment on Bone Marrow Biopsy: Myc Protein Expression
3. Results
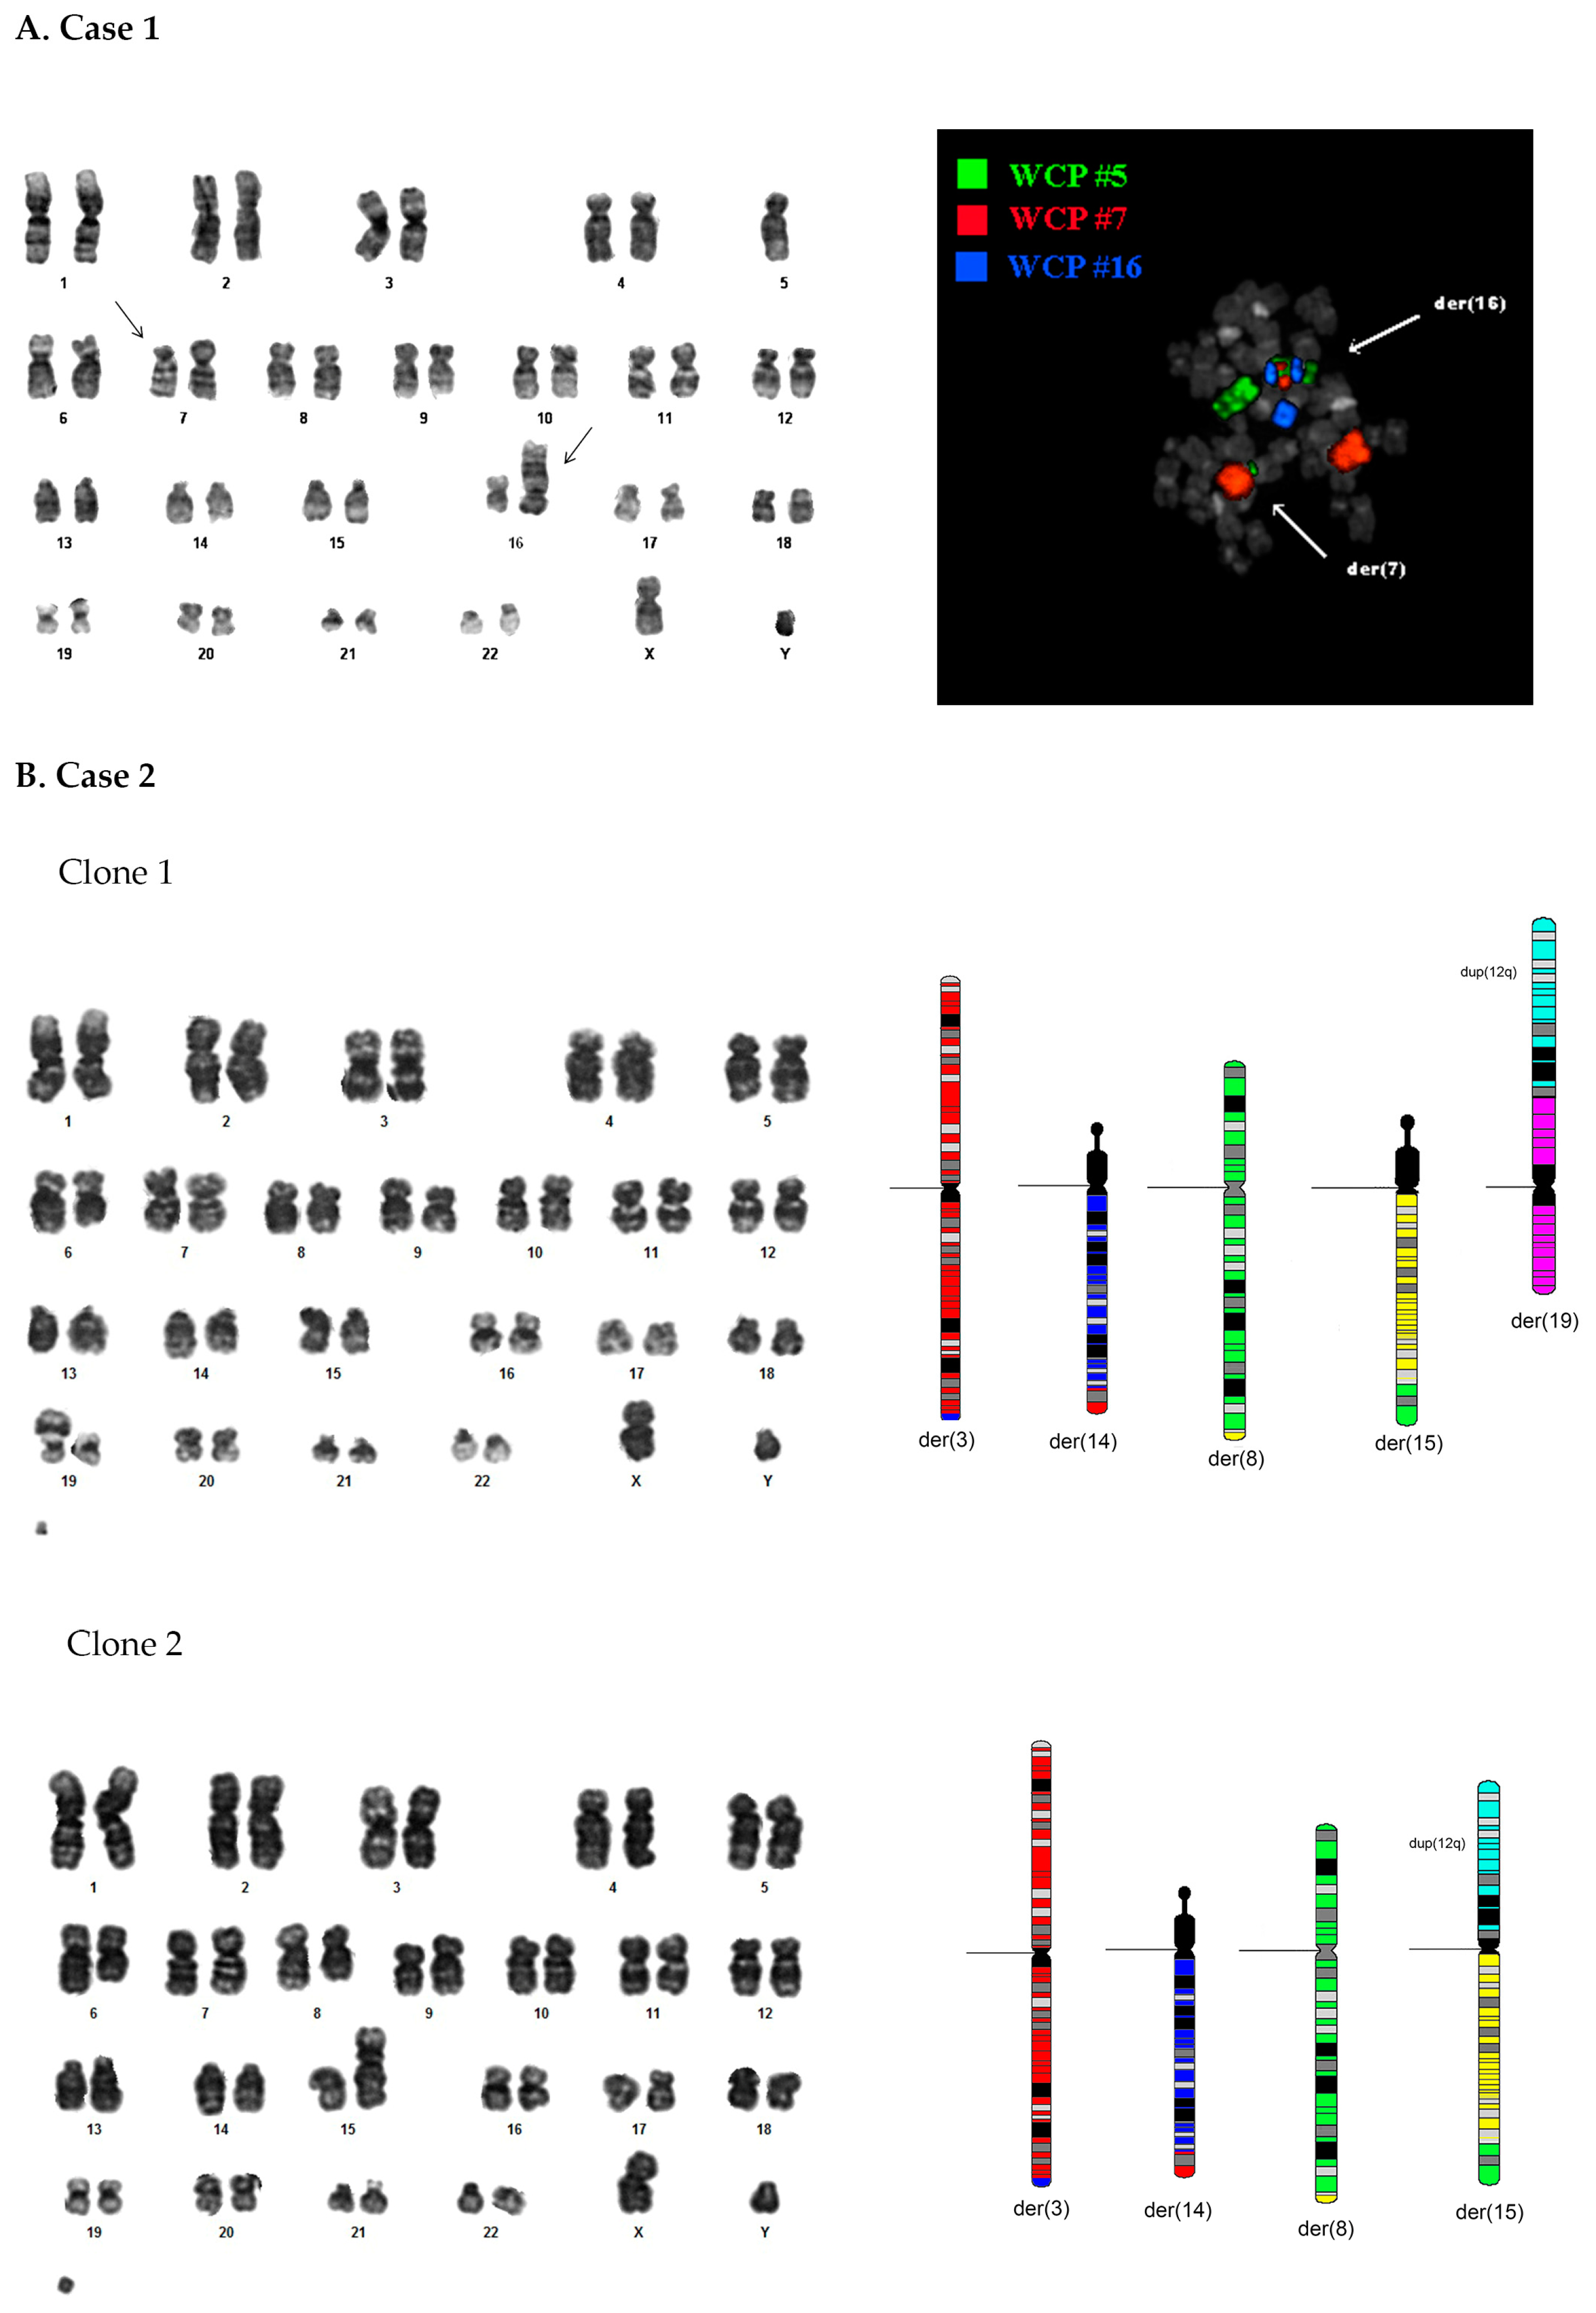
3.1. Case 1
3.1.1. Standard Cytogenetic Analyses
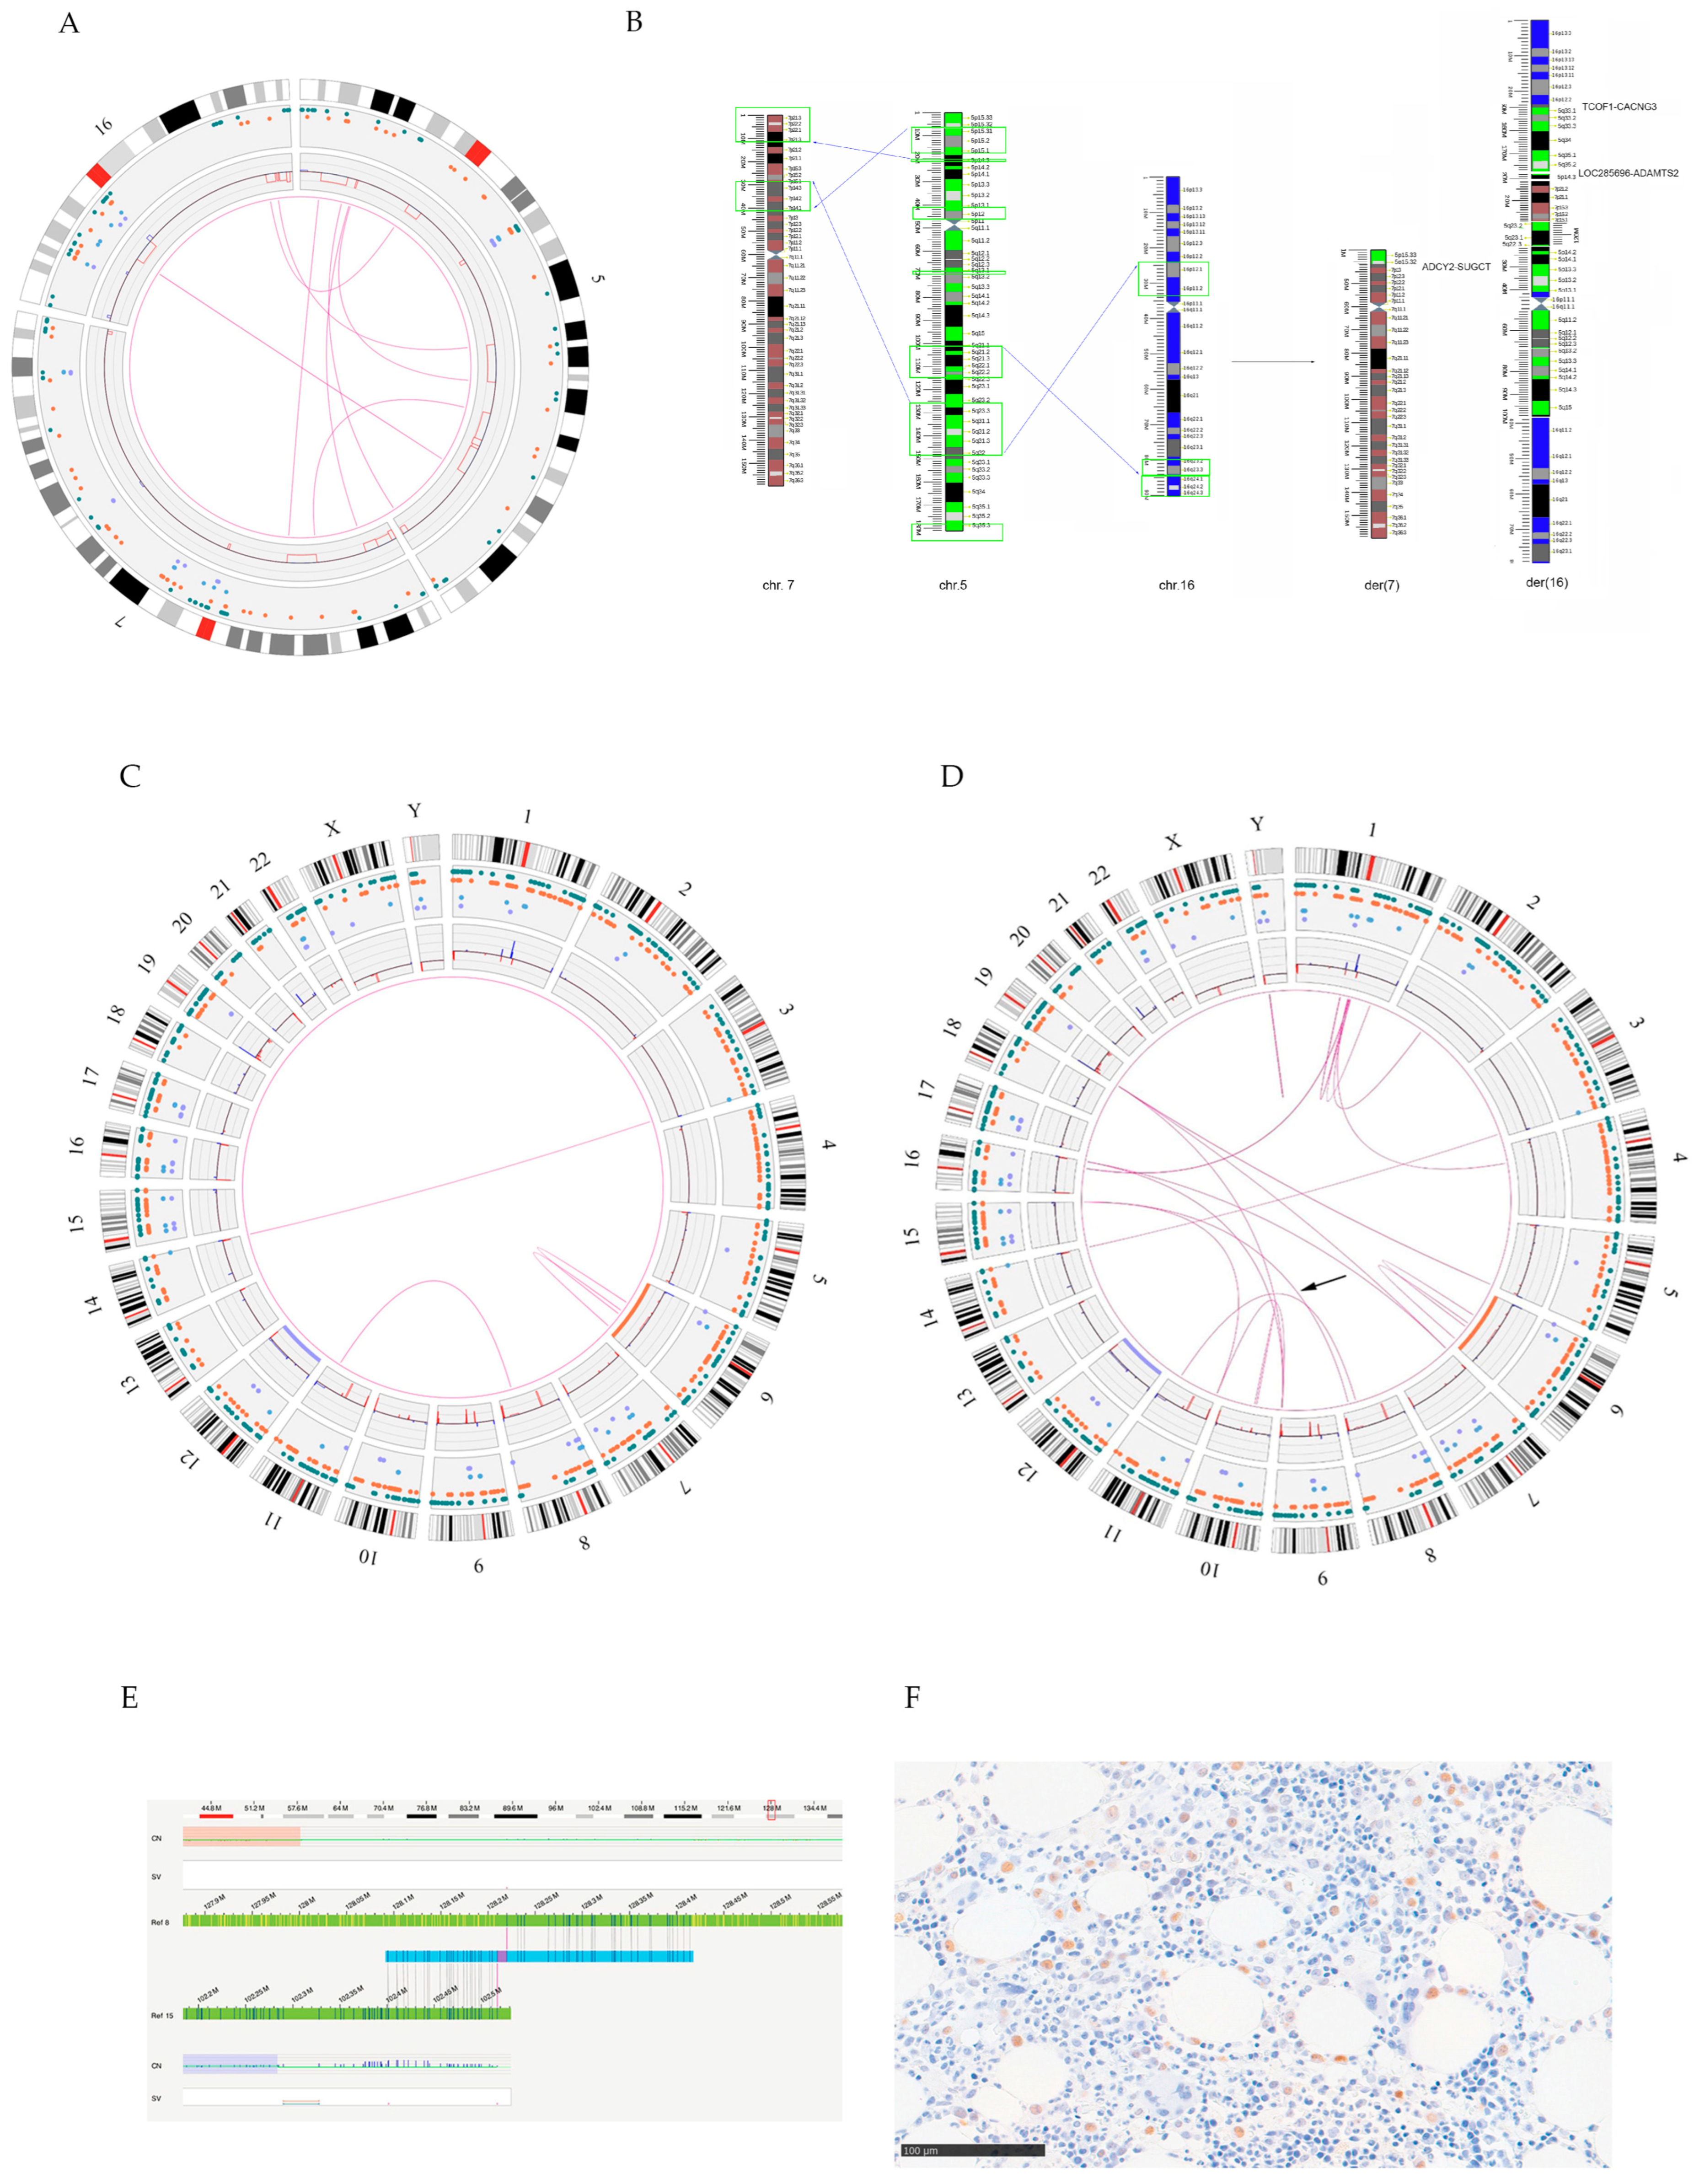
3.1.2. OGM Analysis
3.2. Case 2
3.2.1. Standard Cytogenetic Analyses
3.2.2. OGM Analysis
4. Discussion
5. Conclusions
Supplementary Materials
Author Contributions
Funding
Institutional Review Board Statement
Informed Consent Statement
Data Availability Statement
Conflicts of Interest
References
- Greenberg, P.L.; Tuechler, H.; Schanz, J.; Sanz, G.; Garcia-Manero, G.; Solé, F.; Bennett, J.M.; Bowen, D.; Fenaux, P.; Dreyfus, F.; et al. Revised International Prognostic Scoring System for Myelodysplastic Syndromes. Blood 2012, 120, 2454–2465. [Google Scholar] [CrossRef] [PubMed]
- Haase, D.; Germing, U.; Schanz, J.; Pfeilstöcker, M.; Nösslinger, T.; Hildebrandt, B.; Kundgen, A.; Lübbert, M.; Kunzmann, R.; Giagounidis, A.A.N.; et al. New Insights into the Prognostic Impact of the Karyotype in MDS and Correlation with Subtypes: Evidence from a Core Dataset of 2124 Patients. Blood 2007, 110, 4385–4395. [Google Scholar] [CrossRef] [PubMed]
- Schanz, J.; Tüchler, H.; Solé, F.; Mallo, M.; Luño, E.; Cervera, J.; Granada, I.; Hildebrandt, B.; Slovak, M.L.; Ohyashiki, K.; et al. New Comprehensive Cytogenetic Scoring System for Primary Myelodysplastic Syndromes (MDS) and Oligoblastic Acute Myeloid Leukemia after MDS Derived from an International Database Merge. J. Clin. Oncol. 2012, 30, 820–829. [Google Scholar] [CrossRef] [PubMed]
- He, R.; Wiktor, A.E.; Hanson, C.A.; Ketterling, R.P.; Kurtin, P.J.; Van Dyke, D.L.; Litzow, M.R.; Howard, M.H.; Reichard, K.K. Conventional Karyotyping and Fluorescence In Situ Hybridization: An Effective Utilization Strategy in Diagnostic Adult Acute Myeloid Leukemia. Am. J. Clin. Pathol. 2015, 143, 873–878. [Google Scholar] [CrossRef] [PubMed]
- Coleman, J.F.; Theil, K.S.; Tubbs, R.R.; Cook, J.R. Diagnostic Yield of Bone Marrow and Peripheral Blood FISH Panel Testing in Clinically Suspected Myelodysplastic Syndromes and/or Acute Myeloid Leukemia: A Prospective Analysis of 433 Cases. Am. J. Clin. Pathol. 2011, 135, 915–920. [Google Scholar] [CrossRef] [PubMed]
- He, R.; Wiktor, A.E.; Durnick, D.K.; Kurtin, P.J.; Van Dyke, D.L.; Tefferi, A.; Patnaik, M.S.; Ketterling, R.P.; Hanson, C.A. Bone Marrow Conventional Karyotyping and Fluorescence In Situ Hybridization: Defining an Effective Utilization Strategy for Evaluation of Myelodysplastic Syndromes. Am. J. Clin. Pathol. 2016, 146, 86–94. [Google Scholar] [CrossRef]
- Baliakas, P.; Jeromin, S.; Iskas, M.; Puiggros, A.; Plevova, K.; Nguyen-Khac, F.; Davis, Z.; Matteo Rigolin, G.; Visentin, A.; Xochelli, A.; et al. Cytogenetic Complexity in Chronic Lymphocytic Leukemia: Definitions, Associations, and Clinical Impact. Blood 2019, 133, 1205–1216. [Google Scholar] [CrossRef]
- Moorman, A.V.; Harrison, C.J.; Buck, G.A.N.; Richards, S.M.; Secker-Walker, L.M.; Martineau, M.; Vance, G.H.; Cherry, A.M.; Higgins, R.R.; Fielding, A.K.; et al. Karyotype Is an Independent Prognostic Factor in Adult Acute Lymphoblastic Leukemia (ALL): Analysis of Cytogenetic Data from Patients Treated on the Medical Research Council (MRC) UKALLXII/Eastern Cooperative Oncology Group (ECOG) 2993 Trial. Blood 2007, 109, 3189–3197. [Google Scholar] [CrossRef]
- Wheeler, F.C.; Kim, A.S.; Mosse, C.A.; Shaver, A.C.; Yenamandra, A.; Seegmiller, A.C. Limited Utility of Fluorescence In Situ Hybridization for Recurrent Abnormalities in Acute Myeloid Leukemia at Diagnosis and Follow-Up. Am. J. Clin. Pathol. 2018, 149, 418–424. [Google Scholar] [CrossRef]
- Rack, K.A.; van den Berg, E.; Haferlach, C.; Beverloo, H.B.; Costa, D.; Espinet, B.; Foot, N.; Jeffries, S.; Martin, K.; O’Connor, S.; et al. European Recommendations and Quality Assurance for Cytogenomic Analysis of Haematological Neoplasms. Leukemia 2019, 33, 1851–1867. [Google Scholar] [CrossRef]
- Dremsek, P.; Schwarz, T.; Weil, B.; Malashka, A.; Laccone, F.; Neesen, J. Optical Genome Mapping in Routine Human Genetic Diagnostics—Its Advantages and Limitations. Genes 2021, 12, 1958. [Google Scholar] [CrossRef] [PubMed]
- Sahajpal, N.S.; Barseghyan, H.; Kolhe, R.; Hastie, A.; Chaubey, A. Optical Genome Mapping as a Next-Generation Cytogenomic Tool for Detection of Structural and Copy Number Variations for Prenatal Genomic Analyses. Genes 2021, 12, 398. [Google Scholar] [CrossRef] [PubMed]
- Neveling, K.; Mantere, T.; Vermeulen, S.; Oorsprong, M.; van Beek, R.; Kater-Baats, E.; Pauper, M.; van der Zande, G.; Smeets, D.; Weghuis, D.O.; et al. Next-Generation Cytogenetics: Comprehensive Assessment of 52 Hematological Malignancy Genomes by Optical Genome Mapping. Am. J. Hum. Genet. 2021, 108, 1423–1435. [Google Scholar] [CrossRef] [PubMed]
- Coccaro, N.; Anelli, L.; Zagaria, A.; Tarantini, F.; Cumbo, C.; Tota, G.; Minervini, C.F.; Minervini, A.; Conserva, M.R.; Redavid, I.; et al. Feasibility of Optical Genome Mapping in Cytogenetic Diagnostics of Hematological Neoplasms: A New Way to Look at DNA. Diagnostics 2023, 13, 1841. [Google Scholar] [CrossRef] [PubMed]
- Pellestor, F.; Gaillard, J.B.; Schneider, A.; Puechberty, J.; Gatinois, V. Chromoanagenesis, the Mechanisms of a Genomic Chaos. Semin. Cell Dev. Biol. 2022, 123, 90–99. [Google Scholar] [CrossRef] [PubMed]
- Stephens, P.J.; Greenman, C.D.; Fu, B.; Yang, F.; Bignell, G.R.; Mudie, L.J.; Pleasance, E.D.; Lau, K.W.; Beare, D.; Stebbings, L.A.; et al. Massive Genomic Rearrangement Acquired in a Single Catastrophic Event during Cancer Development. Cell 2011, 144, 27–40. [Google Scholar] [CrossRef] [PubMed]
- Ostapińska, K.; Styka, B.; Lejman, M. Insight into the Molecular Basis Underlying Chromothripsis. Int. J. Mol. Sci. 2022, 23, 3318. [Google Scholar] [CrossRef]
- Shen, M.M. Chromoplexy: A New Category of Complex Rearrangements in the Cancer Genome. Cancer Cell 2013, 23, 567–569. [Google Scholar] [CrossRef]
- Smith, A.C.; Neveling, K.; Kanagal-Shamanna, R. Optical Genome Mapping for Structural Variation Analysis in Hematologic Malignancies. Am. J. Hematol. 2022, 97, 975–982. [Google Scholar] [CrossRef]
- Khoury, J.D.; Solary, E.; Abla, O.; Akkari, Y.; Alaggio, R.; Apperley, J.F.; Bejar, R.; Berti, E.; Busque, L.; Chan, J.K.C.; et al. The 5th Edition of the World Health Organization Classification of Haematolymphoid Tumours: Myeloid and Histiocytic/Dendritic Neoplasms. Leukemia 2022, 36, 1703–1719. [Google Scholar] [CrossRef]
- Liehr, T. International System for Human Cytogenetic or Cytogenomic Nomenclature (ISCN): Some Thoughts. Cytogenet. Genome Res. 2021, 161, 223–224. [Google Scholar] [CrossRef] [PubMed]
- Lichter, P.; Tang, C.J.C.; Call, K.; Hermanson, G.; Evans, G.A.; Housman, D.; Ward, D.C. High-Resolution Mapping of Human Chromosome 11 by in Situ Hybridization with Cosmid Clones. Science 1990, 247, 64–69. [Google Scholar] [CrossRef]
- Lestringant, V.; Duployez, N.; Penther, D.; Luquet, I.; Derrieux, C.; Lutun, A.; Preudhomme, C.; West, M.; Ouled-Haddou, H.; Devoldere, C.; et al. Optical Genome Mapping, a Promising Alternative to Gold Standard Cytogenetic Approaches in a Series of Acute Lymphoblastic Leukemias. Genes Chromosomes Cancer 2021, 60, 657–667. [Google Scholar] [CrossRef] [PubMed]
- Barseghyan, H.; Tang, W.; Wang, R.T.; Almalvez, M.; Segura, E.; Bramble, M.S.; Lipson, A.; Douine, E.D.; Lee, H.; Délot, E.C.; et al. Next-Generation Mapping: A Novel Approach for Detection of Pathogenic Structural Variants with a Potential Utility in Clinical Diagnosis. Genome Med. 2017, 9, 90. [Google Scholar] [CrossRef] [PubMed]
- Chan, S.; Lam, E.; Saghbini, M.; Bocklandt, S.; Hastie, A.; Cao, H.; Holmlin, E.; Borodkin, M. Structural Variation Detection and Analysis Using Bionano Optical Mapping. In Methods in Molecular Biology; Humana Press Inc.: Totowa, NJ, USA, 2018; Volume 1833, pp. 193–203. [Google Scholar]
- Akkari, Y.M.N.; Baughn, L.B.; Dubuc, A.M.; Smith, A.C.; Mallo, M.; Dal Cin, P.; Diez Campelo, M.; Gallego, M.S.; Granada Font, I.; Haase, D.T.; et al. Guiding the Global Evolution of Cytogenetic Testing for Hematologic Malignancies. Blood 2022, 139, 2273–2284. [Google Scholar] [CrossRef] [PubMed]
- Shanmuganathan, N.; Wadham, C.; Shahrin, N.H.; Feng, J.; Thomson, D.; Wang, P.; Saunders, V.; Kok, C.H.; King, R.M.; Kenyon, R.R.; et al. Impact of Additional Genetic Abnormalities at Diagnosis of Chronic Myeloid Leukemia for First-Line Imatinib-Treated Patients Receiving Proactive Treatment Intervention. Haematologica 2023, 108, 2380–2395. [Google Scholar] [CrossRef] [PubMed]
- Albano, F.; Anelli, L.; Zagaria, A.; Coccaro, N.; Casieri, P.; Rossi, A.R.; Vicari, L.; Liso, V.; Rocchi, M.; Specchia, G. Non Random Distribution of Genomic Features in Breakpoint Regions Involved in Chronic Myeloid Leukemia Cases with Variant t(9;22) or Additional Chromosomal Rearrangements. Mol. Cancer 2010, 9, 120. [Google Scholar] [CrossRef]
- Albano, F.; Anelli, L.; Zagaria, A.; Coccaro, N.; D’Addabbo, P.; Liso, V.; Rocchi, M.; Specchia, G. Genomic Segmental Duplications on the Basis of the t(9;22) Rearrangement in Chronic Myeloid Leukemia. Oncogene 2010, 29, 2509–2516. [Google Scholar] [CrossRef][Green Version]
- Albano, F.; Anelli, L.; Zagaria, A.; Coccaro, N.; Minervini, A.; Rossi, A.R.; Specchia, G. Decreased TET2 Gene Expression during Chronic Myeloid Leukemia Progression. Leuk. Res. 2011, 35, e220–e222. [Google Scholar] [CrossRef]
- Nilius-Eliliwi, V.; Gerding, W.M.; Schroers, R.; Nguyen, H.P.; Vangala, D.B. Optical Genome Mapping for Cytogenetic Diagnostics in AML. Cancers 2023, 15, 1684. [Google Scholar] [CrossRef]
- Rack, K.; De Bie, J.; Ameye, G.; Gielen, O.; Demeyer, S.; Cools, J.; De Keersmaecker, K.; Vermeesch, J.R.; Maertens, J.; Segers, H.; et al. Optimizing the Diagnostic Workflow for Acute Lymphoblastic Leukemia by Optical Genome Mapping. Am. J. Hematol. 2022, 97, 548–561. [Google Scholar] [CrossRef] [PubMed]
- Yi, D.; Nam, J.W.; Jeong, H. Toward the Functional Interpretation of Somatic Structural Variations: Bulk- and Single-Cell Approaches. Brief. Bioinform. 2023, 24, bbad297. [Google Scholar] [CrossRef] [PubMed]
- Lühmann, J.L.; Stelter, M.; Wolter, M.; Kater, J.; Lentes, J.; Bergmann, A.K.; Schieck, M.; Göhring, G.; Möricke, A.; Cario, G.; et al. The Clinical Utility of Optical Genome Mapping for the Assessment of Genomic Aberrations in Acute Lymphoblastic Leukemia. Cancers 2021, 13, 4388. [Google Scholar] [CrossRef] [PubMed]
- Campo, E.; Jaffe, E.S.; Cook, J.R.; Quintanilla-Martinez, L.; Swerdlow, S.H.; Anderson, K.C.; Brousset, P.; Cerroni, L.; de Leval, L.; Dirnhofer, S.; et al. The International Consensus Classification of Mature Lymphoid Neoplasms: A Report from the Clinical Advisory Committee. Blood 2022, 140, 1229–1253. [Google Scholar] [CrossRef]
- Sahajpal, N.S.; Mondal, A.K.; Tvrdik, T.; Hauenstein, J.; Shi, H.; Deeb, K.K.; Saxe, D.; Hastie, A.R.; Chaubey, A.; Savage, N.M.; et al. Clinical Validation and Diagnostic Utility of Optical Genome Mapping for Enhanced Cytogenomic Analysis of Hematological Neoplasms. J. Mol. Diagn. 2022, 24, 1279–1291. [Google Scholar] [CrossRef]
- Stevens, J.B.; Liu, G.; Abdallah, B.Y.; Horne, S.D.; Ye, K.J.; Bremer, S.W.; Ye, C.J.; Krawetz, S.A.; Heng, H.H. Unstable Genomes Elevate Transcriptome Dynamics. Int. J. Cancer 2014, 134, 2074–2087. [Google Scholar] [CrossRef]
- Ye, C.J.; Stilgenbauer, L.; Moy, A.; Liu, G.; Heng, H.H. What Is Karyotype Coding and Why Is Genomic Topology Important for Cancer and Evolution? Front. Genet. 2019, 10, 1082. [Google Scholar] [CrossRef]


Disclaimer/Publisher’s Note: The statements, opinions and data contained in all publications are solely those of the individual author(s) and contributor(s) and not of MDPI and/or the editor(s). MDPI and/or the editor(s) disclaim responsibility for any injury to people or property resulting from any ideas, methods, instructions or products referred to in the content. |
© 2023 by the authors. Licensee MDPI, Basel, Switzerland. This article is an open access article distributed under the terms and conditions of the Creative Commons Attribution (CC BY) license (https://creativecommons.org/licenses/by/4.0/).
Share and Cite
Coccaro, N.; Zagaria, A.; Anelli, L.; Tarantini, F.; Tota, G.; Conserva, M.R.; Cumbo, C.; Parciante, E.; Redavid, I.; Ingravallo, G.; et al. Optical Genome Mapping as a Tool to Unveil New Molecular Findings in Hematological Patients with Complex Chromosomal Rearrangements. Genes 2023, 14, 2180. https://doi.org/10.3390/genes14122180
Coccaro N, Zagaria A, Anelli L, Tarantini F, Tota G, Conserva MR, Cumbo C, Parciante E, Redavid I, Ingravallo G, et al. Optical Genome Mapping as a Tool to Unveil New Molecular Findings in Hematological Patients with Complex Chromosomal Rearrangements. Genes. 2023; 14(12):2180. https://doi.org/10.3390/genes14122180
Chicago/Turabian StyleCoccaro, Nicoletta, Antonella Zagaria, Luisa Anelli, Francesco Tarantini, Giuseppina Tota, Maria Rosa Conserva, Cosimo Cumbo, Elisa Parciante, Immacolata Redavid, Giuseppe Ingravallo, and et al. 2023. "Optical Genome Mapping as a Tool to Unveil New Molecular Findings in Hematological Patients with Complex Chromosomal Rearrangements" Genes 14, no. 12: 2180. https://doi.org/10.3390/genes14122180
APA StyleCoccaro, N., Zagaria, A., Anelli, L., Tarantini, F., Tota, G., Conserva, M. R., Cumbo, C., Parciante, E., Redavid, I., Ingravallo, G., Minervini, C. F., Minervini, A., Specchia, G., Musto, P., & Albano, F. (2023). Optical Genome Mapping as a Tool to Unveil New Molecular Findings in Hematological Patients with Complex Chromosomal Rearrangements. Genes, 14(12), 2180. https://doi.org/10.3390/genes14122180