
Loss of the KN Motif and AnKyrin Repeat Domain 1 (KANK1) Leads to Lymphoid Compartment Dysregulation in Murine Model

 , , and
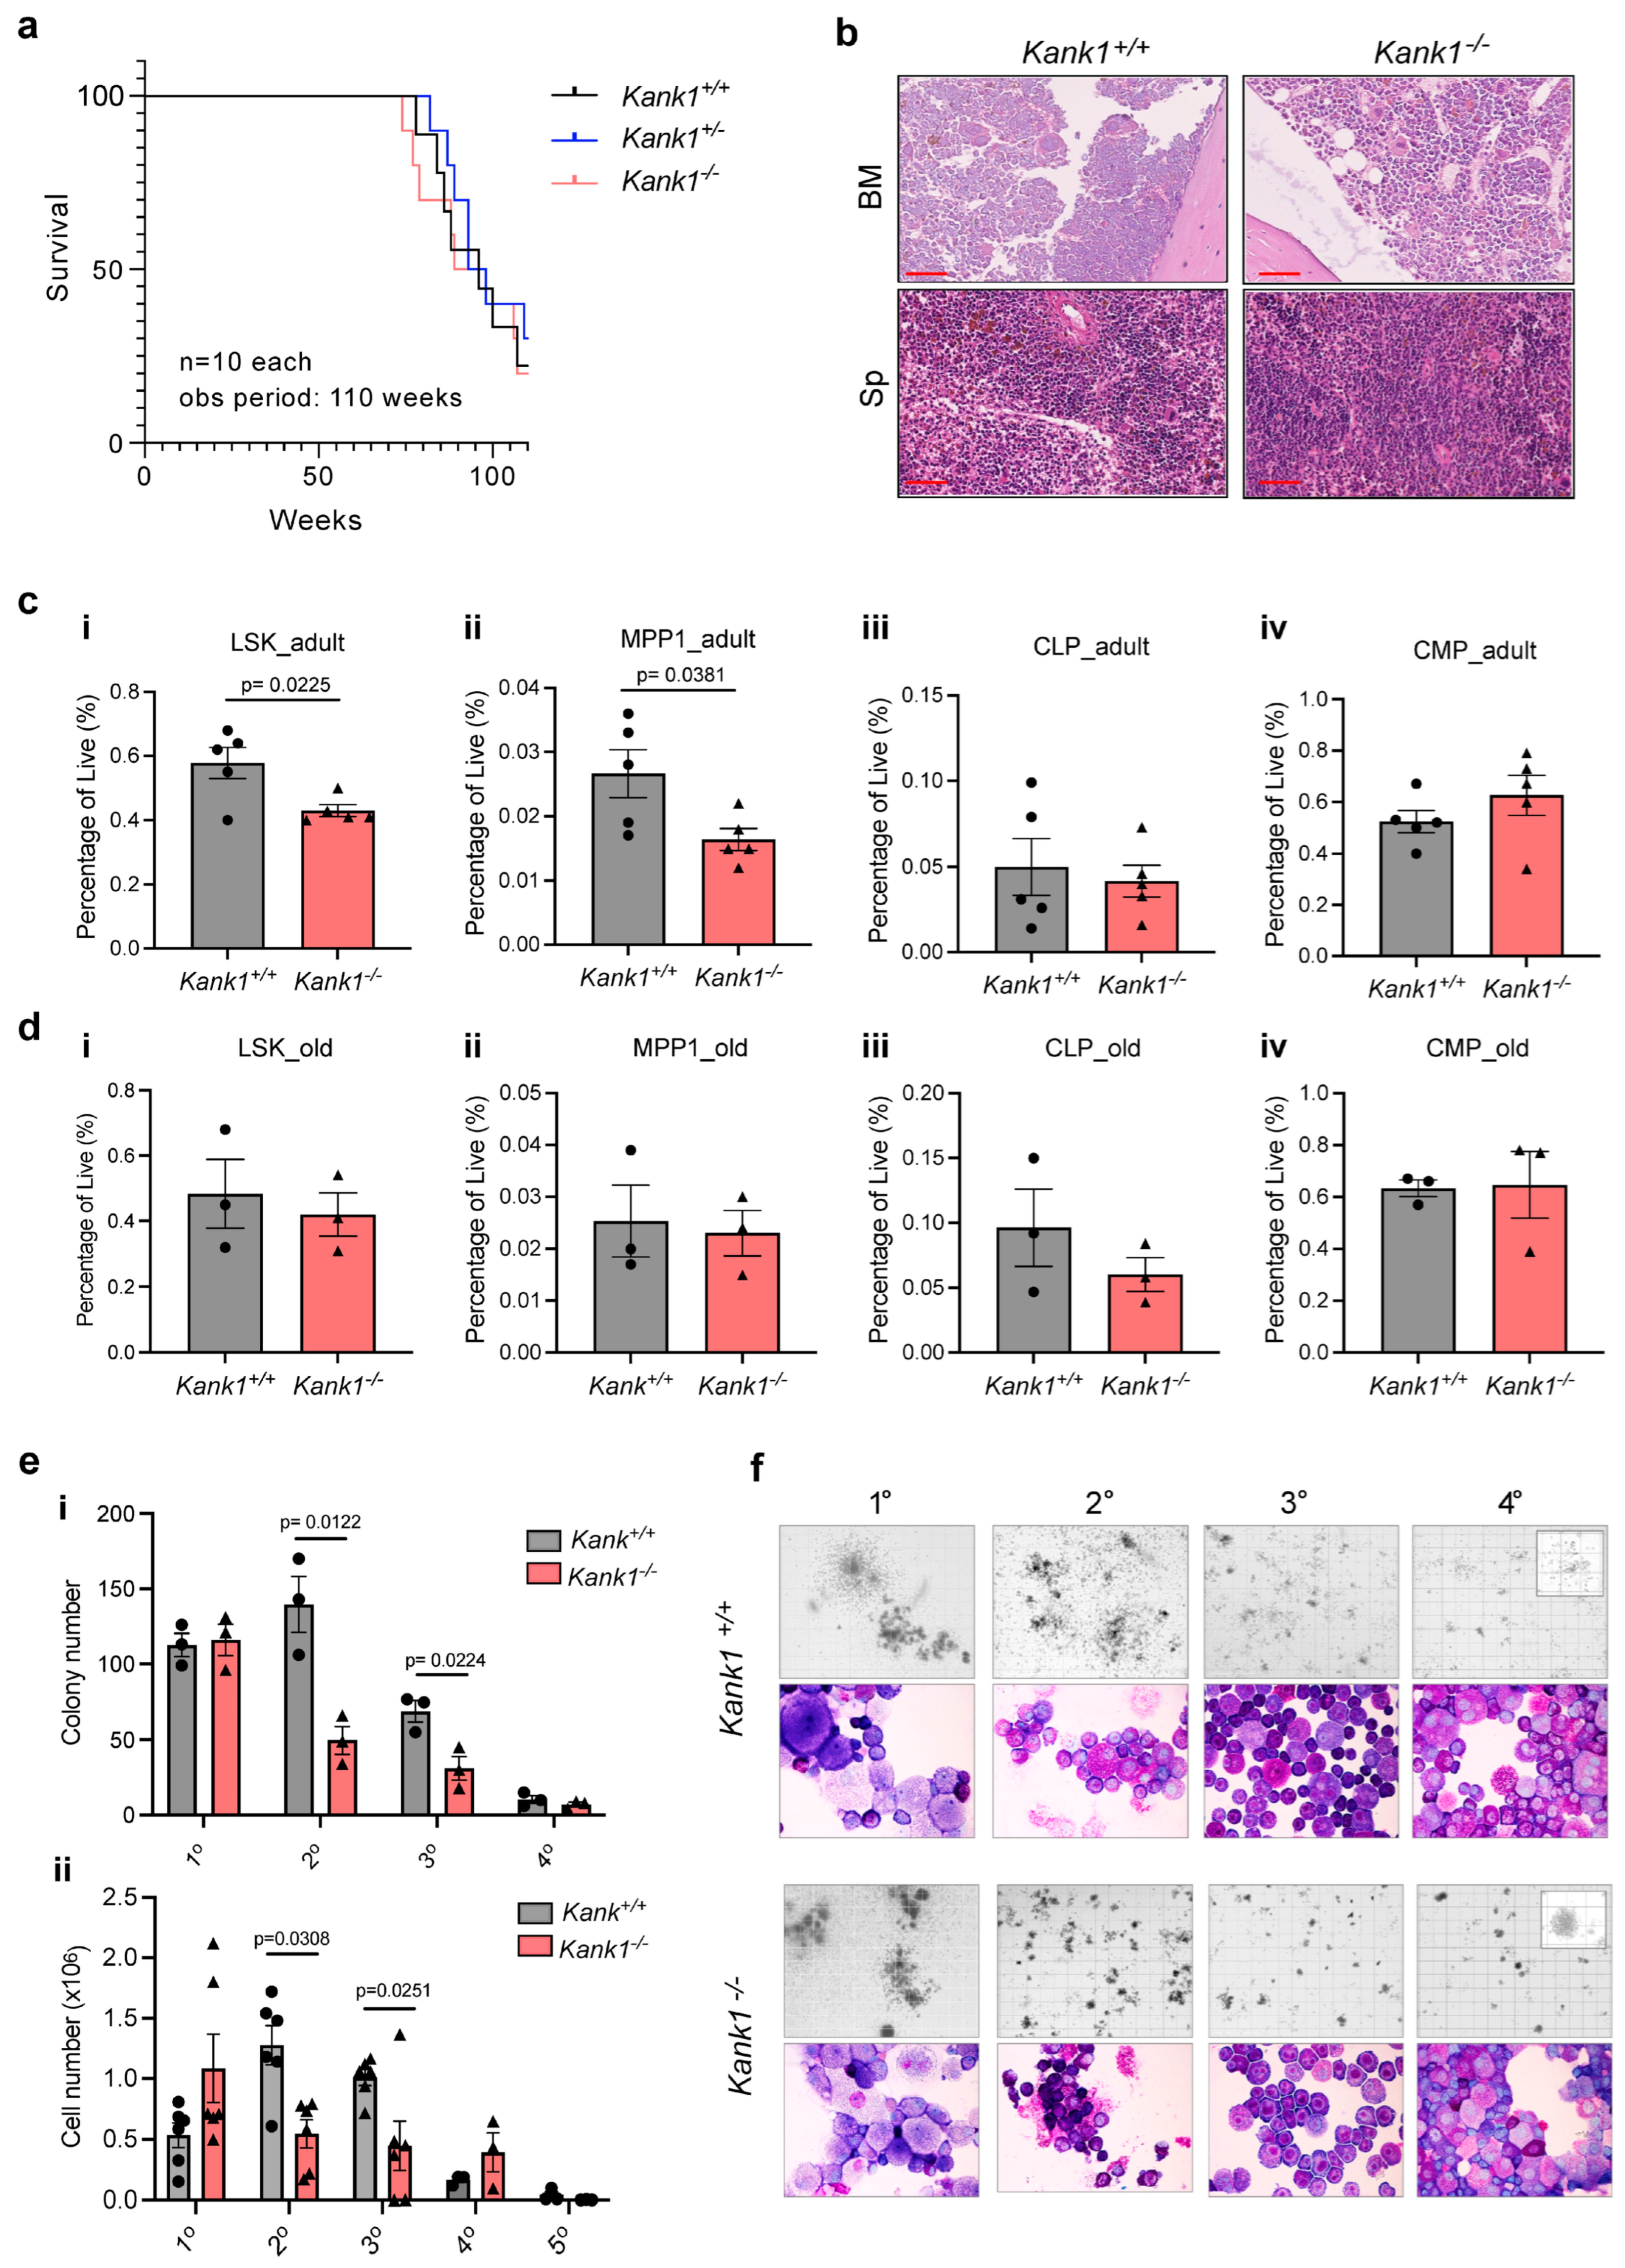
Abstract
:1. Introduction
2. Materials and Methods
2.1. The Young MDS Patient
2.2. Generation of Mice
2.3. Genotyping
2.4. Analysis of the Mouse Phenotype
2.5. Colony Forming Assay
2.6. RT-PCR
2.7. Flow Cytometry Analysis
2.8. Total Protein Mass Spectrometry Analysis
2.9. MS Data Acquisition
2.10. Label-Free Quantitative Proteomics Analysis
2.11. Targeted KANK1 Protein Quantification
3. Results
3.1. Loss of KANK1 Reduced the Frequency of Hematopoietic Stem and Progenitor Cells (HSPCs) in BM of Adult Mice
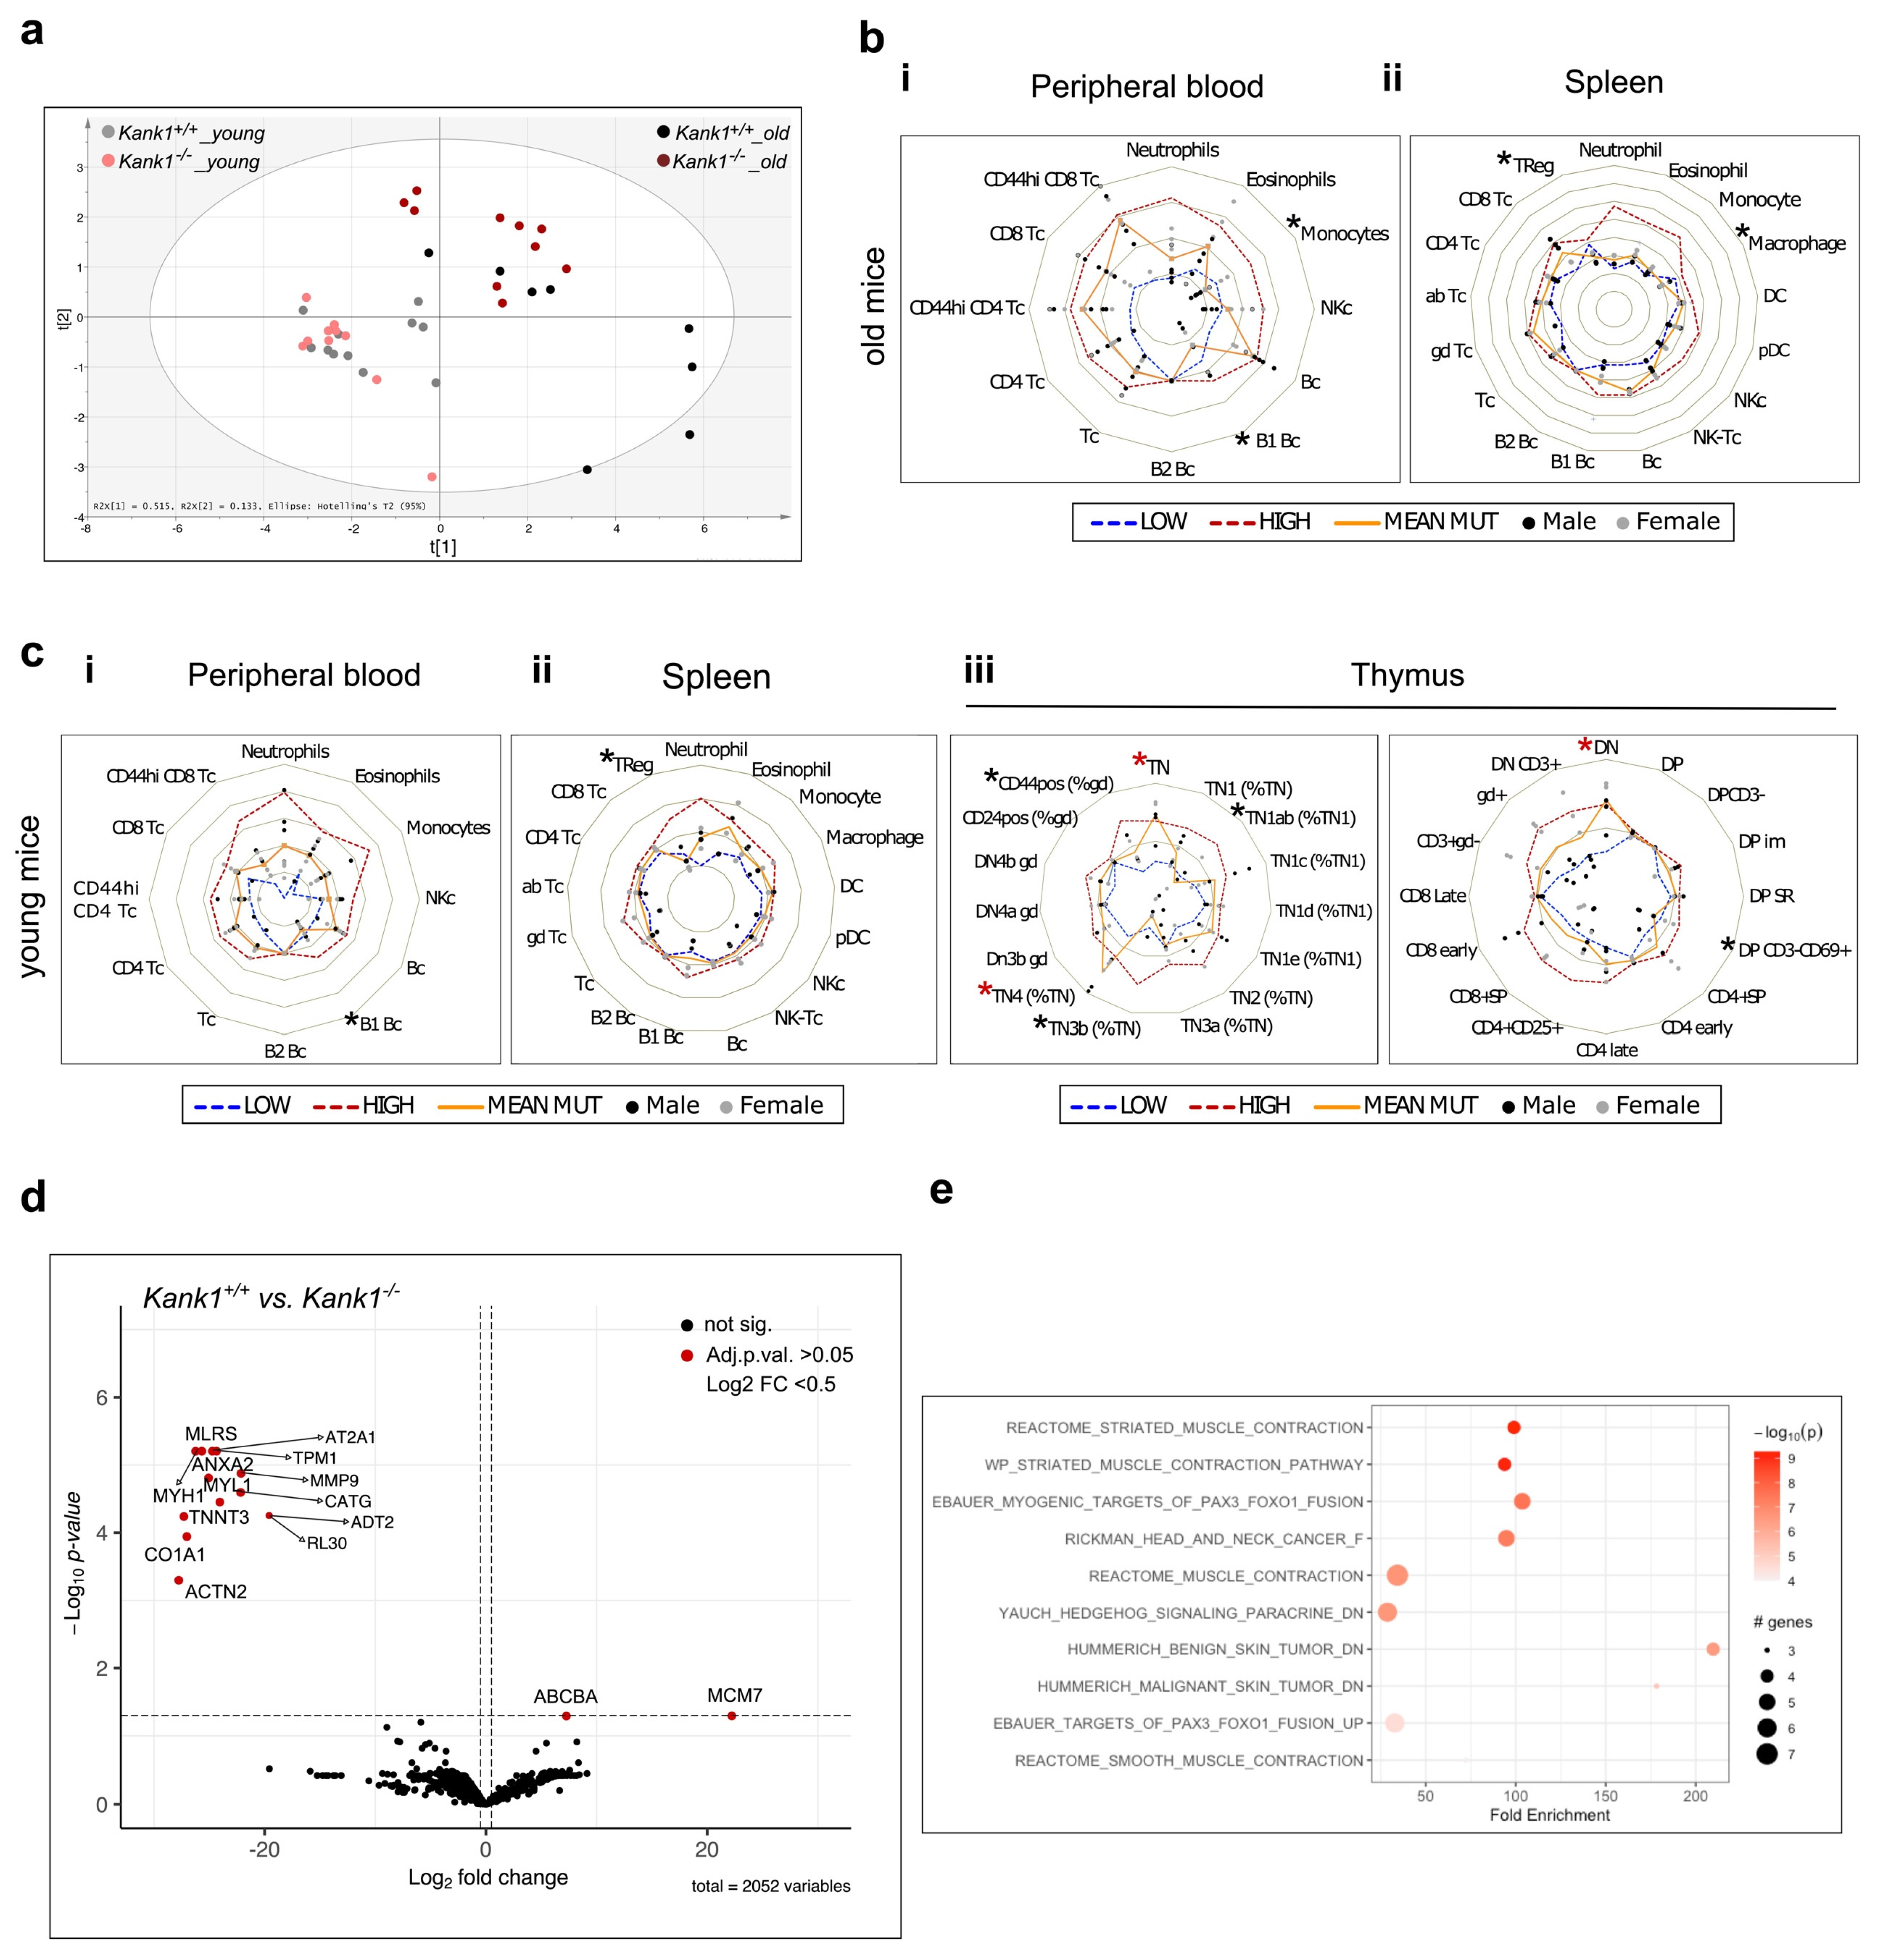
3.2. Loss of KANK1 Leads to Lymphoid Compartment Dysregulation
4. Discussion
Supplementary Materials
Author Contributions
Funding
Institutional Review Board Statement
Informed Consent Statement
Data Availability Statement
Acknowledgments
Conflicts of Interest
References
- Cazzola, M. Myelodysplastic Syndromes. N. Engl. J. Med. 2020, 383, 1358–1374. [Google Scholar] [PubMed]
- Sperling, A.S.; Gibson, C.J.; Ebert, B.L. The genetics of myelodysplastic syndrome: From clonal haematopoiesis to secondary leukaemia. Nat. Rev. Cancer 2017, 17, 5–19. [Google Scholar]
- Rio-Machin, A.; Vulliamy, T.; Hug, N.; Walne, A.; Tawana, K.; Cardoso, S.; Ellison, A.; Pontikos, N.; Wang, J.; Tummala, H.; et al. The complex genetic landscape of familial MDS and AML reveals pathogenic germline variants. Nat. Commun. 2020, 11, 1044. [Google Scholar]
- Shallis, R.M.; Ahmad, R.; Zeidan, A.M. The genetic and molecular pathogenesis of myelodysplastic syndromes. Eur. J. Haematol. 2018, 101, 260–271. [Google Scholar]
- Bannon, S.A.; DiNardo, C.D. Hereditary Predispositions to Myelodysplastic Syndrome. Int. J. Mol. Sci. 2016, 17, 838. [Google Scholar] [PubMed]
- Barreyro, L.; Chlon, T.M.; Starczynowski, D.T. Chronic immune response dysregulation in MDS pathogenesis. Blood 2018, 132, 1553–1560. [Google Scholar] [PubMed]
- Lambert, C.; Wu, Y.; Aanei, C. Bone Marrow Immunity and Myelodysplasia. Front. Oncol. 2016, 6, 172. [Google Scholar]
- Chen, N.P.; Sun, Z.; Fassler, R. The Kank family proteins in adhesion dynamics. Curr. Opin. Cell Biol. 2018, 54, 130–136. [Google Scholar]
- Bouchet, B.P.; Gough, R.E.; Ammon, Y.C.; van de Willige, D.; Post, H.; Jacquemet, G.; Maarten Altelaar, A.F.; Heck, A.J.; Goult, B.T.; Akhmanova, A. Talin-KANK1 interaction controls the recruitment of cortical microtubule stabilizing complexes to focal adhesions. eLife 2016, 5, e18124. [Google Scholar]
- Nguyen, M.T.; Lee, W. Kank1 Is Essential for Myogenic Differentiation by Regulating Actin Remodeling and Cell Proliferation in C2C12 Progenitor Cells. Cells 2022, 11, 2030. [Google Scholar]
- Lerer, I.; Sagi, M.; Meiner, V.; Cohen, T.; Zlotogora, J.; Abeliovich, D. Deletion of the ANKRD15 gene at 9p24.3 causes parent-of-origin-dependent inheritance of familial cerebral palsy. Hum. Mol. Genet. 2005, 14, 3911–3920. [Google Scholar] [PubMed]
- Chen, T.; Wang, K.; Tong, X. In Vivo and in vitro inhibition of human gastric cancer progress by upregulating Kank1 gene. Oncol. Rep. 2017, 38, 1663–1669. [Google Scholar] [PubMed]
- Gu, Y.; Zhang, M. Upregulation of the Kank1 gene inhibits human lung cancer progression in vitro and in vivo. Oncol. Rep. 2018, 40, 1243–1250. [Google Scholar] [PubMed]
- Cui, Z.; Shen, Y.; Chen, K.H.; Mittal, S.K.; Yang, J.Y.; Zhang, G. KANK1 inhibits cell growth by inducing apoptosis through regulating CXXC5 in human malignant peripheral nerve sheath tumors. Sci. Rep. 2017, 7, 40325. [Google Scholar]
- Fan, H.; Tian, H.; Cheng, X.; Chen, Y.; Liang, S.; Zhang, Z.; Liao, Y.; Xu, P. Aberrant Kank1 expression regulates YAP to promote apoptosis and inhibit proliferation in OSCC. J. Cell Physiol. 2020, 235, 1850–1865. [Google Scholar] [PubMed]
- Tadijan, A.; Samaržija, I.; Humphries, J.D.; Humphries, M.J.; Ambriović-Ristov, A. KANK family proteins in cancer. Int. J. Biochem. Cell Biol. 2021, 131, 105903. [Google Scholar]
- Medves, S.; Duhoux, F.P.; Ferrant, A.; Toffalini, F.; Ameye, G.; Libouton, J.-M.; A Poirel, H.; Demoulin, J.-B. KANK1, a candidate tumor suppressor gene, is fused to PDGFRB in an imatinib-responsive myeloid neoplasm with severe thrombocythemia. Leukemia 2010, 24, 1052–1055. [Google Scholar]
- Wickramarachchi, D.C.; Theofilopoulos, A.N.; Kono, D.H. Immune pathology associated with altered actin cytoskeleton regulation. Autoimmunity 2010, 43, 64–75. [Google Scholar]
- Ran, F.A.; Hsu, P.D.; Wright, J.; Agarwala, V.; Scott, D.A.; Zhang, F. Genome engineering using the CRISPR-Cas9 system. Nat. Protoc. 2013, 8, 2281–2308. [Google Scholar]
- Truett, G.; Heeger, P.; Mynatt, R.; Truett, A.; Walker, J.; Warman, M.; Meeker, N.D.; Hutchinson, S.A.; Ho, L.; Trede, N.S.; et al. Preparation of PCR-quality mouse genomic DNA with hot sodium hydroxide and tris (HotSHOT). Biotechniques 2000, 29, 54. [Google Scholar]
- A Kulak, N.; Pichler, G.; Paron, I.; Nagaraj, N.; Mann, M. Minimal, encapsulated proteomic-sample processing applied to copy-number estimation in eukaryotic cells. Nat. Methods 2014, 11, 319–324. [Google Scholar] [CrossRef]
- Rappsilber, J.; Mann, M.; Ishihama, Y. Protocol for micro-purification, enrichment, pre-fractionation and storage of peptides for proteomics using StageTips. Nat. Protoc. 2007, 2, 1896–1906. [Google Scholar] [CrossRef]
- Kalogeropoulos, K.; Savickas, S.; Haack, A.M.; Larsen, C.A.; Mikosiński, J.; Schoof, E.M.; Smola, H.; Bundgaard, L.; auf dem Keller, U. WITHDRAWN: High-throughput and high-sensitivity biomarker monitoring in body fluid by FAIMS-enhanced fast LC SureQuant IS targeted quantitation. Mol. Cell Proteom. 2022, 2022, 100251. [Google Scholar] [CrossRef] [PubMed]
- Peterson, A.C.; Russell, J.D.; Bailey, D.J.; Westphall, M.S.; Coon, J.J. Parallel reaction monitoring for high resolution and high mass accuracy quantitative, targeted proteomics. Mol. Cell Proteom. 2012, 11, 1475–1488. [Google Scholar] [CrossRef] [PubMed]
- MacLean, B.; Tomazela, D.M.; Shulman, N.; Chambers, M.; Finney, G.L.; Frewen, B.; Kern, R.; Tabb, D.L.; Liebler, D.C.; MacCoss, M.J. Skyline: An open source document editor for creating and analyzing targeted proteomics experiments. Bioinformatics 2010, 26, 966–968. [Google Scholar] [CrossRef] [PubMed]
- Lyu, Q.R.; Yao, P.; Miano, J.M. Generating a CRISPR knockout mouse through a strong premature termination codon: A cautionary tale. J. Biomed. Res. 2020, 35, 174–178. [Google Scholar] [CrossRef]
- Gee, H.Y.; Zhang, F.; Ashraf, S.; Kohl, S.; Sadowski, C.E.; Vega-Warner, V.; Zhou, W.; Lovric, S.; Fang, H.; Nettleton, M.; et al. KANK deficiency leads to podocyte dysfunction and nephrotic syndrome. J. Clin. Investig. 2015, 125, 2375–2384. [Google Scholar] [CrossRef]
- Kakinuma, N.; Roy, B.C.; Zhu, Y.; Wang, Y.; Kiyama, R. Kank regulates RhoA-dependent formation of actin stress fibers and cell migration via 14-3-3 in PI3K-Akt signaling. J. Cell Biol. 2008, 181, 537–549. [Google Scholar] [CrossRef]
- Suzuki, J.-I.; Roy, B.C.; Ogaeri, T.; Kakinuma, N.; Kiyama, R. Depletion of tumor suppressor Kank1 induces centrosomal amplification via hyperactivation of RhoA. Exp. Cell Res. 2017, 353, 79–87. [Google Scholar] [CrossRef]
- Zhou, X.; Florian, M.C.; Arumugam, P.; Chen, X.; Cancelas, J.A.; Lang, R.; Malik, P.; Geiger, H.; Zheng, Y. RhoA GTPase controls cytokinesis and programmed necrosis of hematopoietic progenitors. J. Exp. Med. 2013, 210, 2371–2385. [Google Scholar] [CrossRef]
- Dupre, L.; Boztug, K.; Pfajfer, L. Actin Dynamics at the T Cell Synapse as Revealed by Immune-Related Actinopathies. Front. Cell Dev. Biol. 2021, 9, 665519. [Google Scholar] [CrossRef] [PubMed]
- Billadeau, D.D.; Nolz, J.C.; Gomez, T.S. Regulation of T-cell activation by the cytoskeleton. Nat. Rev. Immunol. 2007, 7, 131–143. [Google Scholar] [CrossRef]
- Moulding, D.A.; Record, J.; Malinova, D.; Thrasher, A.J. Actin cytoskeletal defects in immunodeficiency. Immunol. Rev. 2013, 256, 282–299. [Google Scholar] [CrossRef] [PubMed]
- Wang, C.; Yang, Y.; Gao, S.; Chen, J.; Yu, J.; Zhang, H.; Li, M.; Zhan, X.; Li, W. Immune dysregulation in myelodysplastic syndrome: Clinical features, pathogenesis and therapeutic strategies. Crit. Rev. Oncol. Hematol. 2018, 122, 123–132. [Google Scholar] [CrossRef] [PubMed]


Disclaimer/Publisher’s Note: The statements, opinions and data contained in all publications are solely those of the individual author(s) and contributor(s) and not of MDPI and/or the editor(s). MDPI and/or the editor(s) disclaim responsibility for any injury to people or property resulting from any ideas, methods, instructions or products referred to in the content. |
© 2023 by the authors. Licensee MDPI, Basel, Switzerland. This article is an open access article distributed under the terms and conditions of the Creative Commons Attribution (CC BY) license (https://creativecommons.org/licenses/by/4.0/).
Share and Cite
Almosailleakh, M.; Bentivegna, S.; Narcisi, S.; Benquet, S.J.; Gillberg, L.; Montaño-Almendras, C.P.; Savickas, S.; Schoof, E.M.; Wegener, A.; Luche, H.; et al. Loss of the KN Motif and AnKyrin Repeat Domain 1 (KANK1) Leads to Lymphoid Compartment Dysregulation in Murine Model. Genes 2023, 14, 1947. https://doi.org/10.3390/genes14101947
Almosailleakh M, Bentivegna S, Narcisi S, Benquet SJ, Gillberg L, Montaño-Almendras CP, Savickas S, Schoof EM, Wegener A, Luche H, et al. Loss of the KN Motif and AnKyrin Repeat Domain 1 (KANK1) Leads to Lymphoid Compartment Dysregulation in Murine Model. Genes. 2023; 14(10):1947. https://doi.org/10.3390/genes14101947
Chicago/Turabian StyleAlmosailleakh, Marwa, Sofia Bentivegna, Samuele Narcisi, Sébasitien J. Benquet, Linn Gillberg, Carmen P. Montaño-Almendras, Simonas Savickas, Erwin M. Schoof, Amelie Wegener, Hérve Luche, and et al. 2023. "Loss of the KN Motif and AnKyrin Repeat Domain 1 (KANK1) Leads to Lymphoid Compartment Dysregulation in Murine Model" Genes 14, no. 10: 1947. https://doi.org/10.3390/genes14101947
APA StyleAlmosailleakh, M., Bentivegna, S., Narcisi, S., Benquet, S. J., Gillberg, L., Montaño-Almendras, C. P., Savickas, S., Schoof, E. M., Wegener, A., Luche, H., Jensen, H. E., Côme, C., & Grønbæk, K. (2023). Loss of the KN Motif and AnKyrin Repeat Domain 1 (KANK1) Leads to Lymphoid Compartment Dysregulation in Murine Model. Genes, 14(10), 1947. https://doi.org/10.3390/genes14101947