Article

The Mitochondrial Genome of Linichthys laticeps (Cypriniformes: Cyprinidae): Characterization and Phylogeny

School of Life Sciences, Guizhou Normal University, Guiyang 550025, China
*
Author to whom correspondence should be addressed.
These authors contributed equally to this work.
Genes 2023, 14(10), 1938; https://doi.org/10.3390/genes14101938
Submission received: 7 September 2023 / Revised: 11 October 2023 / Accepted: 12 October 2023 / Published: 14 October 2023
(This article belongs to the Section Animal Genetics and Genomics)

Abstract

:
Mitochondrial genomes (mitogenomes) have been widely used in phylogenetic analysis and evolutionary biology. The Labeoninae is the largest subfamily of Cypriniformes and has great economic importance and ecological value. In this study, we sequenced, annotated, and characterized the complete mitogenome of Linichthys laticeps and then constructed the phylogenetic tree with previously published Labeoninae mitogenomes. The mitogenome of L. laticeps was 16,593 bp in length, with an A + T content of 57.1%. The mitogenome contained a standard set of 37 genes and a control region with the same order and orientation of genes as most fish mitogenomes. Each protein-coding gene (PCG) was initiated by an initial ATG codon, excluding COI, that began with a GTG codon. Furthermore, most of the PCGs were terminated by a conventional stop codon (TAA/TAG), while an incomplete termination codon (TA/T) was detected in 7 of the 13 PCGs. Most tRNA genes in L. laticeps were predicted to fold into the typical cloverleaf secondary structures. The Ka/Ks (ω) values for all PCGs were below one. The phylogenetic relationships of 96 Labeoninae mitogenomes indicated that Labeoninae was not a monophyletic group and L. laticeps was closely related to the genera Discogobio and Discocheilus. Overall, our study provided the first complete annotated mitogenome of L. laticeps, which filled a knowledge gap in Labeoninae and extended the understanding of the taxonomy and mitogenomic phylogeny of the subfamily Labeoninae.

1. Introduction

The mitochondrial genome (mitogenome) is one of the most commonly used molecular markers mainly due to its small size, high copy number, matrilineal inheritance, lack of recombination, and high rate of evolution compared to nuclear genome DNA [1,2]. The mitogenome of fish is typically a double-stranded, looped DNA molecule with a size range of 15–18 kb [3,4]. It generally contains 37 genes (22 transfer RNA genes (tRNAs), 13 protein-coding genes (PCGs), and two ribosomal RNA genes (rRNAs)) and one control region (CR) (also known as the D-loop region or the A + T-rich region) [3,4]. Fish mitogenomes have been widely used in fish phylogeny, biogeography, and population genetic structure analyses [5]. During the past 18 years, sequencing and analysis technologies have developed rapidly. A large quantity of fish mitogenomes has been sequenced, annotated, and characterized, covering almost all fish orders [6].
The Labeoninae is the largest and most diverse subfamily in Cyprinidae, including 42 valid genera and over 500 valid species distributed throughout the world [7]. Labeoninae is a small and medium-sized freshwater fish adapted to flowing water, mainly feeding on algae. The species is widely distributed in southern Eurasia and central Africa. Due to special adaptation to the environment, the species of the subfamily have a high diversity in their oral structure. Therefore, taxonomists often use oral structures as key morphological features to identify Labeoninae fishes.
The molecular phylogenetic tree constructed by Yang and Mayden [8] supported that Labeoninae was monophyletic and proposed to subdivide the tribe into two major clades. Then, Zheng et al. [9] divided the Chinese Labeoninae into six clades using the combined molecular data of nuclear genes and mitochondrial genes. The phylogenetic relationship of the subfamily Labeoninae was constructed by Yang et al. [10] using mitochondrial genes and nuclear genes. The results showed that Labeoninae was divided into four clades (Labeoina, Garraina, Osteochilina, and Semilabeoina) with high support based on 142 species from 34 genera of the subfamily. Zhang et al. [11] constructed the phylogenetic trees based on the 12 PCGs of 91 mitogenomes of Labeoninae and divided the subfamily Labeoninae into four major clades. However, the taxonomy and phylogeny of the subfamily Labeoninae have remained a controversial topic for years due to abundant species and morphological diversity.
L. laticeps (Lin & Zhang, 1986), originally named Barbodes laticeps by Lin and Zhang, is mainly distributed in the Nanming River and the Maling River in Guiyang, China [12,13]. They live mainly in mountain streams and the outlet of the subterranean river. In 2005, B. laticeps was renamed L. laticeps based on morphological data, and a new genus, Linichthys, was established based on it [12]. At present, there is only one species in the genus. The main characteristic of L. laticeps is a shallow depression in the upper lip, the lower lip being horseshoe-shaped without a sharp cuticle, and a black vertical line above the lateral line of the body (Figure 1). To date, there is no record of the complete sequence of the mitogenome of the Linichthys genus in the National Center for Biotechnology Information (NCBI).
In this study, we newly sequenced, assembled, and characterized the complete mitogenome of L. laticeps. Specifically, we analyzed the characteristics of mitogenome size, mitogenome structure, organization, nucleotide composition, codon usage, secondary structures of tRNAs, and evolutionary rates. Finally, the phylogenetic position of L. laticeps within Labeoninae, as well as the relationship of the subfamily Labeoninae, was defined based on 13 PCGs. The new mitogenome data will lay the foundation for the phylogenetic analysis and taxonomy of Labeoninae.

2. Materials and Methods

2.1. Sampling, DNA Extraction, and High-Throughput Sequencing

Specimens of L. laticeps were collected from the Maling River, Huaxi District, Guiyang City, Guizhou Province, China, in August 2022. Samples were conserved in absolute ethanol and then stored in a −20 °C freezer. Total genomic DNA was isolated from the muscle of a specimen with the DNeasy Blood & Tissue Kit (Qiagen Inc., Hilden, Germany). The genomic DNA was fragmented by a Covaris Ultrasonic Process. Then, the DNA library was completed by terminal repair, A-tail addition, sequencing adaptor addition, purification, and PCR amplification. The concentration of the library was checked with Qubit 2.0. The inserted fragments of the library were detected by Agilent 2100. Sequencing was performed using an Illumina sequencing platform by the DNA Stories Bioinformatics Center (Chengdu, Sichuan, China).

2.2. Sequence Assembly, Annotation, and Analysis

The mitogenome was assembled using GetOrganelle v. 1.7.7.0 [14]. After assembly, the complete mitogenome was annotated using MitoAnnotator 3.94 [6]. The annotated tRNA genes were reconfirmed with the tRNAscan-SE server v. 1.21 [15]. The online tool MITOS Web Server was used to predict tRNA second structures [16]. The formulae A + T skew = (A − T)/(A + T) and G + C skew = (G − C)/(G + C) were used to calculate the strand asymmetry of the mitogenome sequence [17]. The nucleotide composition and relative synonymous codon usage (RSCU) of the mitogenome sequence were determined by MEGA 6 [18].
The substitution rates of the different PCGs were obtained among closely related species. The software DnaSP 6.0 [19] was used to calculate the values of Ka (the nonsynonymous substitution rate), Ks (the synonymous substitution rate), and ω (the Ka/Ks ratio).

2.3. Phylogenetic Analysis

The phylogenetic relationships of 96 species representing 29 genera of Labeoninae were reconstructed (Table S1). Cyprinus carpio, Danio rerio, and Squalius lepidus were chosen as the outgroups for the construction of the phylogenetic tree (Table S1). PhyloSuite v1.2.3 [20] was used to extract the complete mitogenome genes. A batch alignment of 13 PCG sequences from 99 species was performed using MAFFT v7.0 [21] integrated into PhyloSuite. Phylogenetic analyses were performed using both the maximum likelihood (ML) and Bayesian inference (BI) methods. PartitionFinder2 [22], with the greedy algorithm and the modified Akaike information criterion (AICc), was used to select the best-fit partitioning scheme and evolutionary model for 39 predefined partitions. The ML phylogenetic tree was constructed with IQ-TREE v1.6.12 [23] under an edge-linked partition model for 5000 ultrafast bootstraps [24], as well as the Shimodaira–Hasegawa-like approximate likelihood-ratio test [25]. MrBayes 3.2.6 [26] was used to perform the BI analysis under two independent Markov chain Monte Carlo (MCMC) runs with four chains each that were simultaneously conducted for five million generations. The initial 25% of trees from each MCMC chain run were discarded as burn-in. The online tool Interactive Tree Of Life (iTOL) (https://itol.embl.de/) (accessed on 25 August 2023) was used to visualize, annotate, and manage the phylogenetic trees.

3. Results and Discussion

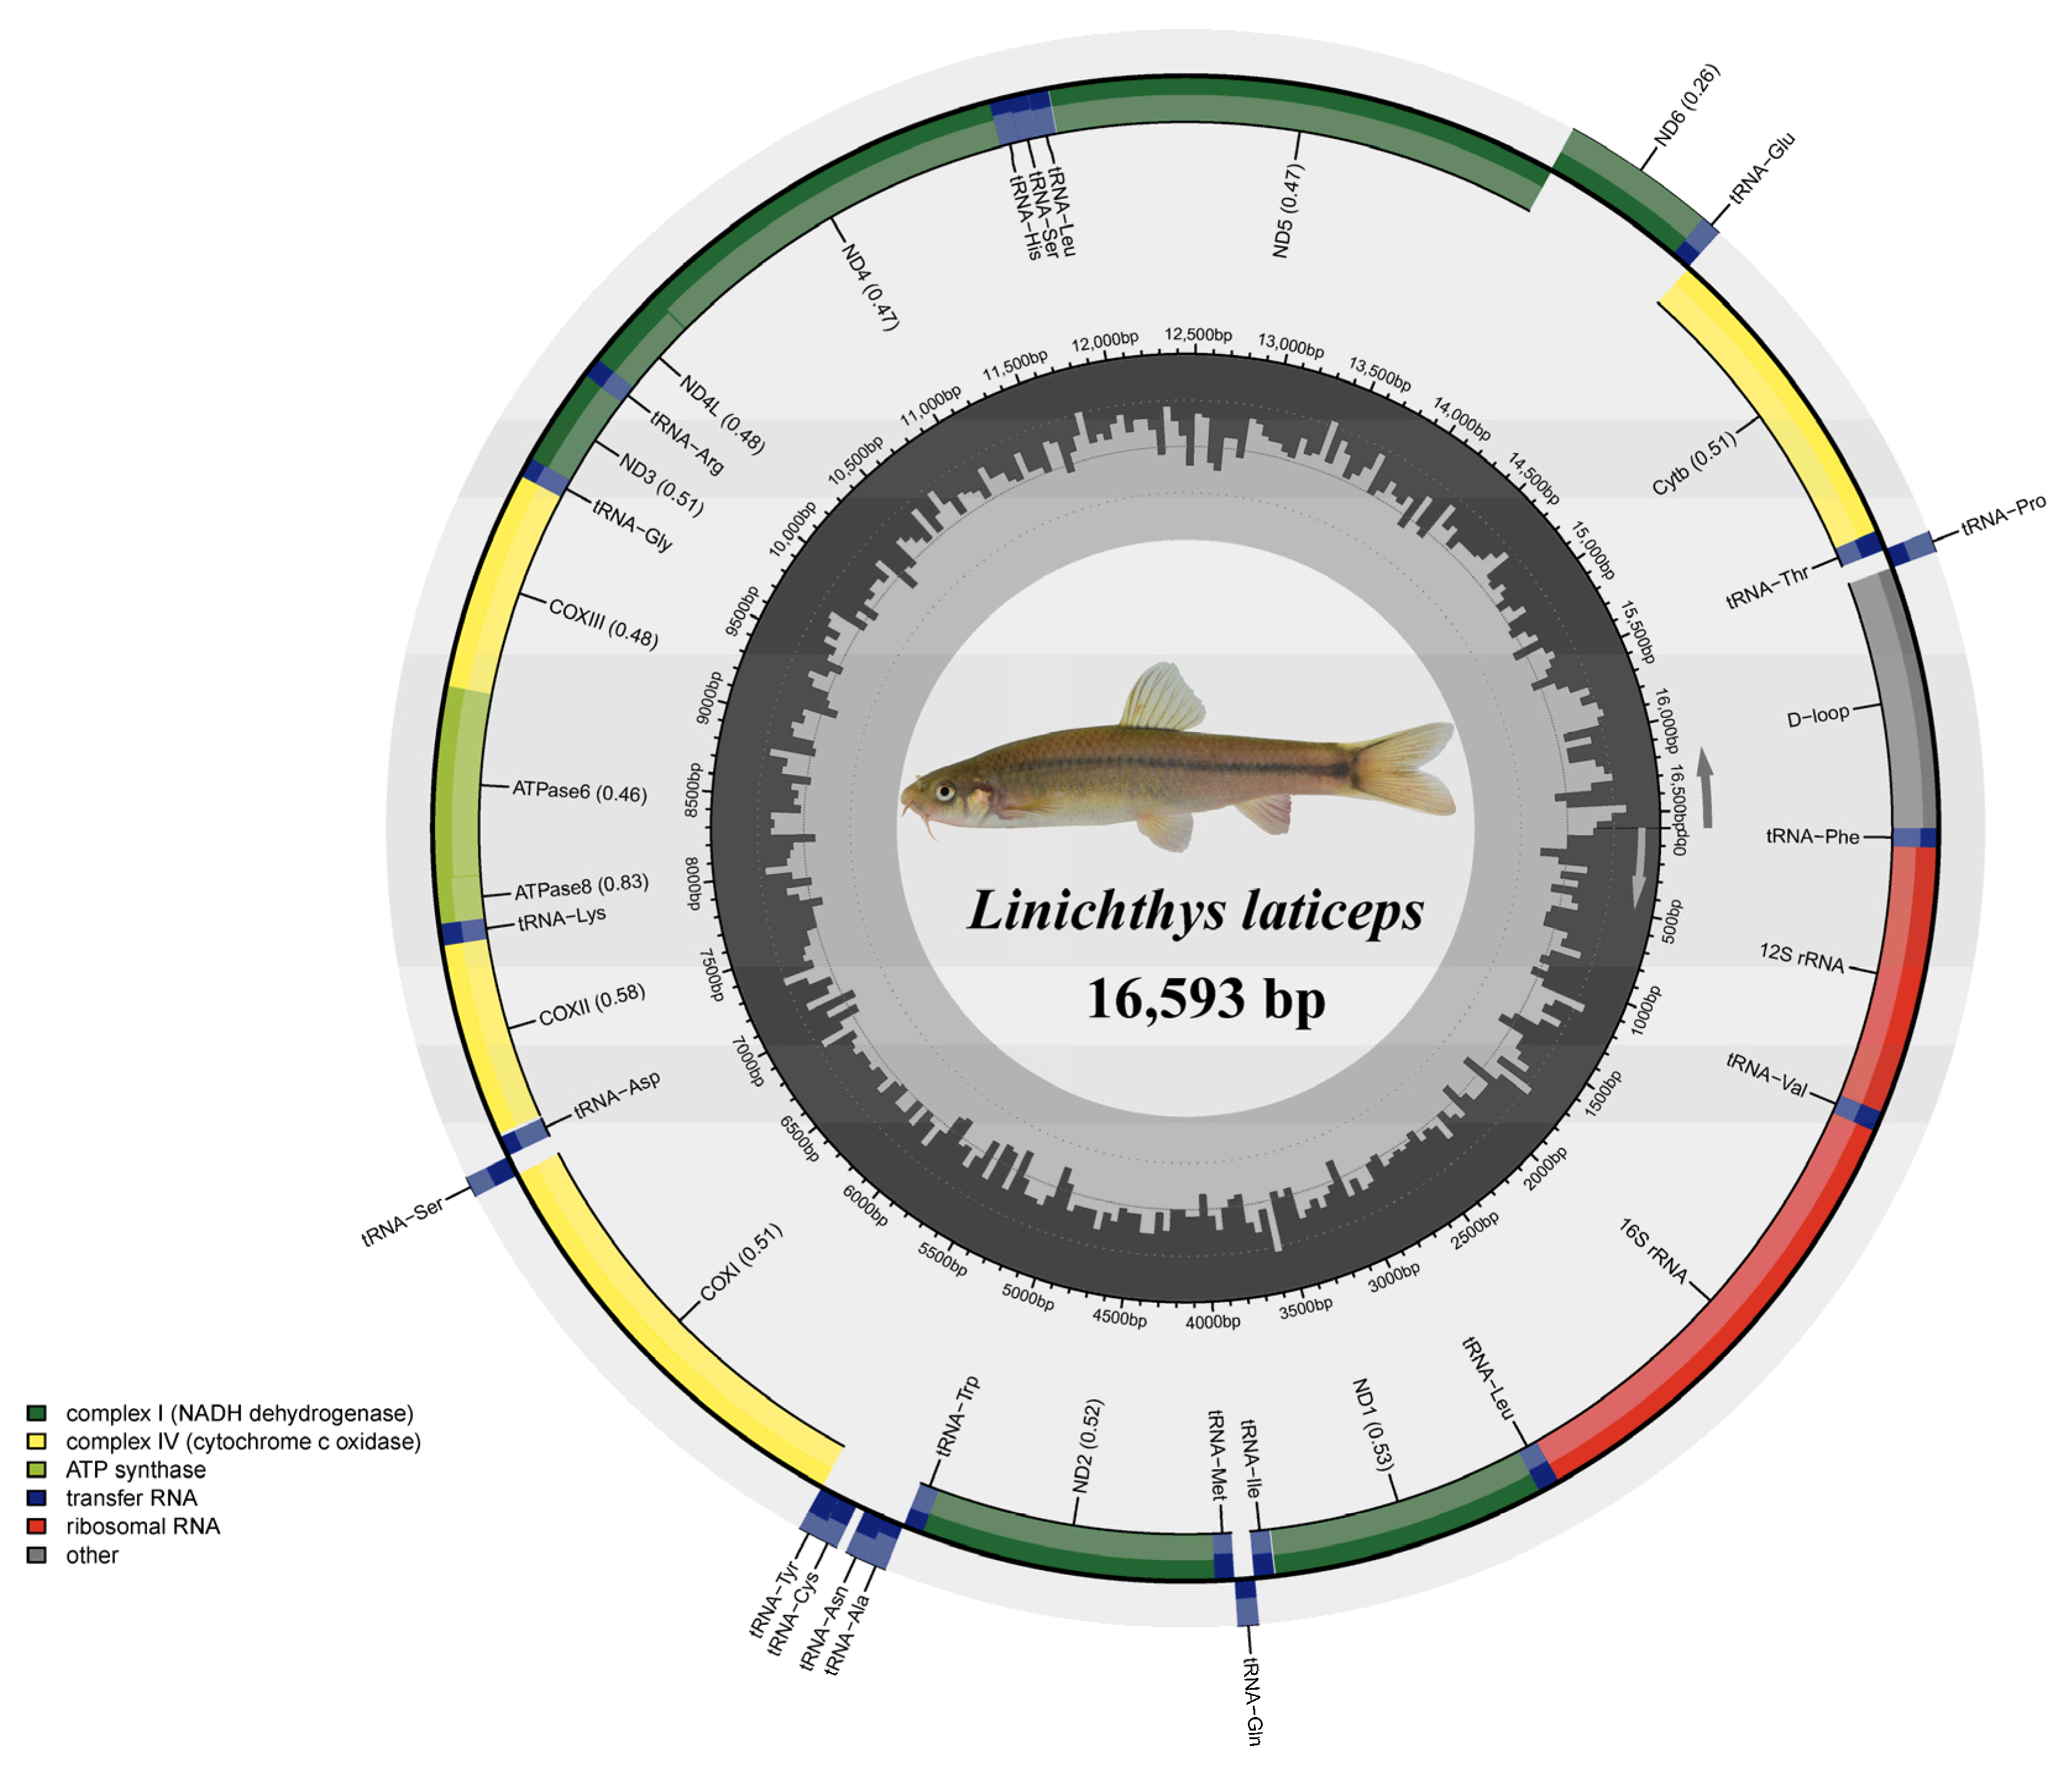
3.1. Genome Organization and Base Composition

In this study, the complete mitogenome of L. laticeps was sequenced, assembled, and annotated (GenBank accession number: OR343919). The complete mitogenome sequence was 16,593 bp in length. It consisted of 37 genes (2 rRNAs, 22 tRNAs, and 13 PCGs) and a control region (Figure 1; Table 1). Among these genes, 28 genes were encoded on the heavy strand, and the other nine genes were encoded on the light strand (Figure 1; Table 1). Our analysis comparing the mitogenome of the species showed that the mitogenome size, gene numbers, and gene arrangement were highly conserved, which was consistent with other published mitogenomes of Labeoninae [11,27].
The composition of the A, T, G, and C nucleotides of L. laticeps was 31.4%, 25.7%, 16.0%, and 26.9%, respectively. The A + T content was 57.1%, showing a relatively slight A + T bias (Table 2). The control region had the highest A + T content, reaching 66.7%. In contrast, the first codon position of PCGs was the region with the lowest A + T content, which was 49.0%. The nucleotide composition was consistent with that of the Labeoninae genomes (Table S1). The values of the A + T and G + C skews were a measure of compositional asymmetry [28]. The A + T skew and the G + C skew were 0.100 and −0.254, respectively, in the mitogenome of L. laticeps. Fish mitogenomes usually tend to have the characteristics of A + T bias [4,5].
In the L. laticeps mitogenome, there were 14 intergenic spacers ranging from 1 bp to 33 bp in length. The two long intergenic spacers were located between tRNAAsn and tRNACys (33 bp) and tRNAAsp and COII (13 bp). Gene overlaps in the mitogenome were found at five locations, and their total size was 21 bp. The minimum overlapped region was 1 bp, and the maximum overlapped region was 7 bp. The mitochondrial gene overlap and the gene spacer have long been known throughout teleost species [29,30].

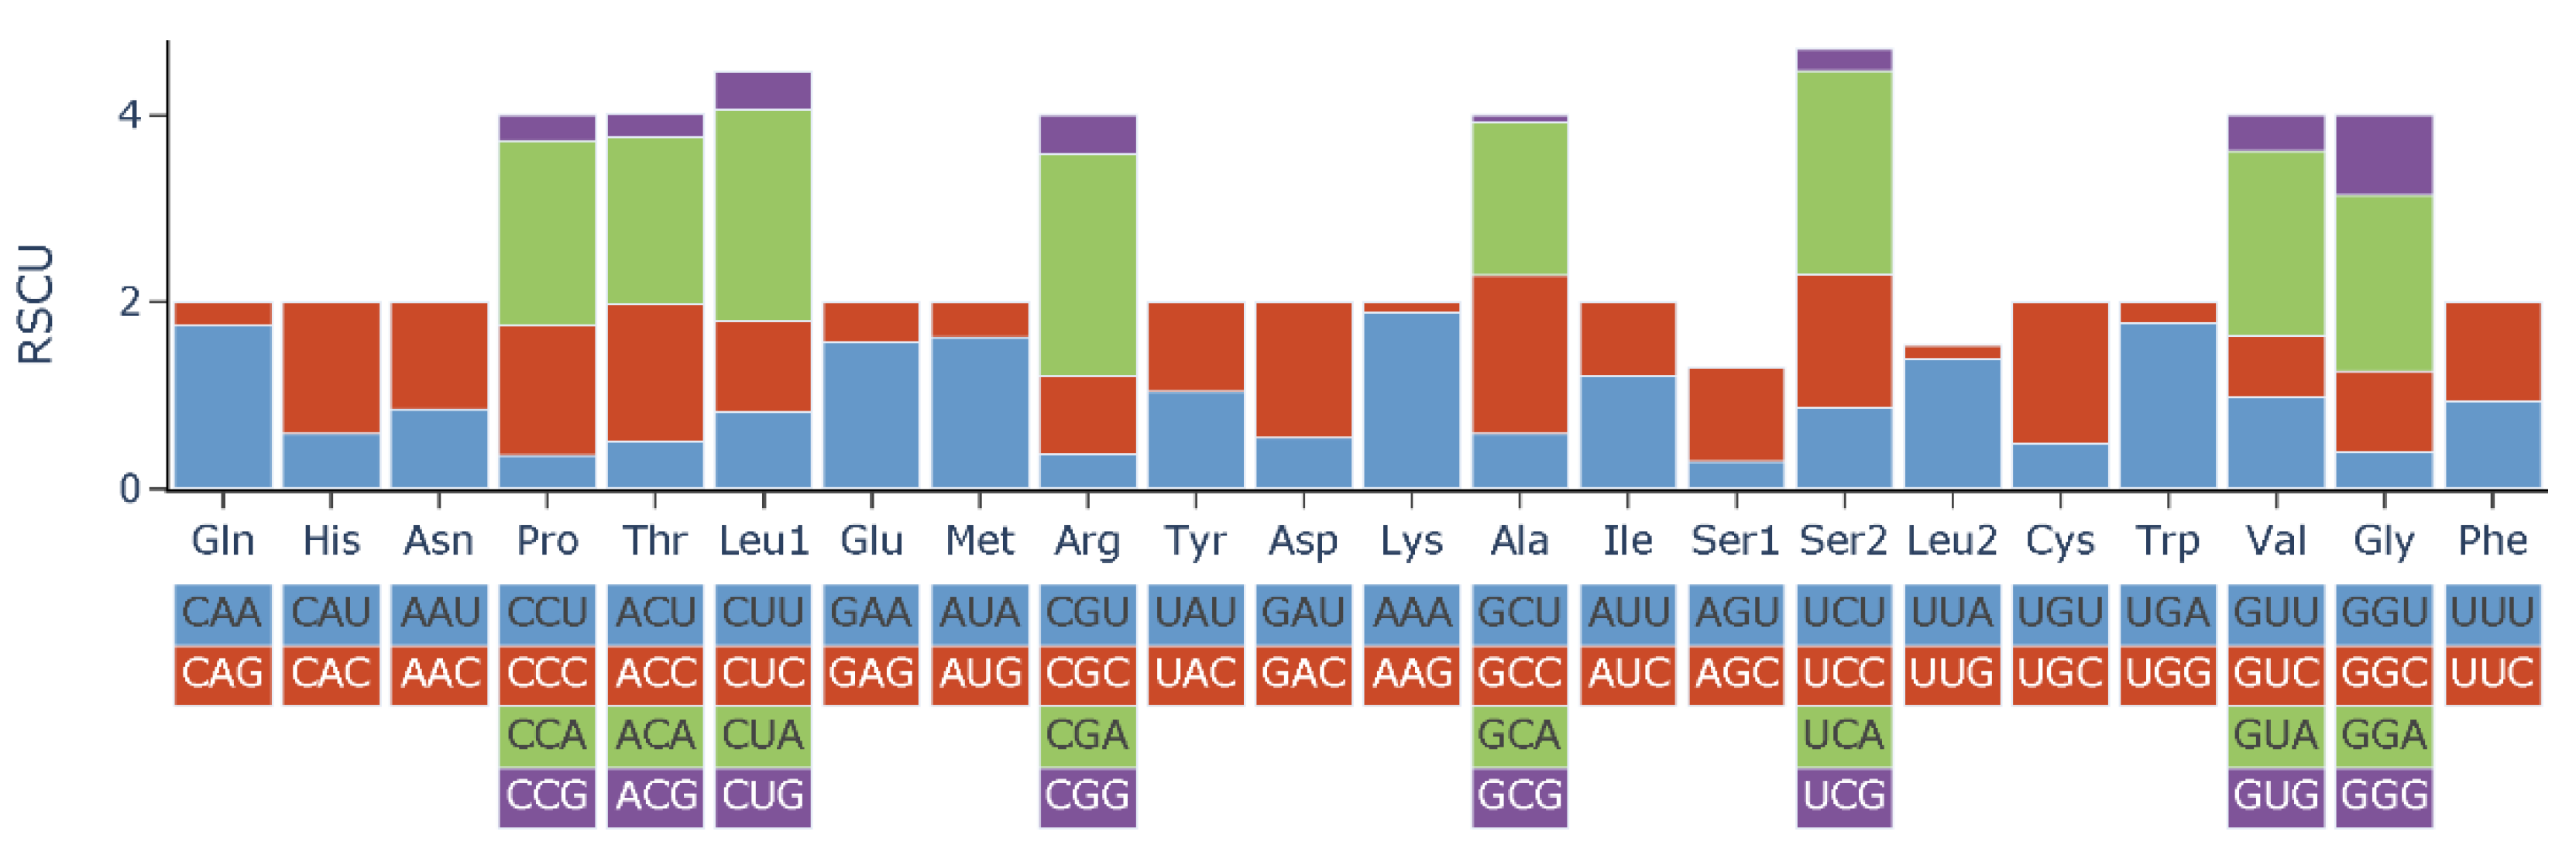
3.2. Protein-Coding Genes and Codon Usage

The total length of the 13 PCGs in L. laticeps was 11,400 bp (Table 2). Among these PCGs, only NAD6 was located on the light strand, while the remaining 12 PCGs were encoded on the heavy strand. The A + T content of the PCGs was 57.0%. The start codon of most PCGs was ATG, but COI started with GTG. The GTG start codon for COI was presented in the mitogenomes of many fish species [4,5,29]. The standard stop codon (TAA) was used by six genes (ND1, COI, ATPase8, ND4L, ND5, and ND6), and two incomplete stop codons (T and TA) were used by seven genes (ND2, COII, ATPase6, COIII, ND3, ND4, and Cyt b). The incomplete stop codon was commonly found in vertebrate mitogenomes, which was presumed to be completed by post-transcriptional modification, such as polyadenylation [31].
The RSCU values of L. laticeps are shown in Table 3 and Figure 2. The 13 PCGs expressed a total of 3794 amino acid triplets, excluding the stop codon. The highest number of amino acids was Leu, followed by Ala, Thr, Ile, and Phe. Cys was the lowest at 25. The codon usage of PCGs was estimated based on RSCU values. The results showed that the most frequent codons among the 13 PCGs were CUA of Leu, AUU of Ile, and UUA of Leu.

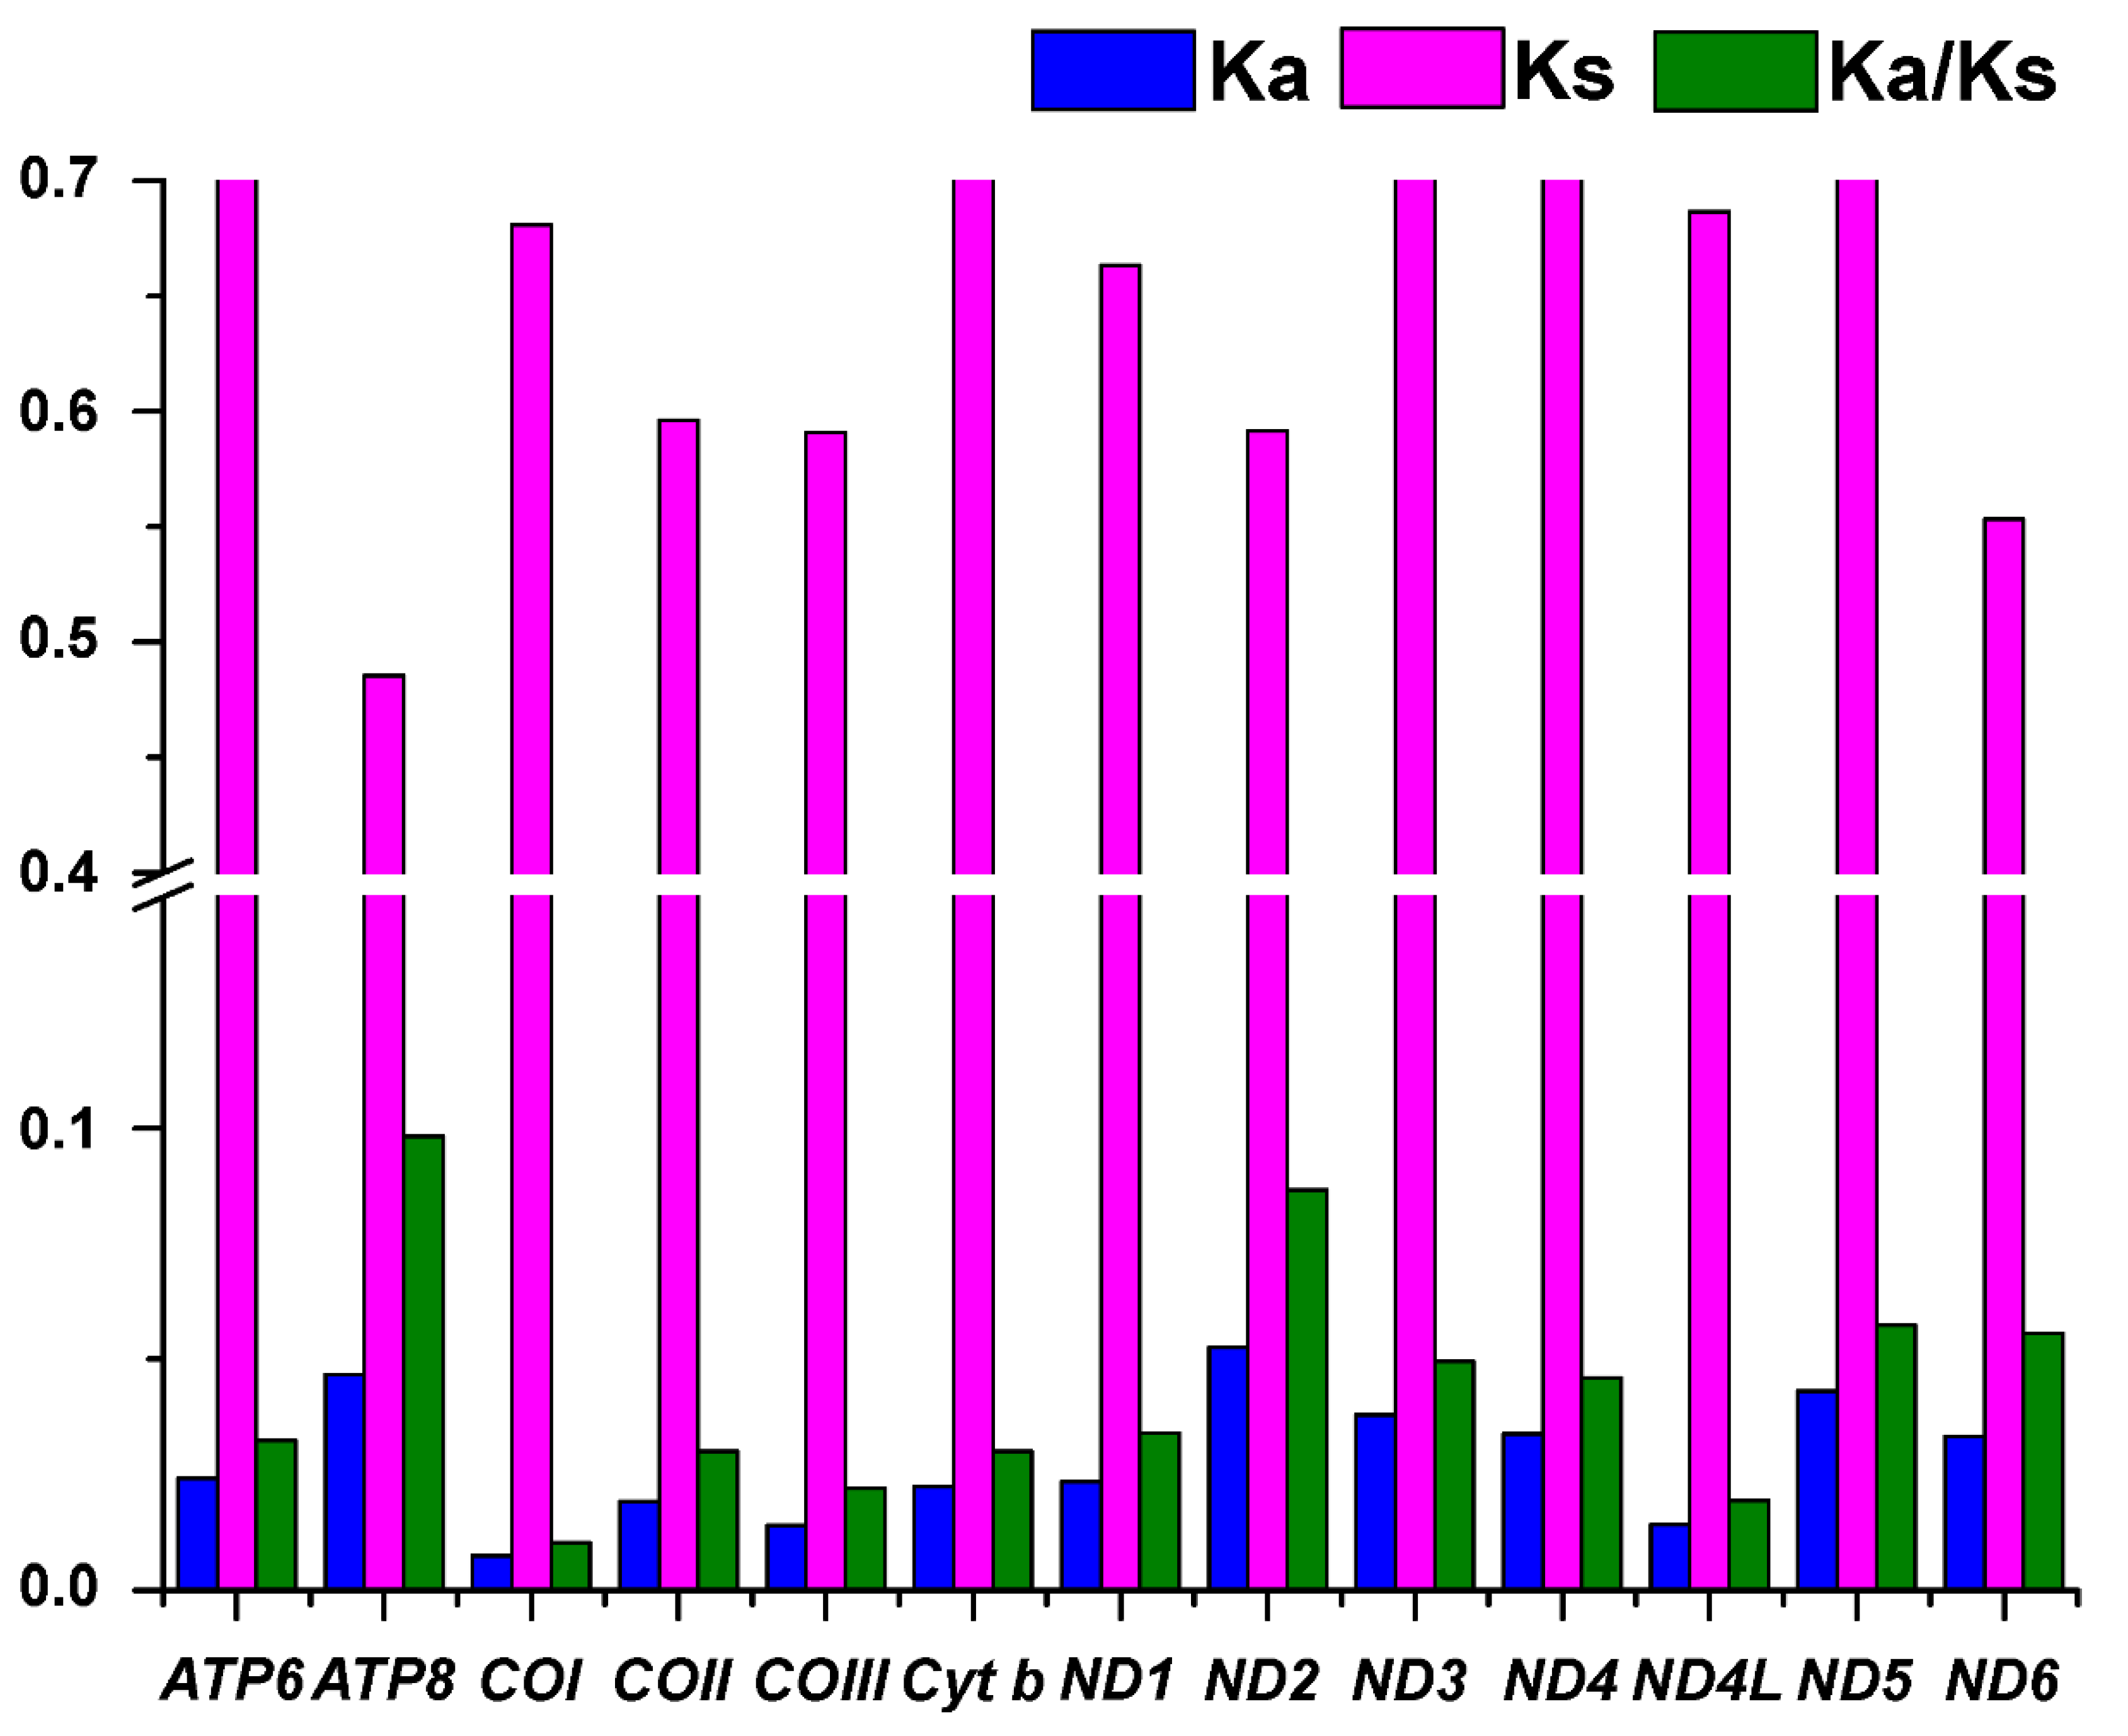
3.3. Evolutionary Rates and Patterns

To better understand the evolutionary patterns of the 13 PCGs and the role of selection, we calculated the values of Ka, Ks, and ω for each protein-coding gene (Figure 3). The results showed that ND4L has the lowest Ka value (0.486), and ND3 has the highest Ka value (0.78). COI has the lowest Ks value (0.007), and ND2 has the highest Ks value (0.052). The average ω value was 0.043, ranging from 0.01 (COI) to 0.098 (AT8). The ω values for all PCGs were well below one, suggesting that these functional genes evolved under purifying selection [32].

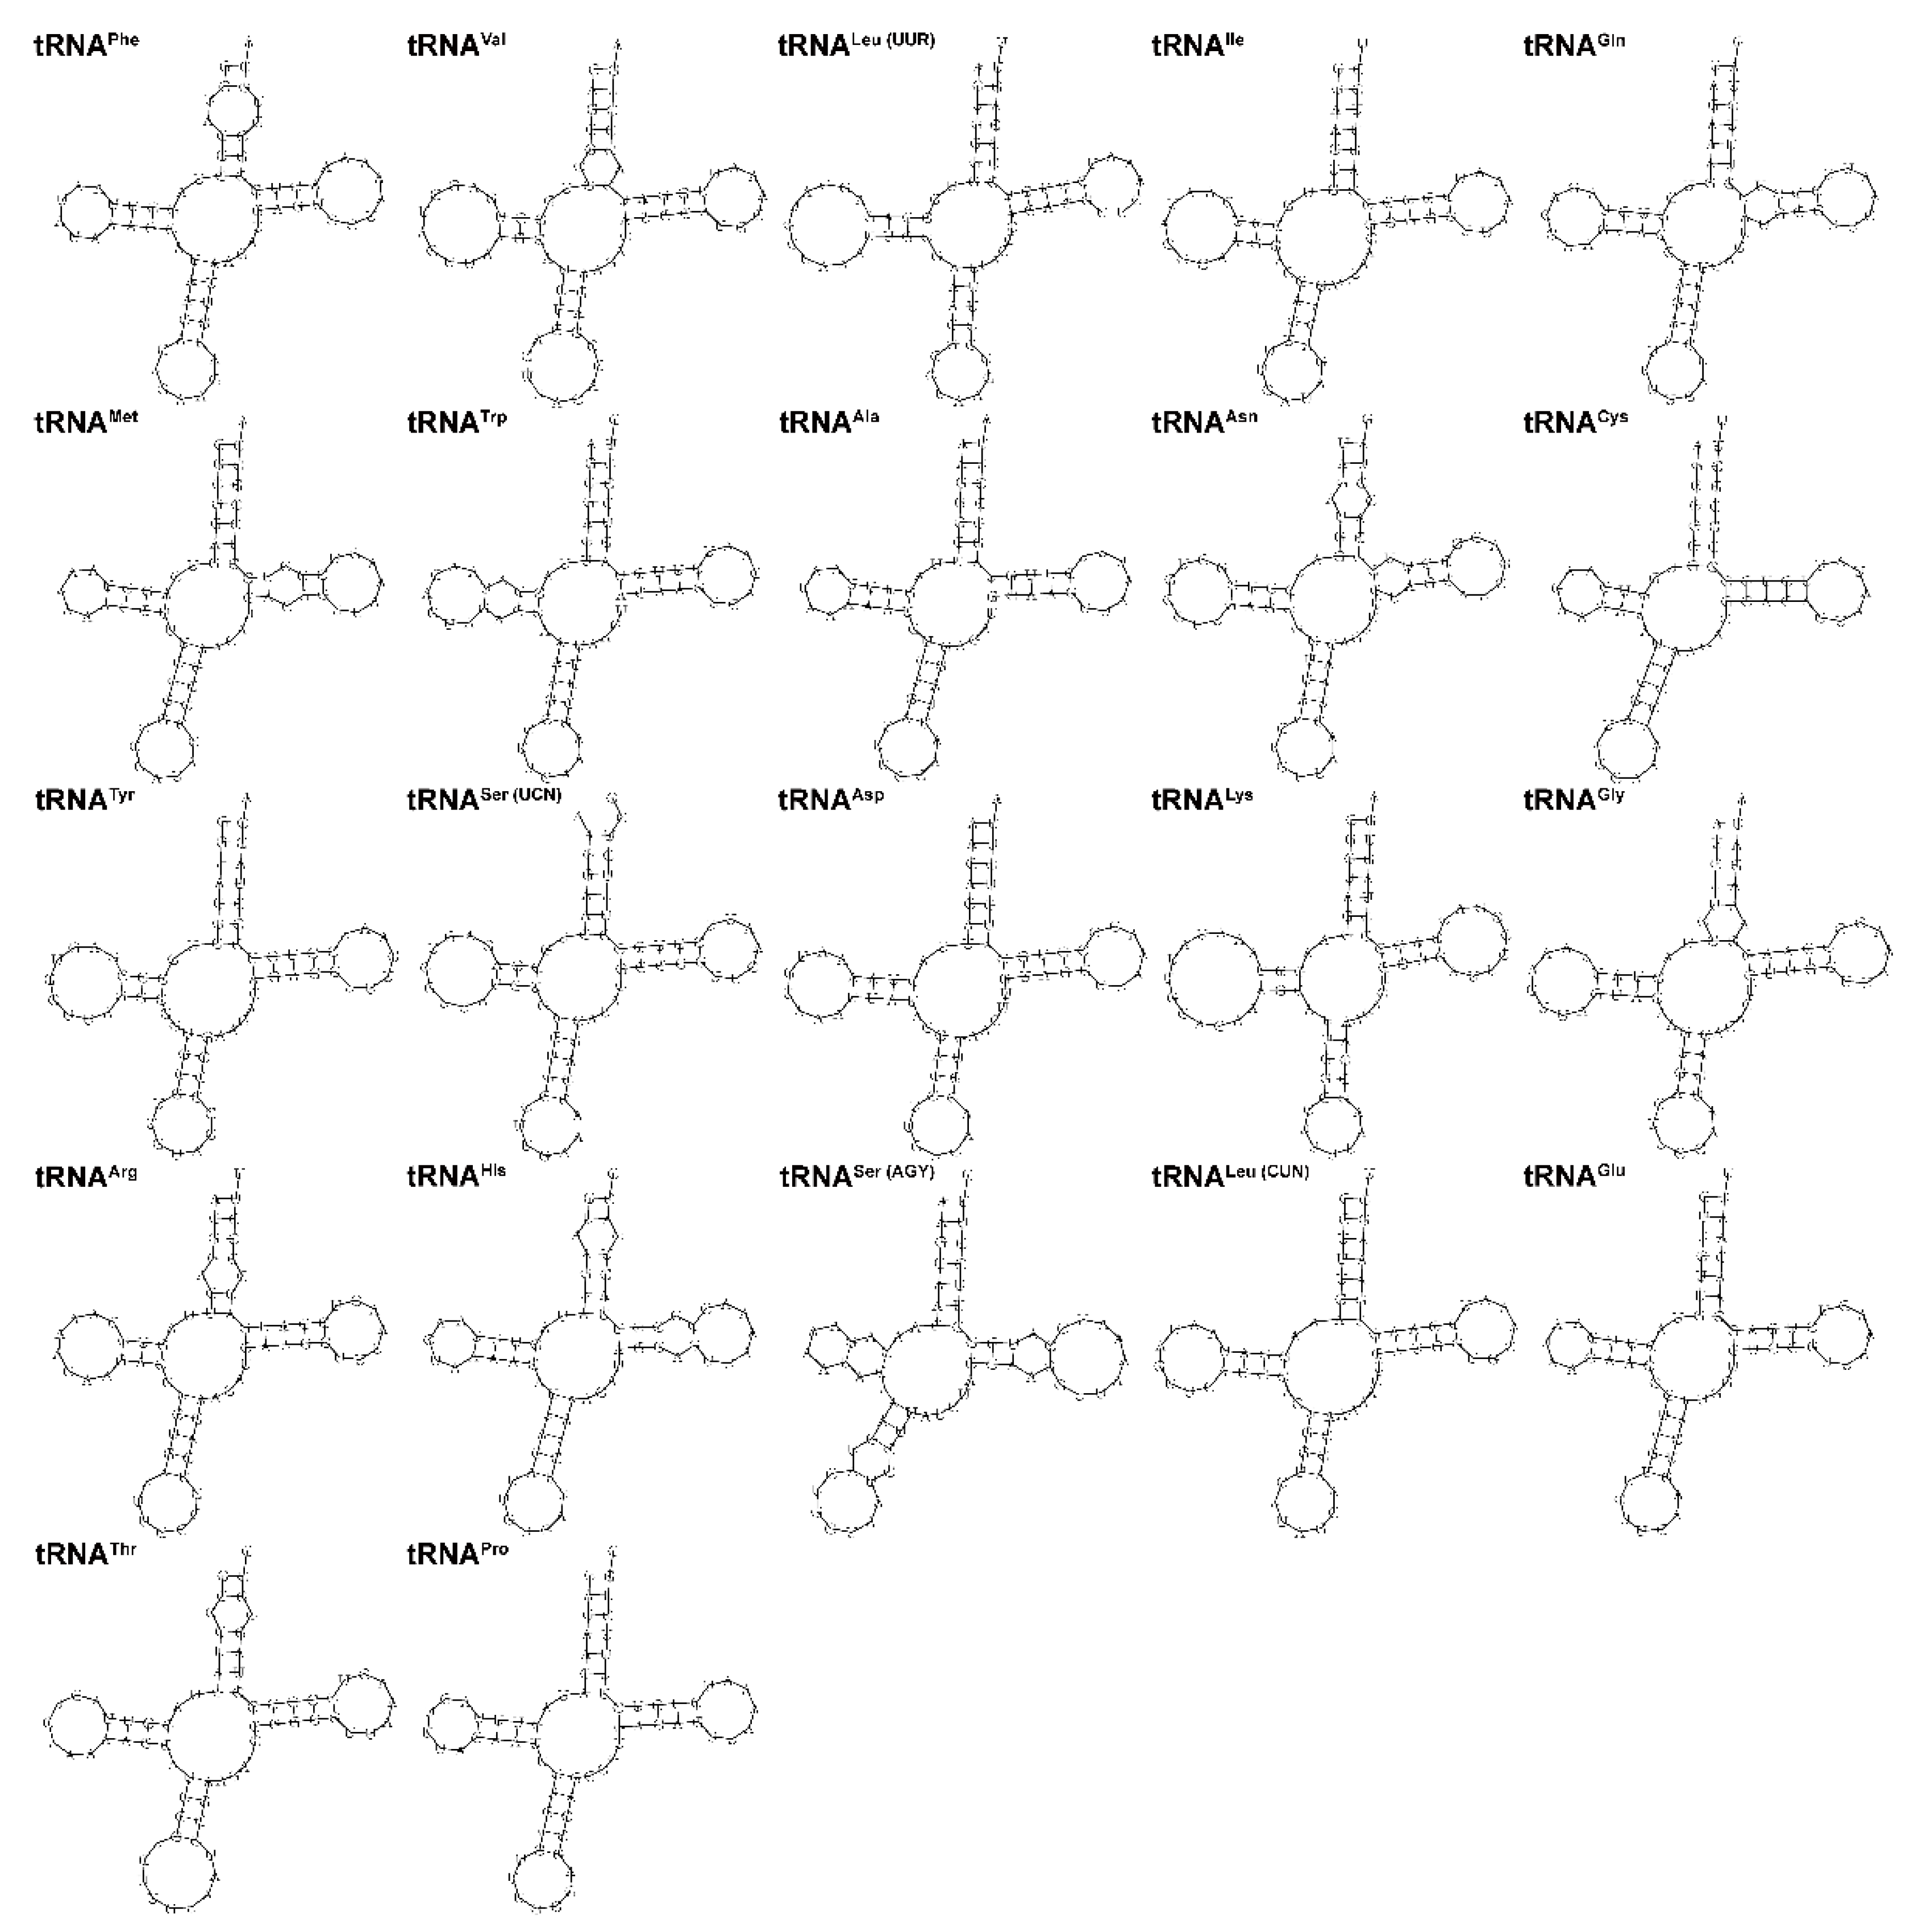
3.4. Ribosomal and Transfer RNA Genes

The ribosomal RNA gene encoded ribosomal RNA, which was the essential component of the ribosome and was involved in the protein synthesis processes. In the L. laticeps mitogenome, the sequence length of the small (12S) rRNA and large (16S) rRNA genes was 954 bp and 1683 bp, respectively. The two RNA genes were located close together, between the tRNAPhe and tRNALeu(UUR) genes, and split by the tRNAVal gene. The A+T content of the two RNA genes was 55.0%. Furthermore, the concatenated nucleotide sequence of two rRNA genes exhibited a positive A + T skew (0.276) and a negative G + C skew (−0.089) in L. laticeps.
Transfer RNA was one of the classical non-coding RNAs and was often referred to as tRNA. The secondary structures of 22 tRNA genes are shown in Figure 4. We found that only tRNASer(AGY) lacked the dihydrouridine (DHU) arm, and the remaining tRNA genes all formed a typical cloverleaf secondary structure. This loss was reported in many fishes [30]. The tRNA genes were distributed throughout the mitogenome and ranged in length from 67 bp (tRNACys) to 76 bp (tRNALeu(UUR) and tRNALys). The concatenated nucleotide sequence of the 22 tRNAs showed a high A+T bias, accounting for 55.5%, and exhibited a positive A + T skew (0.045) and a positive G + C skew (0.043) (Table 2).

3.5. Control Region

The non-coding region in the mitogenome was usually called the control region. Because this region contains promoters, it was critical for the initiation of replication and transcription in vertebrates [33,34]. The control region of L. laticeps was placed after tRNAPro, with a sequence length of 934 bp. The A + T skew was positive (0.001), and the G + C skew was negative (−0.189), suggesting a preference for using A and C bases in the control region.

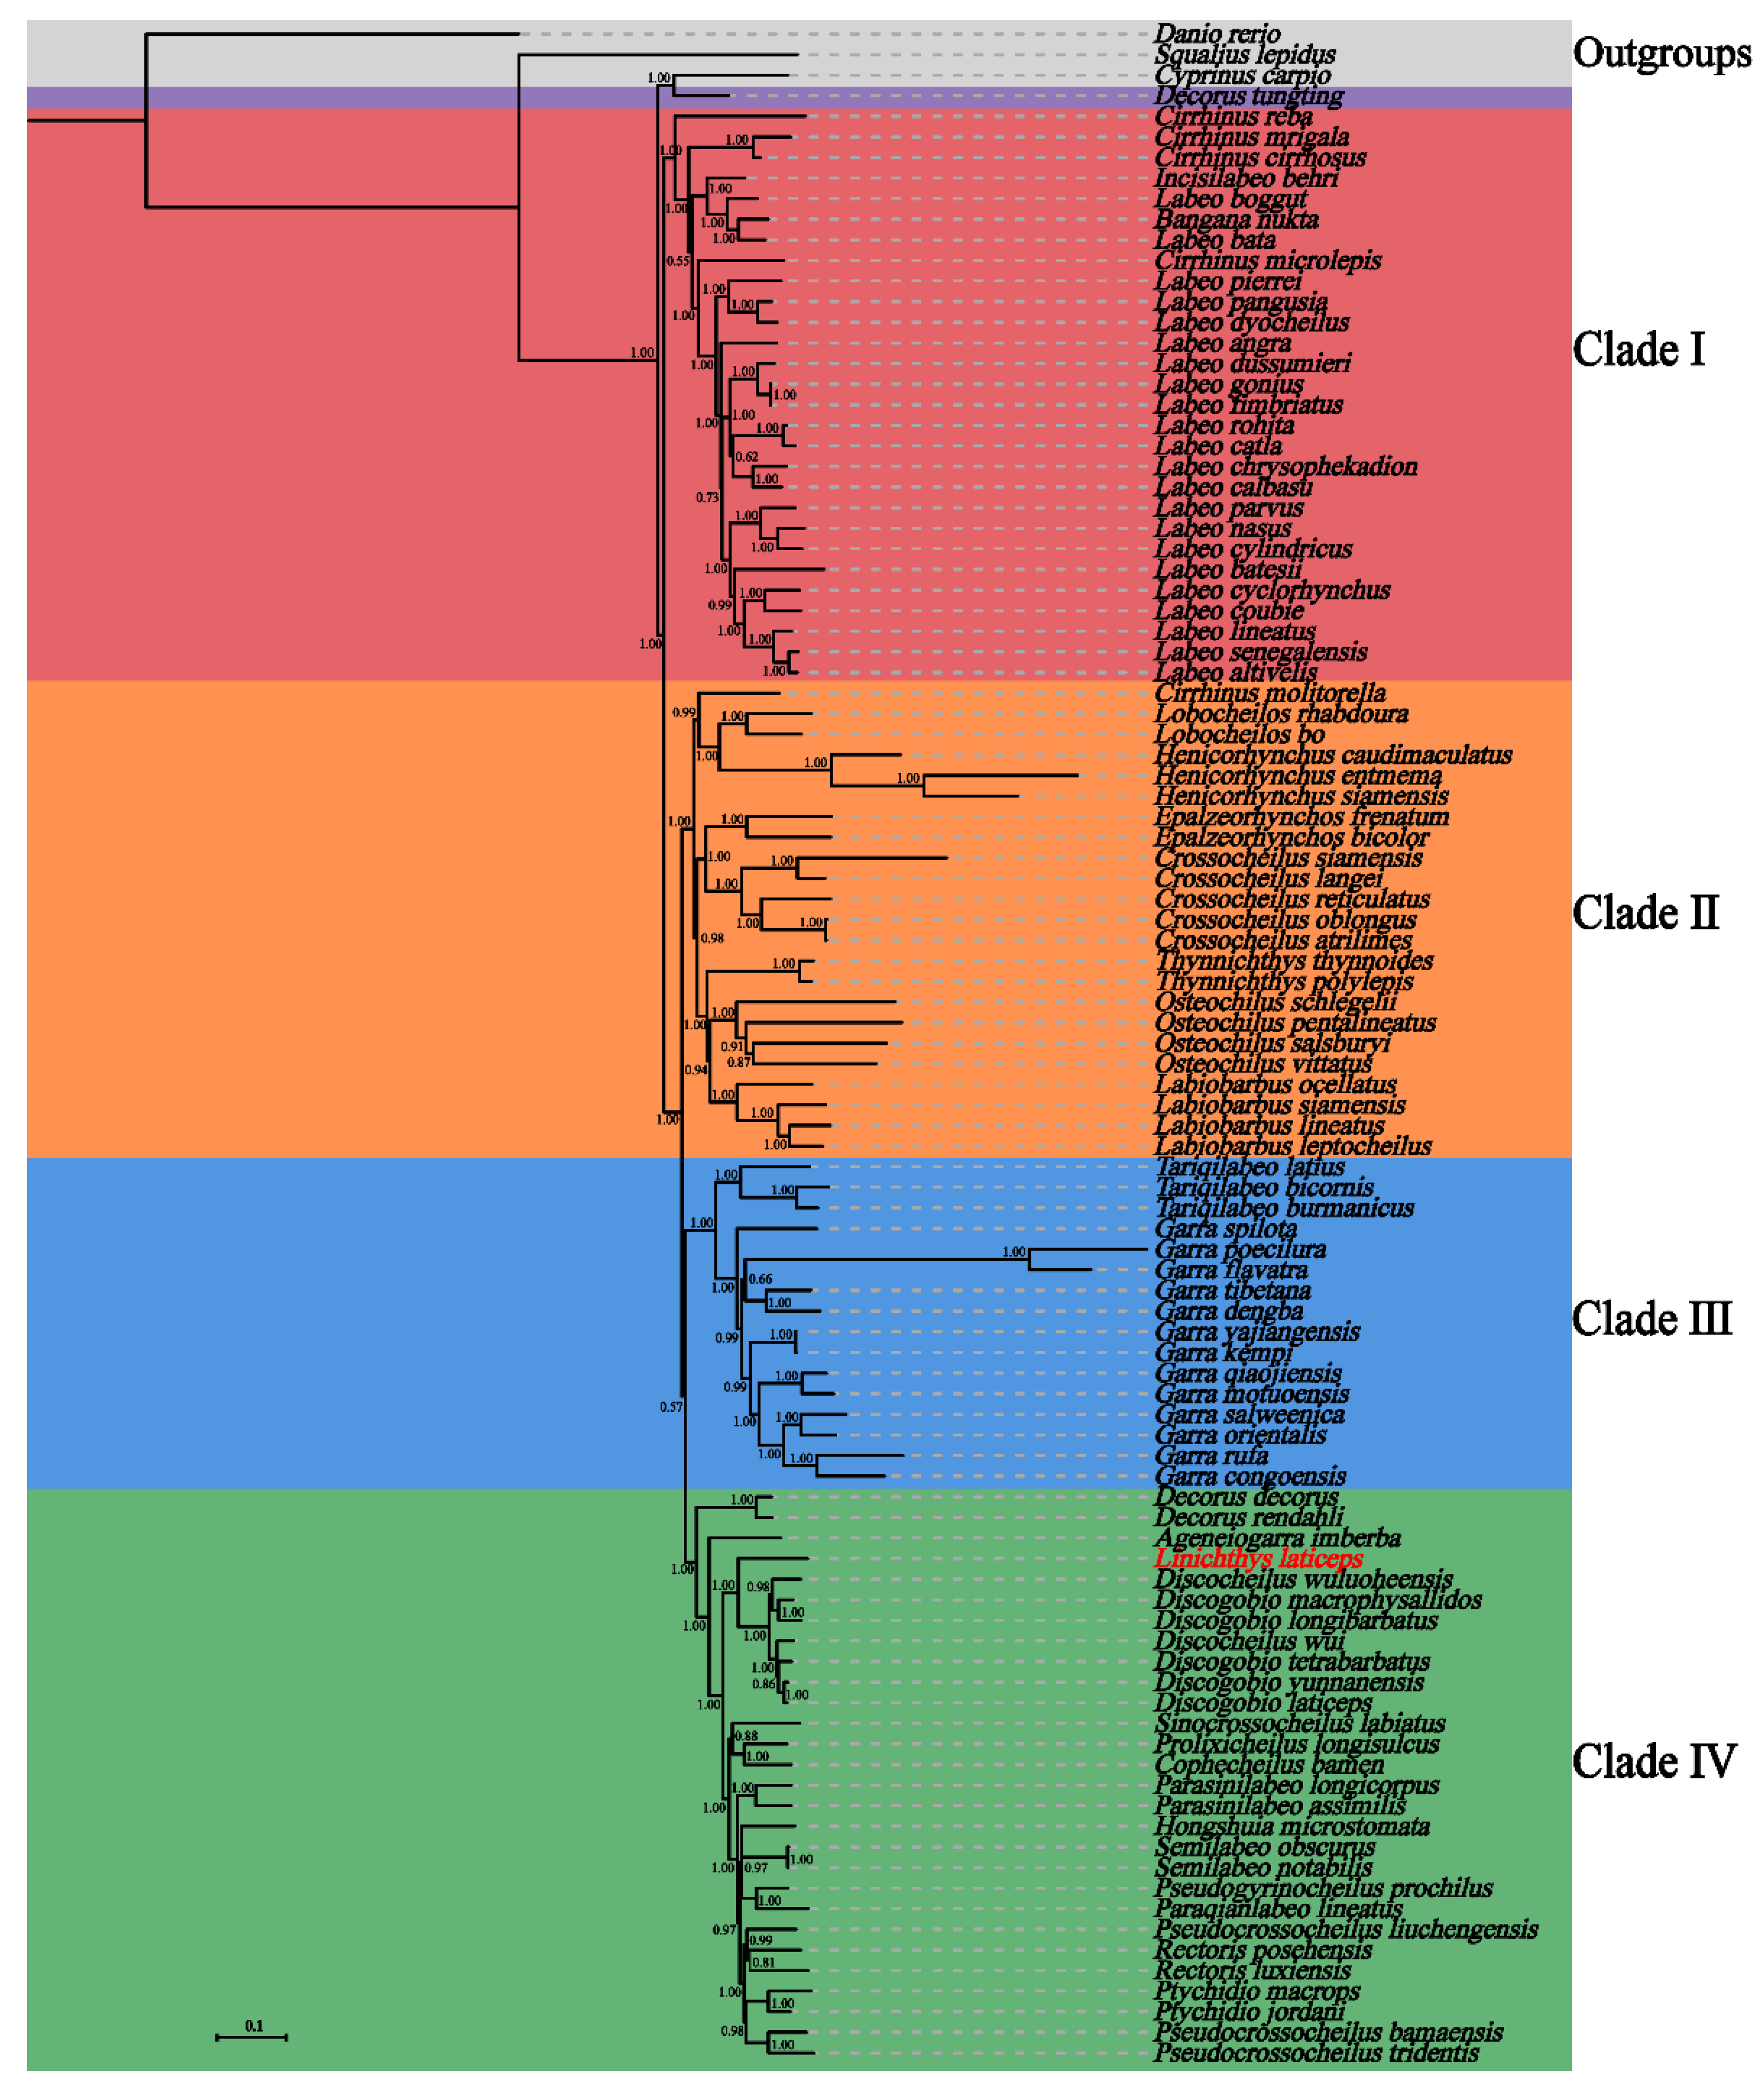
3.6. Phylogenetic Analysis

The phylogenetic analysis based on ML and BI was performed using the nucleotide sequences of 13 PCGs of L. laticeps and the other 96 species of the Labeoninae subfamily (Figure 5 and Figure S1). The results showed that the topological structures of the ML tree and the BI tree were similar (Figure 5 and Figure S1), and the 96 species were grouped into four clades except for Decorus tungting. The phylogenetic positions of clade II and clade III were reversed in the BI and ML trees, indicating that the evolutionary relationship of these two clades in the Labeoninae was unclear. Overall, the phylogeny of Labeoninae reconstructed in our study was very similar to previous studies [11,35]. However, the monophyly of Labeoninae has not been confirmed, and the intergeneric relationship of the labeoninae was controversial. D. tungting was previously known as Bangana tungting, and Bangana was composed of two clades in Labeoninae in previous molecular phylogenetic studies [9]. In recent years, the genus Bangana has been revised and renamed into a new genus, Decorus [36]. However, the phylogenetic position of D. tungting in this study was different from that in the previous study [36]. Therefore, we suggest that the taxonomy of D. tungting requires further revision.
Clade I includes Cirrhinus, Incisilabeo, Labeo, and Bangana. The group was located at the basic position of Labeoninae in the phylogenetic tree. All Labeo species were clustered in Clade I, but they did not form a monophyletic group (Figure 5 and Figure S1). Previous studies have also confirmed that Labeo was not a monophyletic group [10]. Clade II included Cirrhinus, Crossocheilus, Epalzeorhynchos, Henicorhynchus, Labiobarbus, Lobocheilos, Osteochilus, and Thynnichthys. Except for Cirrhinus molitorella, the other genera in Clade II formed their monophyletic groups. All species of the genus Cirrhinus, except C. molitorella, were located in Clade I. Clade III included Garra and Tariqilabeo. Within this clade, Tariqilabeo and Garra both formed their clades with high bootstrap support. Clade IV included Ageneiogarra, Cophecheilus, Decorus, Discogobio, Discocheilus, Hongshuia, Linichthys, Paraqianlabeo, Parasinilabeo, Pseudogyrinocheilus, Pseudocrossocheilus, Prolixicheilus, Ptychidio, Rectoris, Semilabeo, and Sinocrossocheilus. There were 16 genera in Clade IV, and the newly sequenced L. laticeps was confirmed as a member of the subfamily Labeoninae in this clade. The mitogenome of L. laticeps was most closely related to the genera Discogobio and Discocheilus. This was consistent with the phylogenetic relationships based on the combined mitochondrial and nuclear gene datasets [10].
In recent years, many genera of Labeoninae have been taxonomically revised, while new genera have been constantly added. However, due to the diversity and complexity of the morphology, there were many practical classification problems for some groups. The phylogenetic tree revealed that many genera were non-monophyletic, such as Cirrhinus, Labeo, and Pseudocrossocheilus, which conflicted with the past taxonomy based on morphology. The results indicated that the validities of some traditional genera required further checks.

4. Conclusions

Herein, we first described the complete mitogenome of L. laticeps from the subfamily Labeoninae. The complete mitogenome length was 16,593 bp, including 13 PCGs, two rRNAs, 22 tRNAs, and one control region, with the same mitogenome structure as other teleosts. The phylogenetic analysis of Labeoninae revealed that Labeoninae was not a monophyletic group, and L. laticeps was closely related to the genera Discogobio and Discocheilus. The results advanced our understanding of the phylogenetic relationship of Labeoninae. In addition, the mitogenomic sequence data presented here will contribute to further taxonomical study, population genetics, and the phylogeography of L. laticeps.

Supplementary Materials

The following supporting information can be downloaded at https://www.mdpi.com/article/10.3390/genes14101938/s1. Table S1: Taxon information of the subfamily Labeoninae and three outgroup species analyzed in this study. Figure S1: Maximum likelihood phylogeny based on the concatenated nucleotide sequences of 13 PCGs showed the phylogenetic relationship of L. laticeps with other Labeoninae species. The number on each node indicates the ML bootstrap values.

Author Contributions

Conceptualization, R.Z.; methodology, R.Z. and T.Z.; software, R.Z. and T.Z.; validation, R.Z., T.Z., L.D., and H.L.; formal analysis, R.Z., T.Z., and H.L.; investigation, R.Z. and L.D.; resources, R.Z. and L.D.; data curation, R.Z., T.Z., and H.L.; writing—original draft preparation, R.Z. and T.Z.; writing—review and editing, R.Z. and T.Z.; visualization, R.Z., T.Z., and H.L.; supervision, R.Z.; project administration, R.Z.; funding acquisition, R.Z. All authors have read and agreed to the published version of the manuscript.

Funding

This research was funded by the National Natural Science Foundation of China (31960097, 32160293) and the Natural Science Foundation of Guizhou Educational Committee (QianjiaoheKY [2021]306).

Institutional Review Board Statement

Not applicable.

Informed Consent Statement

Not applicable.

Data Availability Statement

The mitogenome sequence data are openly available in GenBank of NCBI under accession no. OR343919.

Conflicts of Interest

The authors declare no conflict of interest. The funders had no role in the design of the study; in the collection, analyses, or interpretation of data; in the writing of the manuscript; or in the decision to publish the results.

References

  1. Boore, J.L. Animal mitochondrial genomes. Nucleic Acids Res. 1999, 27, 1767–1780. [Google Scholar] [CrossRef] [PubMed]
  2. Xiao, W.H.; Zhang, Y.P. Genetics and evolution of mitochondrial DNA in fish. Acta Hydrobiol. Sin. 2000, 24, 384–391. [Google Scholar]
  3. Brown, K.H. Fish mitochondrial genomics: Sequence, inheritance and functional variation. J. Fish Biol. 2008, 72, 355–374. [Google Scholar] [CrossRef]
  4. Zhang, R.; Deng, L.; Lv, X.; Tang, Q. Complete mitochondrial genomes of two catfishes (Siluriformes, Bagridae) and their phylogenetic implications. Zookeys 2022, 1115, 103–116. [Google Scholar] [CrossRef]
  5. Zhang, R.; Tang, Q.; Deng, L. The complete mitochondrial genome of Microphysogobio elongatus (Teleostei, Cyprinidae) and its phylogenetic implications. Zookeys 2021, 1061, 57–73. [Google Scholar] [CrossRef] [PubMed]
  6. Zhu, T.; Sato, Y.; Sado, T.; Miya, M.; Iwasaki, W. MitoFish, MitoAnnotator, and MiFish Pipeline: Updates in ten years. Mol. Biol. Evol. 2023, 40, msad035. [Google Scholar] [CrossRef] [PubMed]
  7. Fricke, R.; Eschmeyer, W.N.; Van der Laan, R. Eschmeyer’s Catalog of Fishes: Genera, Species, References. Electronic Version. Available online: https://researcharchive.calacademy.org/research/ichthyology/catalog/fishcatmain.asp (accessed on 25 August 2023).
  8. Yang, L.; Mayden, R.L. Phylogenetic relationships, subdivision, and biogeography of the cyprinid tribe Labeonini (sensu Rainboth, 1991) (Teleostei: Cypriniformes), with comments on the implications of lips and associated structures in the labeonin classification. Mol. Phylogenet. Evol. 2010, 54, 254–265. [Google Scholar] [CrossRef] [PubMed]
  9. Zheng, L.P.; Yang, J.X.; Chen, X.Y.; Wang, W.Y. Phylogenetic relationships of the Chinese Labeoninae (Teleostei, Cypriniformes) derived from two nuclear and three mitochondrial genes. Zool. Scr. 2010, 39, 559–571. [Google Scholar] [CrossRef]
  10. Yang, L.; Arunachalam, M.; Sado, T.; Levin, B.A.; Golubtsov, A.S.; Freyhof, J.; Friel, J.P.; Chen, W.J.; Hirt, M.V.; Manickam, R.; et al. Molecular phylogeny of the cyprinid tribe Labeonini (Teleostei: Cypriniformes). Mol. Phylogenet. Evol. 2012, 65, 362–379. [Google Scholar] [CrossRef] [PubMed]
  11. Zhang, M.Y.; Zhou, Q.; Xiang, H.M.; Wang, J.X.; Lan, X.Y.; Luo, Q.H.; Jiang, W.S. Complete mitochondrial genome of Rectoris luxiensis (Teleostei, Cyprinidae): Characterisation and phylogenetic implications. Biodivers. Data J. 2023, 11, e96066. [Google Scholar] [CrossRef]
  12. Zhang, E.; Fang, F. Linichthys: A new genus of Chinese cyprinid fishes (Teleostei: Cypriniformes). Copeia 2005, 1, 61–67. [Google Scholar] [CrossRef]
  13. Lin, R.D.; Zhang, C.G. Description of a new species of the Barbine genus Barbodes from China (Cypriniformes: Cyprinides). Acta Zootaxonomica Sin. 1986, 11, 108–110. [Google Scholar]
  14. Jin, J.J.; Yu, W.B.; Yang, J.B.; Song, Y.; dePamphilis, C.W.; Yi, T.S.; Li, D.Z. GetOrganelle: A fast and versatile toolkit for accurate de novo assembly of organelle genomes. Genome Biol. 2020, 21, 241. [Google Scholar] [CrossRef] [PubMed]
  15. Chan, P.P.; Lin, B.Y.; Mak, A.J.; Lowe, T.M. tRNAscan-SE 2.0: Improved detection and functional classification of transfer RNA genes. Nucleic Acids Res. 2021, 49, 9077–9096. [Google Scholar] [CrossRef]
  16. Bernt, M.; Donath, A.; Juhling, F.; Externbrink, F.; Florentz, C.; Fritzsch, G.; Putz, J.; Middendorf, M.; Stadler, P.F. MITOS: Improved de novo metazoan mitochondrial genome annotation. Mol. Phylogenet. Evol. 2013, 69, 313–319. [Google Scholar] [CrossRef] [PubMed]
  17. Perna, N.T.; Kocher, T.D. Patterns of nucleotide composition at fourfold degenerate sites of animal mitochondrial genomes. J. Mol. Evol. 1995, 41, 353–358. [Google Scholar] [CrossRef]
  18. Tamura, K.; Stecher, G.; Peterson, D.; Filipski, A.; Kumar, S. MEGA6: Molecular evolutionary genetics analysis version 6.0. Mol. Biol. Evol. 2013, 30, 2725–2729. [Google Scholar] [CrossRef]
  19. Rozas, J.; Ferrer-Mata, A.; Sanchez-DelBarrio, J.C.; Guirao-Rico, S.; Librado, P.; Ramos-Onsins, S.E.; Sanchez-Gracia, A. DnaSP 6: DNA sequence polymorphism analysis of large data sets. Mol. Biol. Evol. 2017, 34, 3299–3302. [Google Scholar] [CrossRef]
  20. Zhang, D.; Gao, F.; Jakovlić, I.; Zou, H.; Zhang, J.; Li, W.X.; Wang, G.T. PhyloSuite: An integrated and scalable desktop platform for streamlined molecular sequence data management and evolutionary phylogenetics studies. Mol. Ecol. Resour. 2020, 20, 348–355. [Google Scholar] [CrossRef]
  21. Katoh, K.; Standley, D.M. MAFFT multiple sequence alignment software version 7: Improvements in performance and usability. Mol. Biol. Evol. 2013, 30, 772–780. [Google Scholar] [CrossRef]
  22. Lanfear, R.; Frandsen, P.B.; Wright, A.M.; Senfeld, T.; Calcott, B. PartitionFinder 2: New methods for selecting partitioned models of evolution for molecular and morphological phylogenetic analyses. Mol. Biol. Evol. 2017, 34, 772–773. [Google Scholar] [CrossRef]
  23. Nguyen, L.T.; Schmidt, H.A.; von Haeseler, A.; Minh, B.Q. IQ-TREE: A fast and effective stochastic algorithm for estimating maximum-likelihood phylogenies. Mol. Biol. Evol. 2015, 32, 268–274. [Google Scholar] [CrossRef] [PubMed]
  24. Minh, B.Q.; Nguyen, M.A.; von Haeseler, A. Ultrafast approximation for phylogenetic bootstrap. Mol. Biol. Evol. 2013, 30, 1188–1195. [Google Scholar] [CrossRef] [PubMed]
  25. Guindon, S.; Dufayard, J.F.; Lefort, V.; Anisimova, M.; Hordijk, W.; Gascuel, O. New algorithms and methods to estimate maximum-likelihood phylogenies: Assessing the performance of PhyML 3.0. Syst. Biol. 2010, 59, 307–321. [Google Scholar] [CrossRef]
  26. Ronquist, F.; Teslenko, M.; van der Mark, P.; Ayres, D.L.; Darling, A.; Hohna, S.; Larget, B.; Liu, L.; Suchard, M.A.; Huelsenbeck, J.P. MrBayes 3.2: Efficient Bayesian phylogenetic inference and model choice across a large model space. Syst. Biol. 2012, 61, 539–542. [Google Scholar] [CrossRef] [PubMed]
  27. Wang, W.; Li, S.K.; Liu, T.; Wang, X.; Zeng, S.; Min, W.W.; Zhou, L. Characterization of the complete mitochondrial genome of an endangered fish Semilabeo obscurus (Cyprinidae; Labeoninae; Semilabeo). Conserv. Genet. Resour. 2019, 11, 147–150. [Google Scholar] [CrossRef]
  28. Chen, W.; Miao, K.; Wang, J.; Wang, H.; Sun, W.; Yuan, S.; Luo, S.; Hu, C.; Chang, Q. Five new mitogenomes sequences of Calidridine sandpipers (Aves: Charadriiformes) and comparative mitogenomics of genus Calidris. Peer J. 2022, 10, e13268. [Google Scholar] [CrossRef]
  29. Zhang, R.; Wang, X. Characterization and phylogenetic analysis of the complete mitogenome of a rare cavefish, Sinocyclocheilus multipunctatus (Cypriniformes: Cyprinidae). Genes Genom. 2018, 40, 1033–1040. [Google Scholar] [CrossRef]
  30. Zhang, R.; Zhu, T.; Luo, Q. The complete mitochondrial genome of the freshwater fish Onychostoma ovale (Cypriniformes, Cyprinidae): Genome characterization and phylogenetic analysis. Genes 2023, 14, 1227. [Google Scholar] [CrossRef]
  31. Ojala, D.; Montoya, J.; Attardi, G. tRNA punctuation model of RNA processing in human mitochondria. Nature 1981, 290, 470–474. [Google Scholar] [CrossRef]
  32. Yang, Z.; Bielawski, J.P. Statistical methods for detecting molecular adaptation. Trends. Ecol. Evol. 2000, 15, 496–503. [Google Scholar] [CrossRef] [PubMed]
  33. Wolstenholme, D.R. Animal mitochondrial DNA: Structure and evolution. Int. Rev. Cytol. 1992, 141, 173–216. [Google Scholar] [CrossRef] [PubMed]
  34. Zhang, D.-X.; Hewitt, G.M. Insect mitochondrial control region: A review of its structure, evolution and usefulness in evolutionary studies. Biochem. Syst. Ecol. 1997, 25, 99–120. [Google Scholar] [CrossRef]
  35. Zhang, C.; Zhang, K.; Peng, Y.; Zhou, J.; Liu, Y.; Liu, B. Novel gene rearrangement in the mitochondrial genome of three Garra and insights into the phylogenetic relationships of Labeoninae. Front. Genet. 2022, 13, 922634. [Google Scholar] [CrossRef] [PubMed]
  36. Zheng, L.P.; Chen, X.Y.; Yang, J.X. Molecular phylogeny and systematic revision of Bangana sensu lato (Teleostei, Cyprinidae). J. Zool. Syst. Evol. Res. 2019, 57, 884–891. [Google Scholar] [CrossRef]
Figure 1. Circular map of the L. laticeps mitogenome.
Genes 14 01938 g001
Figure 2. Relative synonymous codon usage (RSCU) of 13 PCGs in the mitogenome of L. laticeps.
Genes 14 01938 g002
Figure 3. Ka, Ks, and ω values of 13 PCGs in L. laticeps.
Genes 14 01938 g003
Figure 4. The secondary structures of 22 tRNA genes in the L. laticeps mitogenome were predicted by MITOS Web Server.
Genes 14 01938 g004
Figure 5. Bayesian inference phylogenetic tree inferred based on the 13 PCGs of L. laticeps and other species within the subfamily Labeoninae. The number at each node indicates the posterior probabilities. The detailed species information used for the phylogenetic analyses is provided in Table S1.
Genes 14 01938 g005
Table 1. Organization of the mitogenome of L. laticeps.
GeneLocationSize (bp)CodonAnticodonStrand *Intergenetic Nucleotides
FromToStartStop
tRNAPhe16969 GAAH0
12S rRNA701023954 H0
tRNAVal1024109572 TACH0
16S rRNA109627781683 H0
tRNALeu(UUR)2779285476 TAAH0
ND128563830975ATGTAA H1
tRNAIle3836390772 H5
tRNAGln3906397671 GATL−2
tRNAMet3978404669 TTGH1
ND2404750911045ATGT--CATH0
tRNATrp5092516271 H0
tRNAAla5165523369 TCAL2
tRNAAsn5235530773 TGCL1
tRNACys5341540767 GTTL33
tRNATyr5409547971 GCAL1
COI548170311551GTGTAAGTAH1
tRNASer(UCN)7032710271 L0
tRNAAsp7106717772 TGAH3
COII71917881691ATGT--GTCH13
tRNALys7882795776 H0
ATPase879598123165ATGTAATTTH1
ATPase681178799683ATGTA- H−7
COIII88009584785ATGTA- H0
tRNAGly9585965672 H0
ND3965710,005349ATGT--TCCH0
tRNAArg10,00610,07570 H0
ND4L10,07610,372297ATGTAATCGH0
ND410,36611,7461381ATGT-- H−7
tRNAHis11,74711,81569 H0
tRNASer(AGY)11,81611,88469 GTGH0
tRNALeu(CUN)11,88611,95873 GCTH1
ND511,96213,7851824ATGTAATAGH3
ND613,78214,303522ATGTAA L−4
tRNAGlu14,30414,37269 L0
Cyt b14,37815,5181141ATGT-- H5
tRNAThr15,51915,59072 H0
tRNAPro15,59015,65970 L−1
control region15,66016,593934 H0
* H—heavy strand; L—light strand.
Table 2. Nucleotide composition (%) and skewness of the L. laticeps mitogenome.
LocationSize (bp)ATGCA + TG + CA + T SkewG + C Skew
Genome16,59331.425.716.026.957.142.90.100−0.254
PCGs11,40029.327.715.527.557.043.00.028−0.279
1st codon position380027.022.025.725.349.051.00.1020.008
2nd codon position380018.540.713.627.259.240.8−0.375−0.333
3rd codon position380042.320.47.330.062.737.30.349−0.609
rRNA263735.119.920.524.555.045.00.276−0.089
tRNA156329.026.523.221.355.544.50.0450.043
control region93433.433.313.519.866.733.30.001−0.189
Table 3. Codon number and RSCU of 13 PCGs in the mitogenome of L. laticeps.
Amino AcidCodonCountRSCUAmino AcidCodonCountRSCU
PheUUU1080.94TyrUAU591.04
PheUUC1231.06TyrUAC540.96
LeuUUA1451.39stop codonUAA64
LeuUUG160.15stop codonUAG00
LeuCUU850.82HisCAU320.59
LeuCUC1020.98HisCAC761.41
LeuCUA2352.26GlnCAA881.74
LeuCUG420.4GlnCAG130.26
IleAUU1781.21AsnAAU520.85
IleAUC1160.79AsnAAC701.15
MetAUA1441.62LysAAA721.89
MetAUG340.38LysAAG40.11
ValGUU540.99AspGAU210.55
ValGUC350.64AspGAC551.45
ValGUA1091.99GluGAA801.57
ValGUG210.38GluGAG220.43
SerUCU330.86CysUGU60.48
SerUCC551.44CysUGC191.52
SerUCA832.17TrpUGA1061.78
SerUCG90.24TrpUGG130.22
ProCCU190.36ArgCGU70.37
ProCCC741.38ArgCGC160.84
ProCCA1061.98ArgCGA452.37
ProCCG150.28ArgCGG80.42
ThrACU390.51SerAGU110.29
ThrACC1121.46SerAGC381
ThrACA1371.79stop codonAGA00
ThrACG190.25stop codonAGG00
AlaGCU490.59GlyGGU240.39
AlaGCC1401.69GlyGGC540.87
AlaGCA1361.64GlyGGA1161.88
AlaGCG70.08GlyGGG530.86
Disclaimer/Publisher’s Note: The statements, opinions and data contained in all publications are solely those of the individual author(s) and contributor(s) and not of MDPI and/or the editor(s). MDPI and/or the editor(s) disclaim responsibility for any injury to people or property resulting from any ideas, methods, instructions or products referred to in the content.

