
Complete Mitochondrial Genome Characterization of Schrankia costaestrigalis (Insecta: Erebidae: Hypenodinae) and Its Phylogenetic Implication
 , ,
, ,
Abstract
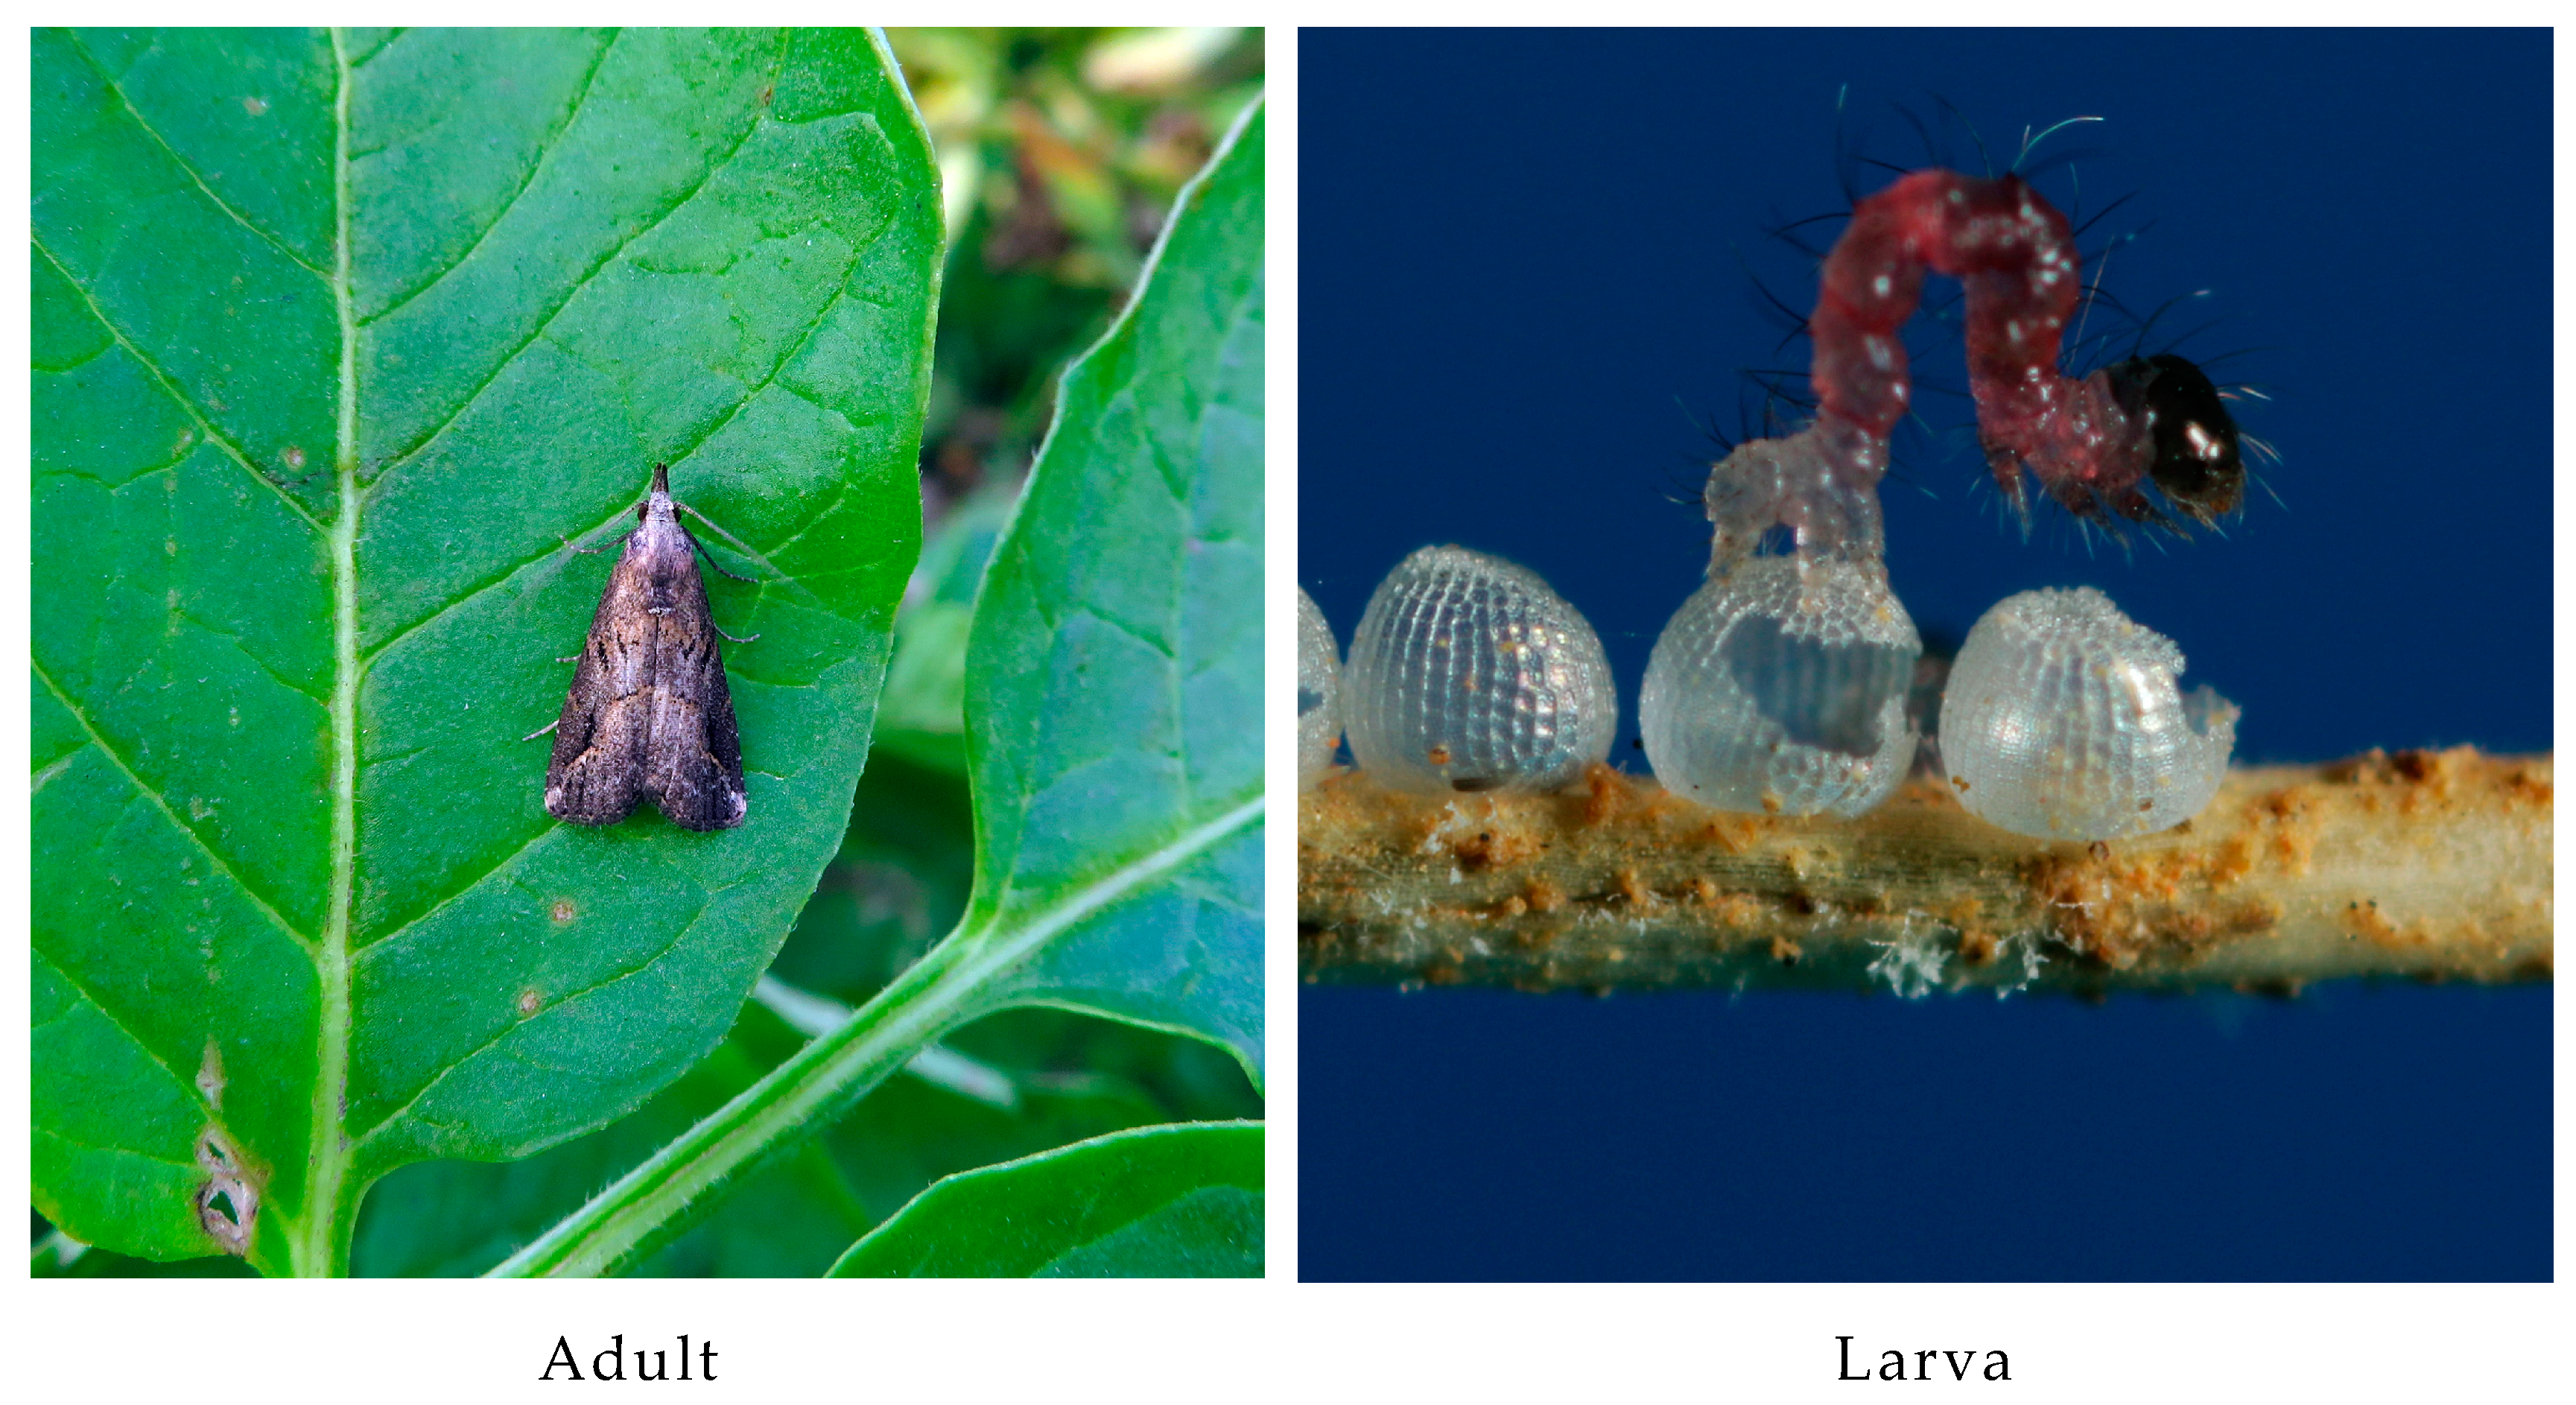
:1. Introduction
2. Materials and Methods
2.1. Animal Materials and DNA Extraction
2.2. Illumina and Sanger Sequencing
2.3. Raw Reads Cleaning and Mitogenome Assembly
- (1)
- Trimming adapter sequences longer than six bases;
- (2)
- Removal of reads with >0 unidentified nucleotides (N);
- (3)
- Removal of reads with >20% bases with Phred quality < Q20;
- (4)
- Removal of reads with <15 bases.
- (1)
- (2)
- The mitogenome of S. costaestrigalis was constructed from high-quality cleaned reads using the de novo assembly software GetOrganelle v1.7.6.1 [14]. Default parameters were employed, and the cox1 gene from the S. costaestrigalis isolate Scos02 (GenBank: EF061755.1) [13] served as the initial reference sequence for assembly.
2.4. Annotation and Analysis of the Mitochondrial Genome
2.5. Phylogenetic Inference
3. Results and Discussion
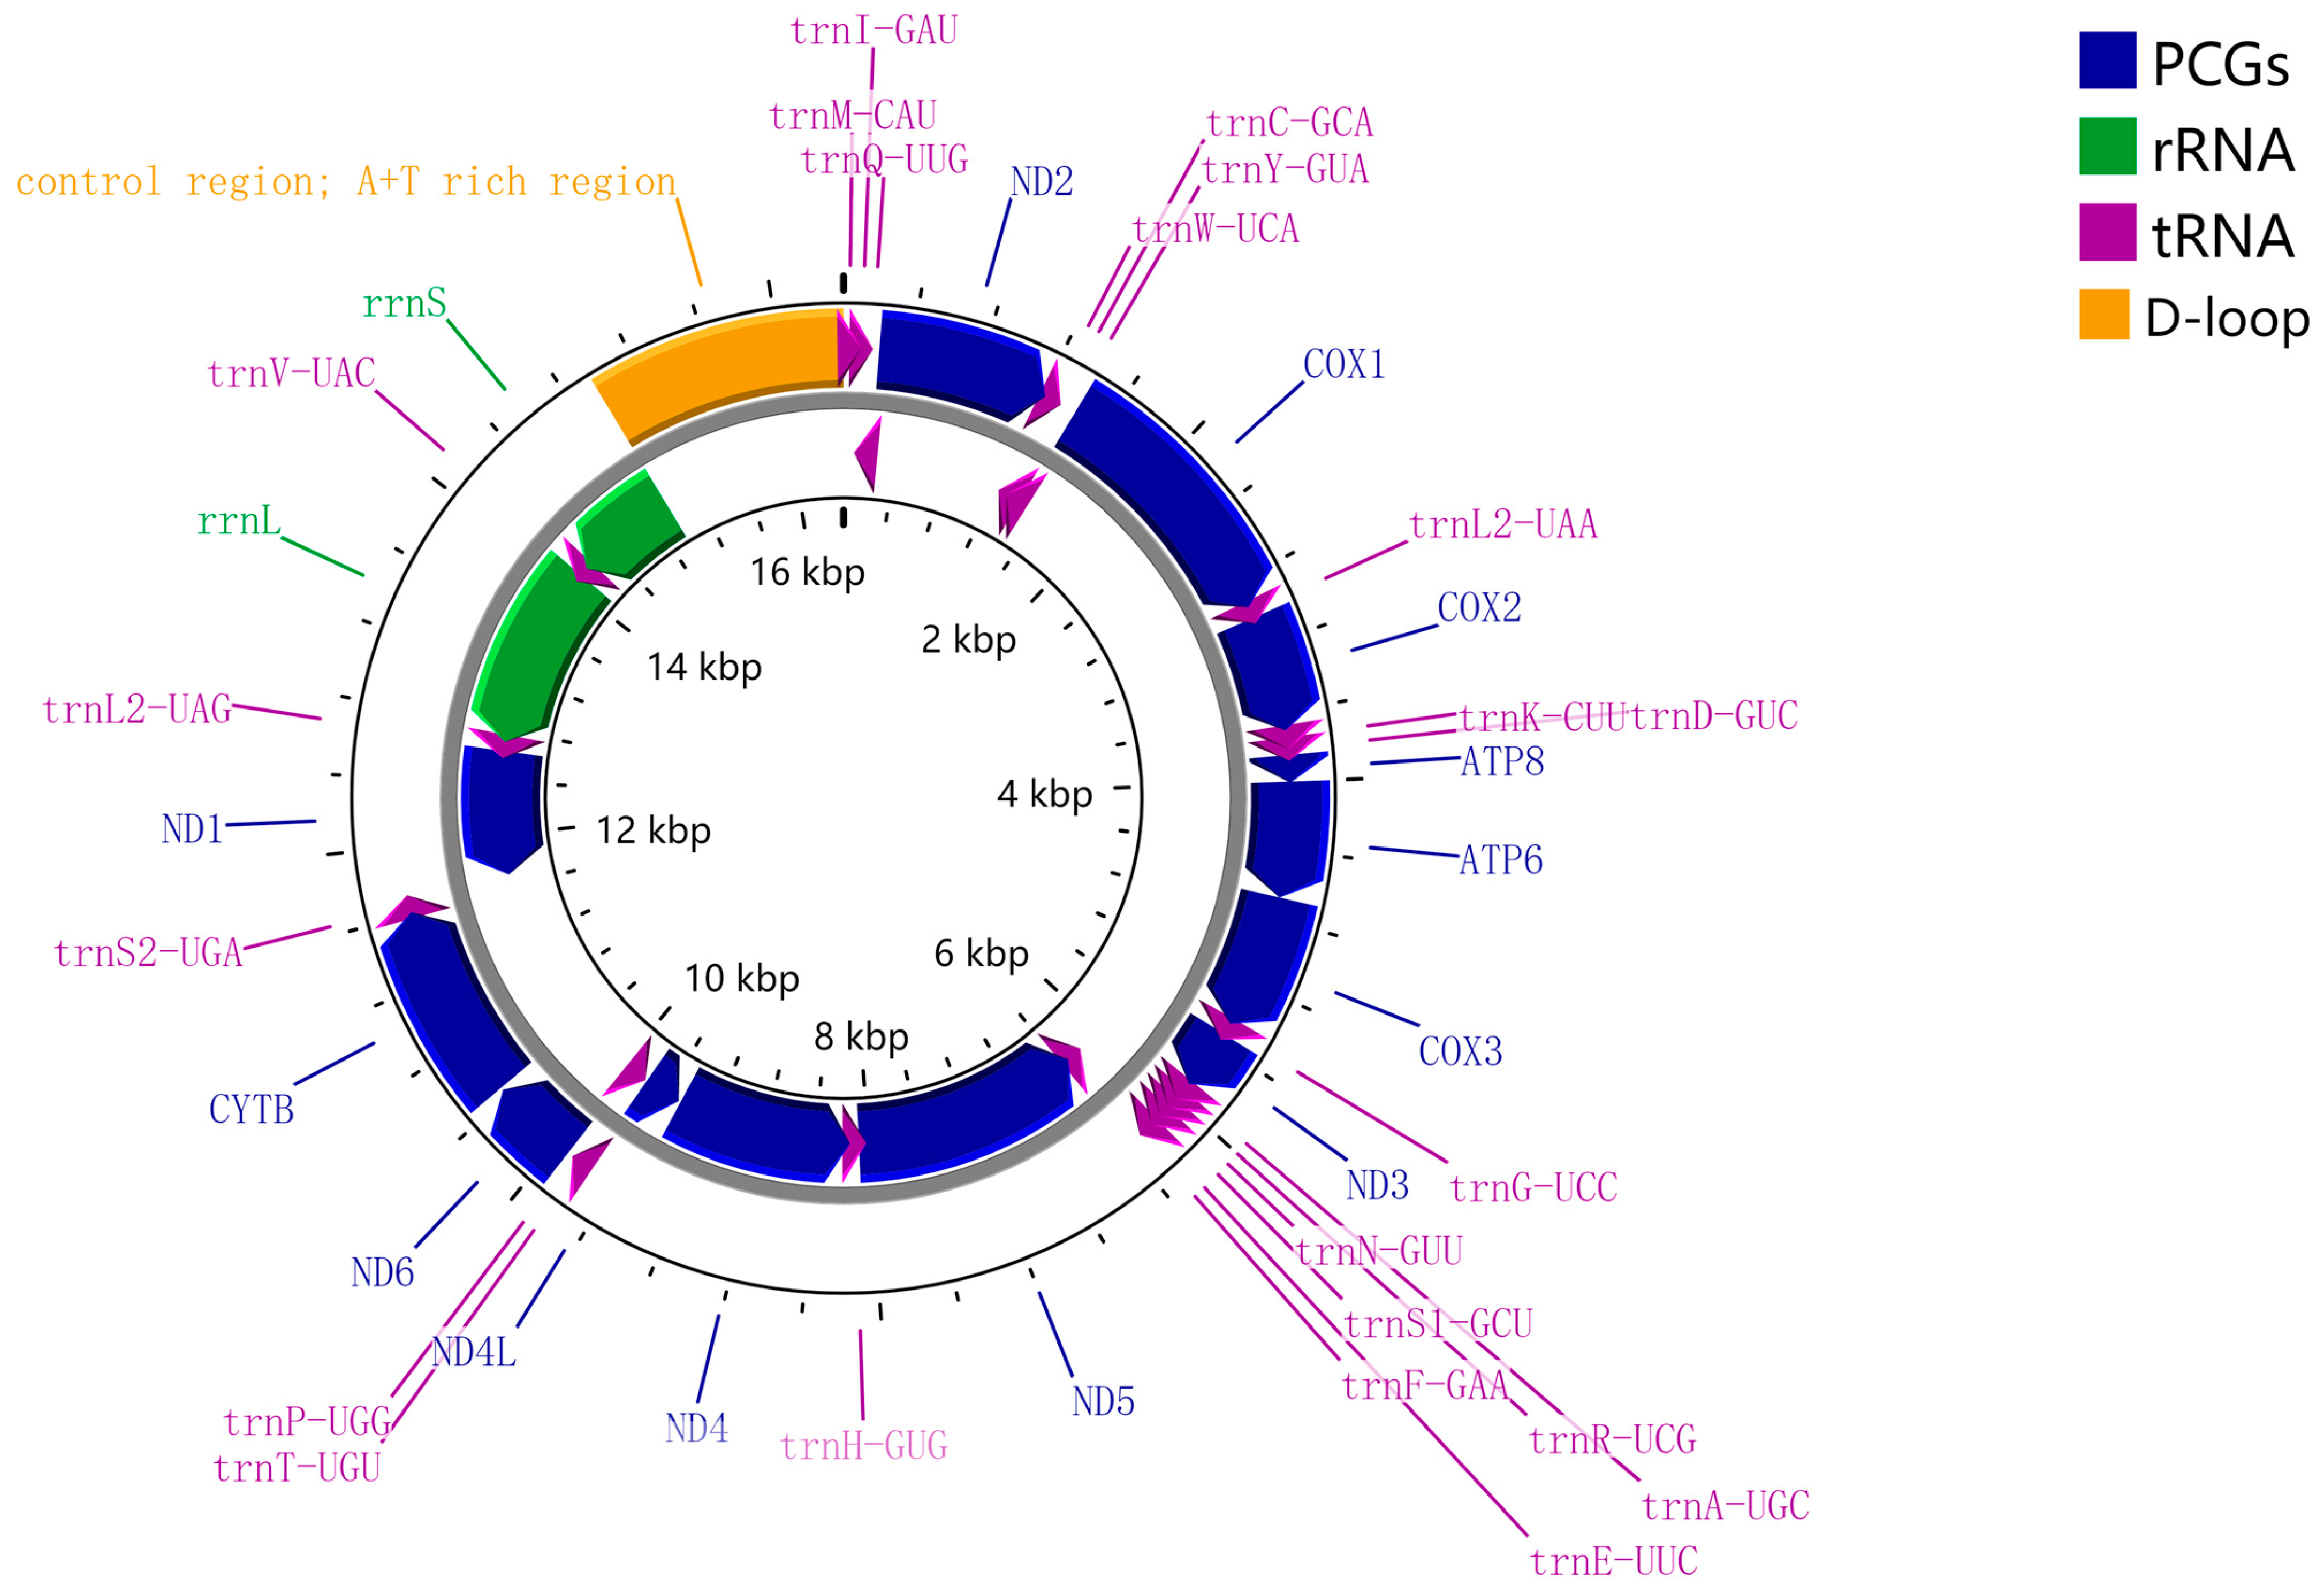
3.1. Sequencing, QC, Mitogenome Organization and Base Composition of S. costaestrigalis
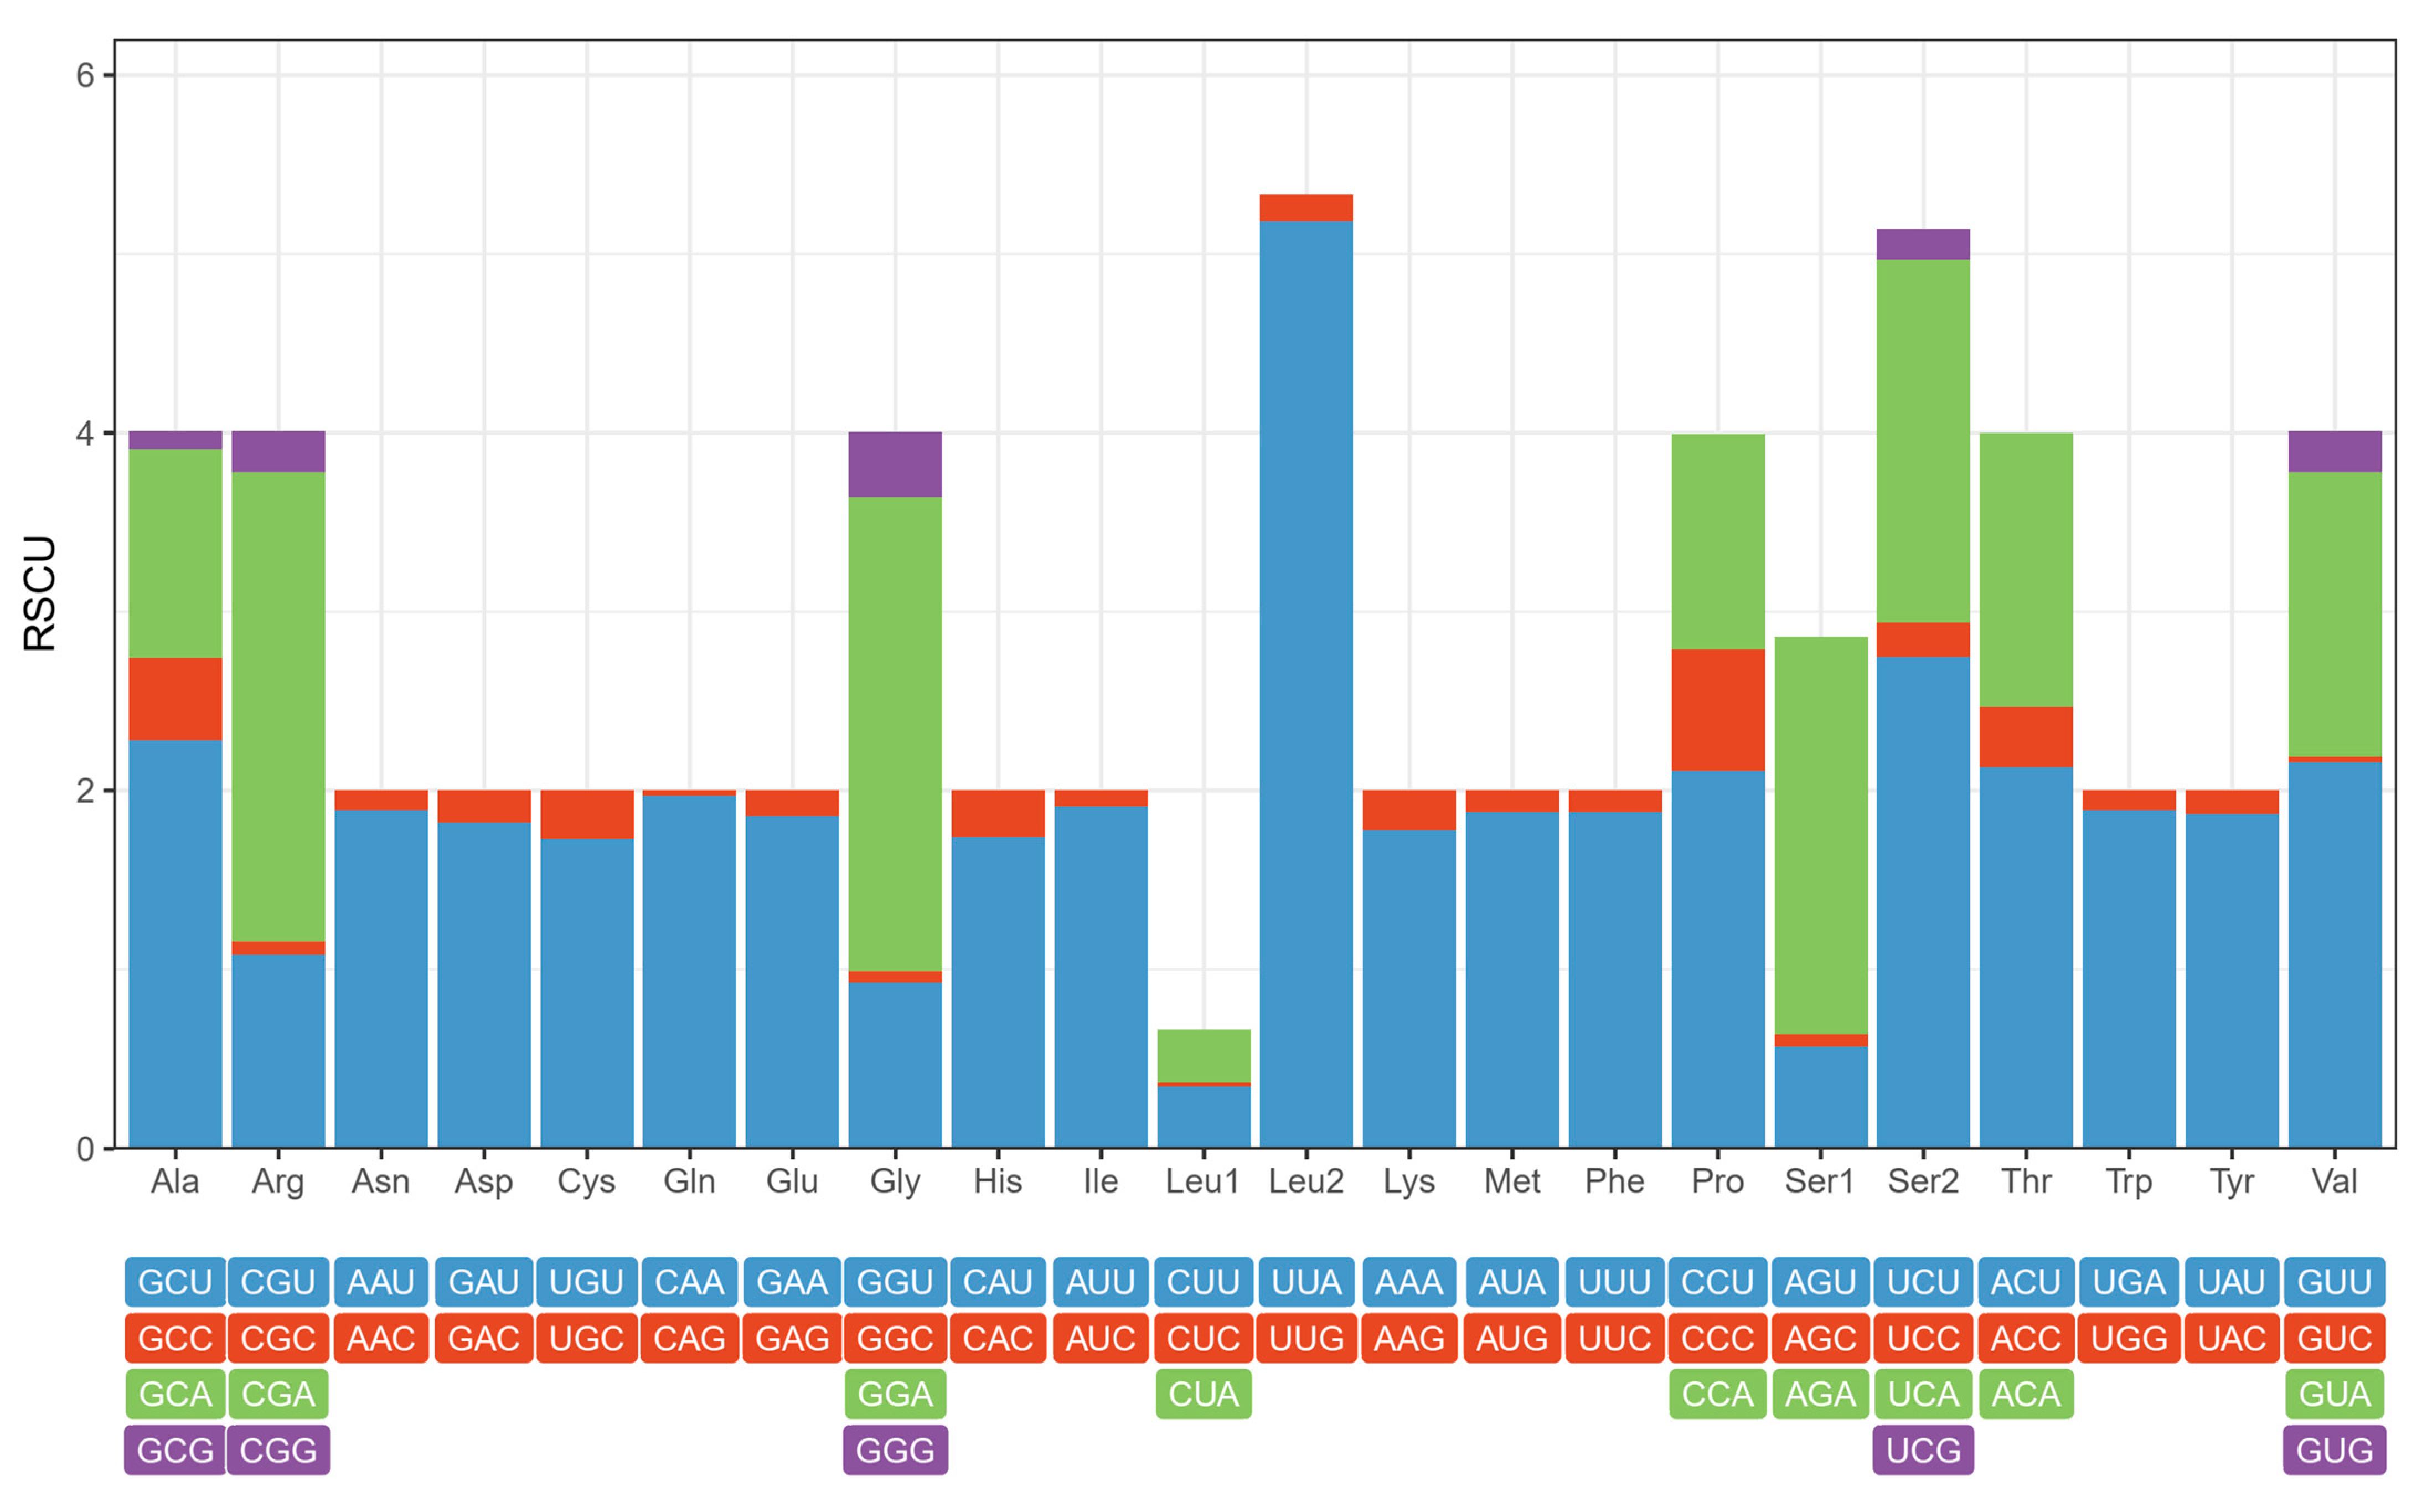
3.2. Protein-Coding Genes
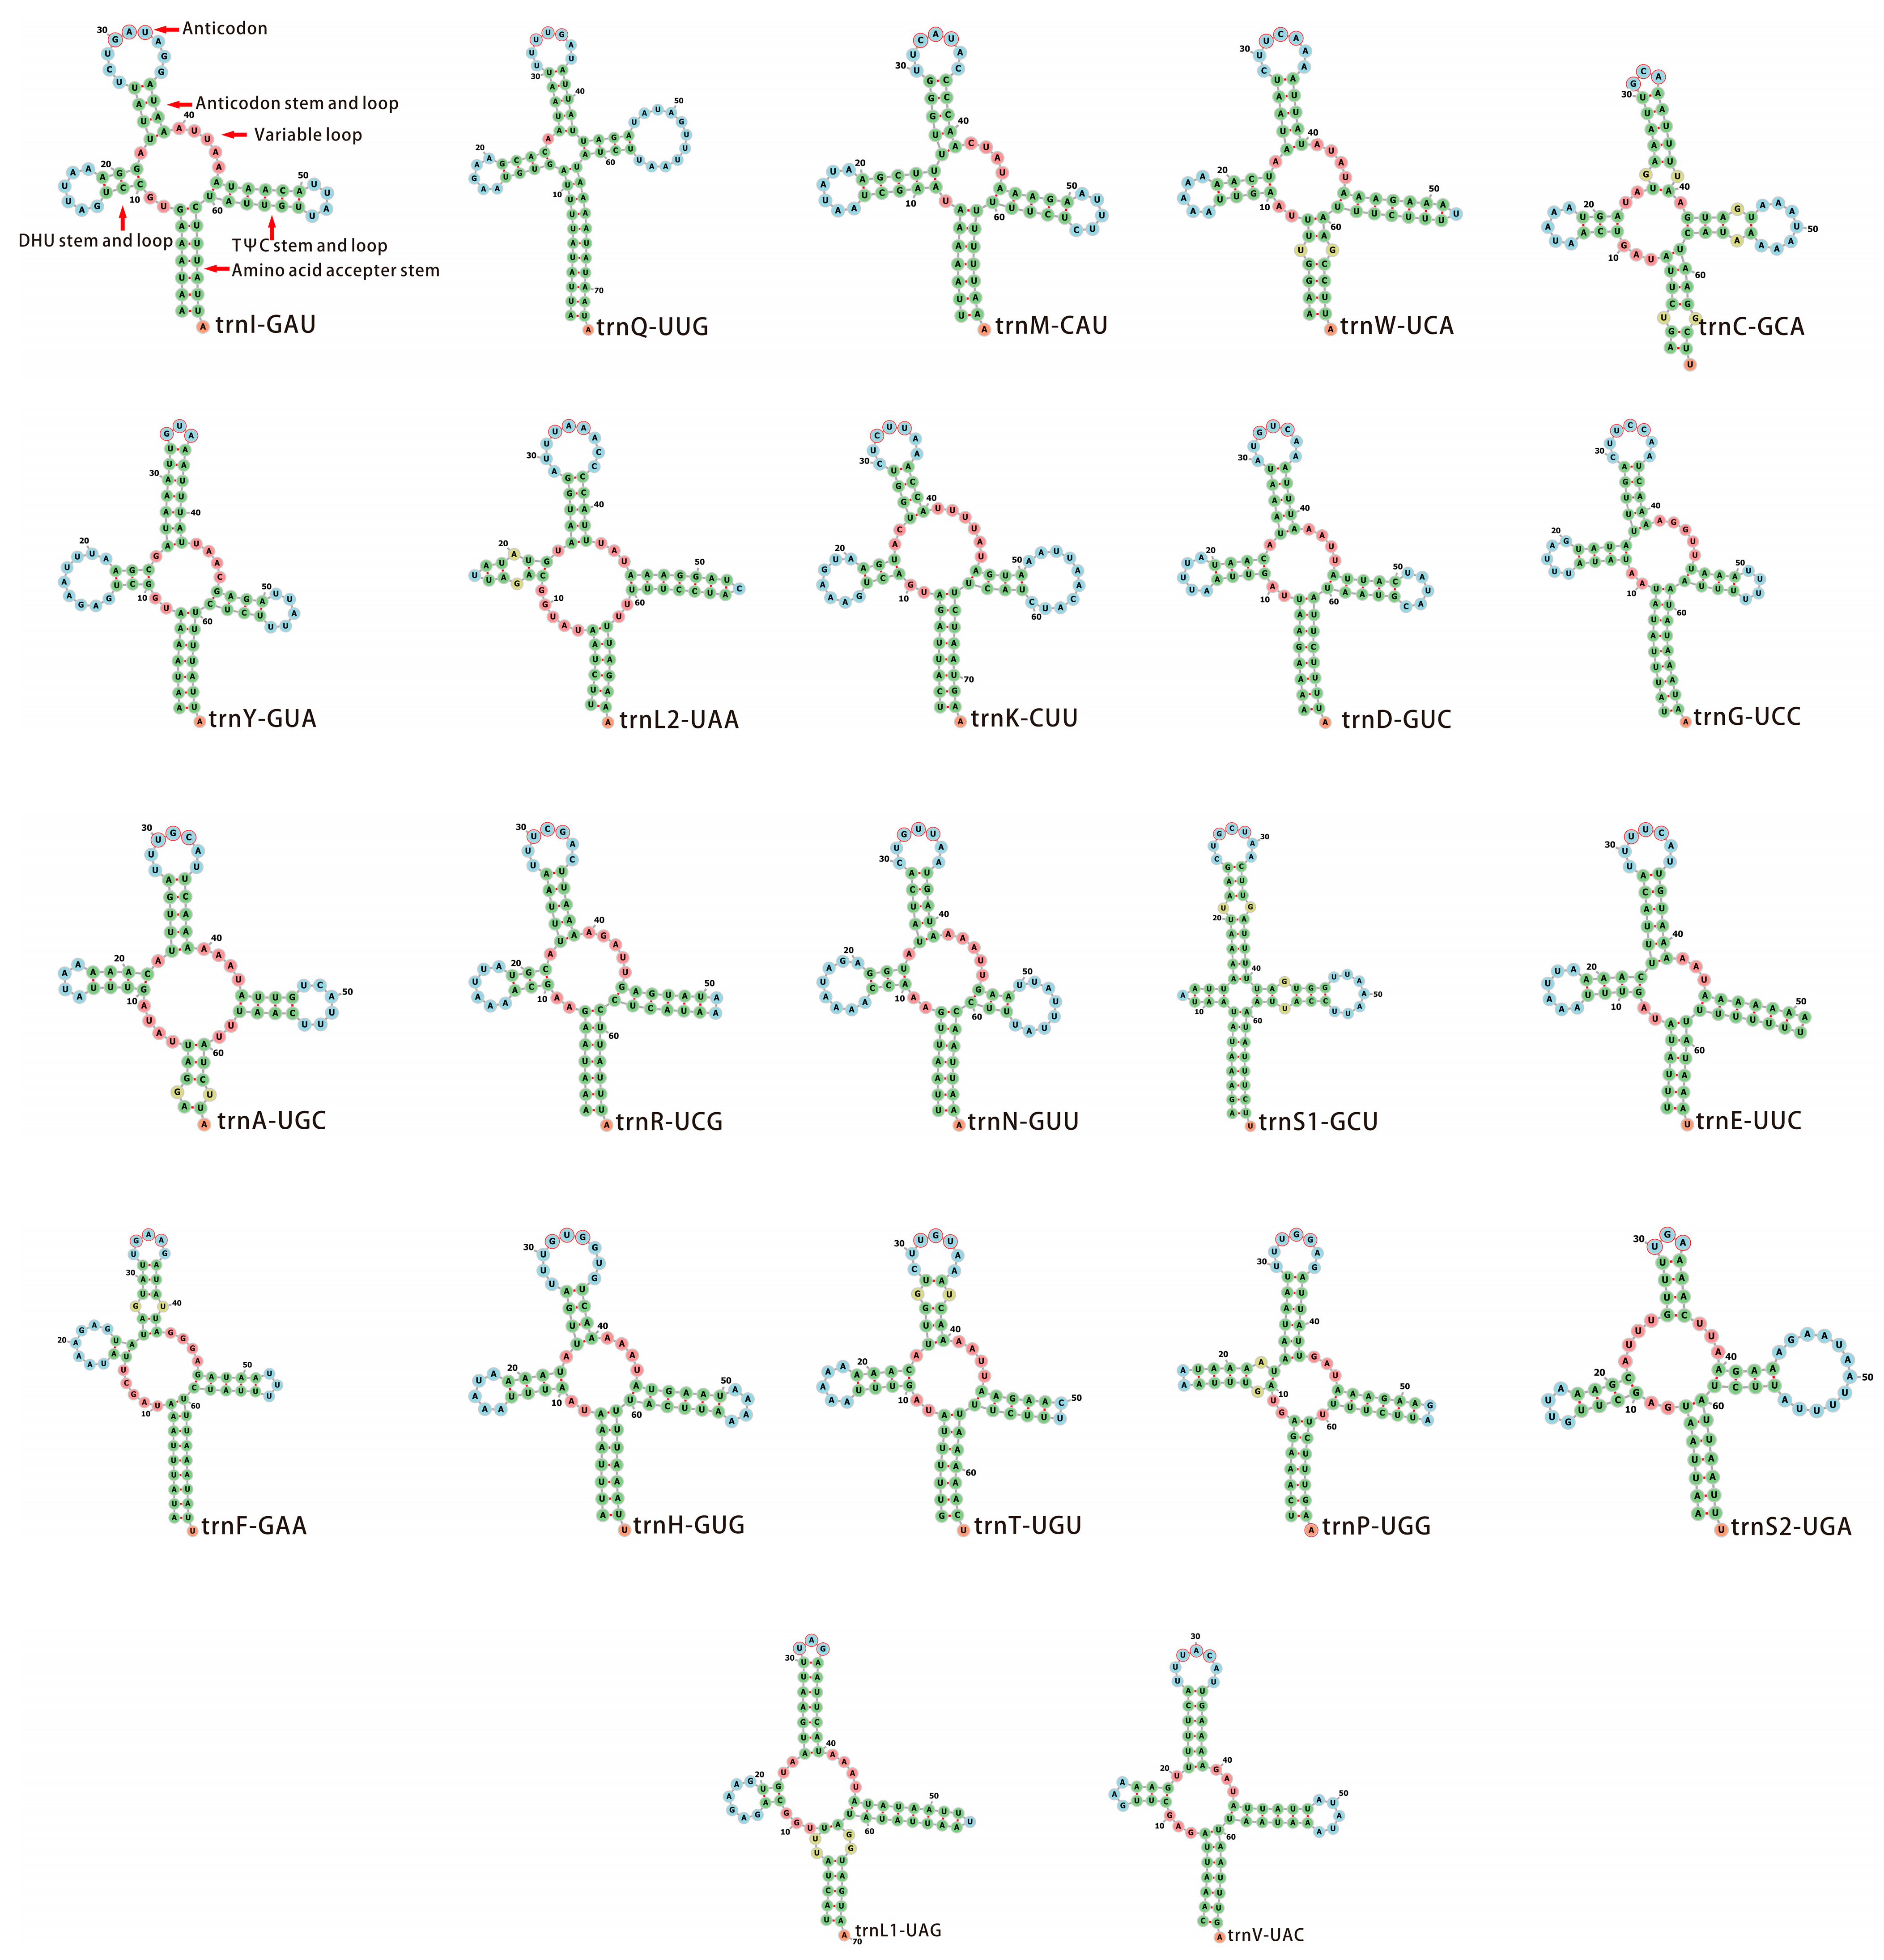
3.3. Transfer and Ribosomal RNA Genes
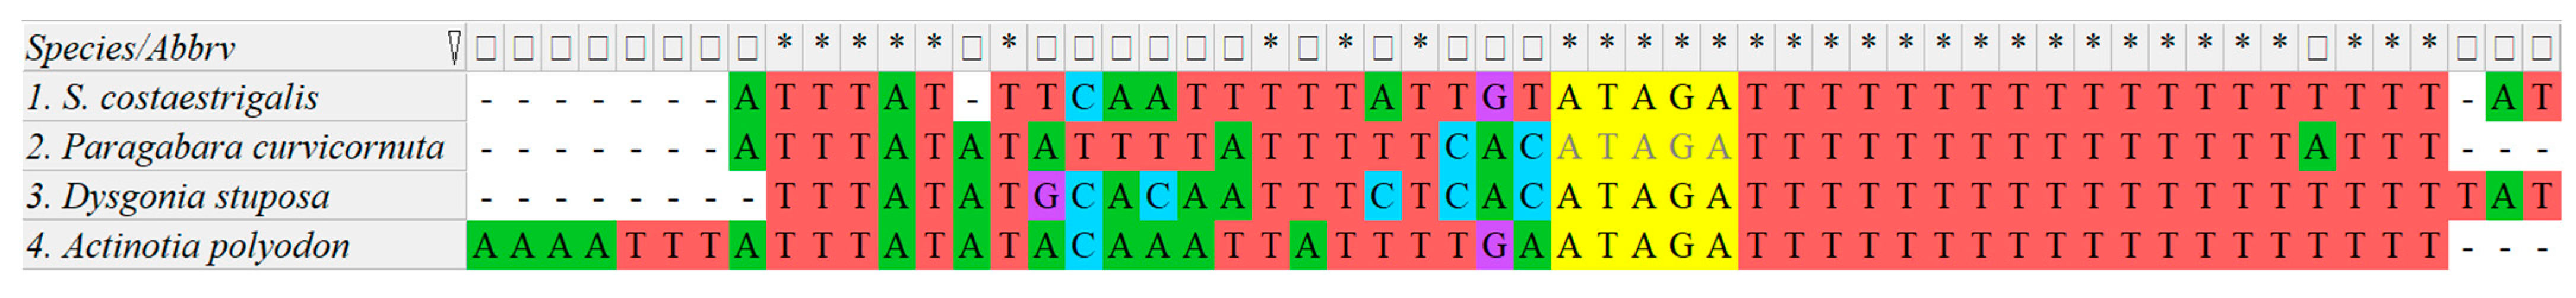
3.4. Control Region
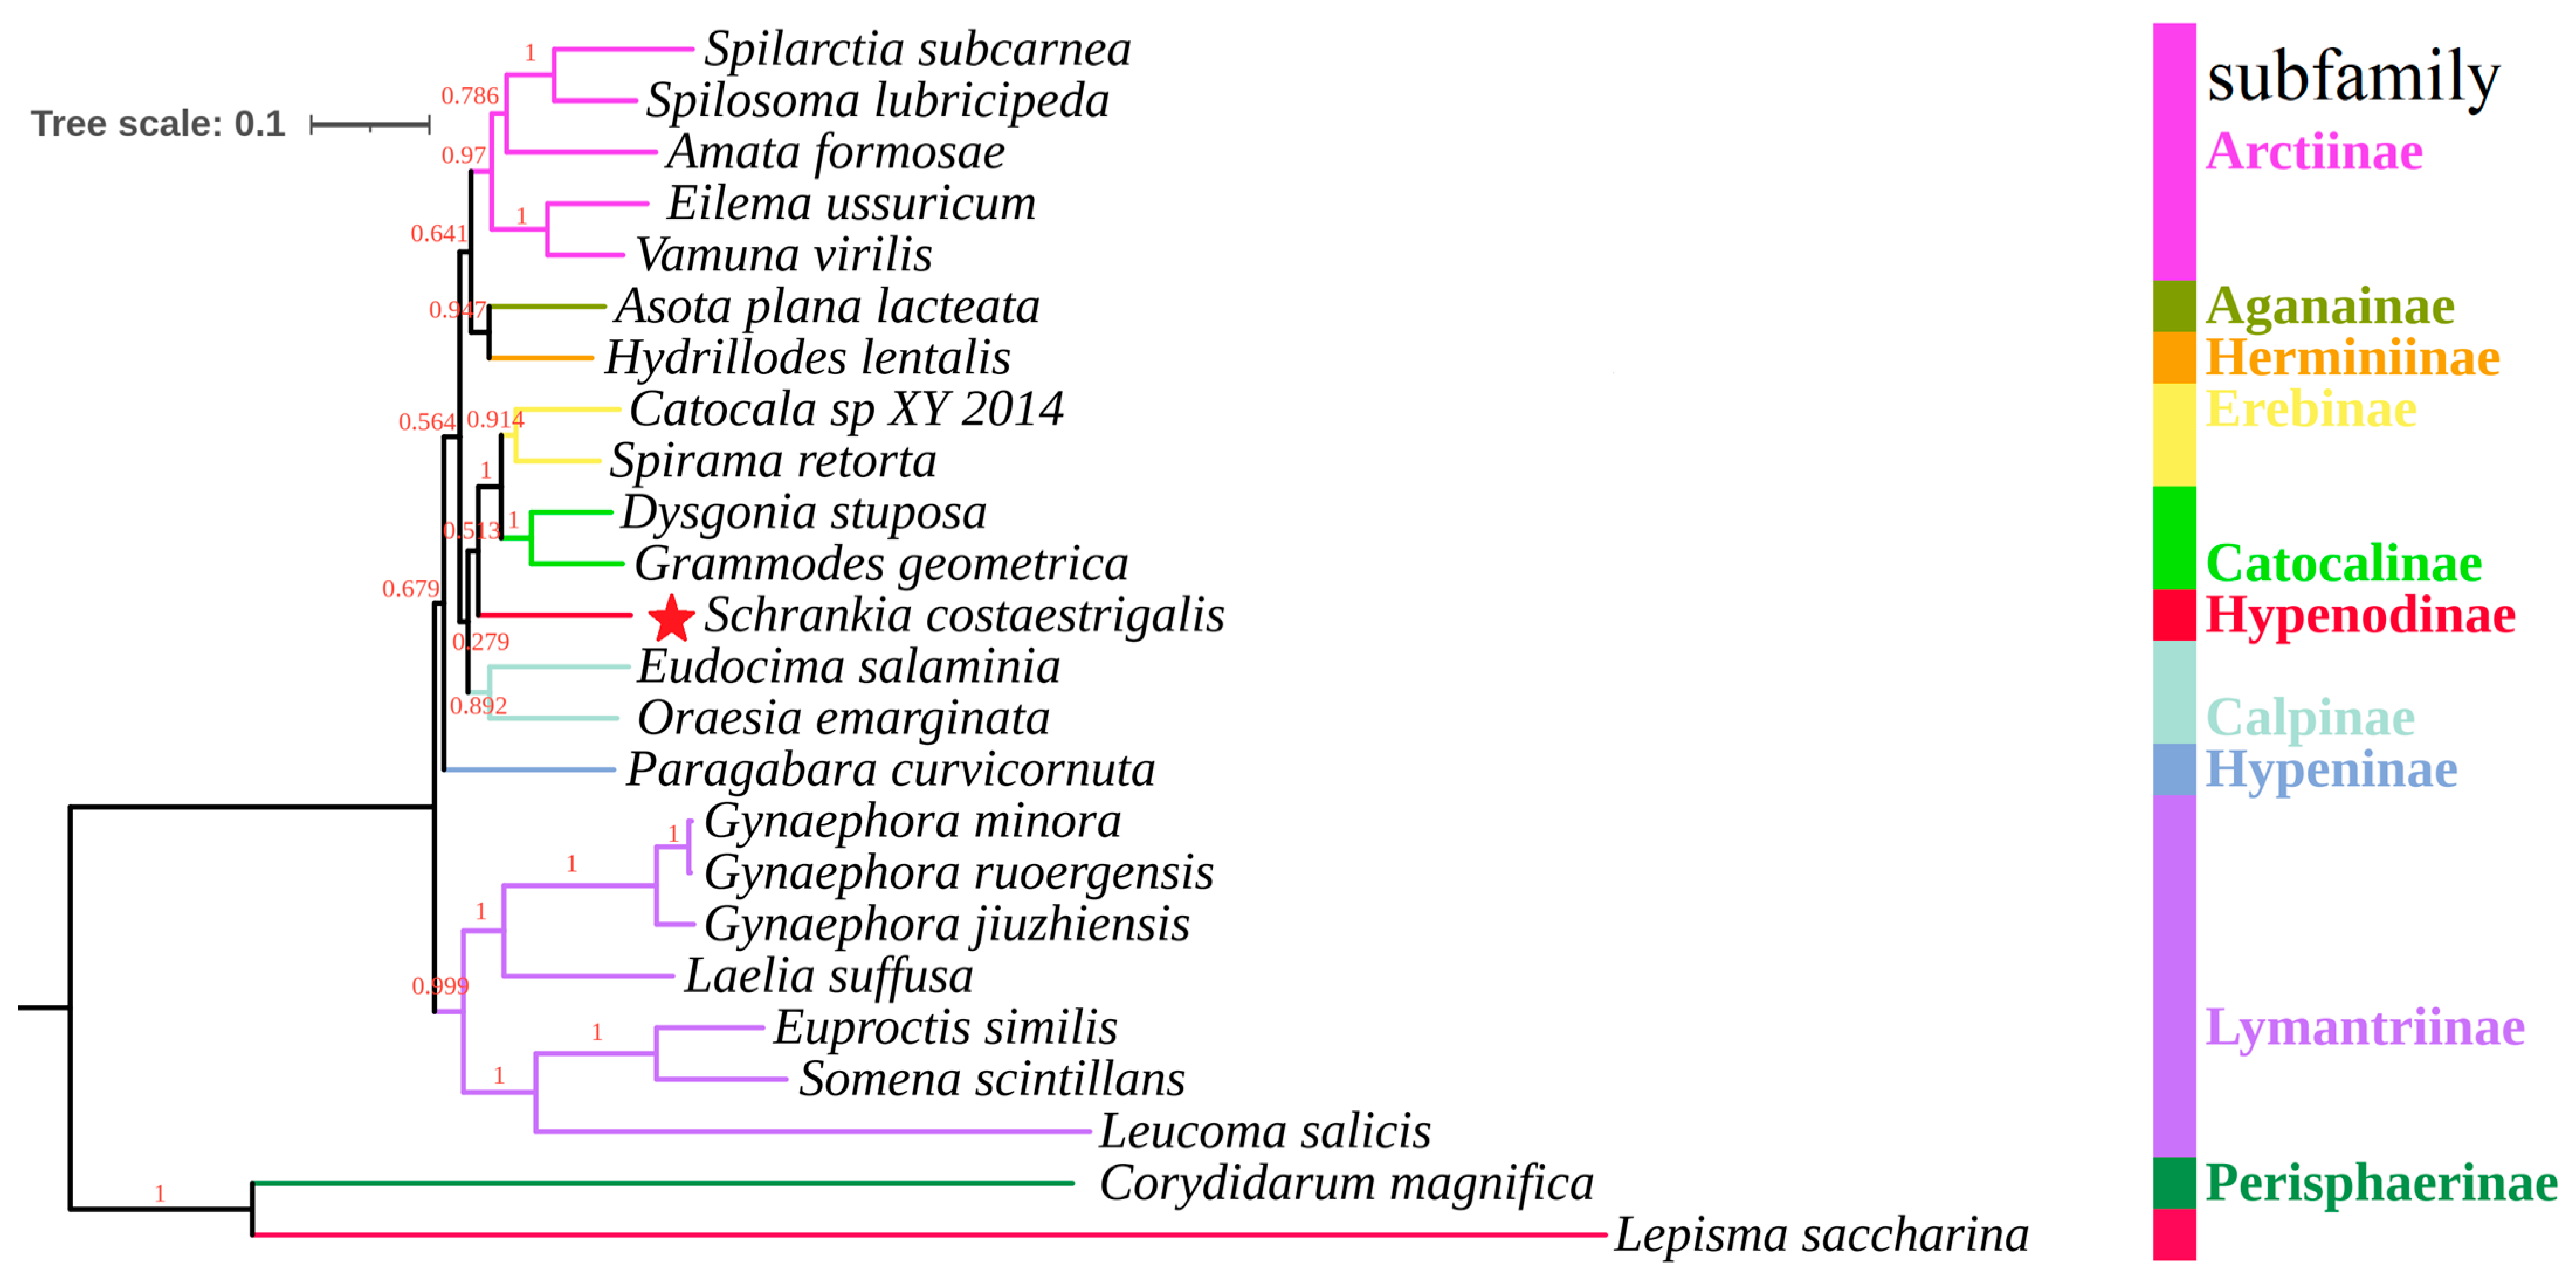
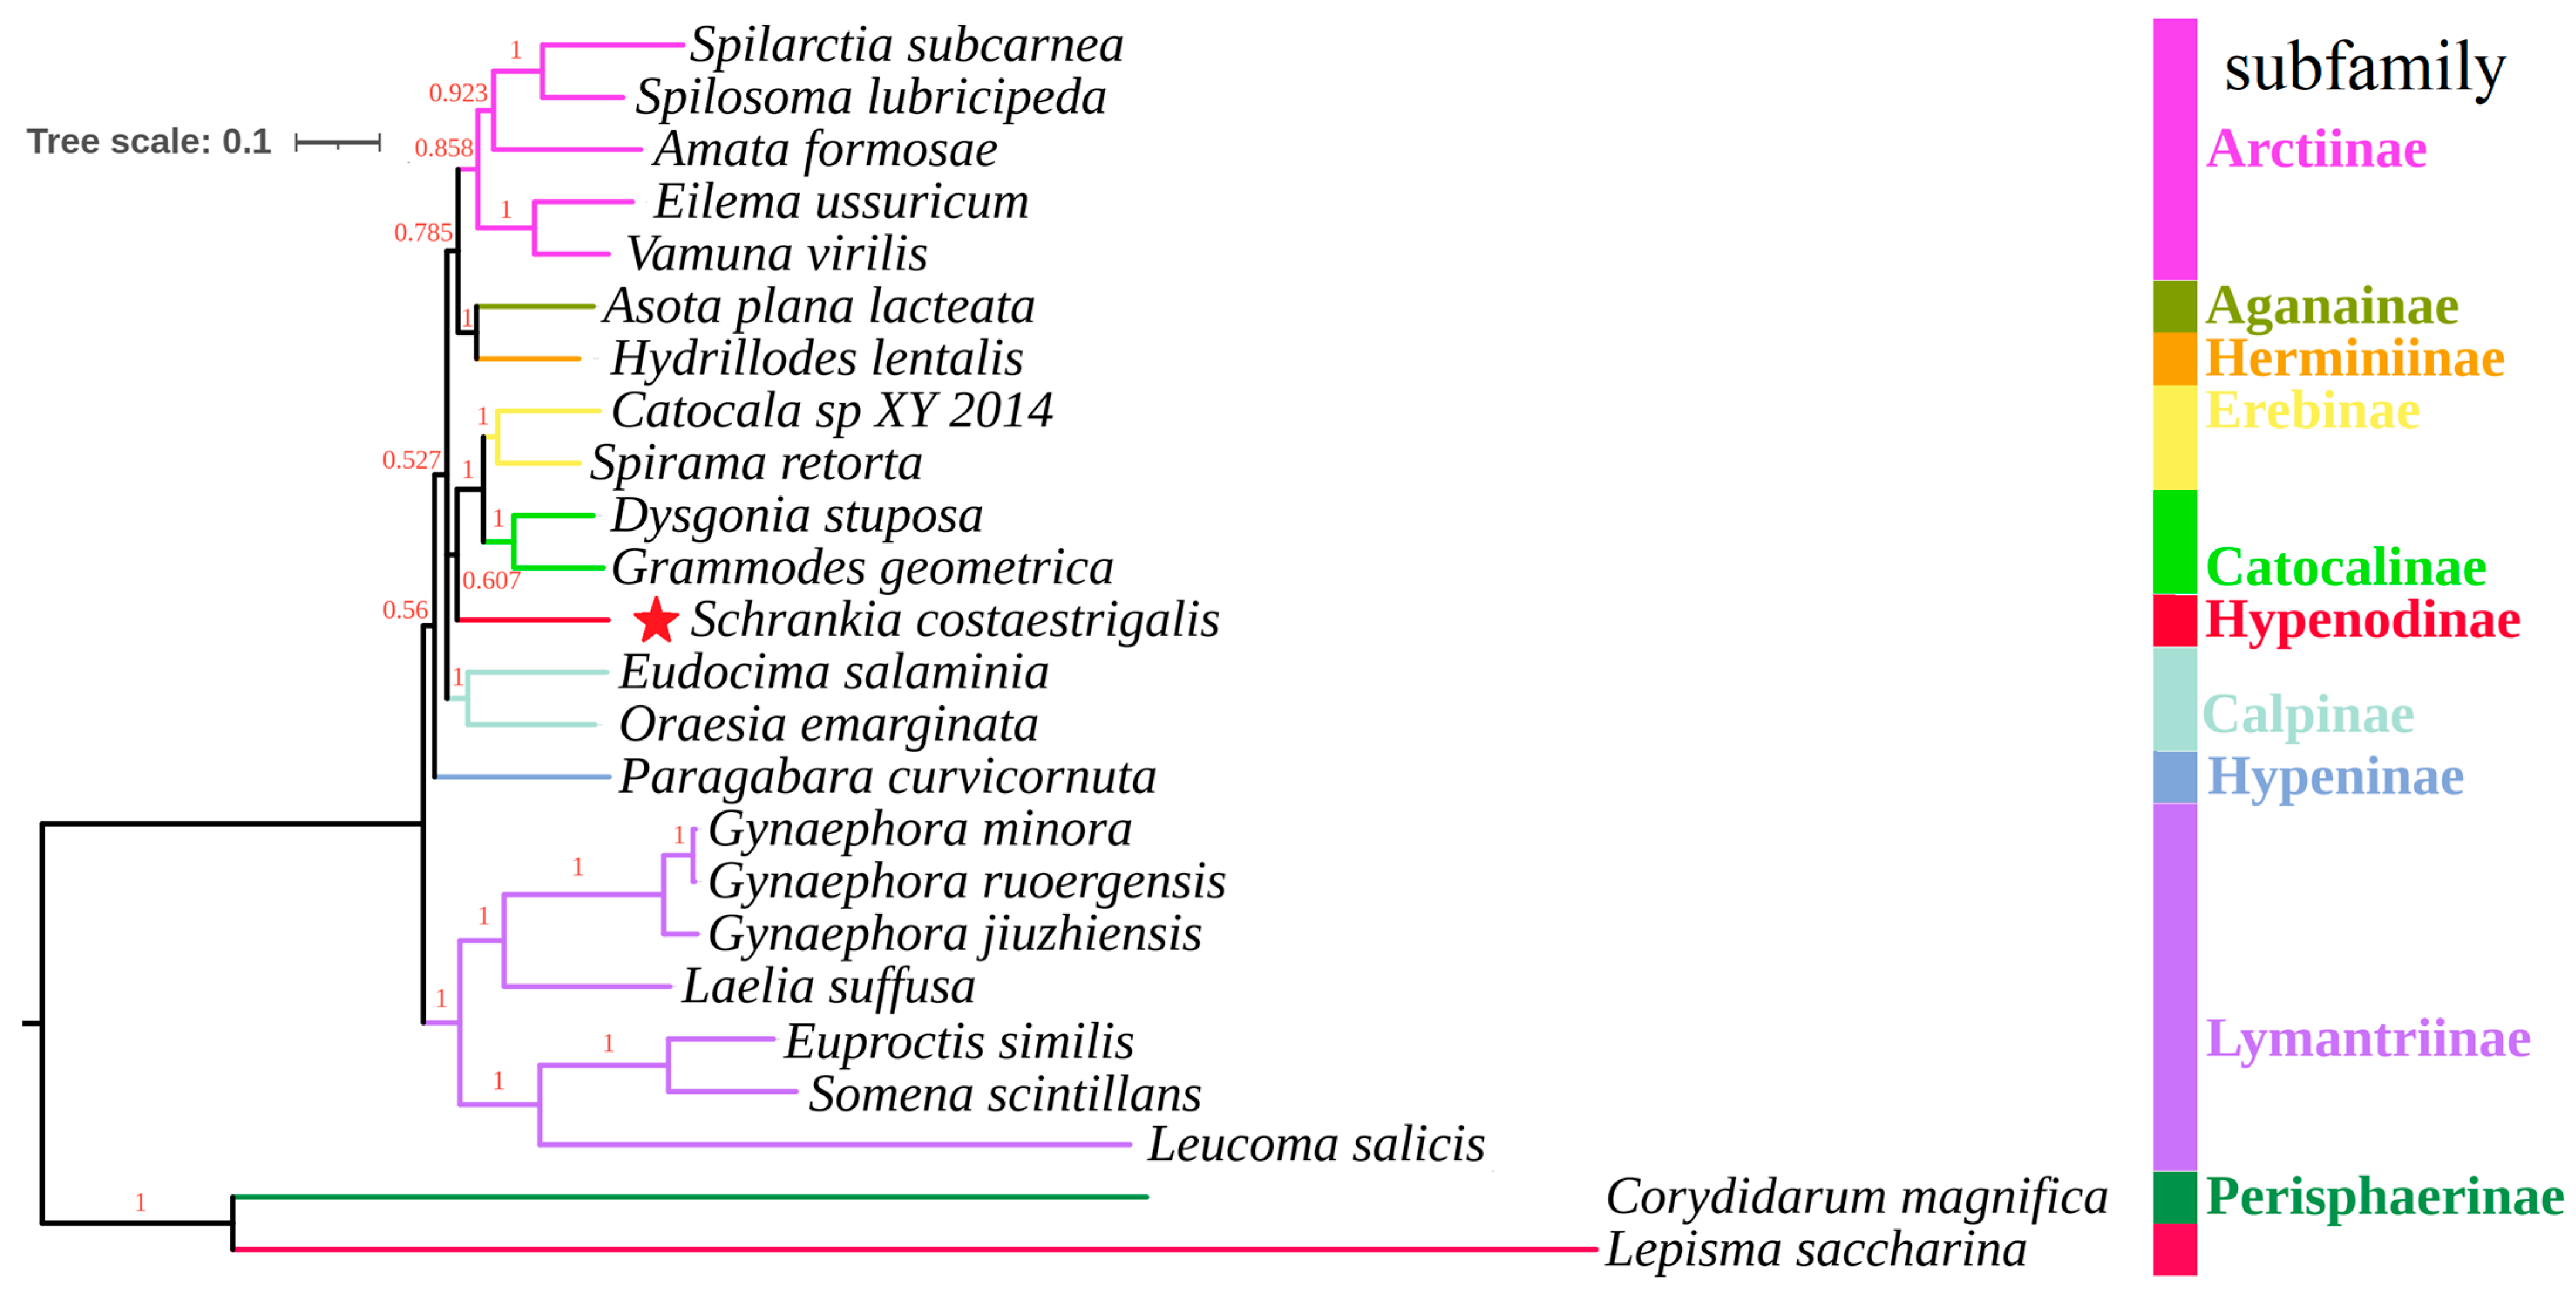
3.5. The Construction of Phylogenetic Trees
4. Conclusions
Supplementary Materials
Author Contributions
Funding
Data Availability Statement
Conflicts of Interest
References
- Stojanović, D. A new species of genus Schrankia Hübner (Lepidoptera: Noctuidae) for the fauna of Serbia. Acta Entomol. Serbica 2006, 11, 83–89. [Google Scholar]
- Medeiros, M.J.; Davis, D.; Howarth, F.G.; Gillespie, R. Evolution of cave living in Hawaiian Schrankia (Lepidoptera: Noctuidae) with description of a remarkable new cave species. Zool. J. Linn. Soc. 2009, 156, 114–139. [Google Scholar] [CrossRef]
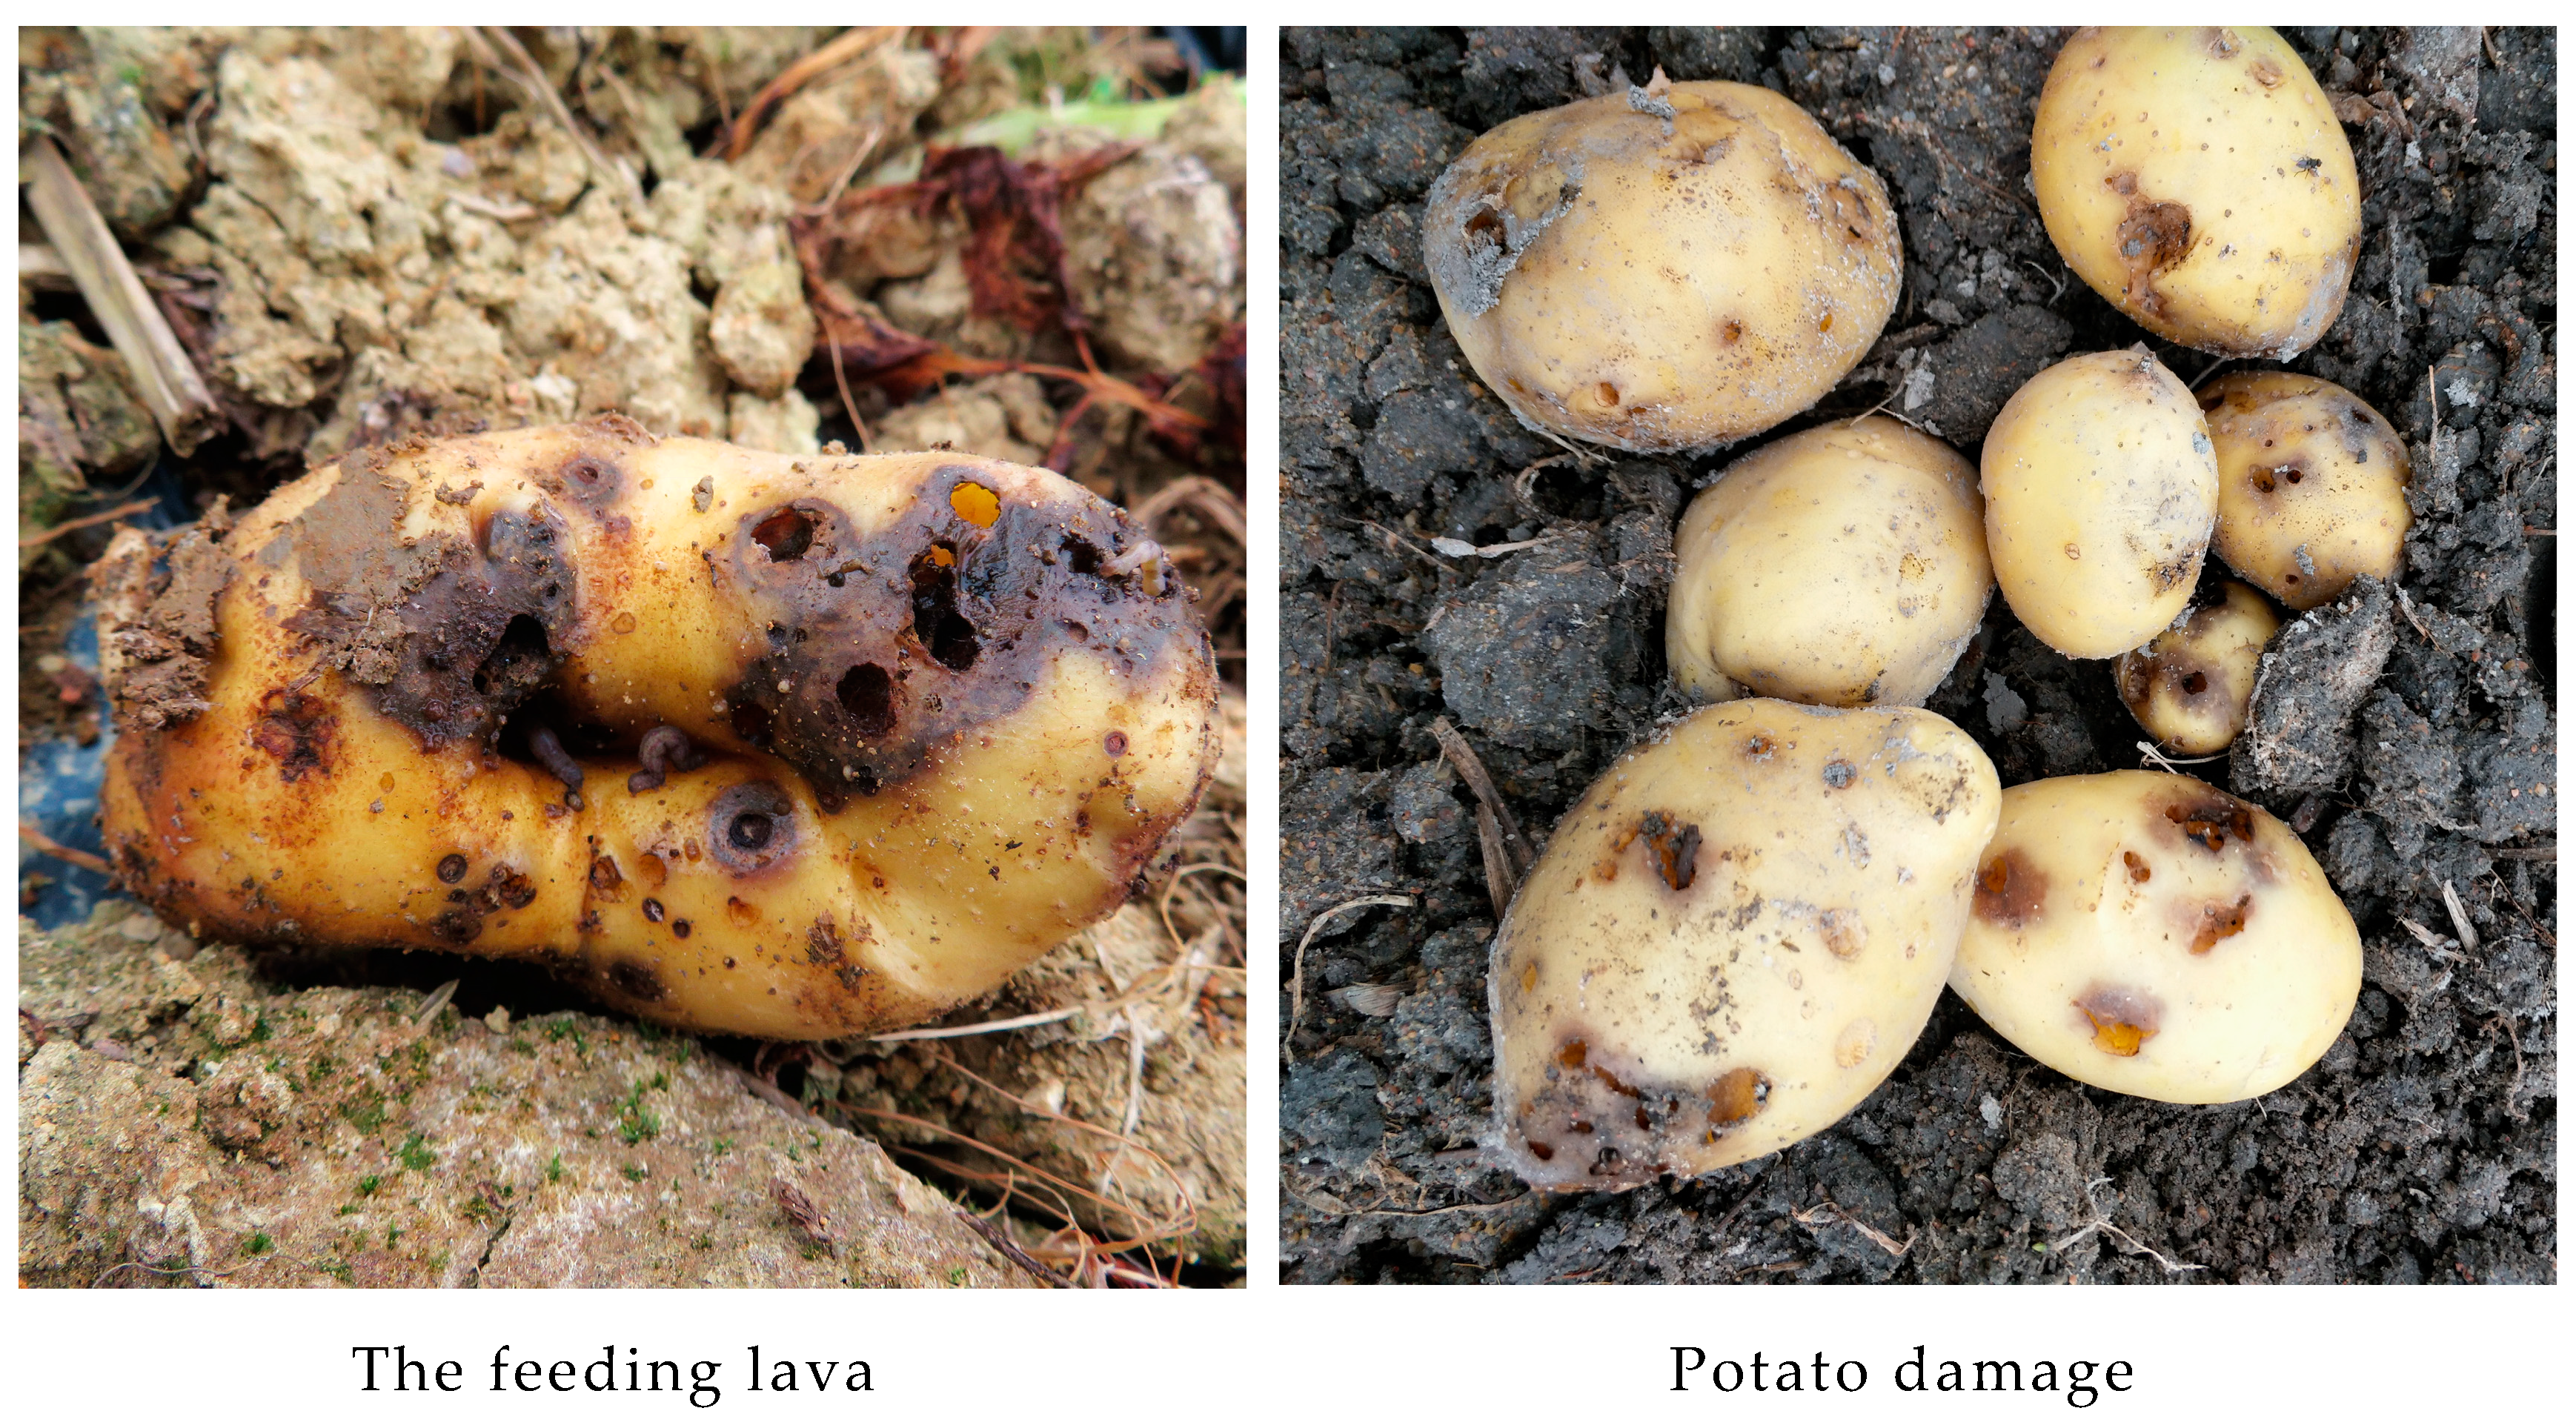
- Zeng, X.R.; Yu, Y.H.; Gao, X.Y.; Long, X.Z.; Jiang, X.D.; Liu, J.M.; Wei, D.W.; Gao, Y.L.; Zhou, Z.Z. First record of a damage to potato caused by Schrankia costaestrigalis (Stephens, 1834), a new potential pest in China. J. Pest Sci. 2020, 93, 555–558. [Google Scholar] [CrossRef]
- Yoshimatsu, S.; Nishioka, T. Schrankia costaestrigalis (Stephens) (Lepidoptera, Noctuidae) utilizing underground spaces. Entomol. Soc. Jpn. 1995, 63, 541–550. [Google Scholar]
- Gao, Y.L. Potato Tuberworm: Impact and Methods for Control–Mini Review; CABI International: Wallingford, UK, 2018; Volume 2018, pp. 1–3. [Google Scholar]
- Ballard, J.W.O.; Whitlock, M.C. The incomplete natural history of mitochondria. Mol. Ecol. 2004, 13, 729–744. [Google Scholar] [CrossRef]
- Zahiri, R.; Holloway, J.D.; Kitching, I.J.; Lafontaine, J.D.; Mutanen, M.; Wahlberg, N. Molecular phylogenetics of Erebidae (Lepidoptera, Noctuoidea). Syst. Entomol. 2011, 36, 408–427. [Google Scholar] [CrossRef]
- Yang, L.Y.; Dai, J.J.; Gao, Q.P.; Yuan, G.Z.; Liu, J.; Sun, Y.; Wei, G.Q. Characterization of the complete mitochondrial genome of Orthaga olivacea Warre (Lepidoptera Pyralidae) and comparison with other Lepidopteran insects. PLoS ONE 2020, 15, e0227831. [Google Scholar] [CrossRef]
- Bai, Y.; Yang, K.; Ye, L.; Gao, X.Y. Complete mitogenome and phylogenetic analyses of galerita orientalis Schmidt-Goebel, 1846 (Insecta: Coleoptera: Carabidae: Galeritini). Genes 2022, 13, 2199. [Google Scholar] [CrossRef]
- Bai, Y.; Gao, X.Y.; Chen, J.; Li, G.Y.; Luo, J.L.; Wang, H.; Yang, Y.; Liang, S.; Ouyang, B.C. The complete mitochondrial genome of Pachytriton granulosus (Chang, 1933) (Amphibia: Caudata: Salamandridae). Mitochondrial DNA Part B Resour. 2021, 6, 2131–2133. [Google Scholar] [CrossRef]
- Chen, S.F.; Zhou, Y.Q.; Chen, Y.R.; Gu, J. fastp: An ultra-fast all-in-one FASTQ preprocessor. Bioinformatics 2018, 34, i884–i890. [Google Scholar] [CrossRef]
- Dierckxsens, N.; Mardulyn, P.; Smits, G. NOVOPlasty: De novo assembly of organelle genomes from whole genome data. Nucleic Acids Res. 2017, 45, e18. [Google Scholar] [CrossRef] [PubMed]
- Anderson, S.J.; Gould, P.; Freeland, J.R. Repetitive flanking sequences (ReFS): Novel molecular markers from microsatellite families. Mol. Ecol. Notes 2007, 7, 374–376. [Google Scholar] [CrossRef]
- Jin, J.J.; Yu, W.B.; Yang, J.B.; Song, Y.; dePamphilis, C.W.; Yi, T.S.; Li, D.Z. GetOrganelle: A fast and versatile toolkit for accurate de novo assembly of organelle genomes. Genome Biol. 2020, 21, 241. [Google Scholar] [CrossRef] [PubMed]
- Perna, N.T.; Kocher, T.D. Patterns of nucleotide composition at fourfold degenerate sites of animal mitochondrial genomes. J. Mol. Evol. 1995, 41, 353–358. [Google Scholar] [CrossRef]
- Tillich, M.; Lehwark, P.; Pellizzer, T.; Ulbricht-Jones, E.S.; Fischer, A.; Bock, R.; Greiner, S. GeSeq—Versatile and accurate annotation of organelle genomes. Nucleic Acids Res. 2017, 45, W6–W11. [Google Scholar] [CrossRef]
- Chan, P.P.; Lowe, T.M. tRNAscan-SE: Searching for tRNA genes in genomic sequences. In Gene Prediction: Methods and Protocols; Kollmar, M., Ed.; Springer: New York, NY, USA, 2019; pp. 1–14. [Google Scholar] [CrossRef]
- Laslett, D.; Canbäck, B. ARWEN: A program to detect tRNA genes in metazoan mitochondrial nucleotide sequences. Bioinformatics 2008, 24, 172–175. [Google Scholar] [CrossRef]
- Kent, W.J. BLAT BLAT–the BLAST-like alignment tool. Genome Res. 2002, 12, 656–664. [Google Scholar] [CrossRef]
- Stothard, P.; Wishart, D.S. Circular genome visualization and exploration using CGView. Bioinformatics 2005, 21, 537–539. [Google Scholar] [CrossRef]
- Tamura, K.; Stecher, G.; Kumar, S. MEGA11: Molecular Evolutionary Genetics Analysis version 11. Mol. Biol. Evol. 2021, 38, 3022–3027. [Google Scholar] [CrossRef]
- Kerpedjiev, P.; Hammer, S.; Hofacker, I.L. Forna (force-directed RNA): Simple and effective online RNA secondary structure diagrams. Bioinformatics 2015, 31, 3377–3379. [Google Scholar] [CrossRef]
- Gendron, P.; Lemieux, S.; Major, F. Quantitative analysis of nucleic acid three-dimensional structures. J. Mol. Biol. 2001, 308, 919–936. [Google Scholar] [CrossRef] [PubMed]
- Zhang, D.; Gao, F.L.; Jakovlić, I.; Zou, H.; Zhang, J.; Wang, G.T. PhyloSuite: An integrated and scalable desktop platform for streamlined molecular sequence data management and evolutionary phylogenetics studies. Mol. Ecol. Resour. 2020, 20, 348–355. [Google Scholar] [CrossRef] [PubMed]
- Katoh, K.; Standley, D.M. MAFFT Multiple sequence alignment software version 7: Improvements in Performance and Usability. Mol. Biol. Evol. 2013, 30, 772–780. [Google Scholar] [CrossRef] [PubMed]
- Kalyaanamoorthy, S.; Minh, B.Q.; Wong, T.K.F.; von Haeseler, A.; Jermiin, L.S. ModelFinder: Fast model selection for accurate phylogenetic estimates. Nat. Methods 2017, 14, 587–589. [Google Scholar] [CrossRef] [PubMed]
- Nguyen, L.T.; Schmidt, H.A.; von Haeseler, A.; Minh, B.Q. IQ-TREE: A fast and effective stochastic algorithm for estimating maximum-likelihood phylogenies. Mol. Biol. Evol. 2015, 32, 268–274. [Google Scholar] [CrossRef]
- Ronquist, F.; Teslenko, M.; van der Mark, P.; Ayres, D.L.; Darling, A.; Höhna, S.; Larget, B.; Liu, L.; Suchard, M.A.; Huelsenbeck, J.P. MrBayes 3.2: Efficient Bayesian phylogenetic inference and model choice across a large model space. Syst. Biol. 2012, 61, 539–542. [Google Scholar] [CrossRef]
- Letunic, I.; Bork, P. Interactive Tree Of Life (iTOL) v5: An online tool for phylogenetic tree display and annotation. Nucleic Acids Res. 2021, 49, W293–W296. [Google Scholar] [CrossRef]
- Yang, X.; Cameron, S.L.; Lees, D.C.; Xue, D.; Han, H. A mitochondrial genome phylogeny of owlet moths (Lepidoptera: Noctuoidea), and examination of the utility of mitochondrial genomes for lepidopteran phylogenetics. Mol. Phylogenetics Evol. 2015, 85, 230–237. [Google Scholar] [CrossRef]
- Lu, H.F.; Su, T.J.; Luo, A.R.; Zhu, C.D.; Wu, C.S. Characterization of the complete mitochondrion genome of diurnal Moth Amata emma (Butler) (Lepidoptera: Erebidae) and its phylogenetic implications. PLoS ONE 2013, 8, e72410. [Google Scholar] [CrossRef]
- Zhang, X.B.; Wu, Y.P. Complete mitochondrial genome of Eilema ussiricum (Lepidoptera: Erebidae). Mitochondrial DNA Part B. Resour. 2020, 5, 1065–1066. [Google Scholar] [CrossRef]
- Xin, Z.Z.; Liu, Y.; Zhang, D.Z.; Wang, Z.F.; Tang, B.P.; Zhang, H.B.; Zhou, C.L.; Chai, X.Y.; Liu, Q.N. Comparative mitochondrial genome analysis of Spilarctia subcarnea and other noctuid insects. Int. J. Biol. Macromol. 2018, 107, 121–128. [Google Scholar] [CrossRef] [PubMed]
- Bian, D.D.; Dai, M.L.; Ye, W.T.; Lu, Z.T.; Li, M.X.; Fang, Y.L.; Qu, J.W.; Su, W.J.; Li, F.C.; Sun, H.N. Complete mitochondrial genome of Spilosoma lubricipedum (Noctuoidea: Erebidae) and implications for phylogeny of noctuid insects. Genomics 2020, 112, 4577–4584. [Google Scholar] [CrossRef]
- Riyaz, M.; Shah, R.A.; Savarimuthu, I.; Kuppusamy, S. Comparative mitochondrial genome analysis of Eudocima salaminia (Cramer, 1777) (Lepidoptera: Noctuoidea), novel gene rearrangement and phylogenetic relationship within the superfamily Noctuoidea. Mol. Biol. Rep. 2021, 48, 4449–4463. [Google Scholar] [CrossRef]
- Shah, R.A.; Riyaz, M.; Ignacimuthu, S.; Sivasankaran, K. Characterization of four mitochondrial genomes from superfamilies Noctuoidea and Hyblaeoidea with their phylogenetic implications. Sci. Rep. 2022, 12, 18926. [Google Scholar] [CrossRef] [PubMed]
- Huang, Y.; Liu, Y.; Zhu, X.Y.; Xin, Z.Z.; Zhang, H.B.; Zhang, D.Z.; Wang, J.L.; Tang, B.P.; Zhou, C.L.; Liu, Q.N.; et al. Comparative mitochondrial genome analysis of Grammodes geometrica and other noctuid insects reveals conserved mitochondrial genome organization and phylogeny. Int. J. Biol. Macromol. 2019, 125, 1257–1265. [Google Scholar] [CrossRef] [PubMed]
- Sun, Y.; Zhu, Y.; Chen, C.; Zhu, Q.; Zhu, Q.; Zhou, Y.; Zhou, X.; Zhu, P.; Li, J.; Zhang, H. The complete mitochondrial genome of Dysgonia stuposa (Lepidoptera: Erebidae) and phylogenetic relationships within Noctuoidea. PeerJ 2020, 8, e8780. [Google Scholar] [CrossRef]
- Sun, Y.; Huang, H.; Liu, Y.; Liu, S.; Xia, J.; Zhang, K.; Geng, J. Organization and phylogenetic relationships of the mitochondrial genomes of Speiredonia retorta and other lepidopteran insects. Sci. Rep. 2021, 11, 2957. [Google Scholar] [CrossRef]
- Yang, M.; Song, L.; Shi, Y.; Yin, Y.; Wang, Y.; Zhang, P.; Chen, J.; Lou, L.; Liu, X. The complete mitochondrial genome of a medicinal insect, Hydrillodes repugnalis (Lepidoptera: Noctuoidea: Erebidae), and related phylogenetic analysis. Int. J. Biol. Macromol. 2019, 123, 485–493. [Google Scholar] [CrossRef]
- Chen, Z.S.; Xu, Z.; Ma, L.; Wang, X. The complete mitochondrial genome of Paragabara curvicornuta (Lepidoptera: Noctuoidea: Eribidae). Mitochondrial DNA Part B Resour. 2018, 3, 78–80. [Google Scholar] [CrossRef]
- Liu, Y.; Xin, Z.Z.; Zhu, X.Y.; Zhao, X.M.; Wang, Y.; Tang, B.P.; Zhang, H.B.; Zhang, D.Z.; Zhou, C.L.; Liu, Q.N. The complete mitochondrial genome of Euproctis similis (Lepidoptera: Noctuoidea: Erebidae) and phylogenetic analysis. Int. J. Biol. Macromol. 2017, 105, 219–227. [Google Scholar] [CrossRef]
- Yuan, M.L.; Zhang, Q.L.; Zhang, L.; Jia, C.L.; Li, X.P.; Yang, X.Z.; Feng, R.Q. Mitochondrial phylogeny, divergence history and high-altitude adaptation of grassland caterpillars (Lepidoptera: Lymantriinae: Gynaephora) inhabiting the Tibetan Plateau. Mol. Phylogenetics Evol. 2018, 122, 116–124. [Google Scholar] [CrossRef]
- Li, J.; Lv, Q.; Zhang, X.M.; Han, H.L.; Zhang, A.B. Characterization and phylogenetic analysis of the complete mito-chondrial genome of Laelia suffusa (Lepidoptera: Erebidae, Lymantriinae). J. Insect Sci. 2021, 21, 5. [Google Scholar] [CrossRef]
- Sun, Y.X.; Wang, L.; Wei, G.Q.; Qian, C.; Dai, L.S.; Sun, Y.; Abbas, M.N.; Zhu, B.J.; Liu, C.L. Characterization of the complete mitochondrial genome of Leucoma salicis (Lepidoptera: Lymantriidae) and comparison with other Lepidop-teran insects. Sci. Rep. 2016, 6, 39153. [Google Scholar] [CrossRef]
- Li, J.; Zhao, Y.Q.; Lin, R.R.; Zhang, Y.Y.; Hu, K.J.; Li, Y.; Huang, Z.R.; Peng, S.Y.; Ding, J.H.; Geng, X.X.; et al. Mitochondrial genome characteristics of Somena scintillans (Lepidoptera: Erebidae) and comparation with other Noctuoidea insects. Genomics 2019, 111, 1239–1248. [Google Scholar] [CrossRef] [PubMed]
- Bai, Y.; Chen, J.; Li, G.Y.; Wang, H.; Luo, J.; Li, C. Complete mitochondrial genome of the common silverfish Lepisma saccharina (Insecta: Zygentoma: Lepismatidae). Mitochondrial DNA Part B 2020, 5, 1552–1553. [Google Scholar] [CrossRef]
- Bai, Y.; Yang, K.; Ye, L.; Gao, X.Y. Complete mitochondrial genome of Pseudoglomeris magnifica (Shelford, 1907) (Insecta: Dictyoptera: Blaberidae). Mitochondrial DNA Part B Resour. 2022, 7, 1672–1675. [Google Scholar] [CrossRef] [PubMed]
- Dong, W.W.; Dong, S.Y.; Jiang, G.F.; Huang, G.H. Characterization of the complete mitochondrial genome of tea tussock moth, Euproctis pseudoconspersa (Lepidoptera: Lymantriidae) and its phylogenetic implications. Gene 2016, 577, 37–46. [Google Scholar] [CrossRef]
- Ghanavi, H.R.; Twort, V.; Hartman, T.J.; Zahiri, R.; Wahlberg, N. The (non) accuracy of mitochondrial genomes for family-level phylogenetics in Erebidae (Lepidoptera). Zool. Scr. 2022, 51, 695–707. [Google Scholar] [CrossRef]
- Fibiger, M. Revision of the Micronoctuidae (Lepidoptera: Noctuoidea). Part 4, Taxonomy of the subfamilies Tentaxinae and Micronoctuinae. Zootaxa 2011, 2842, 1–188. [Google Scholar]


| Family | Subfamily | Species | Whole Length | GenBank | Reference |
|---|---|---|---|---|---|
| Erebidae | Aganainae | Asota plana lacteata | 15,416 bp | KJ173908.1 | [30] |
| Arctiinae | Amata formosae | 15,463 bp | KC513737.1 | [31] | |
| Eilema ussiricum | 15,344 bp | MN696172.1 | [32] | ||
| Spilarctia subcarnea | 15,441 bp | KT258909.1 | [33] | ||
| Spilosoma lubricipedum | 15,375 bp | MT591568.1 | [34] | ||
| Vamuna virilis | 15,417 bp | KJ364659.1 | [30] | ||
| Calpinae | Eudocima salaminia | 15,597 bp | MW683337.1 | [35] | |
| Oraesia emarginata | 16,668 bp | MW648382.1 | [36] | ||
| Catocalinae | Grammodes geometrica | 15,728 bp | KY888135.1 | [37] | |
| Dysgonia stuposa | 15,721 bp | MK262707.1 | [38] | ||
| Erebinae | Catocala deuteronympha | 15,671 bp | KJ432280.1 | [30] | |
| Spirama retorta | 15,652 bp | MT013356.1 | [39] | ||
| Herminiinae | Hydrillodes repugnalis | 15,570 bp | MH013484.1 | [40] | |
| Hypeninae | Paragabara curvicornuta | 15,532 bp | KT362742.1 | [41] | |
| Hypenodinae | Schrankia costaestrigalis | 16,376 bp | OQ181231.1 | This study | |
| Lymantriinae | Euproctis similis | 15,437 bp | KT258910.1 | [42] | |
| Gynaephora jiuzhiensis | 15,859 bp | KY688085.1 | [43] | ||
| Gynaephora minora | 15,801 bp | KY688086.1 | [43] | ||
| Gynaephora rouergensis | 15,803 bp | KY688083.1 | [43] | ||
| Laelia suffusa | 15,502 bp | MN908152.1 | [44] | ||
| Leucoma salicis | 15,334 bp | MT230535.1 | [45] | ||
| Somena scintillans | 15,410 bp | MH051839.1 | [46] | ||
| Lepismatidae | Lepisma saccharina | 15,244 bp | MT108230.1 | [47] | |
| Blaberidae | Perisphaerinae | Corydidarum magnifica | 16,627 bp | MW630139.1 | [48] |
| Raw Reads Base (bp) | Raw Reads Num | Q20 (%) | Q30 (%) | Clean Reads Base (bp) | Clean Reads Num | Q20 (%) | Q30 (%) | G + C (%) |
|---|---|---|---|---|---|---|---|---|
| 5,639,351,400 | 37,595,676 | 96.91 | 91.53 | 5,369,244,032 | 36,000,780 | 97.82 | 92.84 | 34.84 |
| Gene | Strand | Location | Size (bp) | Anticodon | Start Codon | Stop Codon | Intergenic Nucleotides |
|---|---|---|---|---|---|---|---|
| trnM | J | 1–68 | 68 | CAU | |||
| trnI | J | 71–138 | 68 | GAU | 2 | ||
| trnQ | N | 134–206 | 73 | UUG | −5 | ||
| nad2 | J | 210–1220 | 1011 | ATT | TAA | 3 | |
| trnW | J | 1222–1288 | 67 | UCA | 1 | ||
| trnC | N | 1281–1346 | 66 | GCA | −8 | ||
| trnY | N | 1349–1415 | 67 | GUA | 2 | ||
| cox1 | J | 1418–2959 | 1542 | ATG | TAA | 2 | |
| trnL2 | J | 2954–3022 | 69 | UAA | −6 | ||
| cox2 | J | 3022–3703 | 682 | ATA | T | −1 | |
| trnK | J | 3706–3778 | 73 | CUU | 2 | ||
| trnD | J | 3778–3846 | 69 | GUC | −1 | ||
| atp8 | J | 3846–4007 | 162 | ATT | TAA | −1 | |
| atp6 | J | 4001–4678 | 678 | ATG | TAA | −7 | |
| cox3 | J | 4678–5466 | 789 | ATG | TAA | −1 | |
| trnG | J | 5468–5535 | 68 | UCC | 1 | ||
| nad3 | J | 5538–5888 | 351 | ATT | TAA | 2 | |
| trnA | J | 5902–5966 | 65 | UGC | 13 | ||
| trnR | J | 5968–6033 | 66 | UCG | 1 | ||
| trnN | J | 6035–6102 | 68 | GUU | 1 | ||
| trnS1 | J | 6106–6173 | 68 | GCU | 3 | ||
| trnE | J | 6200–6264 | 65 | UUC | 26 | ||
| trnF | N | 6262–6330 | 69 | GAA | −3 | ||
| nad5 | N | 6329–8072 | 1744 | ATA | T | 0 | |
| trnH | N | 8073–8140 | 68 | GUG | 0 | ||
| nad4 | N | 8141–9479 | 1339 | ATG | T | 0 | |
| nad4l | N | 9495–9782 | 288 | ATG | TAA | 16 | |
| trnT | J | 9787–9850 | 64 | UGU | 4 | ||
| trnP | N | 9850–9917 | 68 | UGG | −1 | ||
| nad6 | J | 9919–10,446 | 528 | ATC | TAA | 1 | |
| cob | J | 10,462–11,613 | 1152 | ATG | TAA | 15 | |
| trnS2 | J | 11,612–11,678 | 67 | UGA | −2 | ||
| nad1 | N | 11,700–12,638 | 939 | ATT | TAA | 21 | |
| trnL1 | N | 12,638–12,707 | 70 | UAG | −1 | ||
| rrnL | N | 12,708–14,107 | 1400 | 0 | |||
| trnV | N | 14,108–14,174 | 67 | UAC | 0 | ||
| rrnS | N | 14,175–14,955 | 790 | 0 | |||
| CR | J | 14,956–16,376 | 1421 | 0 |
Disclaimer/Publisher’s Note: The statements, opinions and data contained in all publications are solely those of the individual author(s) and contributor(s) and not of MDPI and/or the editor(s). MDPI and/or the editor(s) disclaim responsibility for any injury to people or property resulting from any ideas, methods, instructions or products referred to in the content. |
© 2023 by the authors. Licensee MDPI, Basel, Switzerland. This article is an open access article distributed under the terms and conditions of the Creative Commons Attribution (CC BY) license (https://creativecommons.org/licenses/by/4.0/).
Share and Cite
Gao, X.; Bai, Y.; Jiang, X.; Long, X.; Wei, D.; He, Z.; Zeng, X.; Yu, Y. Complete Mitochondrial Genome Characterization of Schrankia costaestrigalis (Insecta: Erebidae: Hypenodinae) and Its Phylogenetic Implication. Genes 2023, 14, 1867. https://doi.org/10.3390/genes14101867
Gao X, Bai Y, Jiang X, Long X, Wei D, He Z, Zeng X, Yu Y. Complete Mitochondrial Genome Characterization of Schrankia costaestrigalis (Insecta: Erebidae: Hypenodinae) and Its Phylogenetic Implication. Genes. 2023; 14(10):1867. https://doi.org/10.3390/genes14101867
Chicago/Turabian StyleGao, Xuyuan, Yu Bai, Xiaodong Jiang, Xiuzhen Long, Dewei Wei, Zhan He, Xianru Zeng, and Yonghao Yu. 2023. "Complete Mitochondrial Genome Characterization of Schrankia costaestrigalis (Insecta: Erebidae: Hypenodinae) and Its Phylogenetic Implication" Genes 14, no. 10: 1867. https://doi.org/10.3390/genes14101867
APA StyleGao, X., Bai, Y., Jiang, X., Long, X., Wei, D., He, Z., Zeng, X., & Yu, Y. (2023). Complete Mitochondrial Genome Characterization of Schrankia costaestrigalis (Insecta: Erebidae: Hypenodinae) and Its Phylogenetic Implication. Genes, 14(10), 1867. https://doi.org/10.3390/genes14101867