Article

Comparative Genetic Association Analysis of Human Genetic Susceptibility to Pulmonary and Lymph Node Tuberculosis

1
Department of Microbiology, Vallabhbhai Patel Chest Institute, University of Delhi, Delhi 110007, India
2
The Global Tuberculosis Program, Baylor College of Medicine, William T Shearer Center for Immunobiology, Texas Children’s Hospital, Houston, TX 77004, USA
*
Authors to whom correspondence should be addressed.
Genes 2023, 14(1), 207; https://doi.org/10.3390/genes14010207
Submission received: 4 November 2022 / Revised: 8 January 2023 / Accepted: 11 January 2023 / Published: 13 January 2023
(This article belongs to the Special Issue Protein Interactions, Pathways, and Networks in Health and Disease)

Abstract

:
Background: Tuberculosis (TB) manifests itself primarily in the lungs as pulmonary disease (PTB) and sometimes disseminates to other organs to cause extra-pulmonary TB, such as lymph node TB (LNTB). This study aimed to investigate the role of host genetic polymorphism in immunity related genes to find a genetic basis for such differences. Methods: Sixty-three, Single nucleotide polymorphisms (SNPs) in twenty-three, TB-immunity related genes including eleven innate immunity (SLCA11, VDR, TLR2, TLR4, TLR8, IRGM, P2RX7, LTA4H, SP110, DCSIGN and NOS2A) and twelve cytokine (TNFA, IFNG, IL2, Il12, IL18, IL1B, IL10, IL6, IL4, rs1794068, IL8 and TNFB) genes were investigated to find genetic associations in both PTB and LNTB as compared to healthy community controls. The serum cytokine levels were correlated for association with the genotypes. Results: PTB and LNTB showed differential genetic associations. The genetic variants in the cytokine genes (IFNG, IL12, IL4, TNFB and IL1RA and TLR2, 4 associated with PTB susceptibility and cytokine levels but not LNTB (p < 0.05). Similarly, genetic variants in LTA4H, P2RX7, DCSIGN and SP110 showed susceptibility to LNTB and not PTB. Pathway analysis showed abundance of cytokine related variants for PTB and apoptosis related variants for LNTB. Conclusions: PTB and LNTB outcomes of TB infection have a genetic component and should be considered for any future functional studies or studies on susceptibility to pulmonary and extra-pulmonary TB.

1. Introduction

Tuberculosis (TB), a major health hazard worldwide, is characterized by different clinical manifestations including localized infection in the lungs or pulmonary TB (PTB) and various forms of extra-pulmonary (EPTB). PTB accounts for 80% of all forms of TB [1], while EPTB constitute about 15–20% of all immunocompetent TB cases and 50% in cases infected with Human Immunodeficiency Virus (HIV) [2]. The most common form of EPTB is tubercular lymphadenitis (LNTB) with 50% of the cases involving the peripheral lymph nodes [3]. The basis of the variability of disease manifestation by the same infectious organism is unclear. It is not well understood as to why some individuals have EPTB disease which can infect other sites such as lymph nodes, while most persons have localized infection in the lungs.
The propensity for such different manifestations can be attributed to environmental exposures, pathogen virulence traits and host genetics of immune response. It is not really understood which of the aforementioned factors is the most important. India being an endemic country for tuberculosis with highest number of incident TB cases in 2021 [1], the prominent role of environmental exposures would most likely not be a driving factor in this population. As for pathogen virulence traits, there is association between infectivity of Mycobacterium tuberculosis (Mtb) strain and extra-pulmonary infections [4]. Pathogen variance can differ in disease presentations and Mtb strains in EPTB show mutations as in the pncA gene [5], or insertions and deletions in the phospholipase-C gene D (plcD) gene [6], which is not seen strains isolated from PTB patients. To, that angle, in north India the most commonly circulating strain is Central Asian (CAS-1), Delhi and the East African Indian (EAI) strains [7], which have not been shown to be associated with either PTB or EPTB alone. Although Mtb strains show genetic diversity, in various manifestations of TB like PTB or meningeal TB, the association is not lineage-specific [8], pointing to the decisive nature of host-genetics in such a scenario.
Both host and pathogen genotypes can be important as Mtb lineage specific association with disseminated disease of tubercular meningitis was identified to be associated with the TLR2 polymorphism. [9]. The question remains as to why individuals infected with genotypically same, or different circulating strains of Mtb show different immune response. As far as the host genetics is concerned, ethnic specificity of the immune response in TB has been demonstrated [10].
So, to address the question of existing variability in the important immune response genes and their effect on governing this differential manifestation of TB, we designed a comparative association study between PTB and LNTB. Host genetic association studies on different manifestations of tuberculosis are few (11–21) and comparative studies limited. EPTB studies have focused on tubercular meningitis (TBM) [11,12], pleural TB, mixed cases with any form of EPTB together [13] but not LNTB. Genetic variants in EPTB have been studied only in limited number of genes including TLR2 [11], IL10, IFNG [13], VDR [14,15], P2RX7 [16,17], SP110 [18,19], IL1B, IL1RA [15,20] and a pilot scale genome-wide association study [21], while PTB has been extensively studied across multiple genes [22].
Therefore, to maximize the number of genes compared between PTB and LNTB, in this study, we have considered multiple genes in a candidate gene approach. A total of twenty-three genes which have been shown to be important in tuberculosis immunopathogenesis [22] were genotyped for 63 human genetic variants encompassing both innate and adaptive branch of tuberculosis in order to investigate both the arms of immunity.
We found that polymorphisms in the cytokine genes were associated with susceptibility to PTB. These cytokine genetic variants showed no or weaker association with LNTB. The cytokine genetic variants also showed high degree of gene-gene interaction among them accentuating their importance in governing susceptibility to PTB in north Indians. Interestingly, the variants in SP110 [23] and P2RX7 [24], which control macrophage apoptosis during tuberculosis infection, were associated with the risk of developing LNTB.
Overall, the study described here demonstrates that differences in host genetics is associated with different manifestations of tuberculosis. The study contributes to the emerging knowledge of key players in host-pathogen interaction in tuberculosis. We show that host genotype is a key determinant of the outcome of host-pathogen interaction and thus manifestation of tuberculosis as pulmonary and LNTB form.

2. Materials and Methods

2.1. Study Population

Venous blood Samples were collected from TB hospitals in and around New Delhi between 2009–2011. TB cases were 15 years or older culture confirmed or clinically diagnosed PTB cases with sputum smear microscopy for acid-fast bacilli (AFB), culture and chest X-ray data. Individuals included were not on any anti-tubercular therapy. For LNTB, patients were carefully selected to only have peripheral lymph node tuberculosis. Fine needle aspiration cytology (FNAC) was used to make histological confirmation of granulomatous structure and the FNAC was stained for AFB. Either histologically confirmed or AFB positive patients were considered for the LNTB group of the study. Patients with mixed EPTB and PTB infection were excluded from the study. All the enrolled patients were HIV negative. HIV negative community controls were enrolled from in and around New Delhi. The controls were confirmed to have never been diagnosed with TB and had no family history of TB. For the discovery cohort for cytokine genes, we enrolled Pulmonary TB (PTB), n = 110; Lymph Node TB, n = 35; Healthy controls, n = 78. For the validation cohort for 9 SNPs from six cytokine genes we had a sample size of PTB, n = 160, LNTB, n = 50: HC, n = 265. This was obtained by obtaining the genotypes for additional, ethnicity matched controls (n = 135), were added for the validation phase analysis and were obtained from the Indian genome variation consortium database [25]. For the Innate Panel we had PTB, n = 125; LNTB, n = 50 and HC n = 125.
All patients and volunteers were informed about the study and an informed written consent was obtained from all the study participants. This study (ID: 60(0081)/07/EMR-II), was approved by the Institutional ethics committee of Vallabhbhai Patel Chest Institute, University of Delhi.

2.2. SNP Selection

For the discovery panel, thirty-nine SNPs from twelve cytokine genes were selected. The SNPs mostly were in the intronic, exonic and 3′UTR regions. To avoid selection of non-polymorphic loci, as there was no data available on the Indian population at the time of the study initiation; we relied on the HapMap database (www.hapmap.org accessed on 3 November 2022). SNPs were selected based on the following criteria: 1. Reported frequency >10% in at least 3 world population in HapMap database; 2. Reported frequency >20% in at least 2 world populations in HapMap database; 3. Average heterozygosity, which is a measure of genetic diversity at population scale was considered from dbSNP (http://www.ncbi.nlm.nih.gov/projects/SNP accessed on 3 November 2022). It indicates the average proportion of individuals which are heterozygous in dbSNP from all the SNP data submitted to it, and this reduces selection on non-polymorphic loci. We have successfully implemented this strategy previously identifying novel genetic associations for TB [26]. New associations identified from the discovery panel in the study, were intersected with previously identified strong association with PTB [26] and used for the validation panel.

2.3. SNP Genotyping

Genomic DNA was extracted using QIAamp DNA kit (Qiagen, Hilden, Germany). The concentrations of the DNA samples were determined by Nanodrop using NanoquantTM plate of Infinite® Pro 200 system (Tecan, Männedorf, Switzerland), checked for purity on an 1% agarose gel and stored at −20 °C until further analyses. All the cytokine SNPs were genotyped using the matrix-assisted laser desorption/ionization time-of-flight (MALDI-TOF) mass spectrometry (Sequenom Inc., San Diego, CA, USA). Assays for all SNPs were designed using Spectro DESIGNER software (Sequenom Inc., San Diego, CA, USA) and genotyped using the iPLEX assays (www.sequenom.com/iplex accessed on 3 November 2022) as described previously [26].
The innate panel SNPs were typed using tetra-primer Amplification refractory mutation system (ARMS) PCR following the method of Ye et al. [27] with modifications optimized for our SNP panel.
Briefly, primers for each selected polymorphism were designed using primer design software available at http://cedar.genetics.soton.ac.uk/public_html/primer.html accessed on 3 November 2022. The software has been optimized to include two deliberate mismatches in the inner primer sets at 3′ termini and −2 bases from 3′ terminal to aid in the allele specificity. Each PCR reaction was carried out in a total volume of 10 μL containing 30 ng of template DNA, 10 pmol of each outer and inner primers, 200 mM of dNTPs, appropriate. concentration of Mgcl2 (2.5 −3.5 nm), 20 mM Tris-Cl pH 8.4, 50 mM KCl, 0.05% (v/v) W1 and 0.5 Units of thermostable Taq polymerase. The PCR conditions included 2 min at 95 °C, 1 min annealing (annealing temperatures different according to primers) and 1 min extension (72 °C), and additional two minutes extension at 72 °C at the end of 35 cycles. Representative images of all genotyped polymorphisms are available in Figure S1A–O.
To confirm that ARMS PCR detection of genotypes matches up with Sequenom genotyping, we selected a SNP (rs3212220) form IL12. This SNP was which was been genotyped on the Sequenom platform as well as ARMS-PCR was carried out for all the individuals of the control group and full concordance was observed (Table S1). LTA4H gene SNP rs17525495 was typed using allelic discrimination assay (catalog number: 4351379, Applied Biosystems) using manufacturer’s instructions.

2.4. ELISA for Serum Cytokine Measurement

Serum collected from the abovementioned cohort was quantified for the level of circulating cytokines by using Enzyme-linked Immunosorbent assay (ELISA) using cytokine kits following the manufacturer’s instructions. The unknown values were extrapolated from a standard curve within the linear range.

2.5. Statistical Analysis

Hardy-Weinberg equilibrium was assessed in cases and controls for all tested variants to ensure that the samples were within allelic population equilibrium by using Haploview v 4.2 (http://www.broad.mit.edu/mpg/haploview/ accessed on 3 November 2022). A stringent cut off offered by the Haploview v 4.2 was used to perform further analysis which was used as a filtering criterion which included the following parameters: Minimum genotype = 75% and minimum minor allele frequency 0.0010) and HWE controls p > 0.05. The samples and SNPs failing this test were not selected for further analysis. PLINK v 1.07 (http://pngu.mgh.harvard.edu/purcell/plink/ accessed on 3 November 2022) was used to correct for multiple comparison, using Bonferroni methods, p-value after correction considered significant in the validation panel. Haplotype block generation was performed using the algorithm by Gabriel et al., 2002 [28] implemented in the Haploview software (http://www.broad.mit.edu/mpg/haploview/ accessed on 3 November 2022) which was also used for initial association testing. Genetic association testing was done using a 2 × 2 contingency table. Odds ratio, two tailed p-value was calculated for alleles using GraphPad Prism (version 5.00 for Windows, Graph Pad Software, San Diego, CA, USA, www.graphpad.com accessed on 3 November 2022). A two-tailed p value < 0.05 was considered statistically significant. The Odds ratio was confirmed by PLINK v 1.07, using a general model with fisher’s exact test options. Multidimensional scaling using pairwise identity-by-state distances which was inferred based on genotypes of the 34 SNPS of the cytokine was carried out in. PLINK v 9.0. Raw Distances were plotted on a 3D plot in R using the ‘rgl’ package.
For gene-gene interaction analysis we applied semi-exhaustive testing for pairwise interaction using PLINK v 1.07. The --fast epistasis along with --case-only option was used for this purpose. This has been hailed as a powerful approach by some workers. It provides a logistic regression test for interaction. This analysis exploits the fact that under certain conditions an interaction term in logistic regression equation corresponds to dependency or correlation between relative predictor variables within the population of cases. It uses an allelic model for both main effects and interactions and genotypes are not correlated.

2.6. SNP Targeted Pathway Analysis

We performed a SNP targeted pathway analysis using the PANOGA protocol [29] as shown by Bakir-Gungor et al. [30]. The PANOGA protocol uses the association information in terms of p-value and creates files that can be used as input files in Cytoscape [31] application of the JActiveModules [32], which takes the genes containing the SNPs information and extrapolates it to the human whole human protein-protein interaction network and derives network and sub-network based on the input genes in the query. The JActiveModules output consisting of networks is then used as an input in ClueGo app [33] in which one can look for gene annotations from various sources including the KEEG, WikiPathways [34], GO database for immunological, biological, molecular and other networks that has been used to visualize the pathways to the gene interaction scale. We chose the WikiPathways to visualize the genes in the results.

3. Results

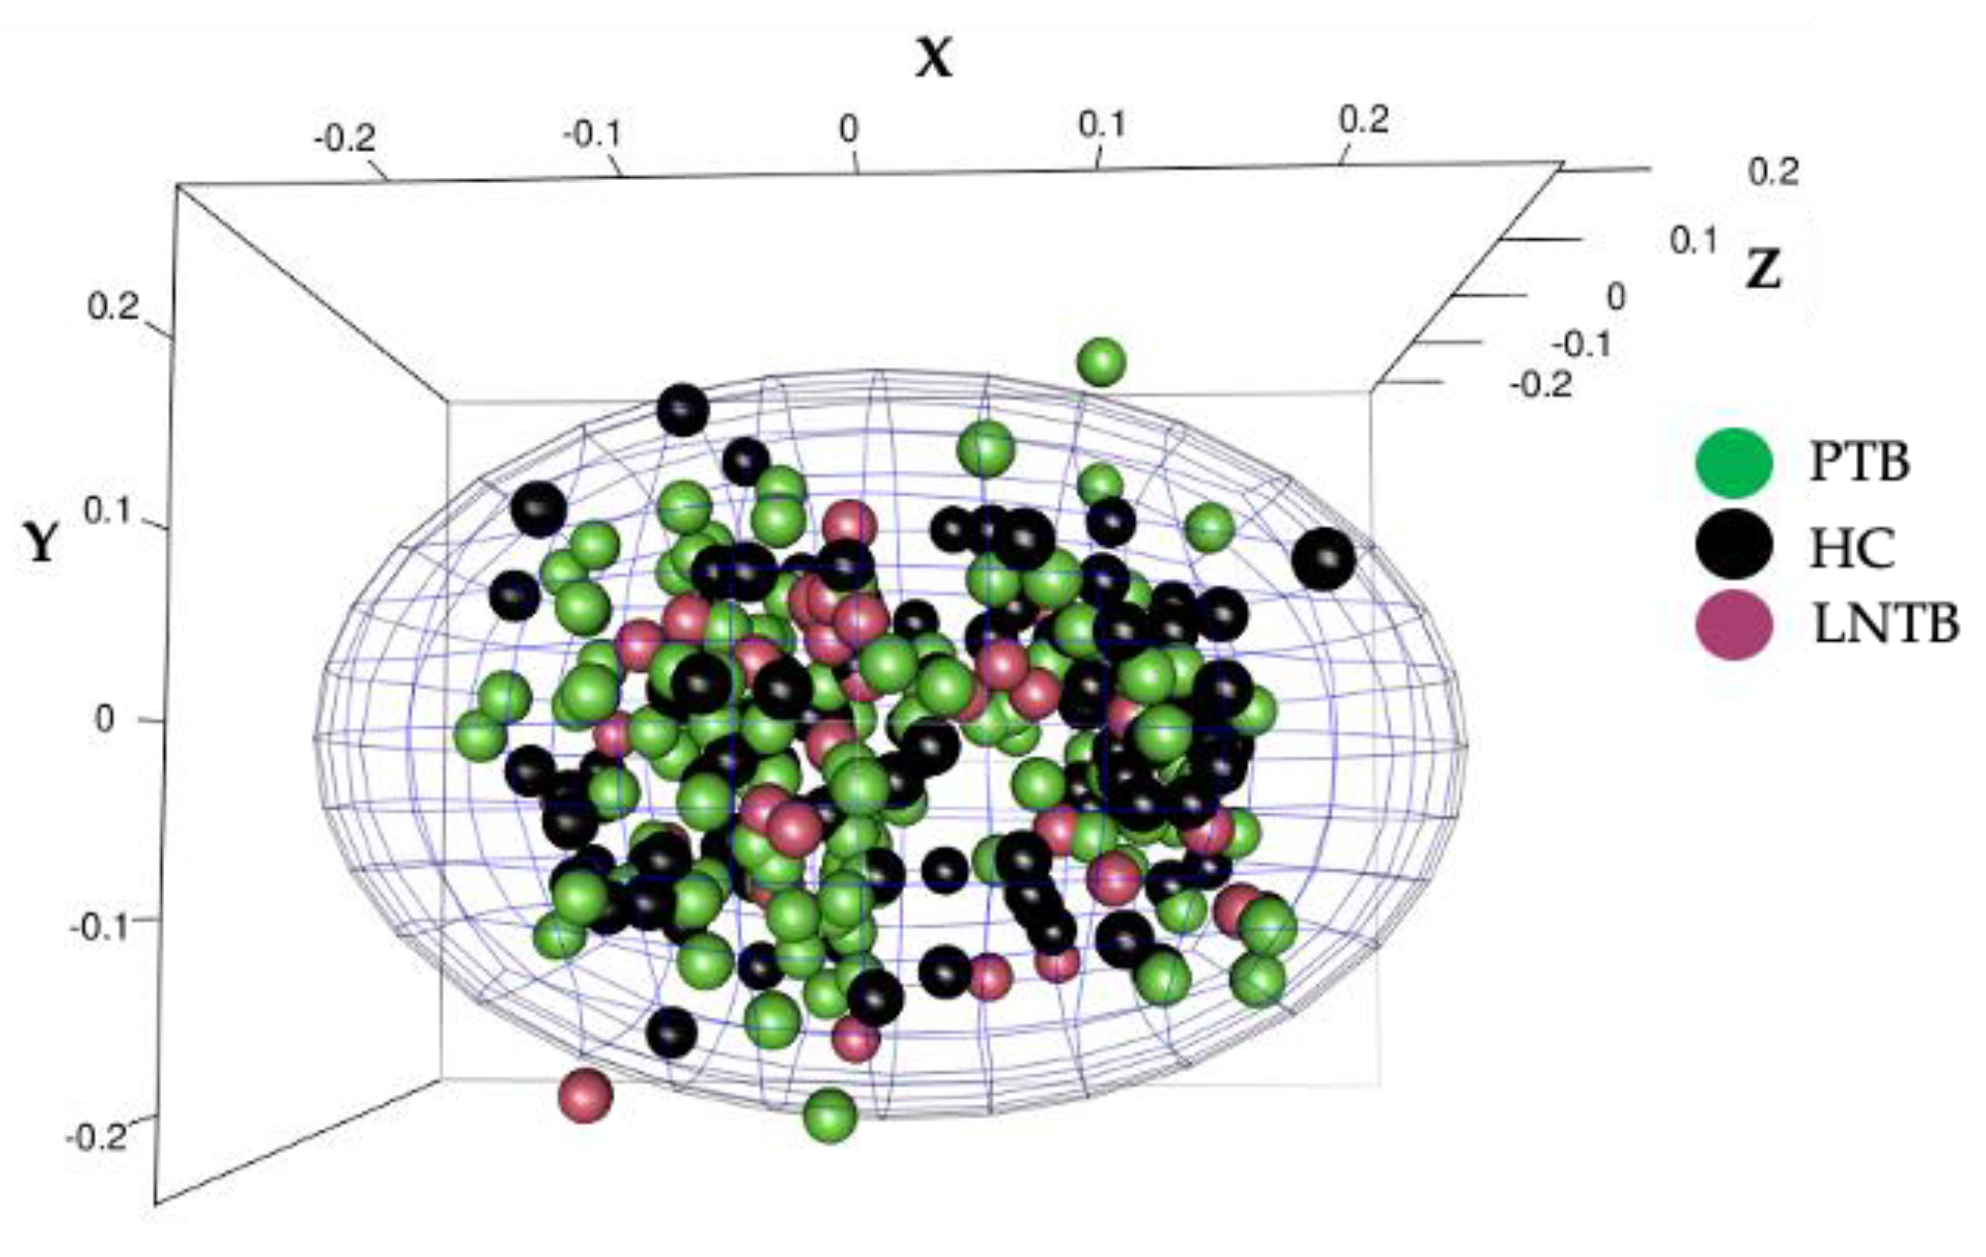
3.1. The Study Population Was Devoid of Population Stratification

False-positive associations can arise as a result of population stratification [35]. To investigate any hint of population-substructure, the self-reported ethnicity of each subject and his/her parents was carefully considered. To rule out population stratification a Multidimensional scaling (MDS) analysis was carried out on the genotyping data from the groups, which generated a compact cluster, without separating, indicating that population of patients (PTB and LNTB) and control subjects (HC) were homogenous with no sub-structures (Figure 1).

3.2. Cytokine Genetic Variants Show Significant Allelic and Haplotypic Association in PTB and Not in LNTB

For analysis of the genetic association of the cytokine variants, we initially constituted a discovery panel of 39 SNPs listed in Table S2. We genotyped these cytokine polymorphisms in 110 PTB cases, 78 HC and 35 LNTB cases. A Combined (PTB + LNTB) comparison (Table 1) was followed by a separate PTB and LNTB comparison for association (Table 1), with the aim to identify the SNPs- linked to differential susceptibility to PTB and LNTB. 26 SNPs for PTB, 23 SNPs for LNTB and 24 SNPs combined, passed the filtering criteria, and were analyzed for allelic association are listed in Table S3. The significant and borderline significant associations are enlisted in Table 1.
When considering PTB and LNTB cases together for analysis (Combined) we could identify only one variant from IL10 gene rs1878672 of significance while certain others showed trend for association such as rs746868 of TNFB, rs1143643 IL1B and rs419598 of IL1RA. From the PTB only analysis we could identify only one variant from IL10 gene rs1878672 of significance with C allele showing 3.4-fold risk of developing PTB. While certain others which showed trend for association in all TB group such as rs746868 of TNFB (1.6-fold risk), rs1143643 of IL1B (3.2-fold risk) showed association with PTB group, indicating that disease type has a bearing on the susceptibility to TB. From the LNTB only analysis we could identify only variant from IL6 gene, rs1548216 of significance with C allele showing a 4.4-fold risk of developing LNTB.
Analysis of the gene structure in the combined analysis revealed two haplotype blocks formed by SNPs in TNFB and IL18 (Table 2). The haplotypic frequency among case and controls did not differ significantly for both PTB and combined groups (Table 2). While the combined and PTB analysis showed two combinations each for TNFB and IL8, LNTB showed four combinations for TNFB, the haplotypic frequency of one of which, the TTC showing 4.4-fold risk of developing LNTB (Table 2). No multiple corrections were carried out at this stage in the analysis. The aim was not to prematurely discard SNPs and select them for further validation in a larger sample size.
After, discovering that cytokine gene polymorphism associations with PTB and to a lesser extent in LNTB, we wanted to independently validate, these findings before making a conclusion. We selected, 15 SNPs for the validation panel from eight cytokine genes (Table S2b). Seven of these genes and SNPs were selected association in the discovery panel (Table 1, Table S3) and the eight SNPs found from our previous study on 25 SNPs (Table S2b) from six cytokine genes [26], which achieved a replication sample size of 160 PTB cases, 50 LNTB cases and 265 controls, giving the validation panel a 91% power of study to detect an odds ratio of 1.8 and above for nine cytokine SNPs (Table S2b) [36].
Upon analysis of 15 cytokine SNPs after applying Bonferroni’s correction for multiple testing, (Table 3), for PTB we found association for IFNG at rs1861493, IL4 at rs2853694 and IL12 at rs3212220 after correction for multiple testing. This replicated our previous findings about cytokine gene polymorphisms increasing the risk for PTB [26]. In contrast, for LNTB two variants rs2070874 of IL4 and rs2853694 of IL12, showed significance but these associations were lost after correction for multiple testing. (Table 3). Interestingly, out of the 7 SNPs from the discovery panel which was significantly associated in (Table 1 and Table 2), only rs3024498 of IL10 gene achieved a borderline significance (p = 0.07) (Table S4a) and the rest was not replicated in the validation cohort for LNTB. This could be related to a lower replication sample size of the validation panel for LNTB. Therefore, these SNPs need larger sample size for validation. Here, we could validate our previous cytokine gene association findings [26]. This analysis showed that cytokine genetic variants increase the risk of PTB but not LNTB. These observations add value to the argument that genetic polymorphisms play a critical role in manifestation of TB as pulmonary or extra-pulmonary TB.

3.3. Gene-Gene Epistatic Interaction Analysis Reveals a Higher Risk for Cytokine Genes Majorly in PTB and Not LNTB

After determining that cytokine gene polymorphisms contributed to increased risk for PTB susceptibility, we applied semi-exhaustive epistatic testing for pairwise interaction among the significantly associated SNPs from a previous panel [26] and the current cytokine gene validation panel to understand their genetic interaction. Thirteen significant interactions were identified and are enlisted in Table 4. Interestingly, the IL4 locus showed interaction in LNTB as well, highlighting a critical role for this SNP in the north Indian population (Table 4). This approach also identified some SNPs which were not associated in the single locus analysis. IL1RA emerged as the gene having a significant interaction with IL12, IL4 and TNFB genetic variants. Most of the IL1RA interactions were protective with odds ratio <1. Only one interaction between its own SNP was showing an eight-fold risk (p = 3.066 × 10⁻⁵). This interaction could be important in defining the genetic susceptibility to TB. The other important player was IL4 which showed interaction with variants of IL12, IL1RA and TNFB. Interestingly, all the interactions of IL4, an anti-inflammatory cytokine with other proinflammatory cytokines such as IL12 and TNFB showed a very high risk (18-fold risk) with very highly significant p-values. These genetic interactions enabled us to test the hypothesis that the disease outcome in tuberculosis can be due to interaction of the cytokine gene polymorphism. Also, many of the loci identified here were not significant in single variant association analysis. This analysis confirmed that cytokine gene polymorphisms affect the outcome of PTB more than LNTB, adding evidence to support the role of genetic polymorphisms in differential disease manifestation in TB.

3.4. Lack of Major Association of Cytokine Levels with Genotypes in LNTB

We have previously shown that cytokine levels are affected by their genotypes, and individuals with a certain genotype secrete more of less of cytokines in their serum in people with PTB [37]. Since, we observed such stark differences in the association of cytokine gene polymorphism in PTB and LNTB, we carried out a similar analysis for the LNTB samples in this study. Overall, LNTB showed higher levels of the cytokine as compared to the healthy controls (Figure 2A). Out of 34 SNPs tested, none of the cytokine genotypes except for IL8 at rs3882891 showed any significant difference in cytokine levels as governed by their genotype (Figure 2B), lending credibility to a major role of cytokine gene polymorphism in PTB but not LNTB.

3.5. Innate Immunity Related Genes Are Majorly Associated with LNTB and Not PTB

Innate immunity forms the first line of defense and multiple of innate immune genes have been implicated in susceptibility to PTB in various populations of the world where TB is endemic [22]. Since we observed such stark differences in cytokine gene polymorphisms, we hypothesized that a number of these gene polymorphisms would be PTB or LNTB specific. Widely studied polymorphisms were selected on for the study, as it would offer us a great comparative insight with other world populations for TB susceptibility. The allelic association of the innate genes is listed in Table 5.
P2RX7 gene showed a 7-fold risk for: −762 T/C (rs2393799) C allele for the development of LNTB this association was marginally associated with risk of developing PTB. For rs37511431 we didn’t detect any association. Out of three studied variants of the VDR gene variants i.e., FokI (rs2228570), TaqI (rs731236), BsmI (rs1544410), rs1544410 was found to be not polymorphic (presence of only one allele detected), rest of the two polymorphisms were not found to be associated with TB (both PTB and LNTB) risk or protection in this population. We did not find any association between either PTB or LNTB and IRGM genetic variant rs9637876 (Table 5). The results indicated that NRAMP1/SLC11A1 gene polymorphic variants may not be associated with the susceptibility to TB in the studied population. In fact, we could detect the presence of only a single genotype in all cases and controls; a CC genotype for rs3731865 and a heterozygous AG genotype for rs17235409. No haplotypes were observed. G allele of the TLR2 genetic variant rs6265786 (Arg677Trp) of showed a high risk for PTB but not for LNTB. Similar results obtained for rs4986790 of TLR4 gene where the G allele of shows a 2-fold risk of development of PTB. For DCSIGN (CD209) in PTB cases, with allele ‘A’ of rs4804803 was overrepresented in cases as compared to healthy controls showed a very significant association posing a 4-fold risk for developing PTB in north Indians and a 1.9-fold risk in LNTB cases (Table 5). None of the two tested NOS2A variants i.e., rs2274894 and rs7215373 showed any association either in PTB or LNTB, although the variant rs7215373 showed marginal association for both PTB and LNTB. Of the three studied three polymorphisms in the LTA4H gene rs1978331, rs2660898, and rs17525495, none of the variant showed association in either PTB or LNTB. LTA4H gene polymorphisms have been shown to provide heterozygous protection, implying that a heterozygous genotype is protective from TB [12]. When we compared the heterozygous genotypes vs the homozygotes as proposed by Tobin et al., we observed, that out of three typed variants, rs1978331 have a protective association (odds ratio < 1) in combined and LNTB but not in PTB (Table 6). Similar, odds were observed between the haplotype of rs1978331-rs2660898, where when both the SNPs are heterozygous, they are borderline protective for LNTB and not PTB (Table S4). We have previously shown that, SP110 gene polymorphisms were associated with risk of LNTB and not PTB in this population [19]. To continue exploring this gene in an independent cohort, we genotyped, SP110 variants rs6436915, rs1346311, rs7580900. As shown previously and none of these showed any allelic associations in PTB (Table 5). Due to limited independent samples for LNTB, these were not genotyped.
Since, we observed a uniform TLR gene polymorphism risk for both PTB and LNTB, we also genotyped four TLR8 gene polymorphisms, as their genetic association has been shown to be important for outcome of TB. Uniquely, TLR8 is located on the X chromosome, so the males as they have only one copy of the X chromosome, would be hemizygous. Analyzing the risk in males and females separately, revealed a higher risk for males as expected carrying A allele for rs3788935 (17-fold risk), rs3761624 (4-fold risk). A risk for female population was also detected for rs3761624 which was lost after multiple corrections testing. If A allele is risk factor for males as they carry only one copy a corresponding homozygous phenotype can be a risk factor for females too as depicted by rs3761624. The sample size of LNTB group (n = 50) was limited for a stratified analysis by sex, so it was not carried out for LNTB (Table 7). Interestingly, in a case vs control analysis not stratified by sex TLR8 PTB showed an increased risk for 3 (rs3788935, rs3761624, rs3764880) and LNTB 2 (rs3761624, rs3764879) among the four variants typed (Table S5).

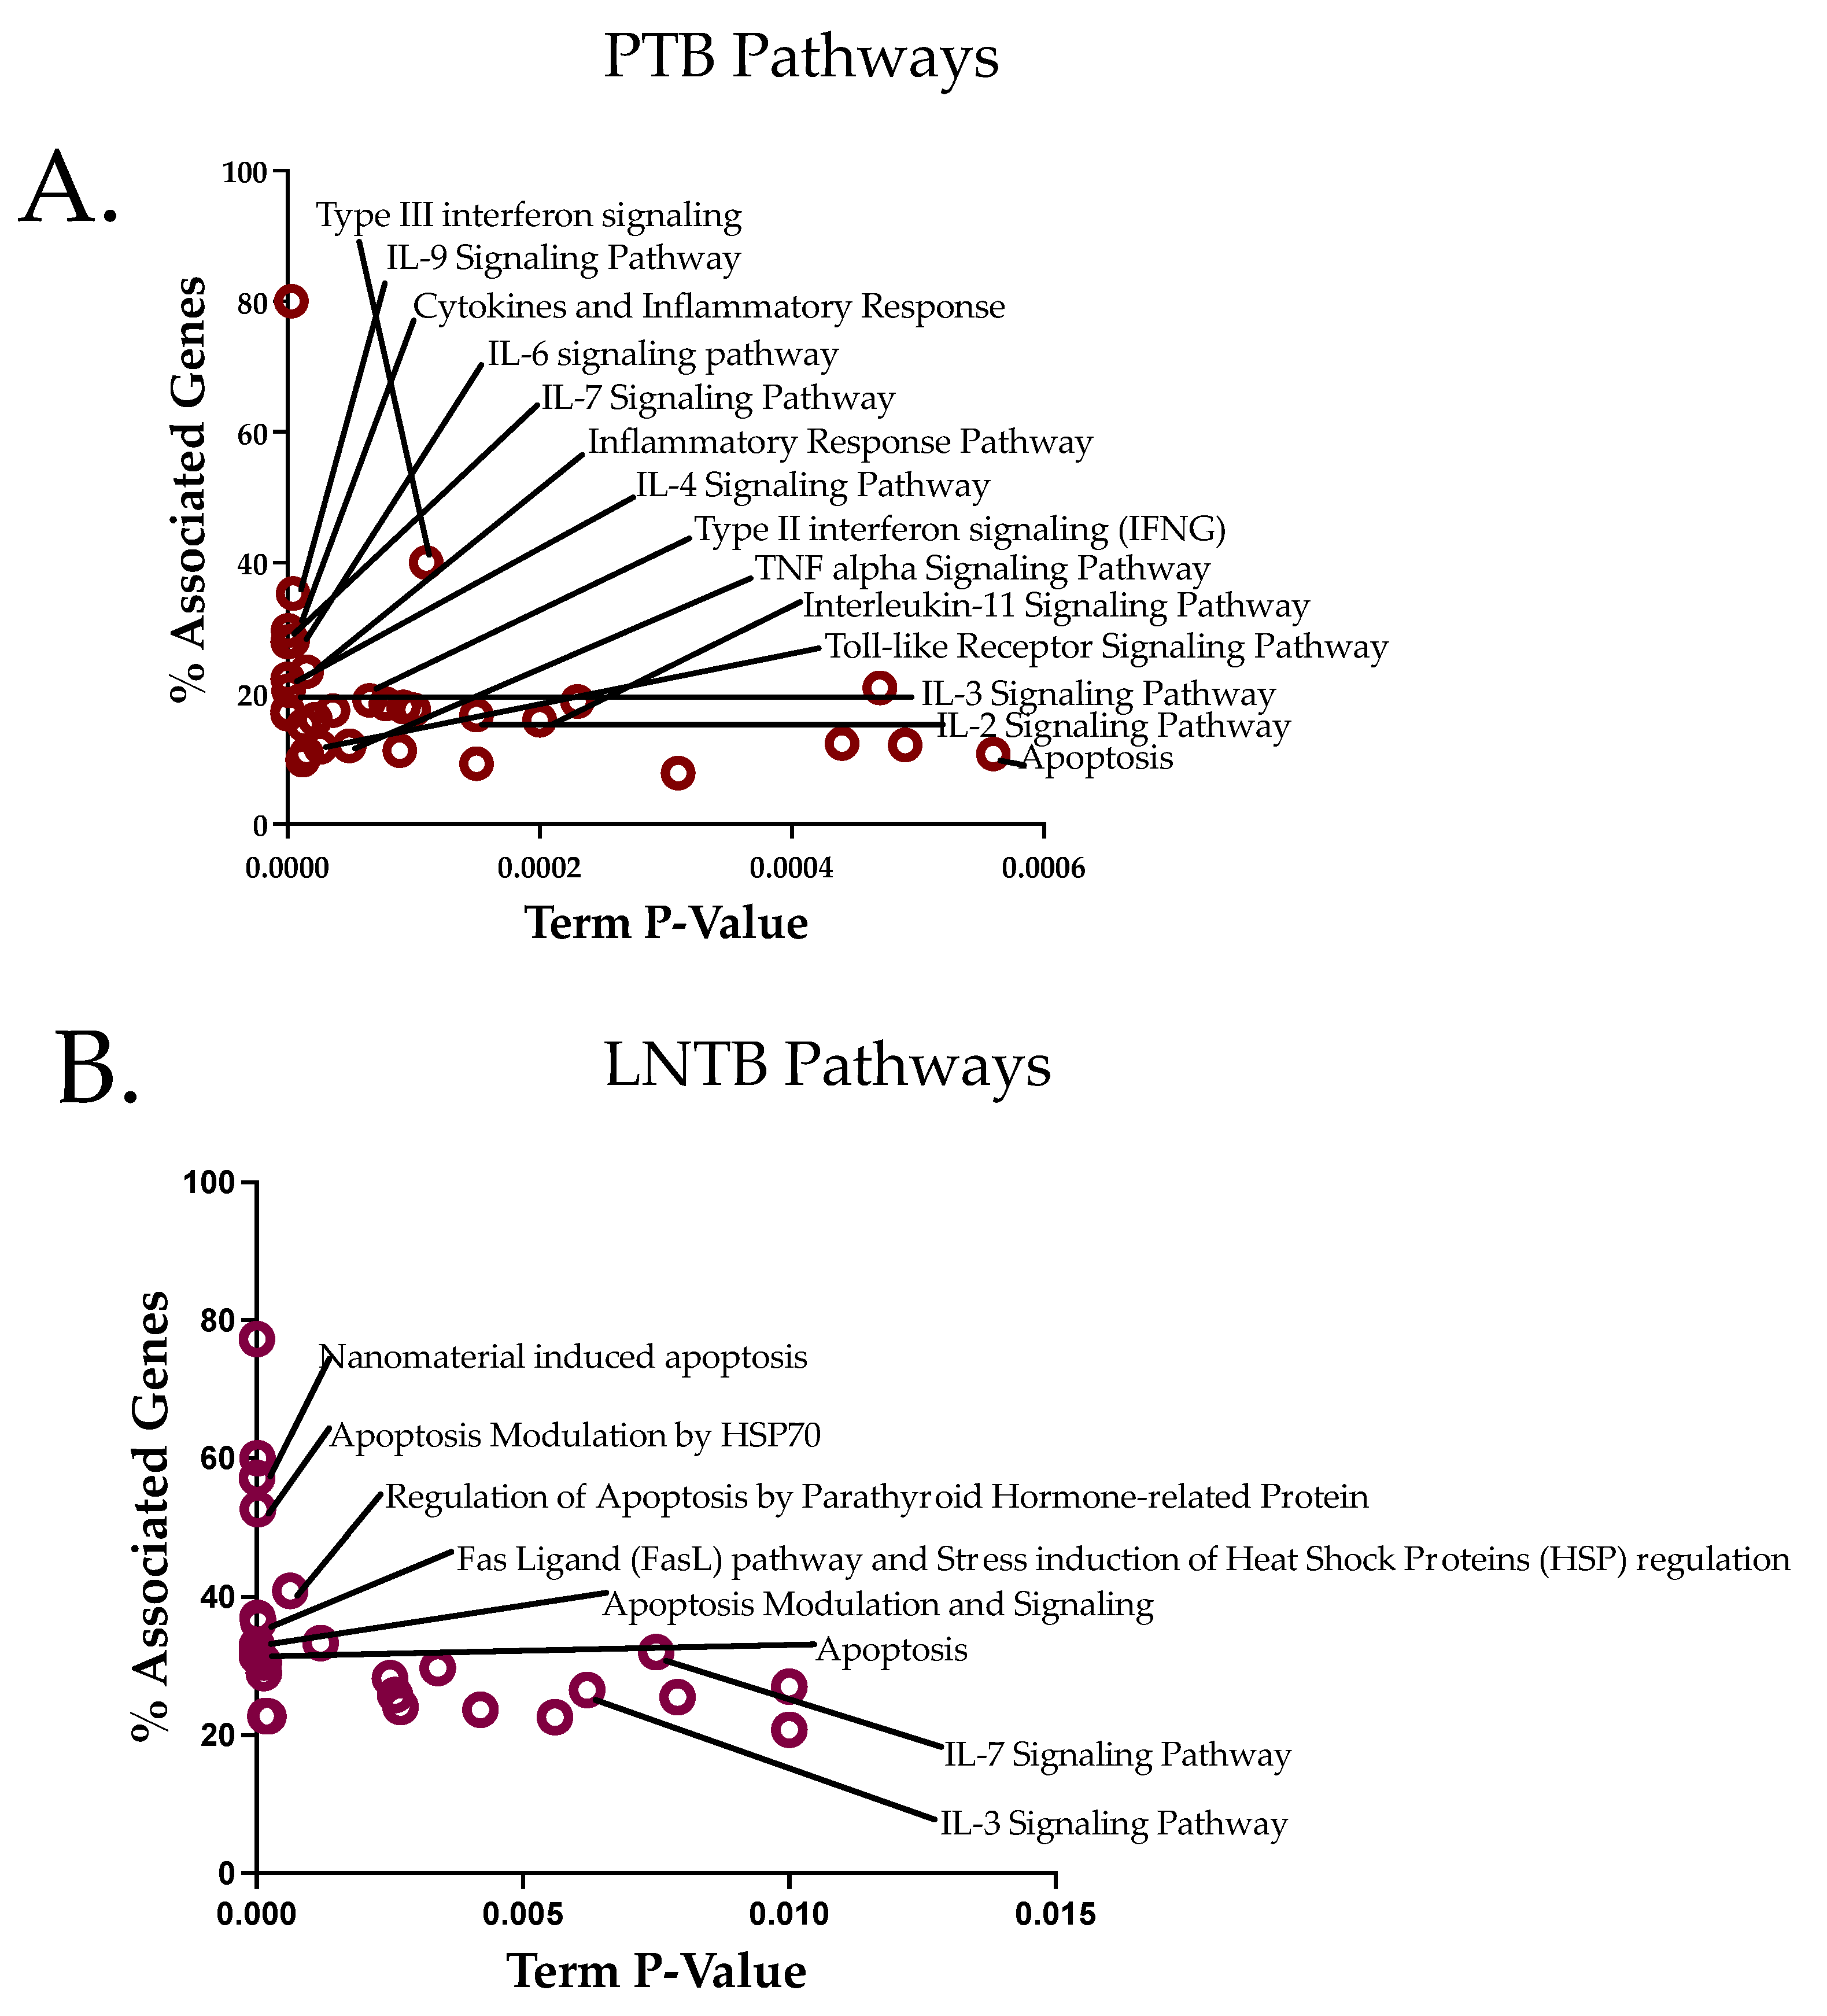
3.6. Pathway Analysis Reveals an Apoptotic Axis for LNTB and a Cytokine Axis for PTB

SNP association and their respective p-values from the study was used as an input to identify associated modules from a protein-protein interaction network, which was used to identify the associated pathways and the results obtained were subjected to a gene-ontology annotation using WikiPathways [29,30]. All the SNPs that are significantly associated in this study and previous studies on this population [19,26] were considered. An abundance for cytokine pathways was seen for PTB (Figure 3A), while abundance of apoptosis modules was seen for LNTB (Figure 3B). This pathway level difference is in line with the genetic association findings presented above, showing these differential genetic association could contribute to differential pathway activation and hence activate the immune response distinctly. This adds another level of evidence of differential host genotype being responsible for different manifestation of PTB and LNTB.

4. Discussion

Human genetic diversity is hugely impacted by co-evolving pathogens such as Mtb [38]. Candidate gene studies using the case—control design provides one of the most direct means of identifying human genetic variants that currently impact on susceptibility to infectious disease. Such information would help improve the understanding of disease pathogenesis and disease resistance at an individual level, that could inform targeted intervention strategies based on their genotype as has been successfully implemented [12].
Several studies have shown that TB susceptibility has a genetic component (summarized in [22,39], but comparative studies on genetic susceptibility to different forms of TB are limited [21,40]. Such studies can provide insight into the role genetic polymorphisms in different manifestations of TB. Even rarer are studies on genetic susceptibility to EPTB. Some of the studied forms of EPTB have been involving multiple sites [16], LNTB [19,41,42], TB meningitis [42,43], intestinal TB [44], bone [42] and pleural [42].
In this study, we aimed to do a comparative study between PTB and LNTB to investigate differential genetic associations between PTB and LNTB. We tested several candidate gene polymorphisms, never investigated before, as associated with differential TB susceptibility (Table S1). In addition, we validated susceptibility loci previously identified in other populations [22,39] and our previous studies [19,26]. This is important as ethnic validation of commonly reported genetic variants in different populations is desirable. In total, 63 polymorphisms across 23 genes were selected and genotyped from both the innate and adaptive immune branches of immunity to TB in the north Indian population and their allele frequencies compared and linkage disequilibrium (LD) and haplotypes investigated. Thus, we have employed a comprehensive coverage of SNPs and genes to compare the genetic susceptibility differences between PTB and LNTB.
In our study, genetic variants in the cytokine were validated to be significant risk factors PTB (Table 3). We also showed that a significant gene—gene interaction among cytokine SNPs may further accentuate the importance of the identified SNPs in governing the genetic susceptibility to PTB. Interestingly, we didn’t find significant cytokine gene polymorphisms associated with LNTB. The important difference was lack of a major association between cytokine SNPs and serum cytokine levels in LNTB, which has been shown to be associated with PTB in multiple studies [37,45,46,47]. The difference between such association clearly shows that there are distinct genetic coordinates for with PTB and LNTB susceptibility. Highly enriched cytokine pathways in PTB and limited in LNTB (Figure 3) add strength to this argument.
Interestingly the innate immunity genes, P2RX7 [48] and DCSIGN [49,50,51], which are critical for immune response to Mtb, were risk factors for both PTB and LNTB, as expected. P2RX7 has been very widely studied as risk factor for both PTB and EPTB. Macrophages from patients with loss of function homozygous allele for rs3751143, could not kill Mtb in vitro in EPTB [16]. We didn’t observe any association with this variant in our study. Interestingly, another functional variant rs2393799, showed an increased risk for both PTB and LNTB, but the risk was much higher for LNTB (7-fold as compared to 1.5-fold for PTB). P2RX7 is known to have a role in apoptosis of Mtb infected macrophage [24]. Similar theme was seen for SP110 gene for which we have previously identified a risk for rs1427294 of in LNTB but not pulmonary TB [19]. Recently, this gene has been shown to inhibit apoptosis of infected macrophages, thereby resisting Mtb infection [23]. This in conjunction of identifying more apoptotic pathways do suggest that the apoptotic axis may be important in LNTB. The other genetic variants of importance in the LTA4H gene showed heterozygous protection in LNTB and not PTB (Table 6). So, we show in the current study that genetic variations in the innate immune genes have a closer relation to development of LNTB, whereas the cytokine genetic variants have little influence and associations in LNTB. Similarly, among the pattern recognition receptors, TLR2 and TLR4 showed risks for PTB but not for LNTB. TLR8 genetic variants showed risk for both PTB and LNTB with more risk for males in PTB. This adds to the theme of differential association between PTB and LNTB, TLRs variants have been shown to be critical risk factors for TB [52,53,54,55] but have not been studied for LNTB. Although, limited by sample size there appears to be differences in TLR gene polymorphisms in PTB and LNTB.
Similar to our study a few other studies have shown a selective genetic association with EPTB, for example, like our study (Table 6) Yang et al. show that LTA4H gene polymorphism rs1978331 and rs2540474, are only risk factor with EPTB and not PTB in Han Chinese population [42]. Similarly, a GWAS could identify 4 loci that were only associated with EPTB and not PTB [21]. These studies support the differential nature of genetic polymorphism in EPTB, which is distinct from PTB. Similar studies are warranted for validation in a larger sample size and in multiple populations to test whether genetic polymorphism can associate with various forms of tuberculosis. The limitation of the study is that for certain polymorphisms we could not achieve a good sample size and thus the results need to be validated in a larger sample size.

5. Conclusions

Our study contributes to the growing knowledge that PTB and EPTB manifestations have a genetic basis. The highlight of our study was finding more polymorphic cytokine genes in PTB and more polymorphic apoptosis/innate genes in LNTB.

Supplementary Materials

The following supporting information can be downloaded at: https://zenodo.org/record/7514176#.Y7sKTOzMLz0, Figure S1A–O: Representative ARMS-PCR gel images for the typed variants. Table S1: Concordance ARMS-PCR and Sequenom Genotyping for IL12 at rs3212220. Table S2a: List of 39 Cytokine SNPS for the discovery Panel. Table S2b: List of 15 Cytokine SNPS for the Validation Panel. Table S3: Allelic association for the Discovery Panel. Table S4a: Validation results of the Discovery Panel. Table S4b: Haplotypic association following the heterozygosity model for LTA4H polymorphisms. Table S5: Comparative allelic association among PTB and LNTB for TLR8 gene.

Author Contributions

Conceptualization, A. and M.B.; methodology, A. and M.B.; software, A.; formal analysis, A.; investigation, A. and A.G.; resources, M.B. and M.V.-B.; data curation, A.; writing—original draft preparation, A.; writing—review and editing, A., M.B. and M.V.-B.; visualization, A.; supervision, M.B. and M.V.-B.; funding acquisition, M.B. All authors have read and agreed to the published version of the manuscript.

Funding

This research was funded by Council for Scientific and Industrial Research; Government of India funded the Research and Fellowship for Abhimanyu via Grant Number: 60(0081 EMR-II. The research was also supported by Indian council of medical research (ICMR) grant No. 5/8/5/14/2012-ECD-1 for the work on SP110 and a Senior Research fellowship to Abhimanyu. The authors also acknowledge an Emeritus Professor Fellowship to Mridula Bose from ICMR.

Institutional Review Board Statement

The study was conducted in accordance with the Declaration of Helsinki and approved by the Institutional Review Board of V P Chest Institute, University of Delhi, Delhi, India, with ethical approval granted for project no: 60(0081)/07/EMR-II.

Informed Consent Statement

Informed written consent was obtained from all subjects involved in the study.

Data Availability Statement

Data for the study has been summarized in multiple tables for the study. If needed, the data can be obtained from the first and corresponding authors upon reasonable request.

Acknowledgments

The authors would like to acknowledge the help of Shyama Jain of Lok Nayak TB hospital, Nilang Tale, J N Banavaliker of Rajan Babu Institute of pulmonary medicine for facilitating study enrolment. Contribution of Ashima Jain is acknowledged for enrolment of LNTB cases. We would like to acknowledge Pankaj Jha and the Indian Genome Variation consortium for making genotype data for additional controls available for the validation cohort analyses.

Conflicts of Interest

The authors declare no conflict of interest. The funders had no role in study design, data collection and analysis, decision to publish, or preparation of the manuscript. Some of the results were submitted to the funders as a part of the final project report. This work was part of doctoral thesis of Dr. Abhimanyu, Th 19865, University of Delhi. This work has been presented as poster at the Indian Society for Human Genetics conference by Dr Abhimanyu and at the Indian association of medical microbiologist meeting by Astha Giri.

References

  1. World Health Organization. Global Tuberculosis Report 2017; World Health Organization: Geneva, Switzerland, 2017. [Google Scholar]
  2. Sharma, S.K.; Mohan, A. Extrapulmonary tuberculosis. Indian J. Med. Res. 2004, 120, 316–353. [Google Scholar] [PubMed]
  3. Polesky, A.; Grove, W.; Bhatia, G. Peripheral tuberculous lymphadenitis: Epidemiology, diagnosis, treatment, and outcome. Medicine 2005, 84, 350–362. [Google Scholar] [CrossRef] [PubMed]
  4. Garcia de Viedma, D.L.G.; Cardona, P.J.; Rodriguez, N.A.; Gordillo, S.; Serrano, M.J.; Bouza, E. Association between the infectivity of Mycobacterium tuberculosis strains and their efficiency for extrarespiratory infection. J. Infect. Dis. 2005, 12, 2059–2065. [Google Scholar] [CrossRef] [Green Version]
  5. Lee, J.; Yun, Y.J.; Kqueen, C.Y.; Lee, J.H.; Kim, H.Y.; Kim, Y.R.; Kook, Y.H.; Lee, K.H. pncA Mutations in the Specimens from Extrapulmonary Tuberculosis. Tuberc. Respir. Dis. (Seoul) 2012, 72, 475–480. [Google Scholar] [CrossRef] [PubMed] [Green Version]
  6. Yang, Z.; Yang, D.; Kong, Y.; Zhang, L.; Marrs, C.F.; Foxman, B.; Bates, J.H.; Wilson, F.; Cave, M.D. Clinical Relevance ofMycobacterium tuberculosis plcDGene Mutations. Am. J. Respir. Crit. Care Med. 2005, 171, 1436–1442. [Google Scholar] [CrossRef] [Green Version]
  7. Varma-Basill, M.; Nair, D. Molecular epidemiology of tuberculosis: Opportunities & challenges in disease control. Indian J. Med. Res. 2017, 146, 11–14. [Google Scholar] [CrossRef]
  8. Ruesen, C.; Chaidir, L.; van Laarhoven, A.; Dian, S.; Ganiem, A.R.; Nebenzahl-Guimaraes, H.; Huynen, M.A.; Alisjahbana, B.; Dutilh, B.E.; van Crevel, R. Large-scale genomic analysis shows association between homoplastic genetic variation in Mycobacterium tuberculosis genes and meningeal or pulmonary tuberculosis. BMC Genom. 2018, 19, 122. [Google Scholar] [CrossRef] [Green Version]
  9. Caws, M.; Thwaites, G.; Dunstan, S.; Hawn, T.R.; Lan, N.T.; Thuong, N.T.; Stepniewska, K.; Huyen, M.N.; Bang, N.D.; Loc, T.H.; et al. The influence of host and bacterial genotype on the development of disseminated disease with Mycobacterium tuberculosis. PLoS Pathog. 2008, 4, e1000034. [Google Scholar] [CrossRef] [Green Version]
  10. Coussens, A.K.; Wilkinson, R.J.; Nikolayevskyy, V.; Elkington, P.T.; Hanifa, Y.; Islam, K.; Timms, P.M.; Bothamley, G.H.; Claxton, A.P.; Packe, G.E.; et al. Ethnic variation in inflammatory profile in tuberculosis. PLoS Pathog. 2013, 9, e1003468. [Google Scholar] [CrossRef] [Green Version]
  11. Thuong, N.T.; Hawn, T.R.; Thwaites, G.E.; Chau, T.T.; Lan, N.T.; Quy, H.T.; Hieu, N.T.; Aderem, A.; Hien, T.T.; Farrar, J.J.; et al. A polymorphism in human TLR2 is associated with increased susceptibility to tuberculous meningitis. Genes Immun. 2007, 8, 422–428. [Google Scholar] [CrossRef]
  12. Tobin, D.M.; Vary, J.C., Jr.; Ray, J.P.; Walsh, G.S.; Dunstan, S.J.; Bang, N.D.; Hagge, D.A.; Khadge, S.; King, M.C.; Hawn, T.R.; et al. The lta4h locus modulates susceptibility to mycobacterial infection in zebrafish and humans. Cell 2010, 140, 717–730. [Google Scholar] [CrossRef] [PubMed] [Green Version]
  13. Hasan, Z.; Jamil, B.; Khan, J.; Ali, R.; Khan, M.A.; Nasir, N.; Yusuf, M.S.; Jamil, S.; Irfan, M.; Hussain, R. Relationship between circulating levels of IFN-gamma, IL-10, CXCL9 and CCL2 in pulmonary and extrapulmonary tuberculosis is dependent on disease severity. Scand. J. Immunol. 2009, 69, 259–267. [Google Scholar] [CrossRef] [PubMed]
  14. Wilkinson, R.J.; Llewelyn, M.; Toossi, Z.; Patel, P.; Pasvol, G.; Lalvani, A.; Wright, D.; Latif, M.; Davidson, R.N. Influence of vitamin D deficiency and vitamin D receptor polymorphisms on tuberculosis among Gujarati Asians in west London: A case-control study. Lancet 2000, 355, 618–621. [Google Scholar] [CrossRef] [PubMed]
  15. Motsinger-Reif, A.A.; Antas, P.R.; Oki, N.O.; Levy, S.; Holland, S.M.; Sterling, T.R. Polymorphisms in IL-1beta, vitamin D receptor Fok1, and Toll-like receptor 2 are associated with extrapulmonary tuberculosis. BMC Med. Genet. 2010, 11, 37. [Google Scholar] [CrossRef] [Green Version]
  16. Fernando, S.L.; Saunders, B.M.; Sluyter, R.; Skarratt, K.K.; Goldberg, H.; Marks, G.B.; Wiley, J.S.; Britton, W.J. A Polymorphism in the P2X7Gene Increases Susceptibility to Extrapulmonary Tuberculosis. Am. J. Respir. Crit. Care Med. 2007, 175, 360–366. [Google Scholar] [CrossRef]
  17. Shandera, W.; Webster, A. The extrapulmonary dissemination of tuberculosis: A meta-analysis. Int. J. Mycobacteriol. 2014, 3, 9–16. [Google Scholar] [CrossRef] [PubMed] [Green Version]
  18. Tailleux, L.; Fox, G.J.; Sy, D.N.; Nhung, N.V.; Yu, B.; Ellis, M.K.; Van Hung, N.; Cuong, N.K.; Thi Lien, L.; Marks, G.B.; et al. Polymorphisms of SP110 Are Associated with both Pulmonary and Extra-Pulmonary Tuberculosis among the Vietnamese. PLoS ONE 2014, 9, e99496. [Google Scholar] [CrossRef]
  19. Abhimanyu; Jha, P.; Jain, A.; Arora, K.; Bose, M. Genetic association study suggests a role for SP110 variants in lymph node tuberculosis but not pulmonary tuberculosis in north Indians. Hum. Immunol. 2011, 72, 576–580. [Google Scholar] [CrossRef]
  20. Wilkinson, R.J.; Patel, P.; Llewelyn, M.; Hirsch, C.S.; Pasvol, G.; Snounou, G.; Davidson, R.N.; Toossi, Z. Influence of polymorphism in the genes for the interleukin (IL)-1 receptor antagonist and IL-1beta on tuberculosis. J. Exp. Med. 1999, 189, 1863–1874. [Google Scholar] [CrossRef] [Green Version]
  21. Oki, N.O.; Motsinger-Reif, A.A.; Antas, P.R.; Levy, S.; Holland, S.M.; Sterling, T.R. Novel human genetic variants associated with extrapulmonary tuberculosis: A pilot genome wide association study. BMC Res. Notes 2011, 4, 28. [Google Scholar] [CrossRef]
  22. Möller, M.; Hoal, E.G. Current findings, challenges and novel approaches in human genetic susceptibility to tuberculosis. Tuberculosis 2010, 90, 71–83. [Google Scholar] [CrossRef]
  23. Wu, Y.; Guo, Z.; Liu, F.; Yao, K.; Gao, M.; Luo, Y.; Zhang, Y. Sp110 enhances macrophage resistance to Mycobacterium tuberculosis via inducing endoplasmic reticulum stress and inhibiting anti-apoptotic factors. Oncotarget 2017, 8, 64050–64065. [Google Scholar] [CrossRef] [Green Version]
  24. Wiley, J.S.; Sluyter, R.; Gu, B.J.; Stokes, L.; Fuller, S.J. The human P2X7 receptor and its role in innate immunity. Tissue Antigens 2011, 78, 321–332. [Google Scholar] [CrossRef]
  25. Indian Genome Variation, C. The Indian Genome Variation database (IGVdb): A project overview. Hum. Genet. 2005, 118, 1–11. [Google Scholar] [CrossRef] [PubMed]
  26. Abhimanyu; Bose, M.; Jha, P.; Indian Genome Variation Consortium. Footprints of genetic susceptibility to pulmonary tuberculosis: Cytokine gene variants in north Indians. Indian J. Med. Res. 2012, 135, 763–770. [Google Scholar]
  27. Ye, S.; Dhillon, S.; Ke, X.; Collins, A.R.; Day, I.N. An efficient procedure for genotyping single nucleotide polymorphisms. Nucleic Acids Res. 2001, 29, e88. [Google Scholar] [CrossRef] [Green Version]
  28. Gabriel, S.B.; Schaffner, S.F.; Nguyen, H.; Moore, J.M.; Roy, J.; Blumenstiel, B.; Higgins, J.; DeFelice, M.; Lochner, A.; Faggart, M.; et al. The structure of haplotype blocks in the human genome. Science 2002, 296, 2225–2229. [Google Scholar] [CrossRef] [PubMed] [Green Version]
  29. Bakir-Gungor, B.; Egemen, E.; Sezerman, O.U. PANOGA: A web server for identification of SNP-targeted pathways from genome-wide association study data. Bioinformatics 2014, 30, 1287–1289. [Google Scholar] [CrossRef] [PubMed] [Green Version]
  30. Bakir-Gungor, B.; Sezerman, O.U. Identification of SNP Targeted Pathways from Genome-Wide Association Study (GWAS) Data. Protoc. Exch. 2012. [Google Scholar] [CrossRef]
  31. Shannon, P.; Markiel, A.; Ozier, O.; Baliga, N.S.; Wang, J.T.; Ramage, D.; Amin, N.; Schwikowski, B.; Ideker, T. Cytoscape: A software environment for integrated models of biomolecular interaction networks. Genome Res. 2003, 13, 2498–2504. [Google Scholar] [CrossRef]
  32. Ideker, T.; Ozier, O.; Schwikowski, B.; Siegel, A.F. Discovering regulatory and signalling circuits in molecular interaction networks. Bioinformatics 2002, 18 (Suppl. S1), S233–S240. [Google Scholar] [CrossRef] [PubMed]
  33. Bindea, G.; Mlecnik, B.; Hackl, H.; Charoentong, P.; Tosolini, M.; Kirilovsky, A.; Fridman, W.H.; Pages, F.; Trajanoski, Z.; Galon, J. ClueGO: A Cytoscape plug-in to decipher functionally grouped gene ontology and pathway annotation networks. Bioinformatics 2009, 25, 1091–1093. [Google Scholar] [CrossRef] [PubMed] [Green Version]
  34. Martens, M.; Ammar, A.; Riutta, A.; Waagmeester, A.; Slenter, D.N.; Hanspers, K.; R, A.M.; Digles, D.; Lopes, E.N.; Ehrhart, F.; et al. WikiPathways: Connecting communities. Nucleic Acids Res. 2021, 49, D613–D621. [Google Scholar] [CrossRef]
  35. Abhimanyu; Bose, M. Reporting genetic association studies: The roadblocks and guiding rules for robust results. Lung 2012, 190, 587–588, author reply 588. [Google Scholar] [CrossRef] [PubMed]
  36. Dupont, W.; Plummer, W.J. PS: Power and Sample Size Calculation. Available online: http://biostat.mc.vanderbilt.edu/wiki/Main/PowerSampleSize (accessed on 23 March 2017).
  37. Abhimanyu; Mangangcha, I.R.; Jha, P.; Arora, K.; Mukerji, M.; Banavaliker, J.N.; Indian Genome Variation, C.; Brahmachari, V.; Bose, M. Differential serum cytokine levels are associated with cytokine gene polymorphisms in north Indians with active pulmonary tuberculosis. Infect. Genet. Evol. 2011, 11, 1015–1022. [Google Scholar] [CrossRef]
  38. Brites, D.; Gagneux, S. Co-evolution of Mycobacterium tuberculosis and Homo sapiens. Immunol. Rev. 2015, 264, 6–24. [Google Scholar] [CrossRef]
  39. Yim, J.J.; Selvaraj, P. Genetic susceptibility in tuberculosis. Respirology 2010, 15, 241–256. [Google Scholar] [CrossRef]
  40. Souza De Lima, D.; Bomfim, C.C.B.; Leal, V.N.C.; Reis, E.C.; Soares, J.L.S.; Fernandes, F.P.; Amaral, E.P.; Loures, F.V.; Ogusku, M.M.; Lima, M.R.D.; et al. Combining Host Genetics and Functional Analysis to Depict Inflammasome Contribution in Tuberculosis Susceptibility and Outcome in Endemic Areas. Front. Immunol. 2020, 11, 550624. [Google Scholar] [CrossRef]
  41. Abhimanyu; Bose, M.; Komal; Varma-Basil, M. Lack of association between IL17A and IL17F polymorphisms and related serum levels in north Indians with tuberculosis. Gene 2013, 529, 195–198. [Google Scholar] [CrossRef]
  42. Yang, J.; Chen, J.; Yue, J.; Liu, L.; Han, M.; Wang, H. Relationship between human LTA4H polymorphisms and extra-pulmonary tuberculosis in an ethnic Han Chinese population in Eastern China. Tuberculosis 2014, 94, 657–663. [Google Scholar] [CrossRef]
  43. Tobin, D.M.; Roca, F.J.; Oh, S.F.; McFarland, R.; Vickery, T.W.; Ray, J.P.; Ko, D.C.; Zou, Y.; Bang, N.D.; Chau, T.T.; et al. Host genotype-specific therapies can optimize the inflammatory response to mycobacterial infections. Cell 2012, 148, 434–446. [Google Scholar] [CrossRef]
  44. Yu, Z.Q.; Wang, W.F.; Zhu, C.Z.; Zhang, K.H.; Chen, X.C.; Chen, J.Y. The Polymorphism rs17525495 of LTA4H Is Associated with Susceptibility of Crohn’s Disease instead of Intestinal Tuberculosis in a Chinese Han Population. Biomed Res. Int. 2019, 2019, 9537050. [Google Scholar] [CrossRef] [Green Version]
  45. Joshi, L.; Ponnana, M.; Sivangala, R.; Chelluri, L.K.; Nallari, P.; Penmetsa, S.; Valluri, V.; Gaddam, S. Evaluation of TNF-alpha, IL-10 and IL-6 Cytokine Production and Their Correlation with Genotype Variants amongst Tuberculosis Patients and Their Household Contacts. PLoS ONE 2015, 10, e0137727. [Google Scholar] [CrossRef] [Green Version]
  46. Peresi, E.; Oliveira, L.R.; da Silva, W.L.; da Costa, E.A.; Araujo, J.P., Jr.; Ayres, J.A.; Fortes, M.R.; Graviss, E.A.; Pereira, A.C.; Calvi, S.A. Cytokine Polymorphisms, Their Influence and Levels in Brazilian Patients with Pulmonary Tuberculosis during Antituberculosis Treatment. Tuberc. Res. Treat. 2013, 2013, 285094. [Google Scholar] [CrossRef] [Green Version]
  47. Singh, A.K.; Yadav, A.B.; Garg, R.; Misra, A. Single nucleotide polymorphic macrophage cytokine regulation by Mycobacterium tuberculosis and drug treatment. Pharmacogenomics 2014, 15, 497–508. [Google Scholar] [CrossRef]
  48. Soare, A.Y.; Freeman, T.L.; Min, A.K.; Malik, H.S.; Osota, E.O.; Swartz, T.H. P2RX7 at the Host-Pathogen Interface of Infectious Diseases. Microbiol. Mol. Biol. Rev. 2021, 85, e00055-20. [Google Scholar] [CrossRef] [PubMed]
  49. Lugo-Villarino, G.; Troegeler, A.; Balboa, L.; Lastrucci, C.; Duval, C.; Mercier, I.; Benard, A.; Capilla, F.; Al Saati, T.; Poincloux, R.; et al. The C-Type Lectin Receptor DC-SIGN Has an Anti-Inflammatory Role in Human M(IL-4) Macrophages in Response to Mycobacterium tuberculosis. Front. Immunol. 2018, 9, 1123. [Google Scholar] [CrossRef] [PubMed] [Green Version]
  50. Tailleux, L.; Pham-Thi, N.; Bergeron-Lafaurie, A.; Herrmann, J.L.; Charles, P.; Schwartz, O.; Scheinmann, P.; Lagrange, P.H.; de Blic, J.; Tazi, A.; et al. DC-SIGN induction in alveolar macrophages defines privileged target host cells for mycobacteria in patients with tuberculosis. PLoS Med. 2005, 2, e381. [Google Scholar] [CrossRef] [PubMed] [Green Version]
  51. Tailleux, L.; Schwartz, O.; Herrmann, J.L.; Pivert, E.; Jackson, M.; Amara, A.; Legres, L.; Dreher, D.; Nicod, L.P.; Gluckman, J.C.; et al. DC-SIGN is the major Mycobacterium tuberculosis receptor on human dendritic cells. J. Exp. Med. 2003, 197, 121–127. [Google Scholar] [CrossRef] [PubMed] [Green Version]
  52. Wang, J.J.; Xia, X.; Tang, S.D.; Wang, J.; Deng, X.Z.; Zhang, Y.; Yue, M. Meta-analysis on the associations of TLR2 gene polymorphisms with pulmonary tuberculosis susceptibility among Asian populations. PLoS ONE 2013, 8, e75090. [Google Scholar] [CrossRef]
  53. Varshney, D.; Singh, S.; Sinha, E.; Mohanty, K.K.; Kumar, S.; Kumar Barik, S.; Patil, S.A.; Katara, P. Systematic review and meta-analysis of human Toll-like receptors genetic polymorphisms for susceptibility to tuberculosis infection. Cytokine 2022, 152, 155791. [Google Scholar] [CrossRef] [PubMed]
  54. Zhou, Y.; Zhang, M. Associations between genetic polymorphisms of TLRs and susceptibility to tuberculosis: A meta-analysis. Innate Immun. 2020, 26, 75–83. [Google Scholar] [CrossRef] [PubMed]
  55. Davila, S.; Hibberd, M.L.; Hari Dass, R.; Wong, H.E.; Sahiratmadja, E.; Bonnard, C.; Alisjahbana, B.; Szeszko, J.S.; Balabanova, Y.; Drobniewski, F.; et al. Genetic association and expression studies indicate a role of toll-like receptor 8 in pulmonary tuberculosis. PLoS Genet. 2008, 4, e1000218. [Google Scholar] [CrossRef] [PubMed]
Figure 1. The study groups show homogeneity forming a tight cluster showing no stratification in the samples. Figure depicts a three-dimensional plot for checking population stratification among the study groups i.e., PTB (green spheres), LNTB (Purple Spheres) and HC (green Spheres). Raw Hamming distances as multidimensional scaling (MDS) co-ordinates are plotted on X, Y and Z-axes, to visualize genetic distance between the study groups.
Genes 14 00207 g001
Figure 2. Cytokine levels have limited correlation with genotypes in LNTB. (A) Increased cytokine levels in LNTB (n = 50, red) vs HC (n = 84, Blue). The groups were compared using a multiple Mann-Whitney test. ***** p < 0.00001, *** p < 0.001, ** p < 0.01, * p < 0.05, (B) Heatmap of overall ANOVA p-Values of 34 SNPs in the cytokine genes with the corresponding cytokine levels. Shades of Red depict non-significant p-values and shades of blue significant p-value. Only significant variant, IL18 at rs3882891 is shown with the genotypes with their respective levels, where AA genotype individuals are highest IL18 producers and compared to CA and CC (p < 0.05) genotypes.
Genes 14 00207 g002
Figure 3. PTB and LNTB risk associated SNP related genes enrich in different pathways. Pathways enriched in PTB (A) and LNTB (B) through a pathway analysis based on the SNPs with significant p-values. The modules obtained from JActivemodules were used for enrichment in ClueGO App in Cytoscape. Two metrics, %Associated genes (proportion of genes in the pathway from the network of all genes) and Term p-value (enrichment p-value) is plotted here to show the abundance of the pathway with all the input genes and the p-value for the GO term obtained from WikiPathways.
Genes 14 00207 g003
Table 1. Comparative allelic association statistics of cytokine variants in the discovery group between PTB and LNTB.
GeneSNP (rsID)Risk AlleleCase, Control FrequenciesOdds Ratio (CI) p-Value
PTB
(n = 110)
LNTB
(n = 35)
Combined
(n = 145)
PTBLNTBCombinedPTBLNTBCombined
TNFBrs746868C/C/C0.650, 0.5430.589, 0.5430.637, 0.5431.6 (1.0–2.4)NANA0.04420.55450.0647
IL10rs1878672C/G/C0.937, 0.8120.250, 0.1880.894, 0.8123.4 (1.6–7.2)NA2.0 (1.1–3.6)0.00070.34870.0271
IL1Brs1143643G/A/G0.935, 0.8170.286, 0.1830.887, 0.8173.2 (1.6–6.6)NANA0.0010.11740.0635
IL1RArs419598C/T/C0.418, 0.2640.796, 0.7360.369, 0.2642 (1.2–3.4)NANA0.00790.4010.054
IL6rs1548216G/C/C0.985, 0.9780.089, 0.0220.031, 0.022NA4.4 (1.0–19)NA0.64470.0320.5846
Significant p-Values and borderline p-Values are shown in bold.Significant odds ratio is indicated in bold. rsID: dbSNP, the SNP database (http://www.ncbi.nlm.nih.gov/projects/SNP accessed on 3 November 2022); Abbreviations: CI: Confidence Interval, NA: The odds ratio were not calculated as the p-Value was not significant.
Table 2. Comparative Haplotypic association statistics of cytokine variants in the discovery group between PTB and LNTB.
GeneBlockHaplotypeCase, Control Frequenciesp-Value
PTBLNTBCombinedPTBLNTBCombinedPTBLNTBCombined
IL18Block 1
TG0.9070.8840.9050.926, 0.8800.893, 0.8800.919, 0.8800.1530.80360.211
CC0.0930.1160.0950.074, 0.1200.107, 0.1200.081, 0.1200.1530.80360.211
TNFBBlock 2
GC/GCC0.6090.2810.6010.650, 0.5490.313, 0.2680.629, 0.5480.05680.53050.1146
TG/GTC0.3830.2690.3870.343, 0.4410.241, 0.2800.358, 0.4420.06370.57360.098
TTC 0.011 0.036, 0.001 0.0303
TTG 0.433 0.411, 0.442 0.6911
Multiallelic haplotype blocks are depicted. Block 1 consisted of rs5744256, rs1834481 for IL18 gene; For TNFB gene in Block 2 the variants consist of rs2239704, rs746868 for PTB and Combined group and rs2239704, rs909253 and rs746868 for LNTB. The rsIDs listed are in the same order as they appear in the haplotype blocks. Biallelic combination of haplotype showed two combinations for PTB and Combined and four combinations for LNTB. Significant p-Values are indicated in bold. a Odds Ratio (95% CI) = 4.4 (1.0–19).
Table 3. Comparative allelic association of the cytokine gene variants in the validation panel between PTB and LNTB.
GeneSNP (rsID)Risk AlleleCase, Control FrequenciesOdds Ratio (CI) p-ValueP-Bonferroni
PTBLNTBCombinedPTBLNTBCombinedPTBLNTBCombinedPTBLNTBCombined
IFNGrs1861493A0.935, 0.8580.148, 0.1420.912, 0.8582.4
(1.3
–4.2)
1.1
(0.62–1.8)
1.7
(1.1–2.7)
0.0020.8530.01970.01310.138
IL1RArs4252019C0.974, 0.9340.090, 0.0660.962, 0.9342.6
(1.1–6.0)
1.4
(0.72–2.7)
1.8
(0.93–3.4)
0.0180.3140.0780.15910.71
IL4rs2070874T0.306, 0.2390.847, 0.7610.280, 0.2391.4
(1.0–2.0)
1.7
(1.1–2.9)
1.2
(0.90–1.7)
0.0480.0270.1940.3030.24361
IL12rs2853694A0.624, 0.5080.620, 0.5080.608, 0.5081.6
(1.2–2.2)
1.6
(1.1–2.3)
1.5
(1.1–2.0)
0.0020.0180.0040.0170.16240.032
rs3212220T0.409, 0.2970.355, 0.2970.394, 0.2971.6
(1.2–2.2)
1.3
(0.8–1.9)
1.5
(1.2–2.1)
0.0020.1860.0030.01710.031
Abbreviations: SNP: single nucleotide polymorphism; rsID: dbSNP, the SNP database (http://www.ncbi.nlm.nih.gov/projects/SNP accessed on 3 November 2022); Two tailed p < 0.05 was considered significant. Significant p-Values and odds ratios are indicated in bold CI: Confidence Interval; p-value is derived from a chi-square test; P-Bonferroni: p-value after applying Bonferroni correction for multiple testing. For the validation the sample size PTB (n = 160), LNTB (n = 50), HC (n = 265).
Table 4. Comparison of Epistatic interactions in cytokine genes between PTB and LNTB.
CHR1GeneSNP1CHR2GeneSNP2 OR_INTSTATp-ValueTB Form
2 IL1RArs17940682IL1RArs32134480.0783421.473.60 × 10−6PTB
2 IL1RArs17940682IL1RArs31810520.0875922.681.92 × 10−6PTB
2 IL1RArs17940685IL12rs32131190.0432824.76.69 × 10−7PTB
2 IL1RArs17940685IL12rs32130960.0643525.684.03 × 10−7PTB
2 IL1RArs17940686TNFBrs30935420.0569926.412.76 × 10−7PTB
2 IL1RArs3159512IL1RArs90058.26517.383.07 × 10−5PTB
2 IL1RArs3159515IL4rs22432660.102817.662.64 × 10−5PTB
2 IL1RArs3159515IL12rs32131190.00875331.272.25 × 10−8PTB
2 IL1RArs3159515IL12rs32130960.00769132.869.92 × 10−9PTB
2 IL1RArs3159516TNFBrs30935420.00826332.321.31 × 10−8PTB
5 IL4rs20708745IL12rs321311918.1829.854.66 × 10−8PTB
5 IL4rs20708745IL12rs321309618.3330.693.03 × 10−8PTB
5 IL4rs20708746TNFBrs309354218.8631.751.76 × 10−8PTB
5 IL4 *rs20708745IL12rs321309616.7137.648.52 × 10−10PTB
5 IL4 *rs20708745IL12rs7306905.05616.026.26 × 10−5PTB
5 IL4 *rs20708745IL4rs22432665.00723.611.18 × 10−6LNTB
Abbreviations: CHR1: Chromosome of 1st SNP, SNP1: Identifier of 1st SNP; CHR2: Chromosome of 2nd SNP, SNP2: Identifier of 2nd SNP; OR_INT: Odds ratio for interaction; STAT: Chi-square,1-df (degree of freedom); p-Value: Asymptomatic p-value, * the interaction for the validation panel.
Table 5. Comparative Allelic association between various innate gene polymorphisms between PTB and LNTB.
Genedb SNP rsID/Other NameGene LocationRisk AlleleCase, Control FrequenciesChi Squarep-ValueOdds Ratio
(CI)
PTBLNTBPTBLNTBPTBLNTBPTBLNTB
P2RX7rs2393799/−762T/CExon C0.707, 0.6110.917, 0.6113.89219.230.0481.15 × 10−51.5 (1–2.4)7 (2.6–18.4)
rs3751143/1513 A/CExon C0.574, 0.5250.574, 0.5250.8160.0790.36640.77911.2 (0.79–1.7)1.1 (0.5–2.2)
VDRrs2228570/FokIExon G0.505, 0.4720.552, 0.4720.4361.1510.50.288NDND
rs731236/TaqIExon C0.893, 0.8610.895, 0.5250.8490.2980.3570.5849NDND
rs1544410/BsmIExon Only GG Genotype observed
IRGMrs9637876/−261T/CAlu sequenceC0.306, 0.2550.272, 0.2551.531.20.21610.515NDND
TLR2rs6265786/Arg 299 TrpintronG1.000, 0.9580.979, 0.9589.530.4710.0020.492520.92 (1.2–369.3)2.1 (0.25–17.25)
TLR4rs498670/Asp 299 GlyIntronG0.223, 0.1250.05, 0.1256.092.6220.01350.10542.1 (1.2–2.5)0.11 (0.10–1.3)
NOS2Ars7215373IntronT0.481, 0.4050.514, 0.4002.7322.9140.09830.08781.3 (0.94–1.95)1.6 (0.94–2.65)
rs22748943’UTRT/G0.213, 0.1710.05, 0.1251.3480.450.24560.50221.3 (0.83–2.06)1.3 (0.63–2.6)
SLC11A1/NRAMP1rs3731865ExonOnly CC genotype observed
17235409IntronOnly AG genotype observed
SP110rs6436915IntronT0.421, 0.3470.417, 0.3502.7661.0380.09630.3082NDND
rs1346311IntronT0.105, 0.1040.959, 0.9000.0012.5160.97010.1127NDND
rs7580900IntronT0.531, 0.4730.554, 0.4721.6131.4710.2040.2252NDND
DCSIGN (CD209)rs4804803/−336 A/GPromoterA0.745, 0.3800.534, 0.38055.474.529.48 × 10−143.34 × 10−24.0 (2.6–6.0)1.9 (1.0–3.4)
SNP, single nucleotide polymorphism; Abbreviations: dbSNP, the SNP database (http://www.ncbi.nlm.nih.gov/projects/SNP accessed on 3 November 2022); Two tailed p < 0.05 was considered significant. p value from a chi-square test, significant p-Value and Odds Ratios are indicated in bold, CI: Confidence Interval.
Table 6. Allelic association for the LTA4H gene with and without the heterozygosity model.
SNPGroupsNGenotype FrequenciesAllele FrequenciesWithout Heterozygosity ModelHeterozygosity Model
(01 vs. 00 + 11)
00011101OR (CI )p-ValueOR (CI)p-ValuePadj
rs1978331All TB1850.260.440.300.480.521.02 (0.73–1.41)0.92090.55 (0.34–0.87)0.0130.039
T = 0, C = 1PTB1350.250.460.290.480.521 (0.70–1.43)0.97380.60 (0.36–0.99)0.0760.168
LNTB500.30.380.320.490.511.04 (0.65–1.66)0.85330.43 (0.22–0.85)0.0180.037
Control1200.180.590.230.470.52
rs2660898 TTTGGG
T = 0, G = 1All TB1850.170.410.420.380.631.21 (0.85–1.7)0.27610.76(0.48–1.2)0.2830.849
PTB1350.150.420.440.360.641.1 (0.76–1.61)0.58220.77(0.46–1.3)0.3090.927
LNTB500.220.40.360.430.571.5(0.93–2.44)0.0930.75(0.38–1.5)0.4961.488
Control1200.090.480.430.330.67
TTTCCC
rs17525495All TB1850.060.240.690.190.821.33(0.83–2.1)0.2380.95(0.53–1.7)0.88272.6481
T = 0, C = 1PTB1350.050.250.650.190.811.31(0.78–2.2)0.2981.1(0.60–2.1)0.7532.259
LNTB500.080.180.620.190.801.38(0.72–2.65)0.3290.82(0.35–1.9)0.8312.493
Control1200.030.240.730.150.85
Abbreviations: OR: Odds ratio for the minor allele are shown. CI: Confidence Interval; Padj: p-Values adjusted by Bonferroni correction for multiple tests. p-Value from a chi-square test. For each SNP, OR was calculated for heterozygosity (01) versus homozygosity (00 + 11) for cases versus controls. Significant p-Values are indicated in bold.
Table 7. Sex-specific associations for TLR8 gene variants in PTB.
db SNP rsIDRisk AlleleMales (Case = 75; Control = 70)Female (Case = 50; Control = 54)
Case, Control Frequenciesp-ValueP BonferroniOdds Ratio (CI)Case, Control Frequenciesp-ValueP BonferroniOdds Ratio (CI)
rs3788935A0.1102, 0.010.00720.028817 (0.94–300)0.160, 0.1060.16730.66921.6 (0.82–3.2)
rs3761624A0.2, 0.050.0120.0484.3 (1.2–16)0.356, 0.2440.04230.16921.7 (1.0–2.9)
rs3764880A0.107, 0.0290.10120.40483.9 (0.81–19)0.229, 0.1490.05570.22281.7 (0.98–2.9)
rs3764879C0.558, 0.4820.59342.37361.3 (0.61–2.6)0.489, 0.4400.39811.59241.2 (0.77–1.9)
Disclaimer/Publisher’s Note: The statements, opinions and data contained in all publications are solely those of the individual author(s) and contributor(s) and not of MDPI and/or the editor(s). MDPI and/or the editor(s) disclaim responsibility for any injury to people or property resulting from any ideas, methods, instructions or products referred to in the content.

