
A Missense Variant in CASKIN1’s Proline-Rich Region Segregates with Psychosis in a Three-Generation Family

 , , , , and
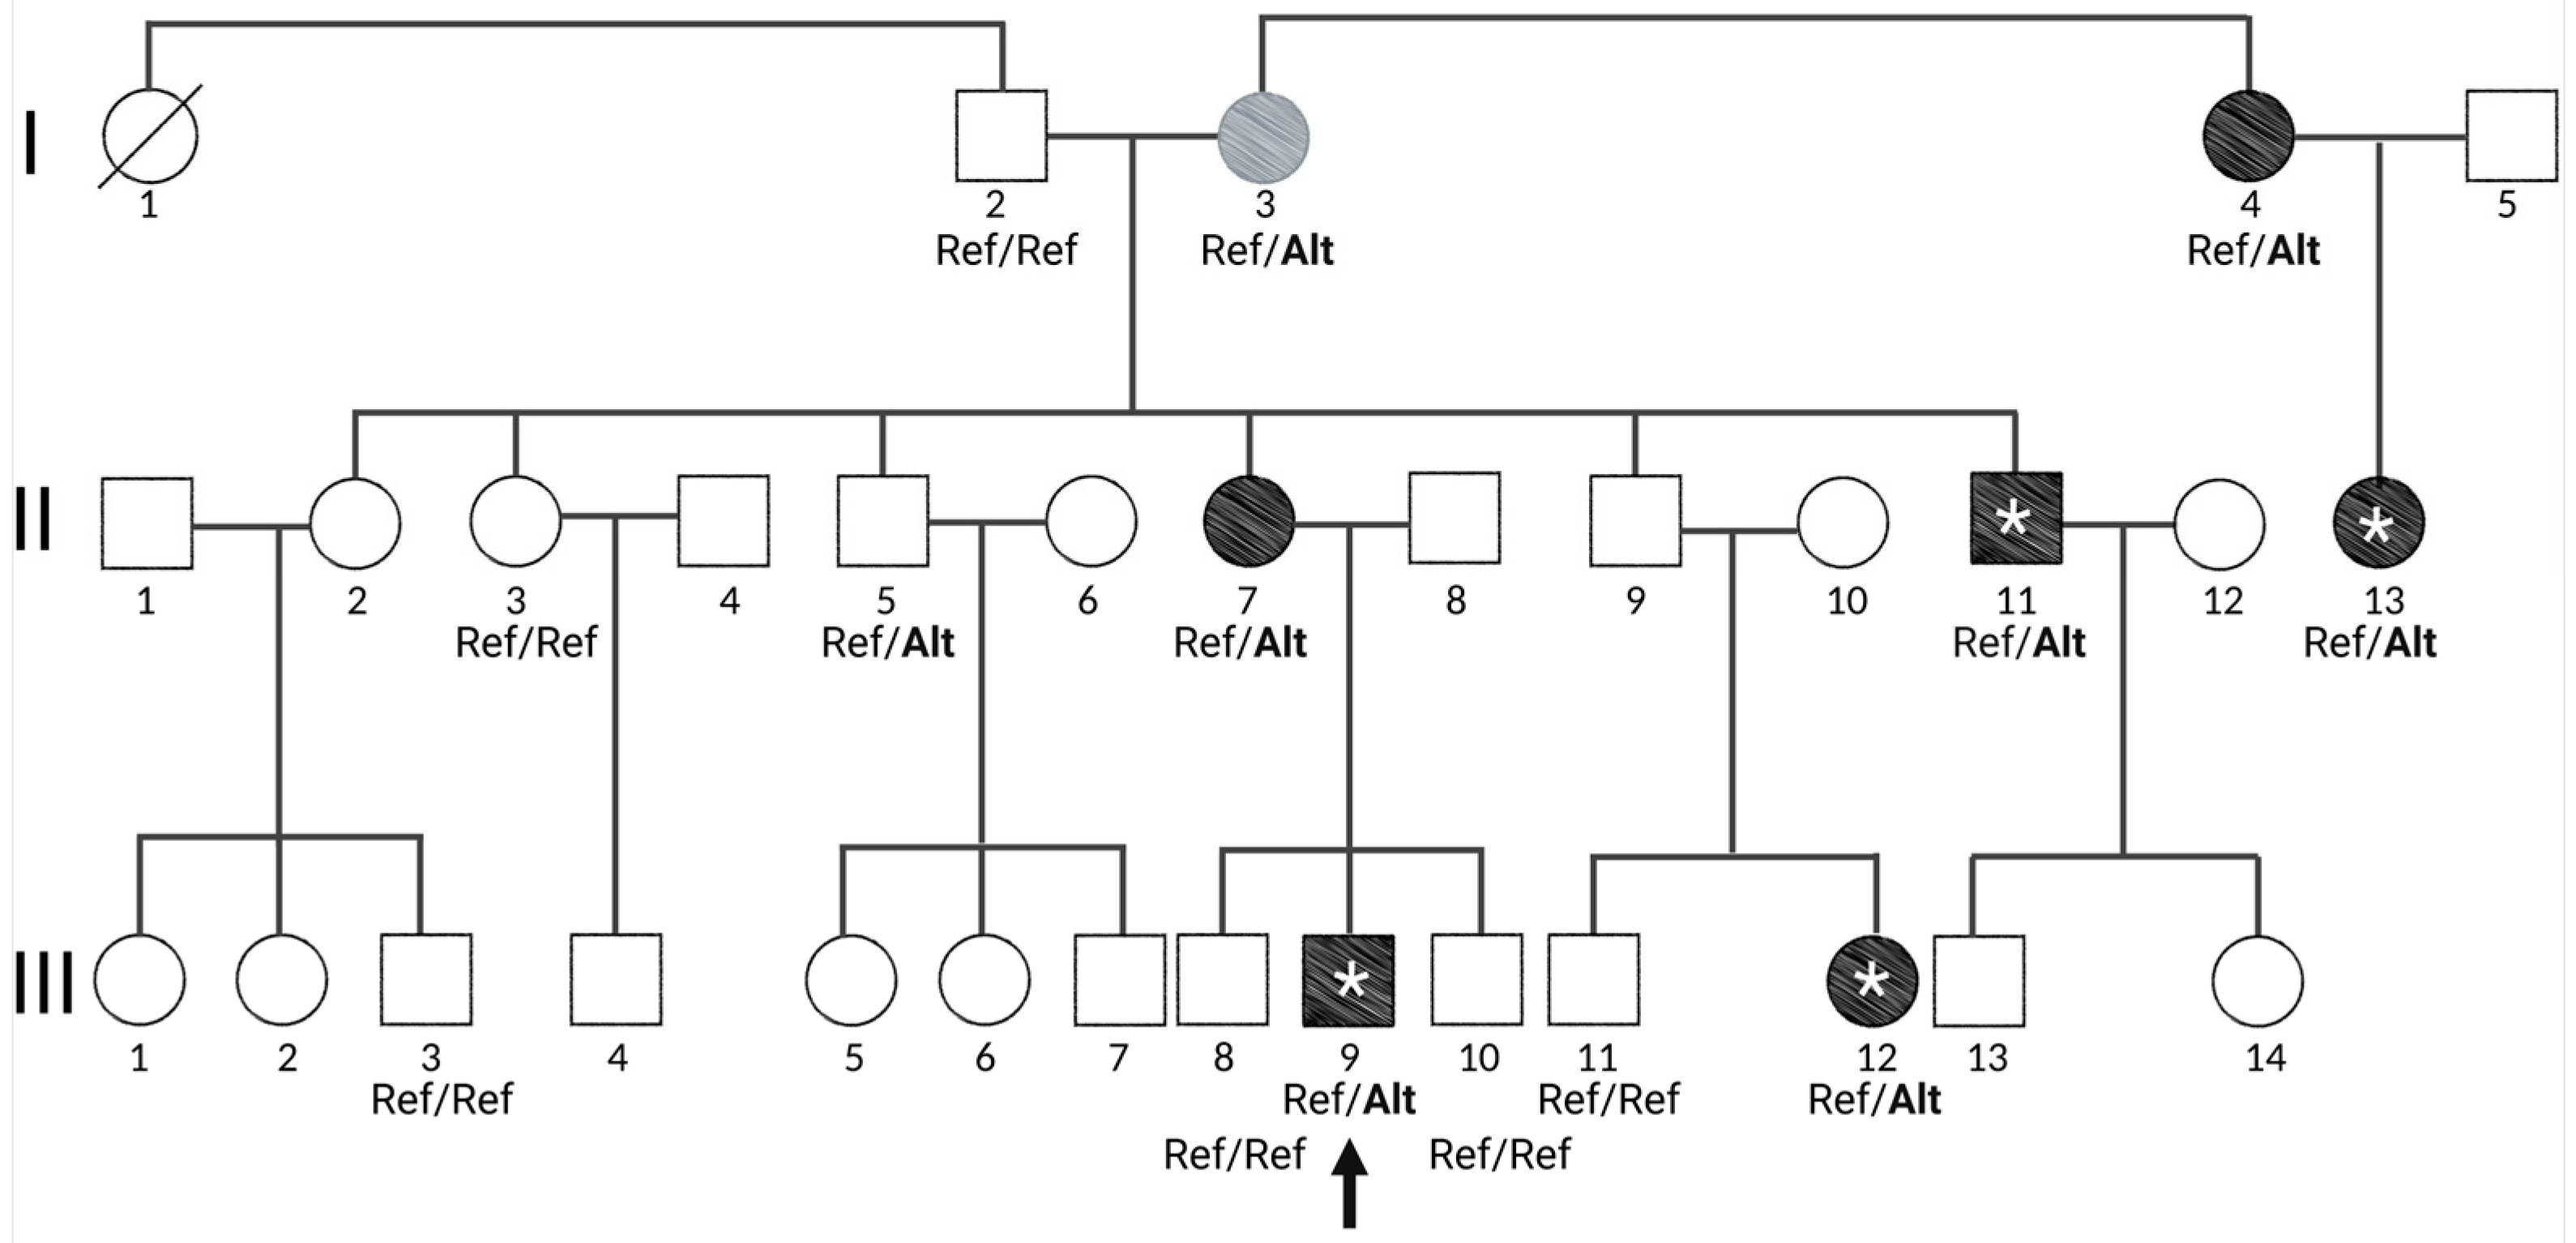
Abstract
1. Introduction
2. Materials and Methods
2.1. Subjects
2.2. Exome Sequencing
2.3. Variant Selection and Genotyping
2.4. Linkage Analysis
2.5. Genome-Wide Genotyping, Quality Control, and Authentication of iPSC Line
2.6. Polygenic Risk Score (PRS) Calculation
2.7. Cell Line Used for CRISPR Editing
2.8. Cell Culture
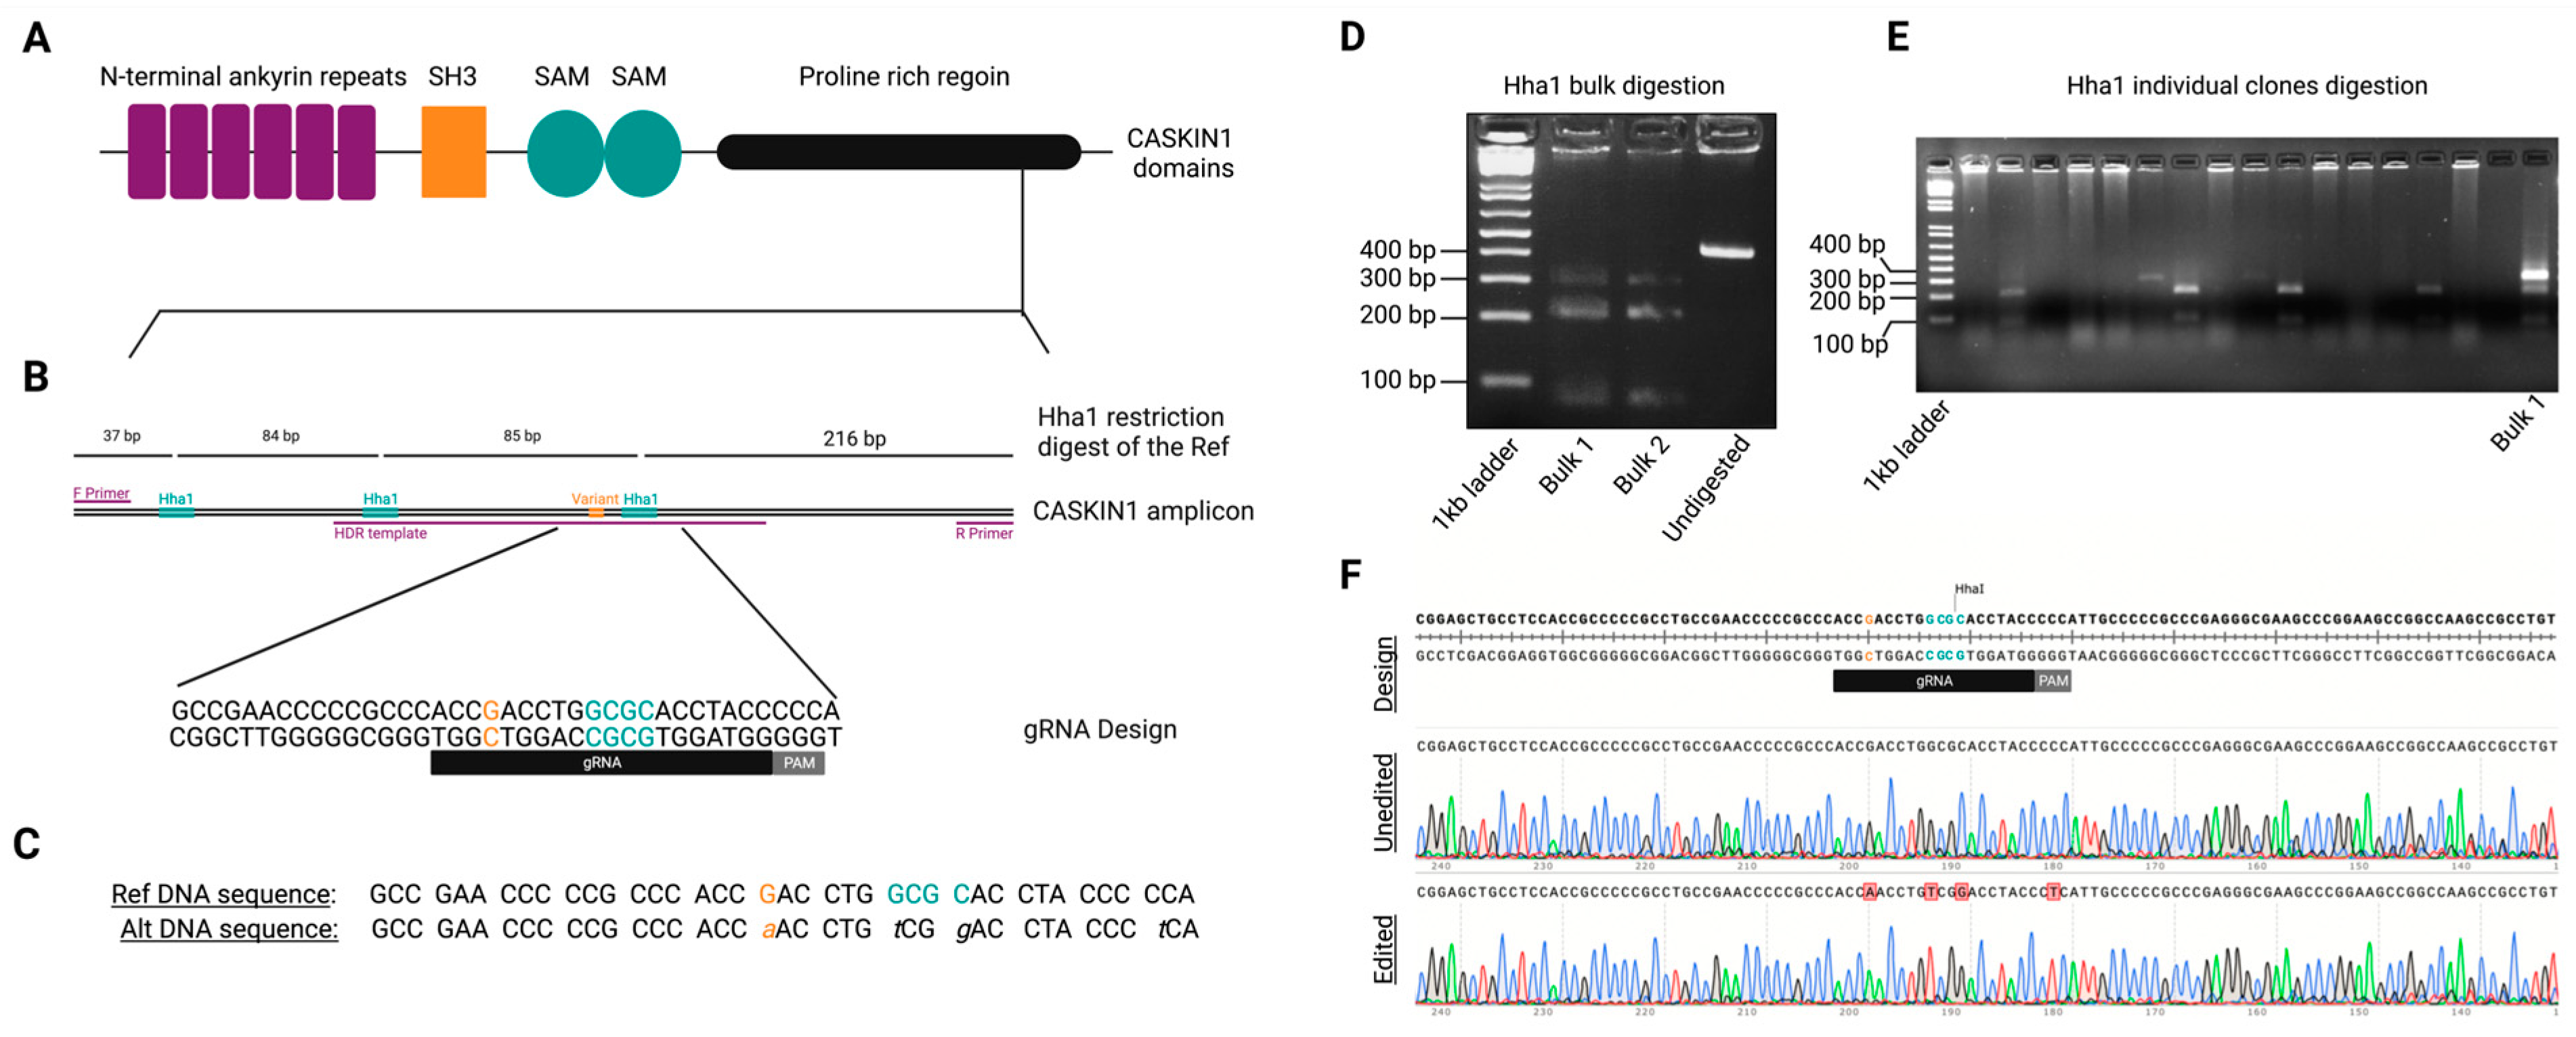
2.9. sgRNA and ssODN Design
2.10. Cloning
2.11. Transfection, Selection, and Screening
2.12. Off-Target Analysis
2.13. Differentiation into Glutamatergic Neurons
2.14. RNA Isolation, Sequencing, and Data Analysis
2.15. RNA-Seq Data Enrichment Analysis
2.16. Ca2+ Imaging
3. Results
3.1. A Large Family Segregating Psychosis in an Apparent Autosomal Dominant Fashion
3.2. Exome Sequencing Revealed Two Missense Variants in Genes Expressed in the Brain
3.3. Low SCZ PRS in Non-Penetrant Individuals for CASKIN1 D1204N
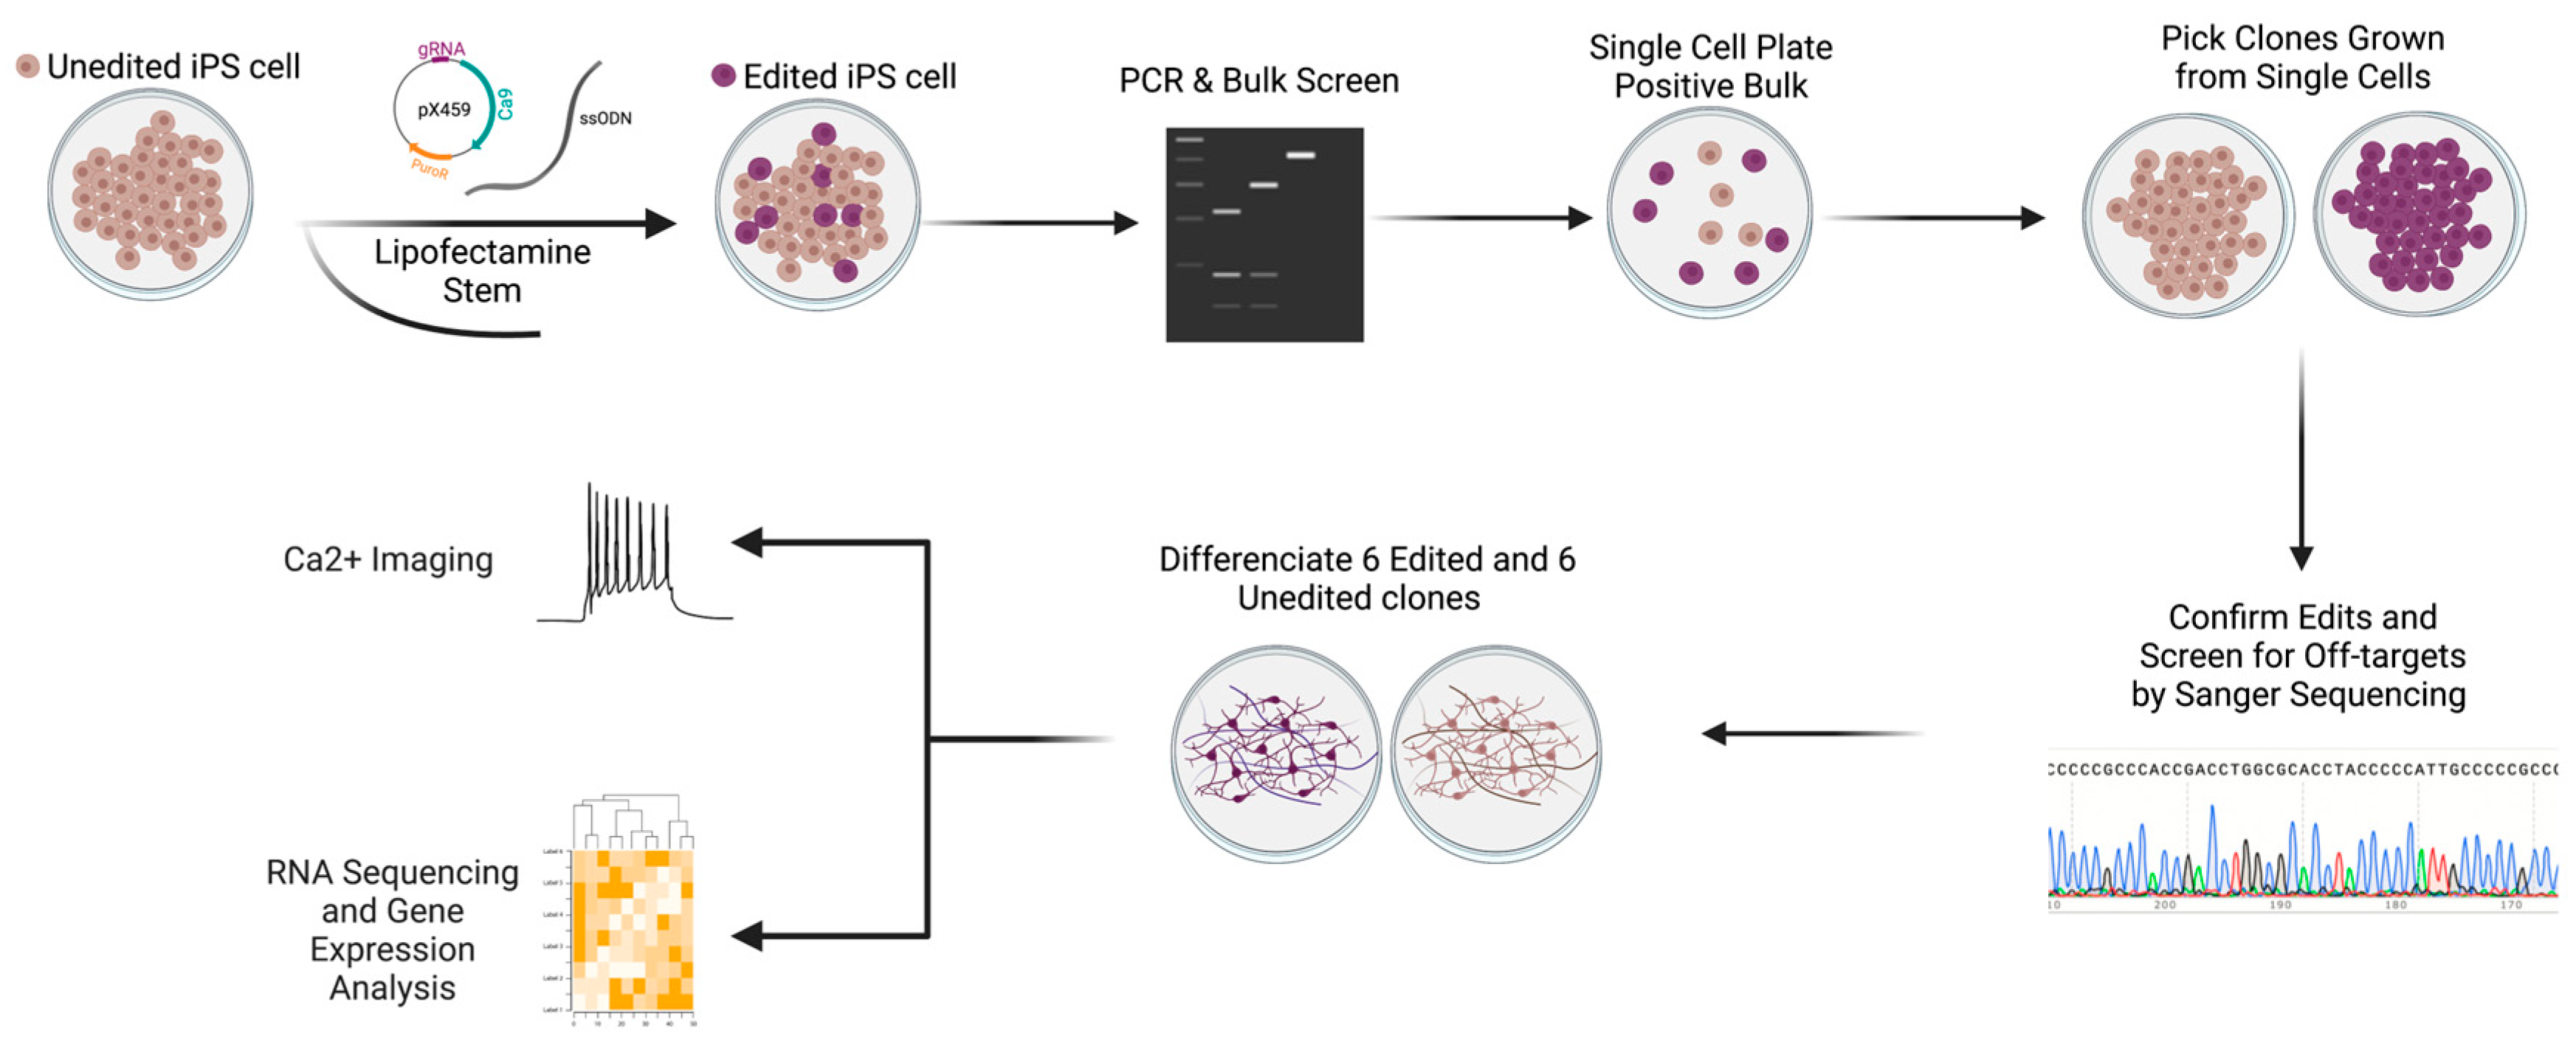
3.4. Generating Isogenic iPSC-Derived Glutamatergic Excitatory Neurons Using CRISPR/Cas9
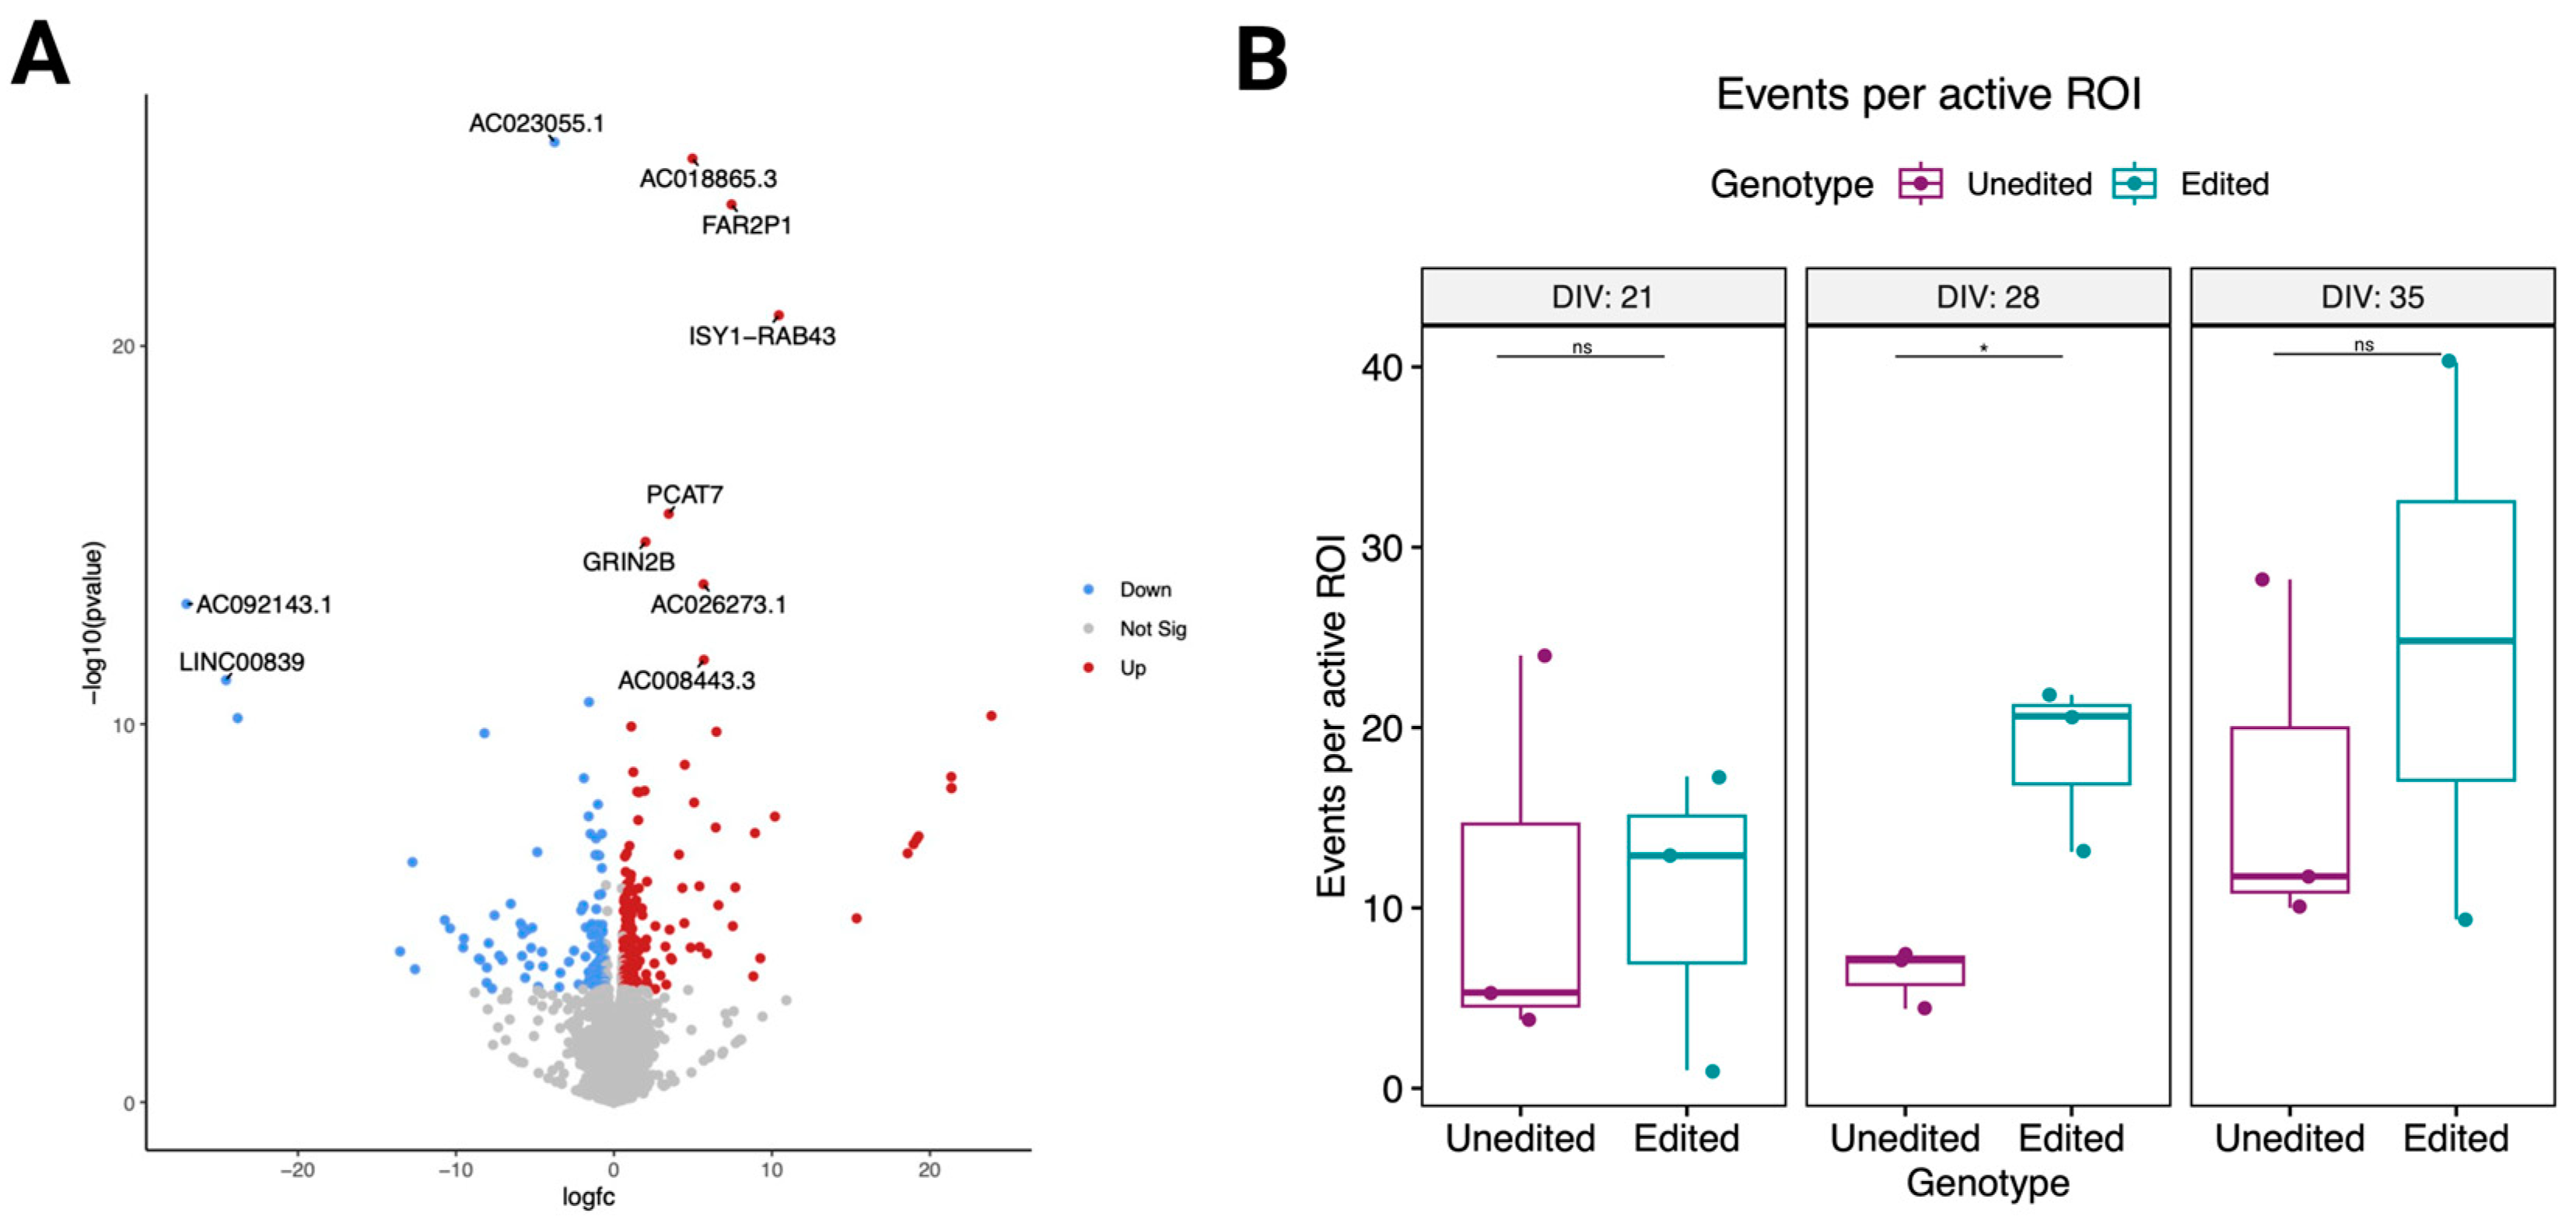
3.5. Changes in the Proline-Rich Region of CASKIN1 Cause Significant Transcriptomic Changes
3.6. Electrical Activity Differences in Edited Cells during Maturation
4. Discussion
Supplementary Materials
Author Contributions
Funding
Institutional Review Board Statement
Informed Consent Statement
Data Availability Statement
Acknowledgments
Conflicts of Interest
References
- Jablensky, A.; Sartorius, N.; Ernberg, G.; Anker, M.; Korten, A.; Cooper, J.E.; Day, R.; Bertelsen, A. Schizophrenia: Manifestations, incidence and course in different cultures. A World Health Organization ten-country study. Psychol. Med. Monogr. Suppl. 1992, 20, 1–97. [Google Scholar] [CrossRef] [PubMed]
- Avramopoulos, D. Recent Advances in the Genetics of Schizophrenia. Mol. Neuropsychiatry 2018, 4, 35–51. [Google Scholar] [CrossRef] [PubMed]
- Trubetskoy, V.; Pardinas, A.F.; Qi, T.; Panagiotaropoulou, G.; Awasthi, S.; Bigdeli, T.B.; Bryois, J.; Chen, C.Y.; Dennison, C.A.; Hall, L.S.; et al. Mapping genomic loci implicates genes and synaptic biology in schizophrenia. Nature 2022, 604, 502–508. [Google Scholar] [CrossRef] [PubMed]
- Singh, T.; Poterba, T.; Curtis, D.; Akil, H.; Al Eissa, M.; Barchas, J.D.; Bass, N.; Bigdeli, T.B.; Breen, G.; Bromet, E.J.; et al. Rare coding variants in ten genes confer substantial risk for schizophrenia. Nature 2022, 604, 509–516. [Google Scholar] [CrossRef]
- Stefansson, H.; Sigurdsson, E.; Steinthorsdottir, V.; Bjornsdottir, S.; Sigmundsson, T.; Ghosh, S.; Brynjolfsson, J.; Gunnarsdottir, S.; Ivarsson, O.; Chou, T.T.; et al. Neuregulin 1 and susceptibility to schizophrenia. Am. J. Hum. Genet. 2002, 71, 877–892. [Google Scholar] [CrossRef]
- Kato, H.; Kimura, H.; Kushima, I.; Takahashi, N.; Aleksic, B.; Ozaki, N. The genetic architecture of schizophrenia: Review of large-scale genetic studies. J. Hum. Genet. 2022. [Google Scholar] [CrossRef]
- Halvorsen, M.; Huh, R.; Oskolkov, N.; Wen, J.; Netotea, S.; Giusti-Rodriguez, P.; Karlsson, R.; Bryois, J.; Nystedt, B.; Ameur, A.; et al. Increased burden of ultra-rare structural variants localizing to boundaries of topologically associated domains in schizophrenia. Nat. Commun. 2020, 11, 1842. [Google Scholar] [CrossRef]
- Singh, T.; Kurki, M.I.; Curtis, D.; Purcell, S.M.; Crooks, L.; McRae, J.; Suvisaari, J.; Chheda, H.; Blackwood, D.; Breen, G.; et al. Rare loss-of-function variants in SETD1A are associated with schizophrenia and developmental disorders. Nat. Neurosci. 2016, 19, 571–577. [Google Scholar] [CrossRef]
- Steinberg, S.; Gudmundsdottir, S.; Sveinbjornsson, G.; Suvisaari, J.; Paunio, T.; Torniainen-Holm, M.; Frigge, M.L.; Jonsdottir, G.A.; Huttenlocher, J.; Arnarsdottir, S.; et al. Truncating mutations in RBM12 are associated with psychosis. Nat. Genet. 2017, 49, 1251–1254. [Google Scholar] [CrossRef] [PubMed]
- Marshall, C.R.; Howrigan, D.P.; Merico, D.; Thiruvahindrapuram, B.; Wu, W.; Greer, D.S.; Antaki, D.; Shetty, A.; Holmans, P.A.; Pinto, D.; et al. Contribution of copy number variants to schizophrenia from a genome-wide study of 41,321 subjects. Nat. Genet. 2017, 49, 27–35. [Google Scholar] [CrossRef]
- Walsh, T.; McClellan, J.M.; McCarthy, S.E.; Addington, A.M.; Pierce, S.B.; Cooper, G.M.; Nord, A.S.; Kusenda, M.; Malhotra, D.; Bhandari, A.; et al. Rare structural variants disrupt multiple genes in neurodevelopmental pathways in schizophrenia. Science 2008, 320, 539–543. [Google Scholar] [CrossRef] [PubMed]
- Pak, C.; Danko, T.; Mirabella, V.R.; Wang, J.; Liu, Y.; Vangipuram, M.; Grieder, S.; Zhang, X.; Ward, T.; Huang, Y.A.; et al. Cross-platform validation of neurotransmitter release impairments in schizophrenia patient-derived NRXN1-mutant neurons. Proc. Natl. Acad. Sci. USA 2021, 118, e2025598118. [Google Scholar] [CrossRef] [PubMed]
- Rein, B.; Yan, Z. 16p11.2 Copy Number Variations and Neurodevelopmental Disorders. Trends Neurosci. 2020, 43, 886–901. [Google Scholar] [CrossRef]
- Kirov, G. CNVs in neuropsychiatric disorders. Hum. Mol. Genet. 2015, 24, R45–R49. [Google Scholar] [CrossRef]
- Murphy, K.C.; Jones, L.A.; Owen, M.J. High rates of schizophrenia in adults with velo-cardio-facial syndrome. Arch. Gen. Psychiatry 1999, 56, 940–945. [Google Scholar] [CrossRef]
- Lowther, C.; Speevak, M.; Armour, C.M.; Goh, E.S.; Graham, G.E.; Li, C.; Zeesman, S.; Nowaczyk, M.J.; Schultz, L.A.; Morra, A.; et al. Molecular characterization of NRXN1 deletions from 19,263 clinical microarray cases identifies exons important for neurodevelopmental disease expression. Genet. Med. 2017, 19, 53–61. [Google Scholar] [CrossRef] [PubMed]
- Castronovo, P.; Baccarin, M.; Ricciardello, A.; Picinelli, C.; Tomaiuolo, P.; Cucinotta, F.; Frittoli, M.; Lintas, C.; Sacco, R.; Persico, A.M. Phenotypic spectrum of NRXN1 mono- and bi-allelic deficiency: A systematic review. Clin. Genet. 2020, 97, 125–137. [Google Scholar] [CrossRef] [PubMed]
- Sudhof, T.C. Neuroligins and neurexins link synaptic function to cognitive disease. Nature 2008, 455, 903–911. [Google Scholar] [CrossRef] [PubMed]
- Gomez, A.M.; Traunmuller, L.; Scheiffele, P. Neurexins: Molecular codes for shaping neuronal synapses. Nat. Rev. Neurosci. 2021, 22, 137–151. [Google Scholar] [CrossRef] [PubMed]
- Stafford, R.L.; Ear, J.; Knight, M.J.; Bowie, J.U. The molecular basis of the Caskin1 and Mint1 interaction with CASK. J. Mol. Biol. 2011, 412, 3–13. [Google Scholar] [CrossRef]
- McSweeney, D.; Gabriel, R.; Jin, K.; Pang, Z.P.; Aronow, B.; Pak, C. CASK loss of function differentially regulates neuronal maturation and synaptic function in human induced cortical excitatory neurons. iScience 2022, 25, 105187. [Google Scholar] [CrossRef] [PubMed]
- Wang, T.; Kim, C.N.; Bakken, T.E.; Gillentine, M.A.; Henning, B.; Mao, Y.; Gilissen, C.; Consortium, S.; Nowakowski, T.J.; Eichler, E.E. Integrated gene analyses of de novo variants from 46,612 trios with autism and developmental disorders. Proc. Natl. Acad. Sci. USA 2022, 119, e2203491119. [Google Scholar] [CrossRef] [PubMed]
- Dubbs, H.; Ortiz-Gonzalez, X.; Marsh, E.D. Pathogenic variants in CASK: Expanding the genotype-phenotype correlations. Am. J. Med. Genet. A 2022, 188, 2617–2626. [Google Scholar] [CrossRef]
- Li, H.; Durbin, R. Fast and accurate short read alignment with Burrows-Wheeler transform. Bioinformatics 2009, 25, 1754–1760. [Google Scholar] [CrossRef]
- McKenna, A.; Hanna, M.; Banks, E.; Sivachenko, A.; Cibulskis, K.; Kernytsky, A.; Garimella, K.; Altshuler, D.; Gabriel, S.; Daly, M.; et al. The Genome Analysis Toolkit: A MapReduce framework for analyzing next-generation DNA sequencing data. Genome Res. 2010, 20, 1297–1303. [Google Scholar] [CrossRef] [PubMed]
- DePristo, M.A.; Banks, E.; Poplin, R.; Garimella, K.V.; Maguire, J.R.; Hartl, C.; Philippakis, A.A.; del Angel, G.; Rivas, M.A.; Hanna, M.; et al. A framework for variation discovery and genotyping using next-generation DNA sequencing data. Nat. Genet. 2011, 43, 491–498. [Google Scholar] [CrossRef] [PubMed]
- Sobreira, N.; Schiettecatte, F.; Boehm, C.; Valle, D.; Hamosh, A. New tools for Mendelian disease gene identification: PhenoDB variant analysis module; and GeneMatcher, a web-based tool for linking investigators with an interest in the same gene. Hum. Mutat. 2015, 36, 425–431. [Google Scholar] [CrossRef] [PubMed]
- Abecasis, G.R.; Cherny, S.S.; Cookson, W.O.; Cardon, L.R. Merlin—Rapid analysis of dense genetic maps using sparse gene flow trees. Nat. Genet. 2002, 30, 97–101. [Google Scholar] [CrossRef]
- Purcell, S.; Neale, B.; Todd-Brown, K.; Thomas, L.; Ferreira, M.A.; Bender, D.; Maller, J.; Sklar, P.; de Bakker, P.I.; Daly, M.J.; et al. PLINK: A tool set for whole-genome association and population-based linkage analyses. Am. J. Hum. Genet. 2007, 81, 559–575. [Google Scholar] [CrossRef]
- Euesden, J.; Lewis, C.M.; O’Reilly, P.F. PRSice: Polygenic Risk Score software. Bioinformatics 2015, 31, 1466–1468. [Google Scholar] [CrossRef]
- Adikusuma, F.; Pfitzner, C.; Thomas, P.Q. Versatile single-step-assembly CRISPR/Cas9 vectors for dual gRNA expression. PLoS ONE 2017, 12, e0187236. [Google Scholar] [CrossRef] [PubMed]
- Zhang, Y.; Pak, C.; Han, Y.; Ahlenius, H.; Zhang, Z.; Chanda, S.; Marro, S.; Patzke, C.; Acuna, C.; Covy, J.; et al. Rapid single-step induction of functional neurons from human pluripotent stem cells. Neuron 2013, 78, 785–798. [Google Scholar] [CrossRef] [PubMed]
- Kim, D.; Paggi, J.M.; Park, C.; Bennett, C.; Salzberg, S.L. Graph-based genome alignment and genotyping with HISAT2 and HISAT-genotype. Nat. Biotechnol. 2019, 37, 907–915. [Google Scholar] [CrossRef] [PubMed]
- Li, H.; Handsaker, B.; Wysoker, A.; Fennell, T.; Ruan, J.; Homer, N.; Marth, G.; Abecasis, G.; Durbin, R.; 1000 Genome Project Data Processing Subgroup. The Sequence Alignment/Map format and SAMtools. Bioinformatics 2009, 25, 2078–2079. [Google Scholar] [CrossRef]
- Pertea, M.; Pertea, G.M.; Antonescu, C.M.; Chang, T.C.; Mendell, J.T.; Salzberg, S.L. StringTie enables improved reconstruction of a transcriptome from RNA-seq reads. Nat. Biotechnol. 2015, 33, 290–295. [Google Scholar] [CrossRef]
- Pertea, M.; Kim, D.; Pertea, G.M.; Leek, J.T.; Salzberg, S.L. Transcript-level expression analysis of RNA-seq experiments with HISAT, StringTie and Ballgown. Nat. Protoc. 2016, 11, 1650–1667. [Google Scholar] [CrossRef]
- Soneson, C.; Love, M.I.; Robinson, M.D. Differential analyses for RNA-seq: Transcript-level estimates improve gene-level inferences. F1000Research 2015, 4, 1521. [Google Scholar] [CrossRef]
- Love, M.I.; Huber, W.; Anders, S. Moderated estimation of fold change and dispersion for RNA-seq data with DESeq2. Genome Biol. 2014, 15, 550. [Google Scholar] [CrossRef]
- Jensen, L.J.; Kuhn, M.; Stark, M.; Chaffron, S.; Creevey, C.; Muller, J.; Doerks, T.; Julien, P.; Roth, A.; Simonovic, M.; et al. STRING 8—A global view on proteins and their functional interactions in 630 organisms. Nucleic Acids Res. 2009, 37, D412–D416. [Google Scholar] [CrossRef]
- Tippani, M.; Pattie, E.A.; Davis, B.A.; Nguyen, C.V.; Wang, Y.; Sripathy, S.R.; Maher, B.J.; Martinowich, K.; Jaffe, A.E.; Page, S.C. CaPTure: Calcium PeakToolbox for analysis of in vitro calcium imaging data. BMC Neurosci. 2022, 23, 71. [Google Scholar] [CrossRef]
- Balazs, A.; Csizmok, V.; Buday, L.; Rakacs, M.; Kiss, R.; Bokor, M.; Udupa, R.; Tompa, K.; Tompa, P. High levels of structural disorder in scaffold proteins as exemplified by a novel neuronal protein, CASK-interactive protein1. FEBS J. 2009, 276, 3744–3756. [Google Scholar] [CrossRef] [PubMed]
- Xiao, X.; Levy, A.D.; Rosenberg, B.J.; Higley, M.J.; Koleske, A.J. Disruption of Coordinated Presynaptic and Postsynaptic Maturation Underlies the Defects in Hippocampal Synapse Stability and Plasticity in Abl2/Arg-Deficient Mice. J. Neurosci. 2016, 36, 6778–6791. [Google Scholar] [CrossRef] [PubMed]
- Mullins, N.; Forstner, A.J.; O’Connell, K.S.; Coombes, B.; Coleman, J.R.I.; Qiao, Z.; Als, T.D.; Bigdeli, T.B.; Borte, S.; Bryois, J.; et al. Genome-wide association study of more than 40,000 bipolar disorder cases provides new insights into the underlying biology. Nat. Genet. 2021, 53, 817–829. [Google Scholar] [CrossRef]
- Feuer, K.L.; Wahbeh, M.H.; Yovo, C.; Rabie, E.; Lam, A.N.; Abdollahi, S.; Young, L.J.; Rike, B.; Umamageswaran, A.; Avramopoulos, D. CRISPR Del/Rei: A simple, flexible, and efficient pipeline for scarless genome editing. Sci. Rep. 2022, 12, 11928. [Google Scholar] [CrossRef] [PubMed]
- Ho, S.M.; Hartley, B.J.; Tcw, J.; Beaumont, M.; Stafford, K.; Slesinger, P.A.; Brennand, K.J. Rapid Ngn2-induction of excitatory neurons from hiPSC-derived neural progenitor cells. Methods 2016, 101, 113–124. [Google Scholar] [CrossRef] [PubMed]
- Das, D.; Peng, X.; Lam, A.N.; Bader, J.S.; Avramopoulos, D. Transcriptome analysis of human induced excitatory neurons supports a strong effect of clozapine on cholesterol biosynthesis. Schizophr. Res. 2021, 228, 324–326. [Google Scholar] [CrossRef]
- Subramanian, A.; Tamayo, P.; Mootha, V.K.; Mukherjee, S.; Ebert, B.L.; Gillette, M.A.; Paulovich, A.; Pomeroy, S.L.; Golub, T.R.; Lander, E.S.; et al. Gene set enrichment analysis: A knowledge-based approach for interpreting genome-wide expression profiles. Proc. Natl. Acad. Sci. USA 2005, 102, 15545–15550. [Google Scholar] [CrossRef]
- Mootha, V.K.; Lindgren, C.M.; Eriksson, K.F.; Subramanian, A.; Sihag, S.; Lehar, J.; Puigserver, P.; Carlsson, E.; Ridderstrale, M.; Laurila, E.; et al. PGC-1alpha-responsive genes involved in oxidative phosphorylation are coordinately downregulated in human diabetes. Nat. Genet. 2003, 34, 267–273. [Google Scholar] [CrossRef]
- Tabuchi, K.; Biederer, T.; Butz, S.; Sudhof, T.C. CASK participates in alternative tripartite complexes in which Mint 1 competes for binding with caskin 1, a novel CASK-binding protein. J. Neurosci. 2002, 22, 4264–4273. [Google Scholar] [CrossRef]
- LaConte, L.E.; Chavan, V.; Liang, C.; Willis, J.; Schonhense, E.M.; Schoch, S.; Mukherjee, K. CASK stabilizes neurexin and links it to liprin-α in a neuronal activity-dependent manner. Cell. Mol. Life Sci. 2016, 73, 3599–3621. [Google Scholar] [CrossRef]
- Kingdom, R.; Wright, C.F. Incomplete Penetrance and Variable Expressivity: From Clinical Studies to Population Cohorts. Front. Genet. 2022, 13, 920390. [Google Scholar] [CrossRef] [PubMed]
- Tansey, K.E.; Rees, E.; Linden, D.E.; Ripke, S.; Chambert, K.D.; Moran, J.L.; McCarroll, S.A.; Holmans, P.; Kirov, G.; Walters, J.; et al. Common alleles contribute to schizophrenia in CNV carriers. Mol. Psychiatry 2016, 21, 1085–1089. [Google Scholar] [CrossRef] [PubMed]
- Purcell, S.M.; Moran, J.L.; Fromer, M.; Ruderfer, D.; Solovieff, N.; Roussos, P.; O’Dushlaine, C.; Chambert, K.; Bergen, S.E.; Kahler, A.; et al. A polygenic burden of rare disruptive mutations in schizophrenia. Nature 2014, 506, 185–190. [Google Scholar] [CrossRef] [PubMed]
- Katano, T.; Takao, K.; Abe, M.; Yamazaki, M.; Watanabe, M.; Miyakawa, T.; Sakimura, K.; Ito, S. Distribution of Caskin1 protein and phenotypic characterization of its knockout mice using a comprehensive behavioral test battery. Mol. Brain 2018, 11, 63. [Google Scholar] [CrossRef]
- Weng, Y.L.; Liu, N.; DiAntonio, A.; Broihier, H.T. The cytoplasmic adaptor protein Caskin mediates Lar signal transduction during Drosophila motor axon guidance. J. Neurosci. 2011, 31, 4421–4433. [Google Scholar] [CrossRef]
- Avazzadeh, S.; McDonagh, K.; Reilly, J.; Wang, Y.; Boomkamp, S.D.; McInerney, V.; Krawczyk, J.; Fitzgerald, J.; Feerick, N.; O’Sullivan, M.; et al. Increased Ca2+ signaling in NRXN1α+/− neurons derived from ASD induced pluripotent stem cells. Mol. Autism 2019, 10, 52. [Google Scholar] [CrossRef]
- Bencsik, N.; Pusztai, S.; Borbely, S.; Fekete, A.; Dulk, M.; Kis, V.; Pesti, S.; Vas, V.; Szucs, A.; Buday, L.; et al. Dendritic spine morphology and memory formation depend on postsynaptic Caskin proteins. Sci. Rep. 2019, 9, 16843. [Google Scholar] [CrossRef] [PubMed]
- Newey, R.M. Coping with blindness. Vet. Rec. 1989, 124, 104. [Google Scholar] [CrossRef]


Disclaimer/Publisher’s Note: The statements, opinions and data contained in all publications are solely those of the individual author(s) and contributor(s) and not of MDPI and/or the editor(s). MDPI and/or the editor(s) disclaim responsibility for any injury to people or property resulting from any ideas, methods, instructions or products referred to in the content. |
© 2023 by the authors. Licensee MDPI, Basel, Switzerland. This article is an open access article distributed under the terms and conditions of the Creative Commons Attribution (CC BY) license (https://creativecommons.org/licenses/by/4.0/).
Share and Cite
Wahbeh, M.H.; Peng, X.; Bacharaki, S.; Hatzimanolis, A.; Dimitrakopoulos, S.; Wohler, E.; Yang, X.; Yovo, C.; Maher, B.J.; Sobreira, N.; et al. A Missense Variant in CASKIN1’s Proline-Rich Region Segregates with Psychosis in a Three-Generation Family. Genes 2023, 14, 177. https://doi.org/10.3390/genes14010177
Wahbeh MH, Peng X, Bacharaki S, Hatzimanolis A, Dimitrakopoulos S, Wohler E, Yang X, Yovo C, Maher BJ, Sobreira N, et al. A Missense Variant in CASKIN1’s Proline-Rich Region Segregates with Psychosis in a Three-Generation Family. Genes. 2023; 14(1):177. https://doi.org/10.3390/genes14010177
Chicago/Turabian StyleWahbeh, Marah H., Xi Peng, Sofia Bacharaki, Alexandros Hatzimanolis, Stefanos Dimitrakopoulos, Elizabeth Wohler, Xue Yang, Christian Yovo, Brady J. Maher, Nara Sobreira, and et al. 2023. "A Missense Variant in CASKIN1’s Proline-Rich Region Segregates with Psychosis in a Three-Generation Family" Genes 14, no. 1: 177. https://doi.org/10.3390/genes14010177
APA StyleWahbeh, M. H., Peng, X., Bacharaki, S., Hatzimanolis, A., Dimitrakopoulos, S., Wohler, E., Yang, X., Yovo, C., Maher, B. J., Sobreira, N., Stefanis, N. C., & Avramopoulos, D. (2023). A Missense Variant in CASKIN1’s Proline-Rich Region Segregates with Psychosis in a Three-Generation Family. Genes, 14(1), 177. https://doi.org/10.3390/genes14010177