
Detoxification Gene Families at the Genome-Wide Level of Rhus Gall Aphid Schlechtendalia chinensis


Abstract
:1. Introduction
2. Materials and Methods
2.1. Sample Information
2.2. Identification of Detoxification Genes from S. chinensis
2.3. Phylogenetic Tree, Motif Pattern, Domain, Gene Structure of Detoxification Genes
2.4. Chromosomal Locations, Collinearity and Selection Pressure
2.5. Expression Profile of Detoxification Genes
2.6. Prediction of Characteristics and Physicochemical Properties of Detoxification Gene
2.7. Protein Structure Prediction from the Detoxification Genes
3. Results
3.1. Identification of Detoxification Genes of S. chinensis
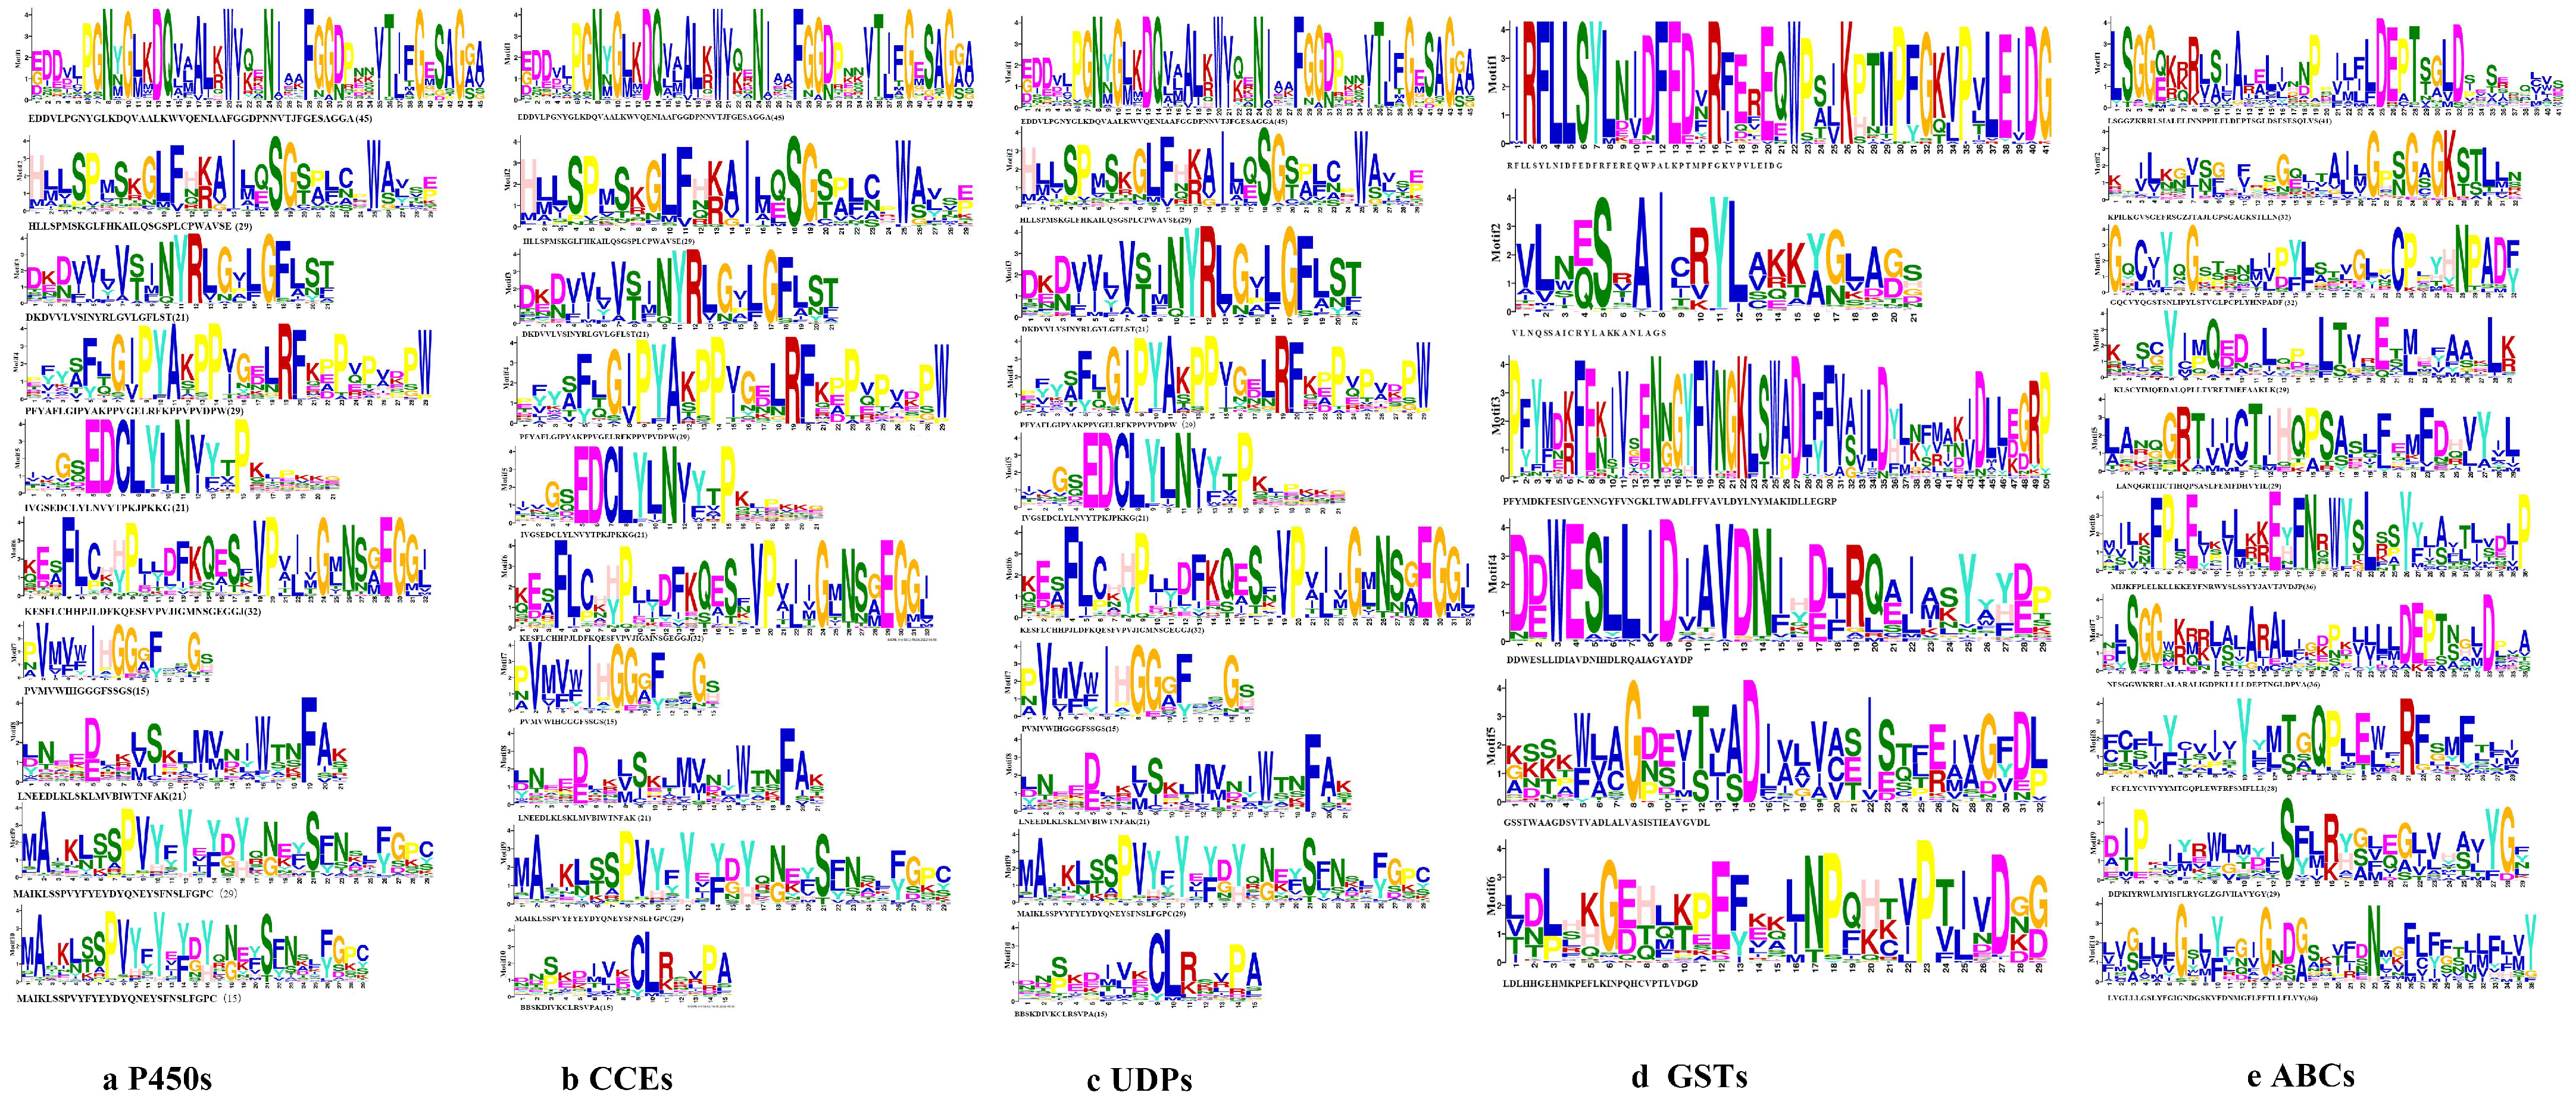
3.2. Characteristic of the Five Detoxification Genes of S. chinensis
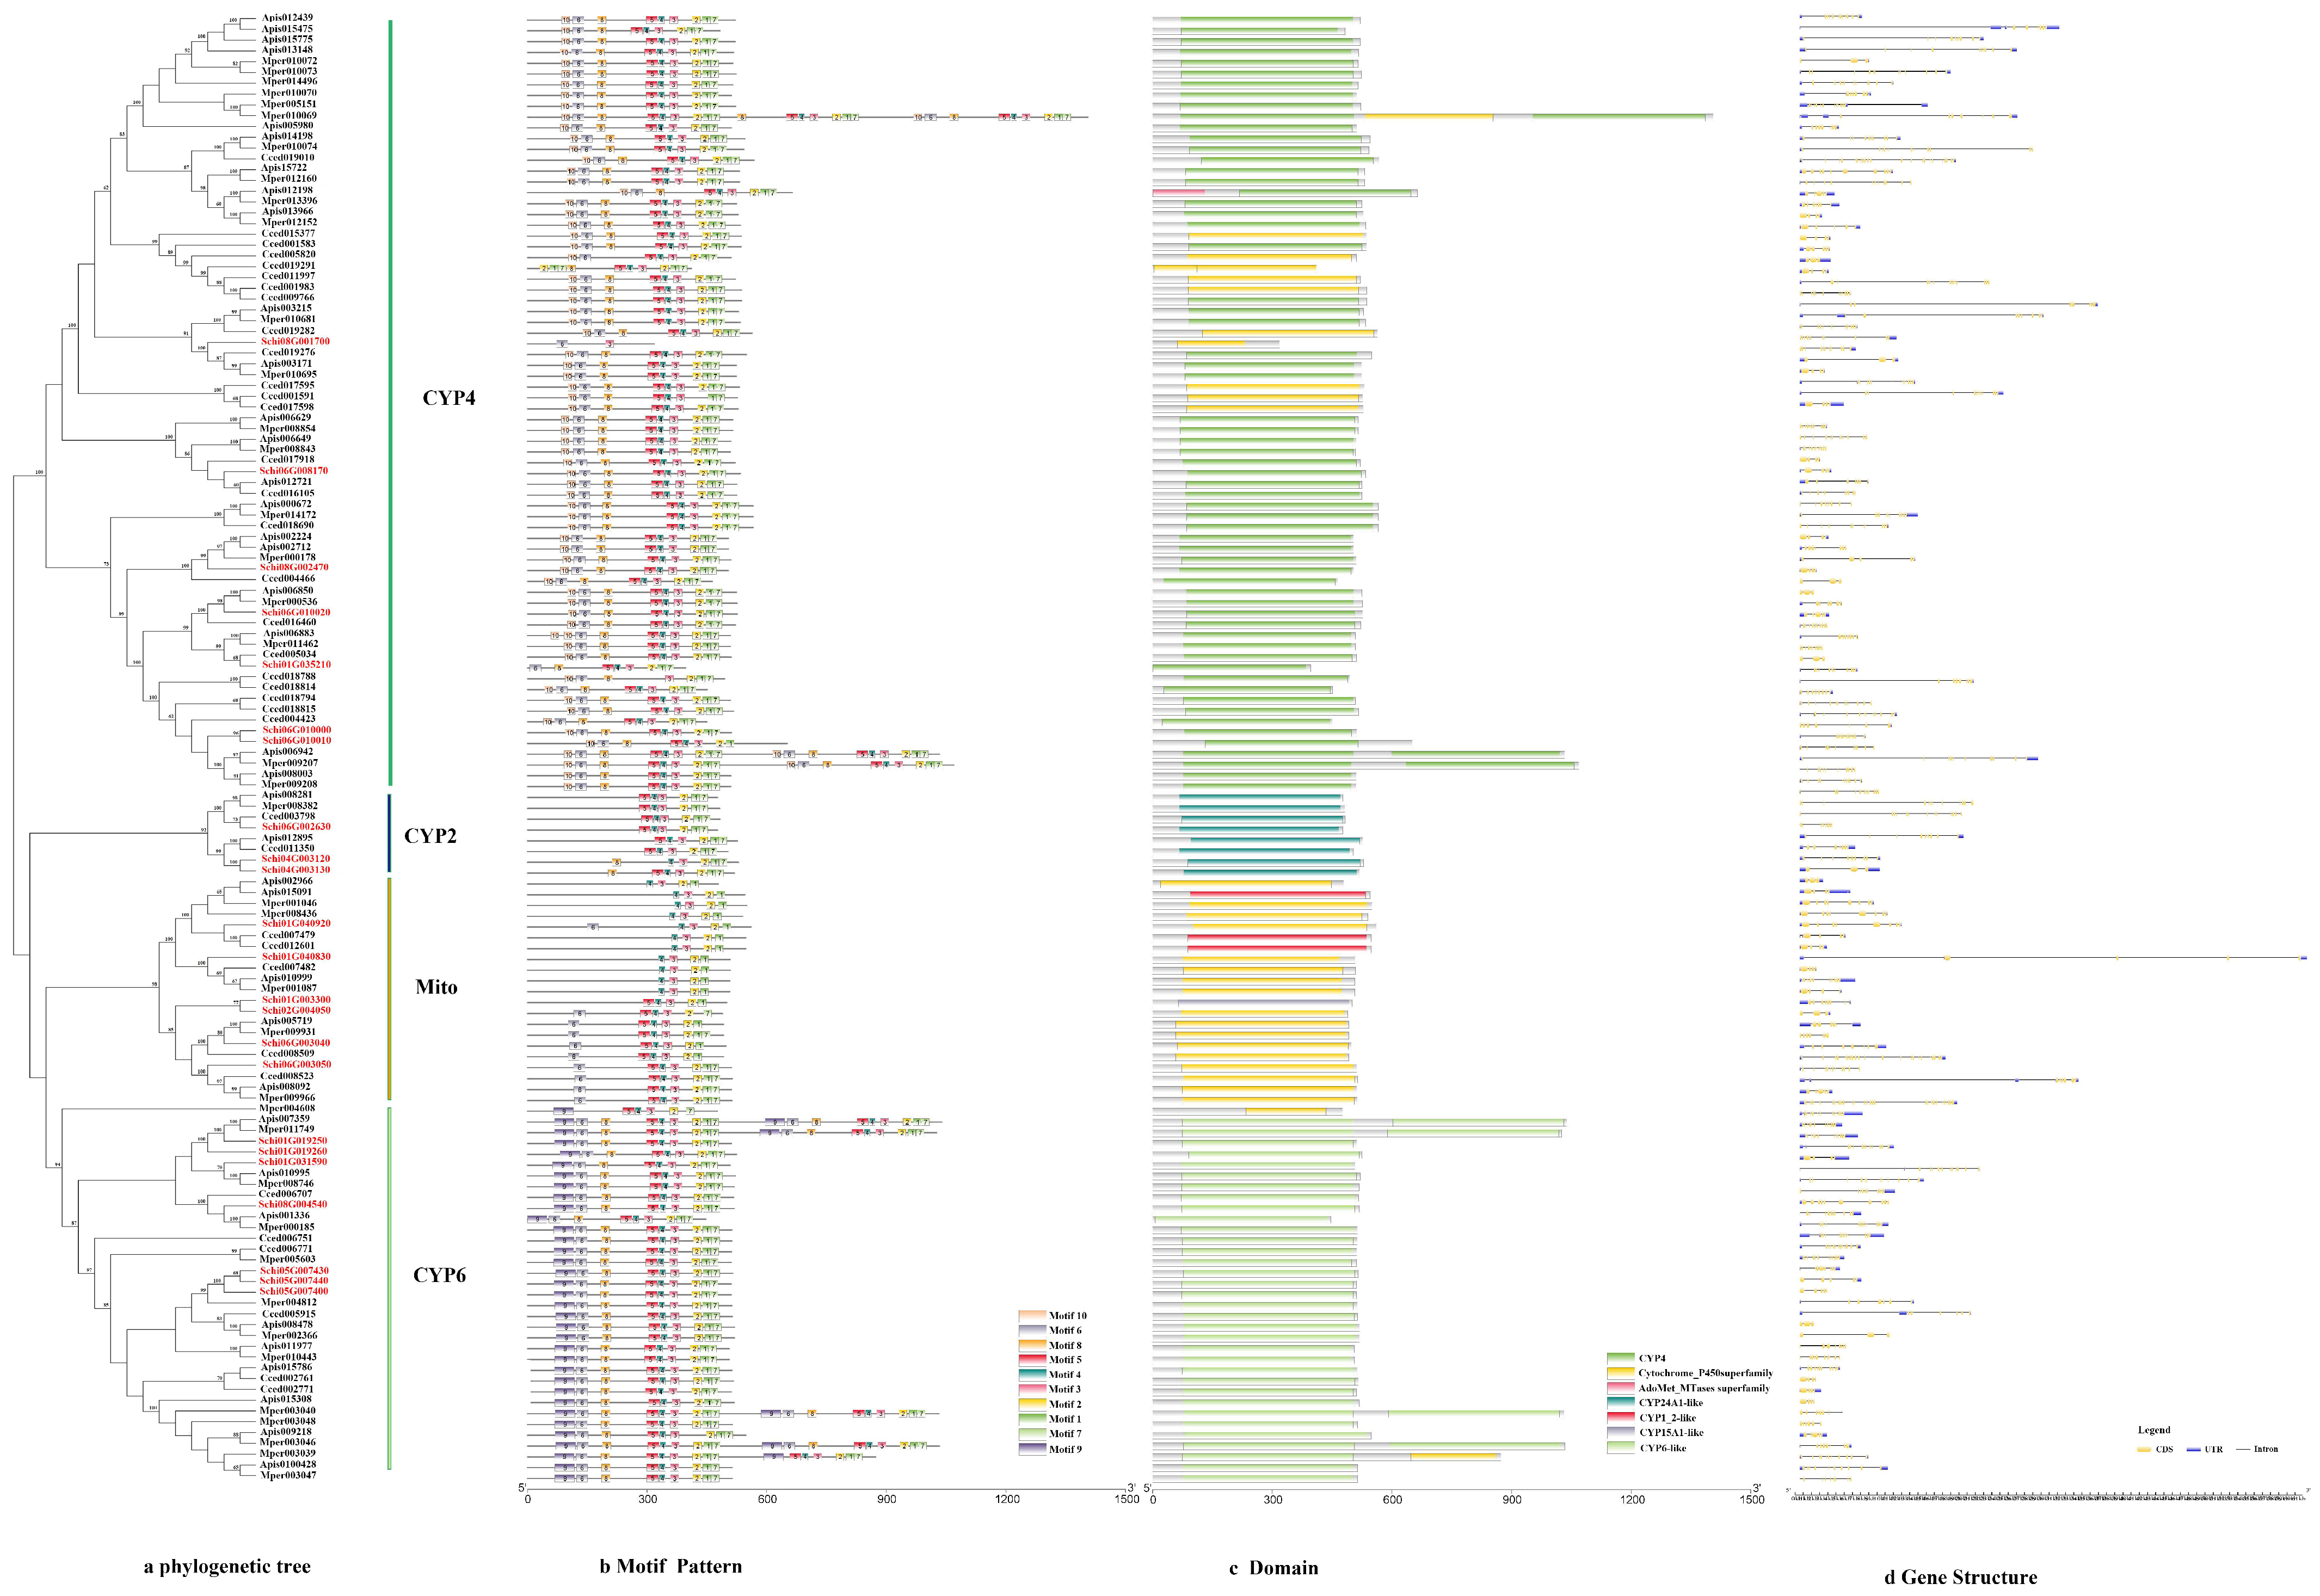
3.2.1. P450s
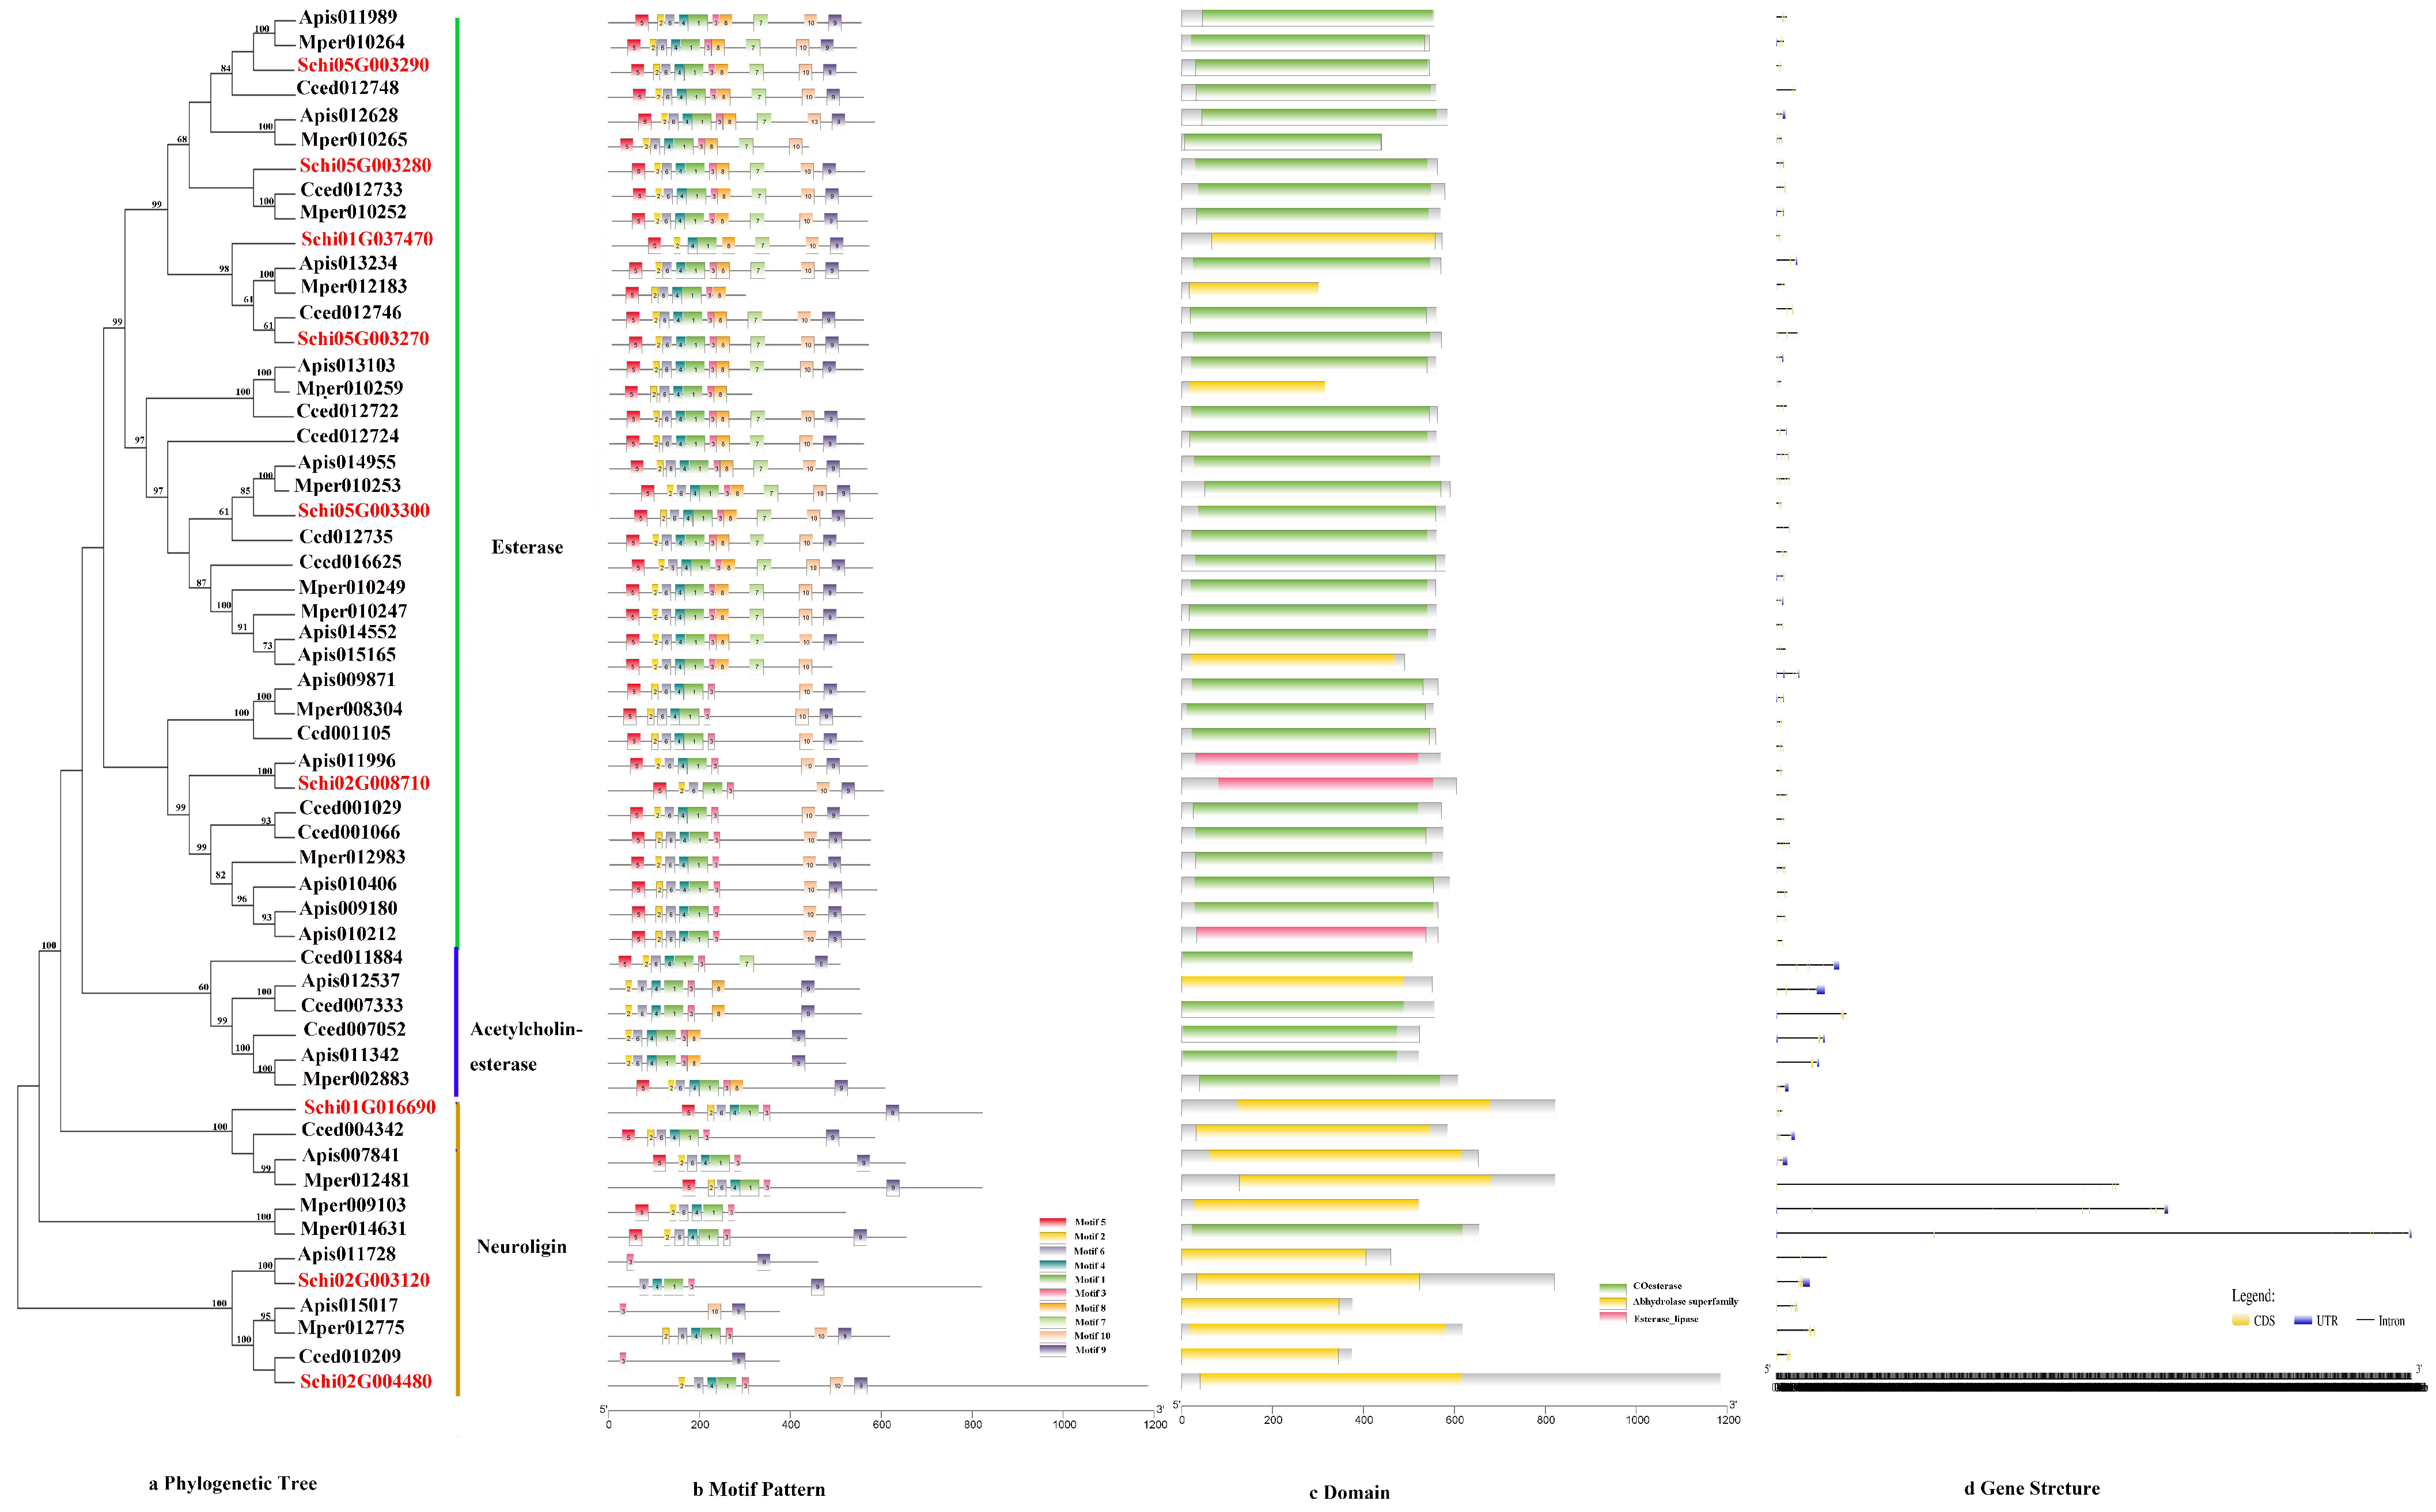
3.2.2. CCEs
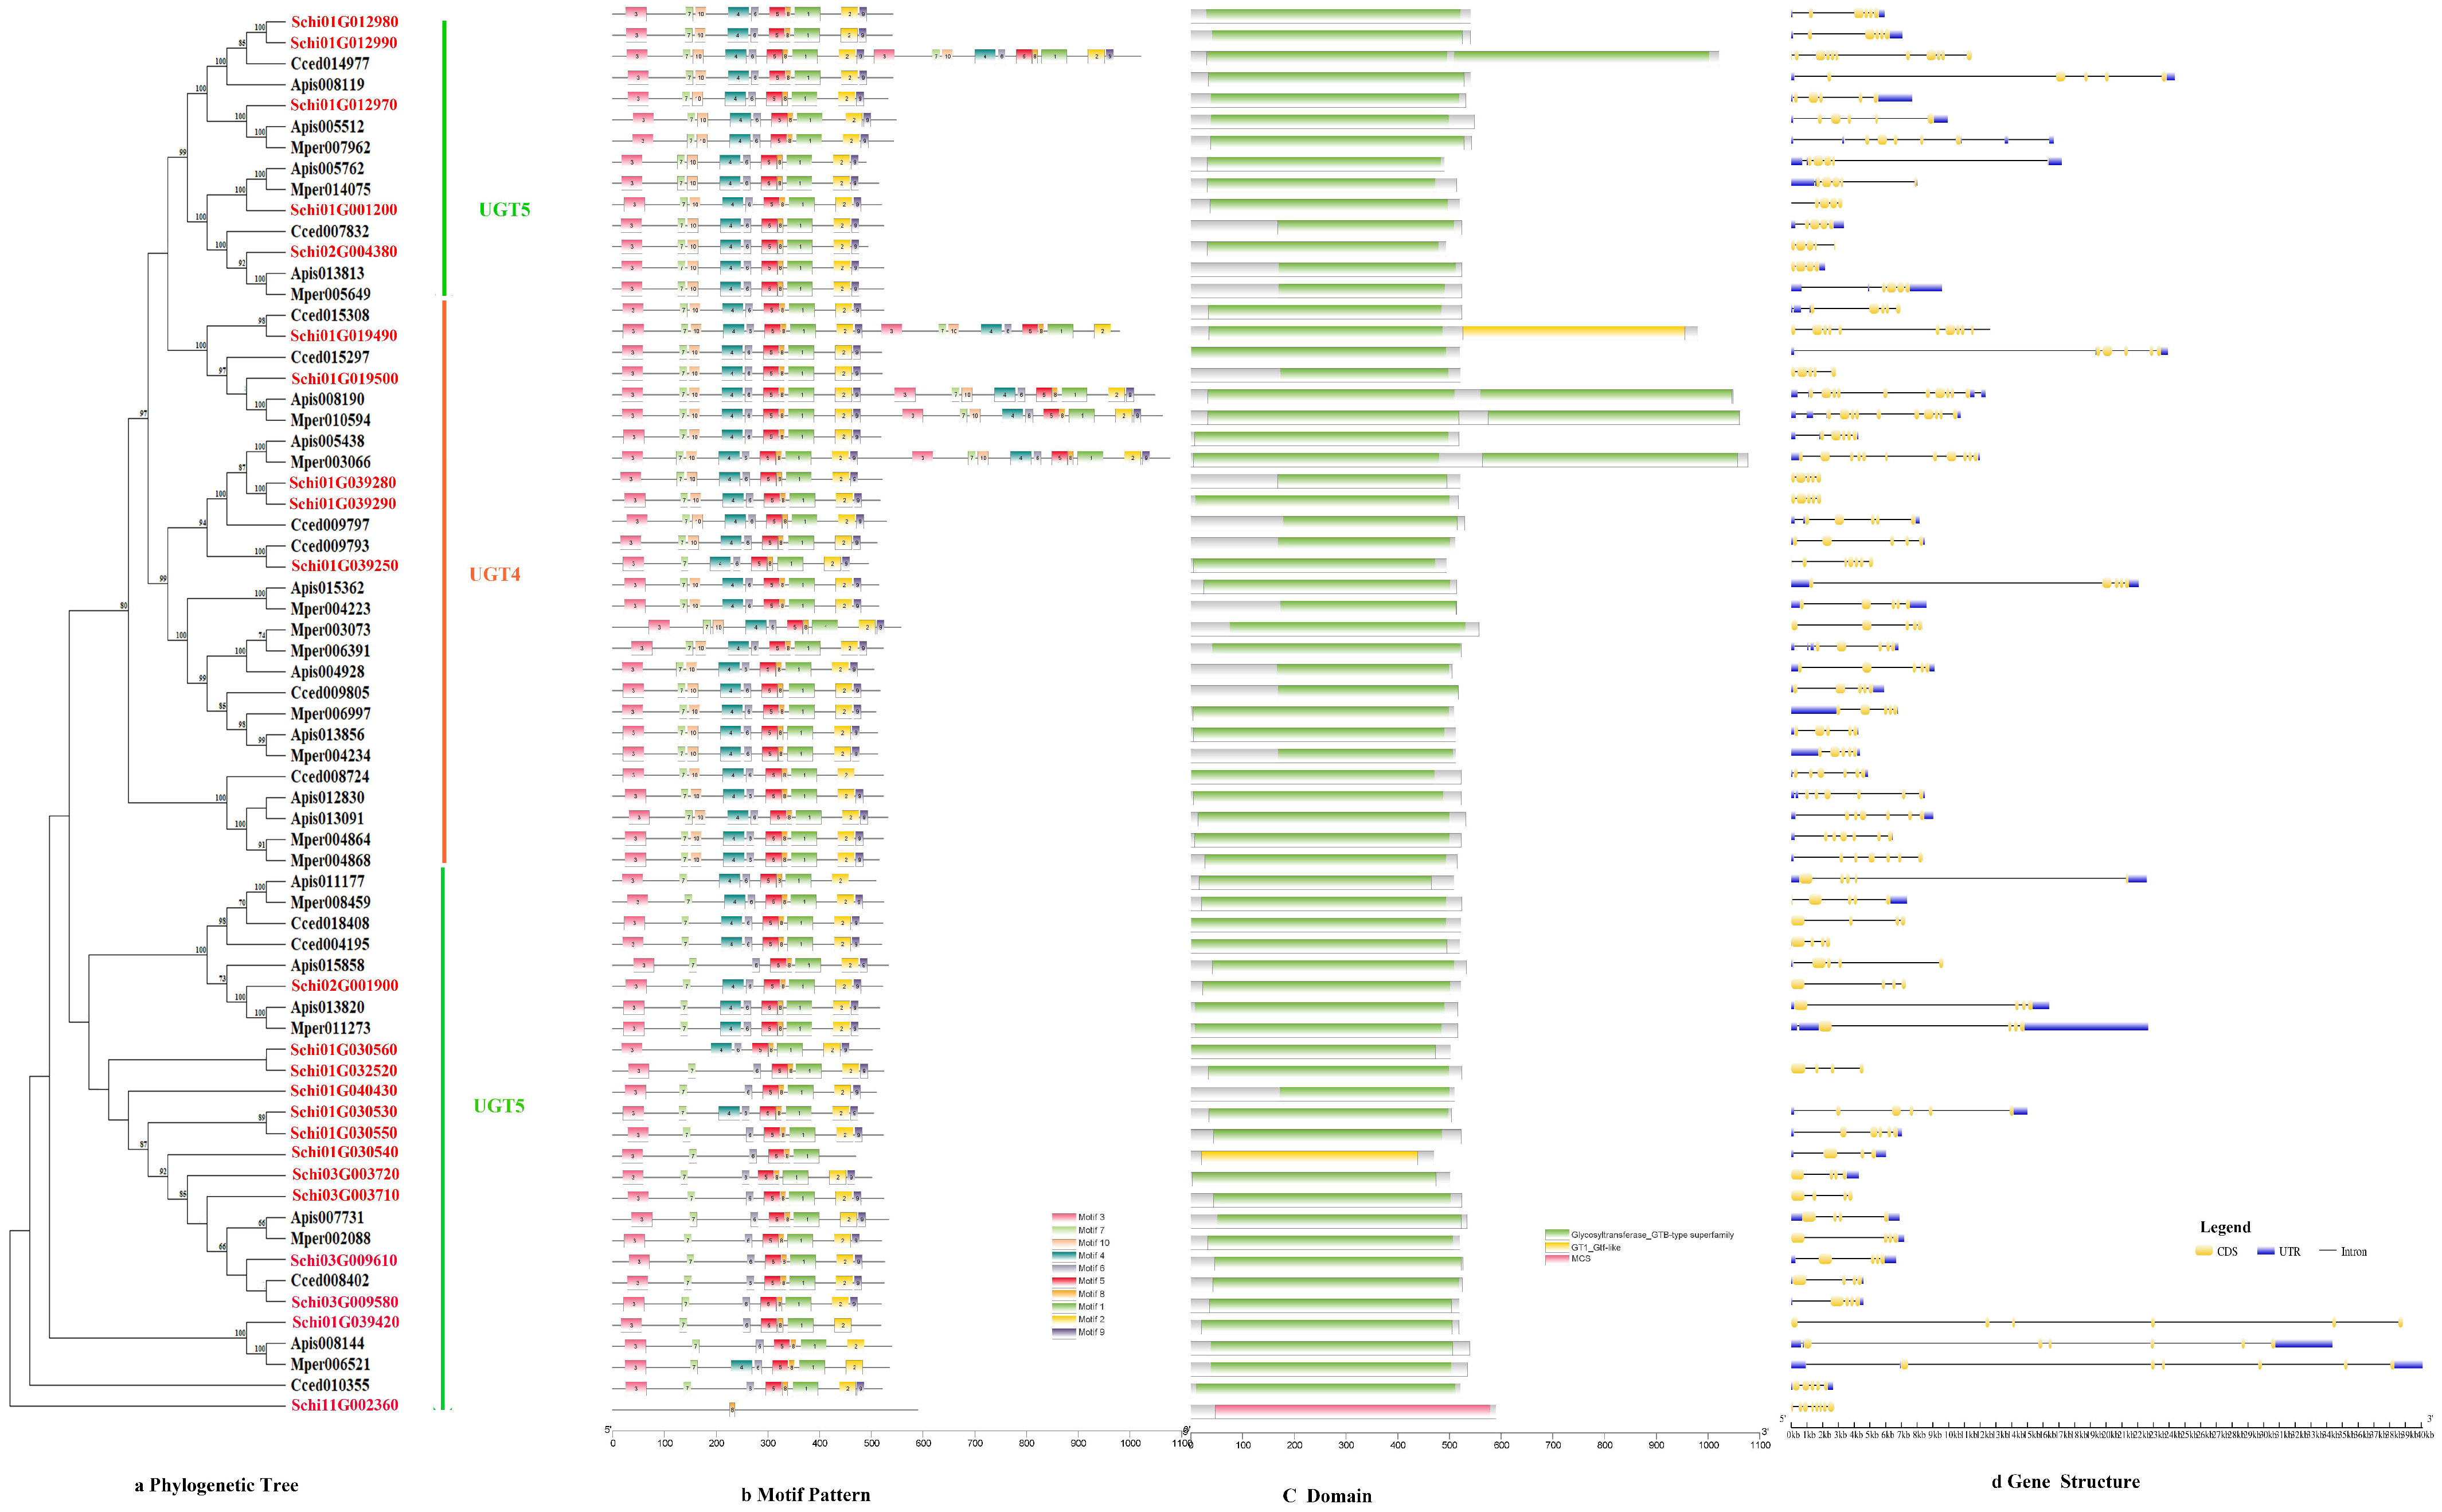
3.2.3. UDPs
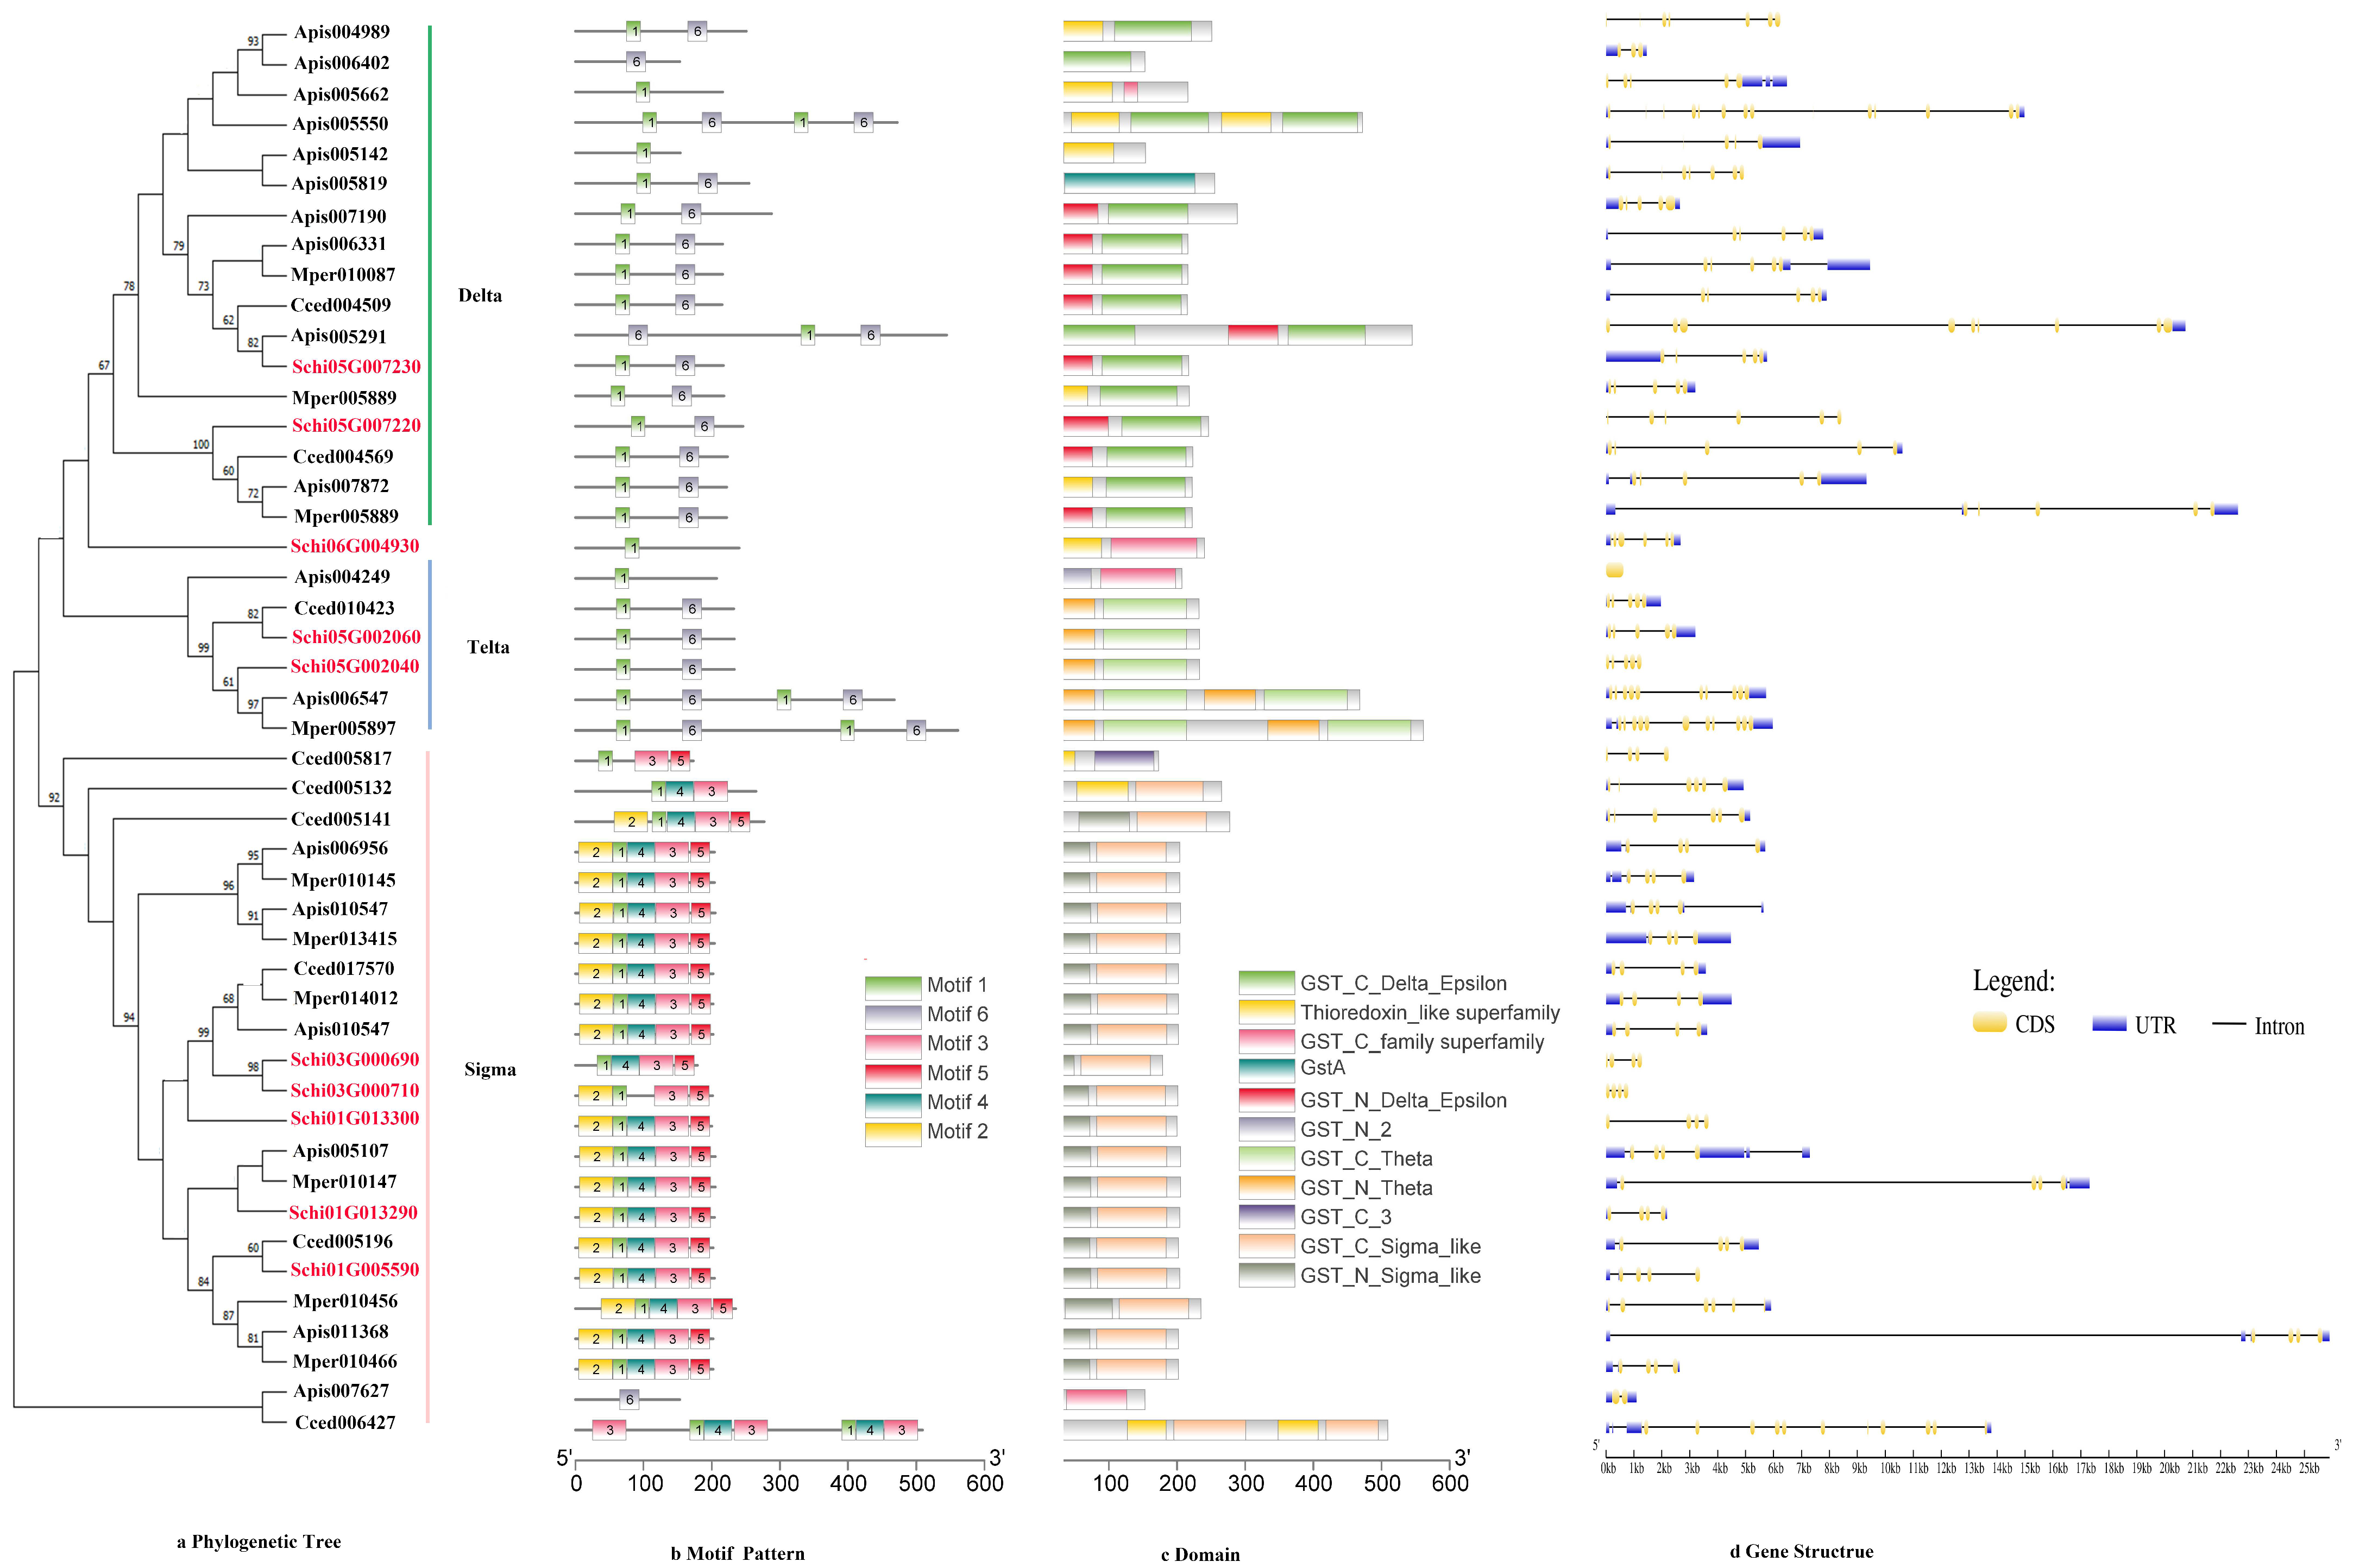
3.2.4. GSTs
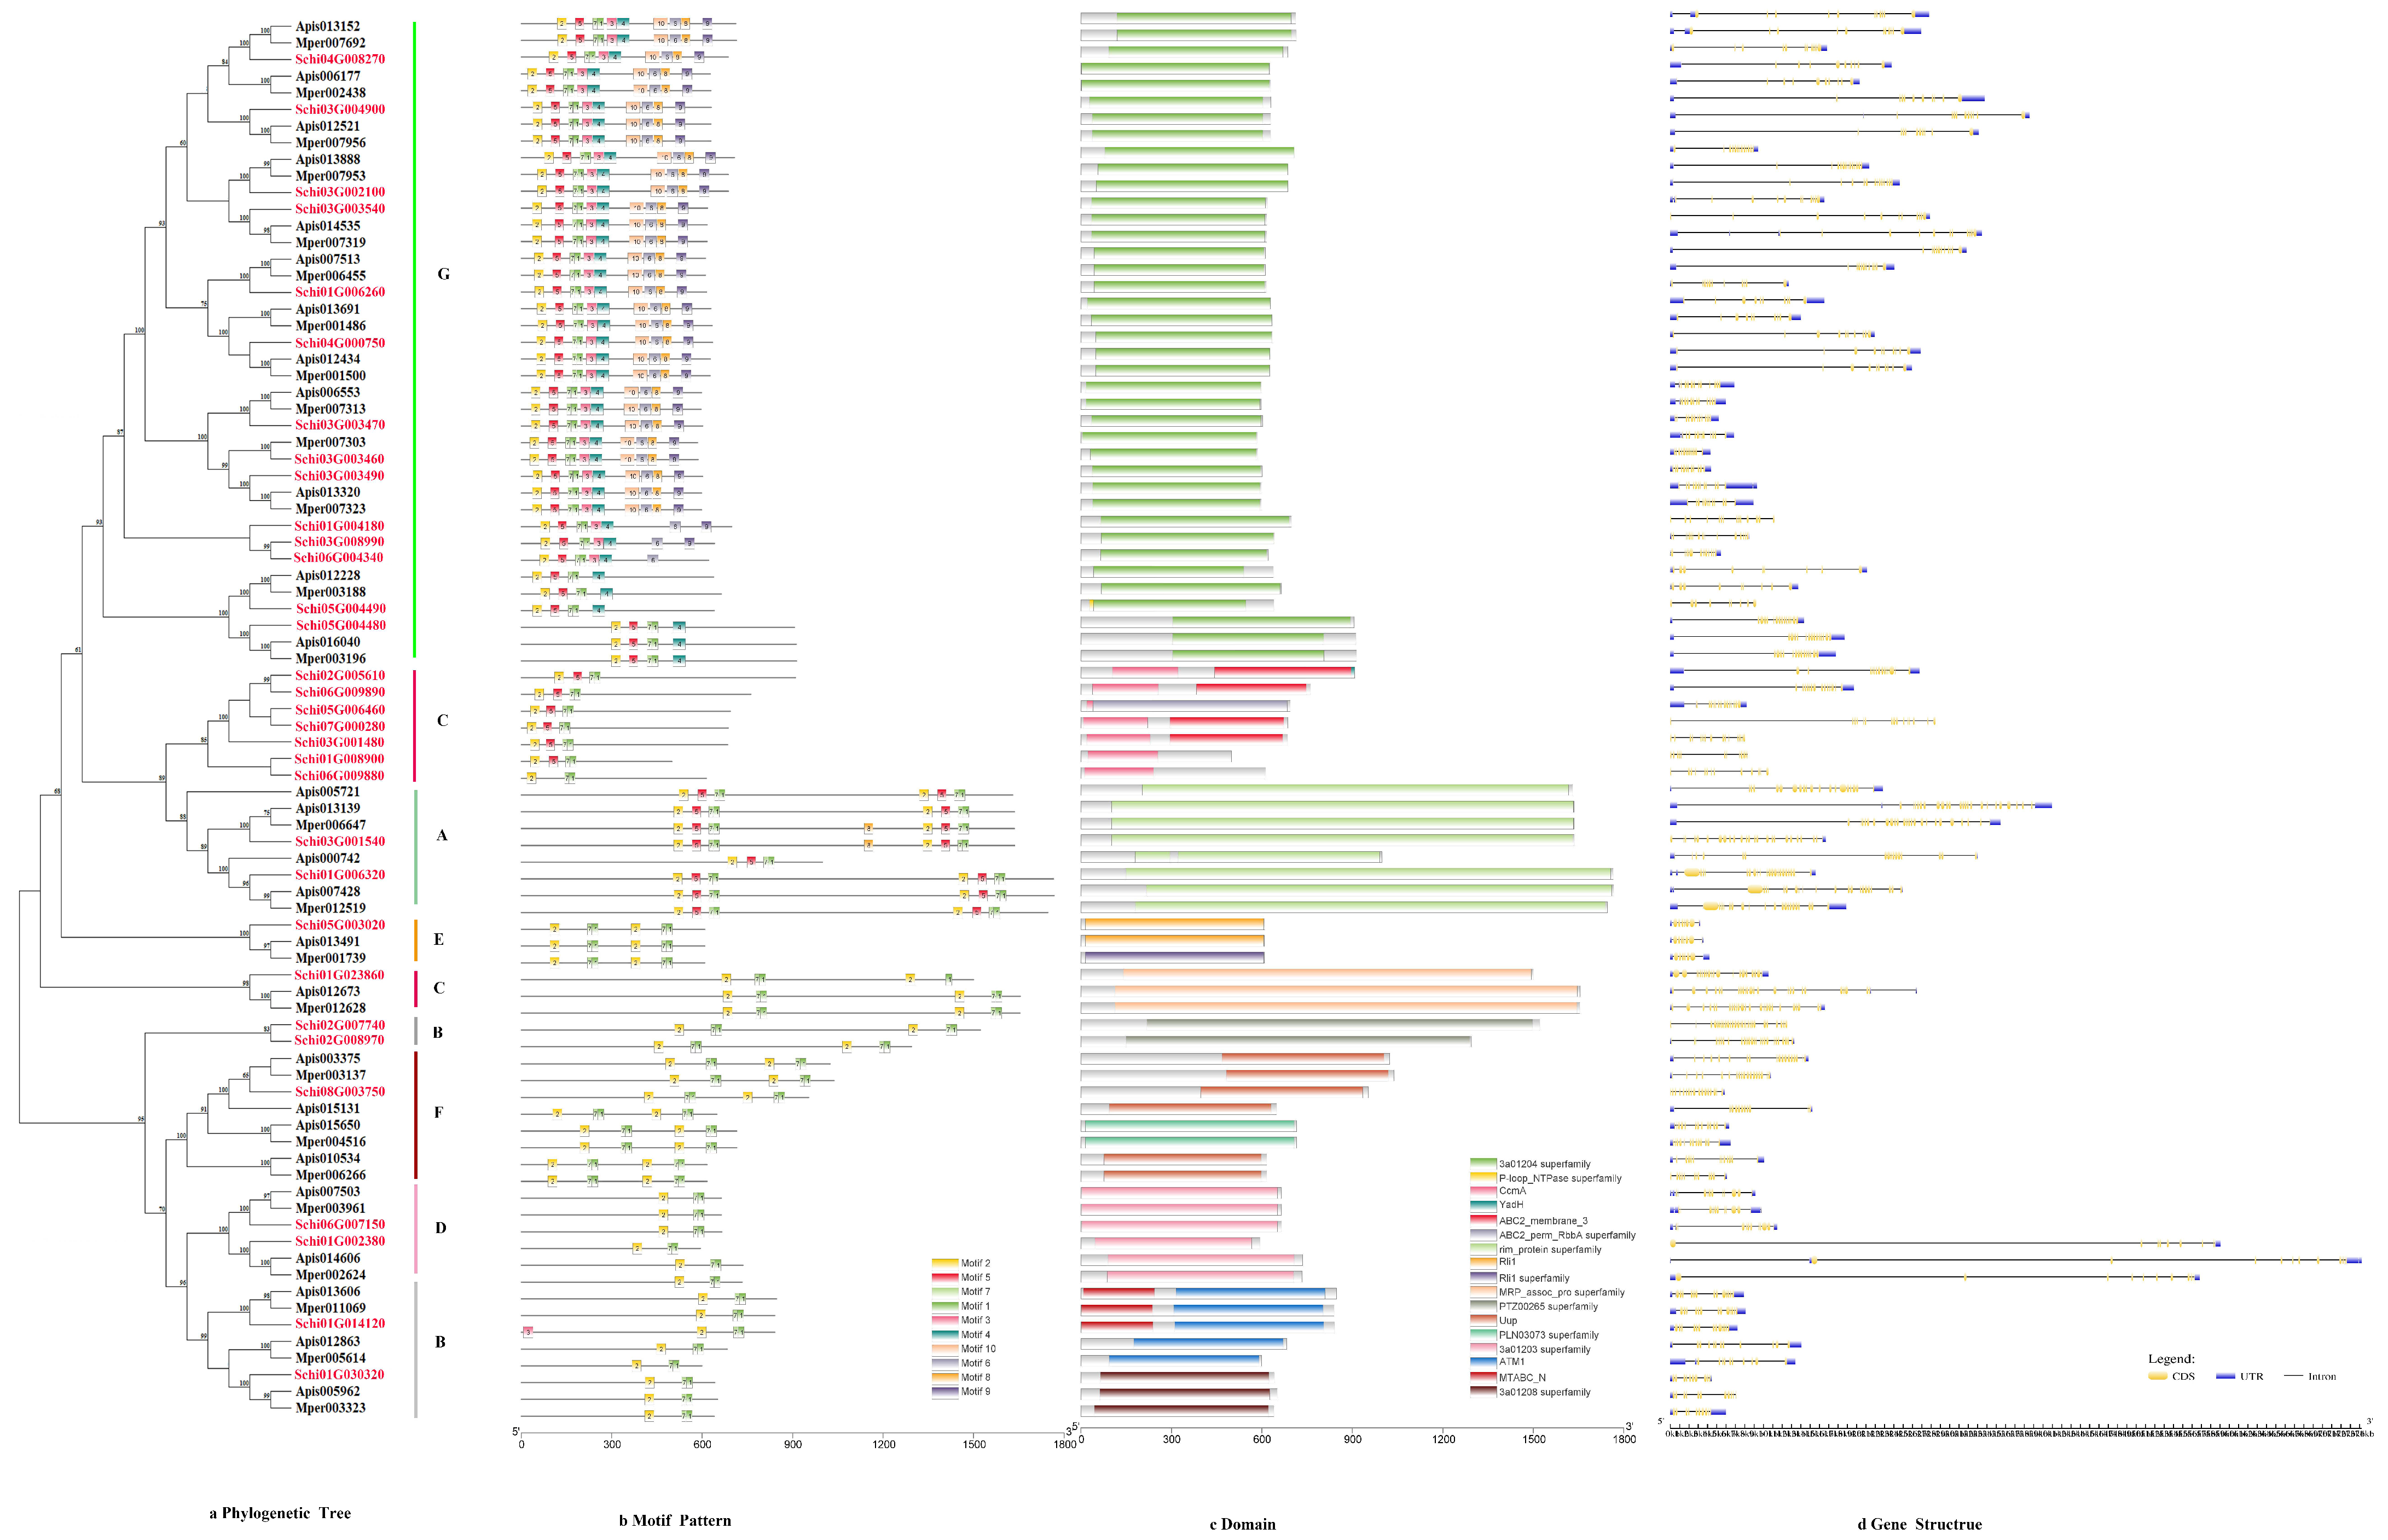
3.2.5. ABCs
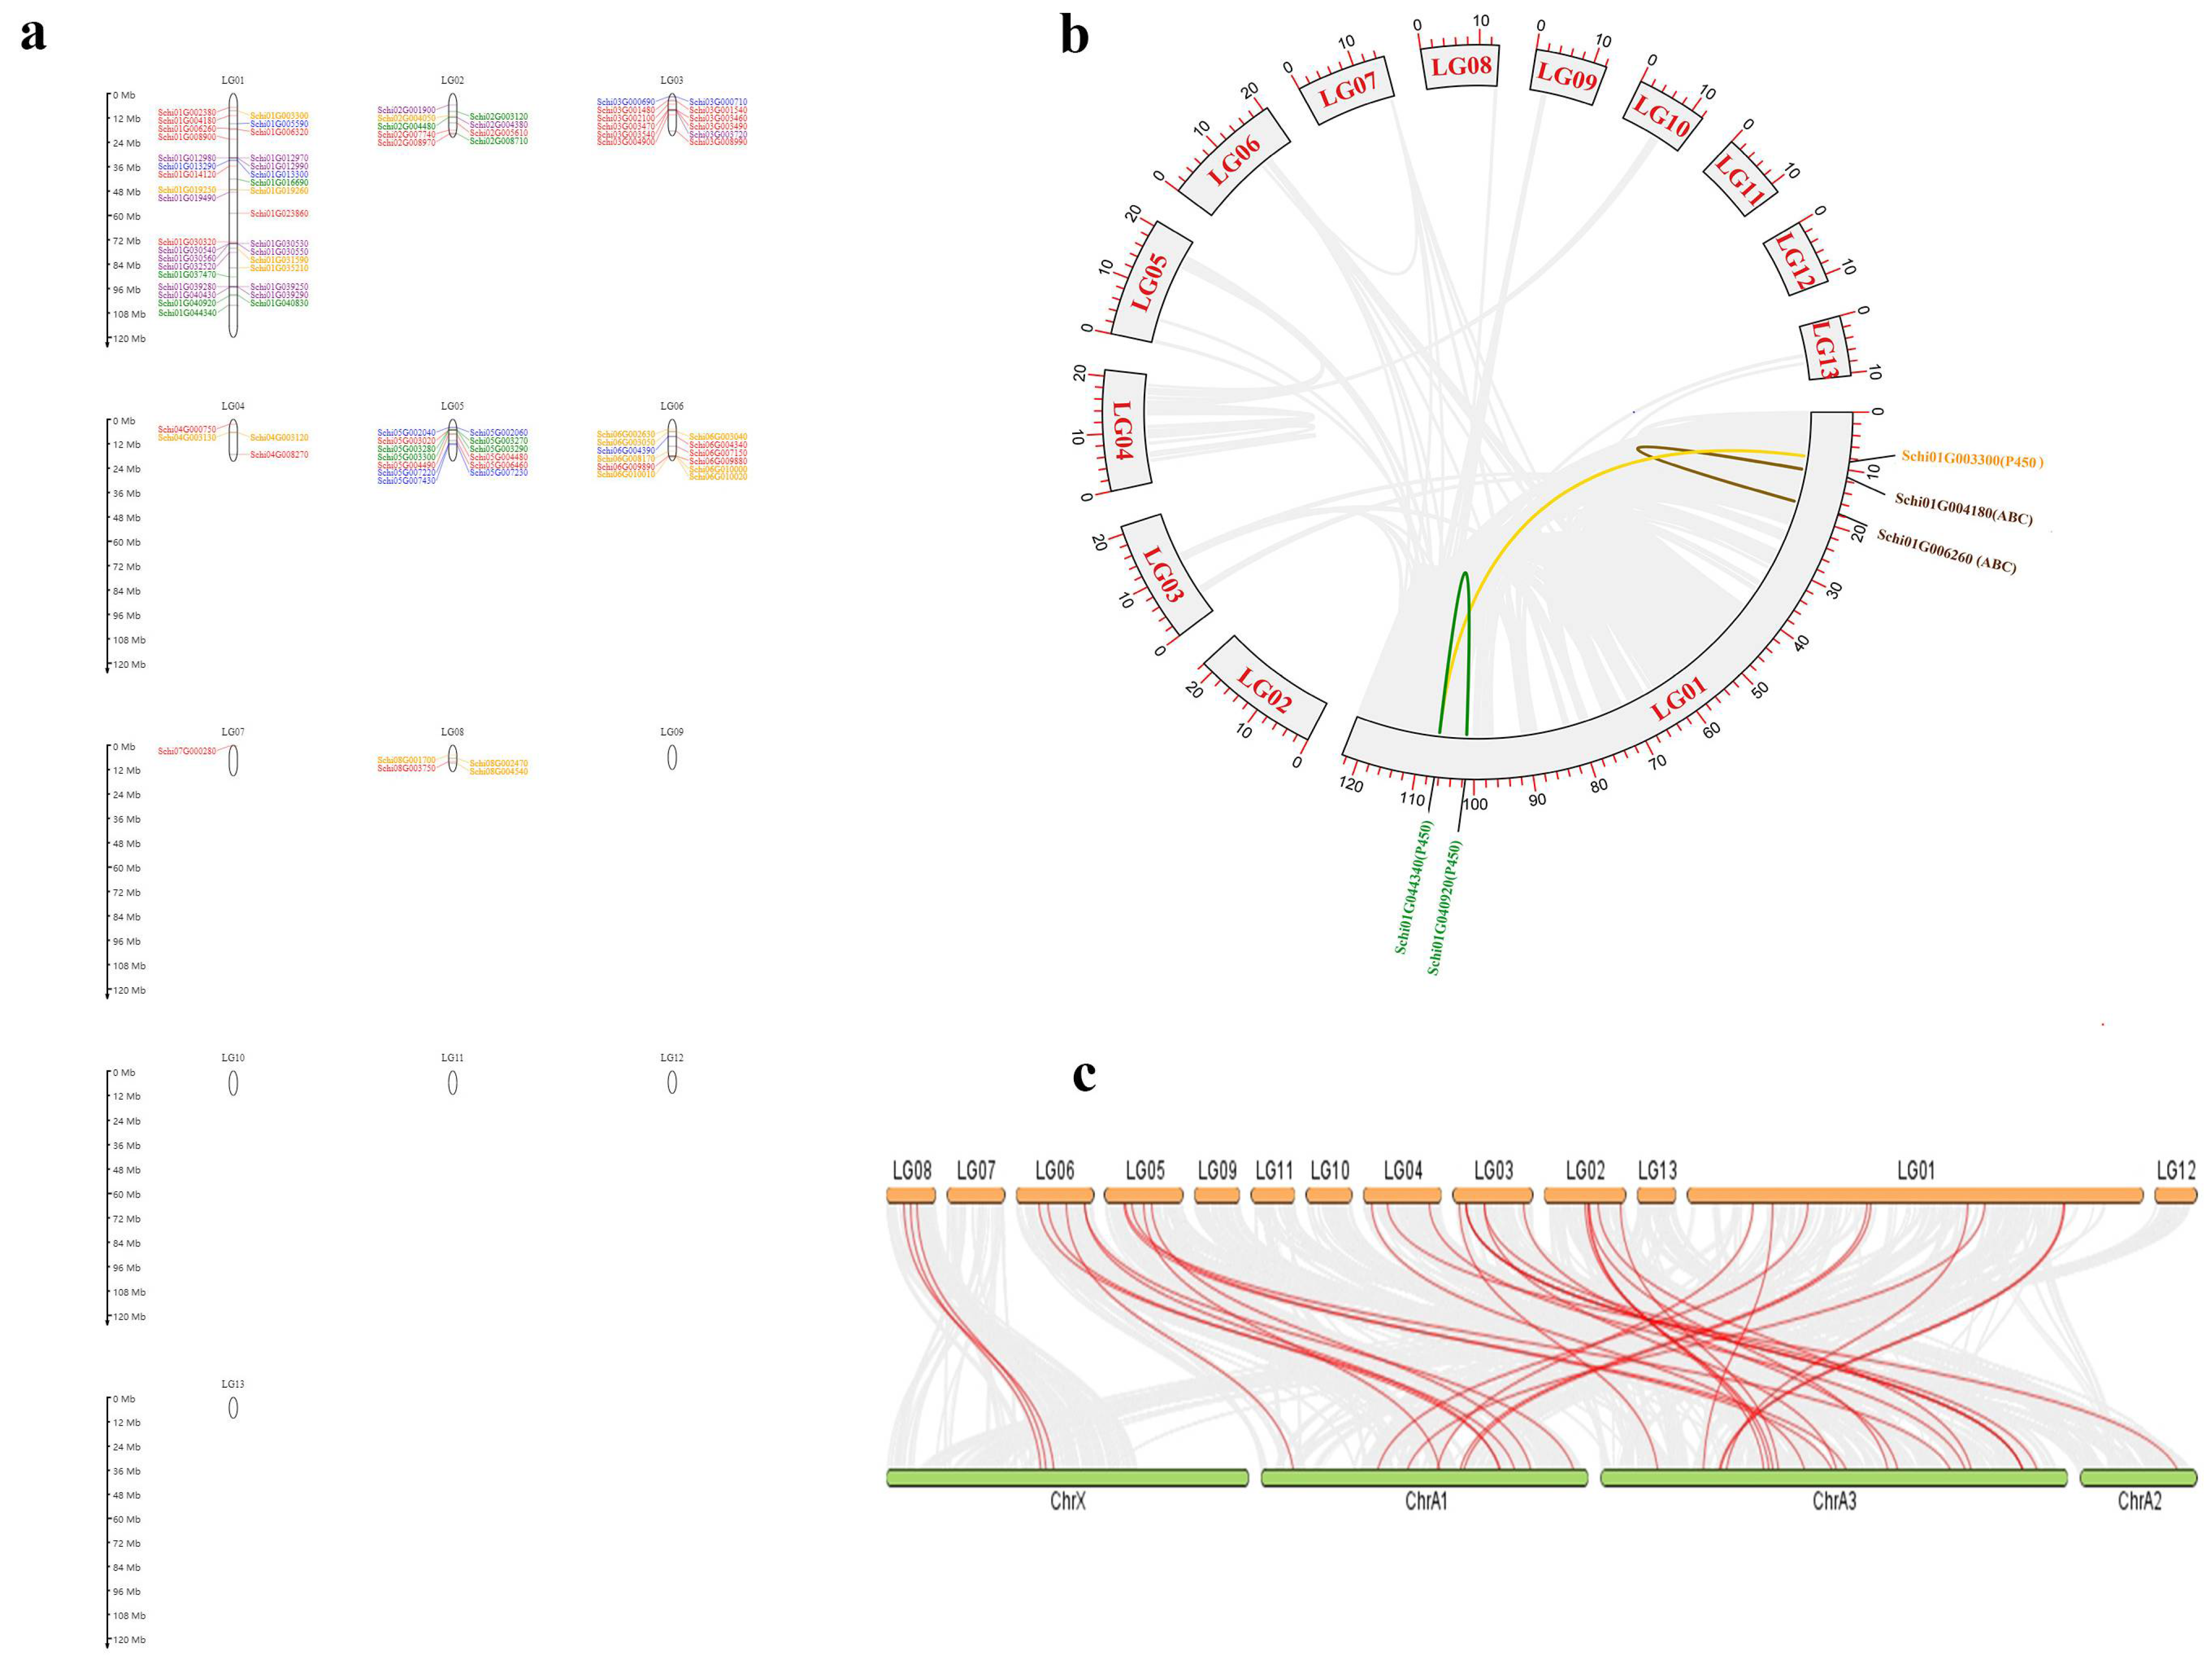
3.3. Chromosomal Location and Collinearity of Detoxification Genes of S. chinensis
3.4. Expression Profiles of Detoxification Genes in S. chinensis
3.5. Physicochemical Properties of Detoxification Gene Products in S. chinensis
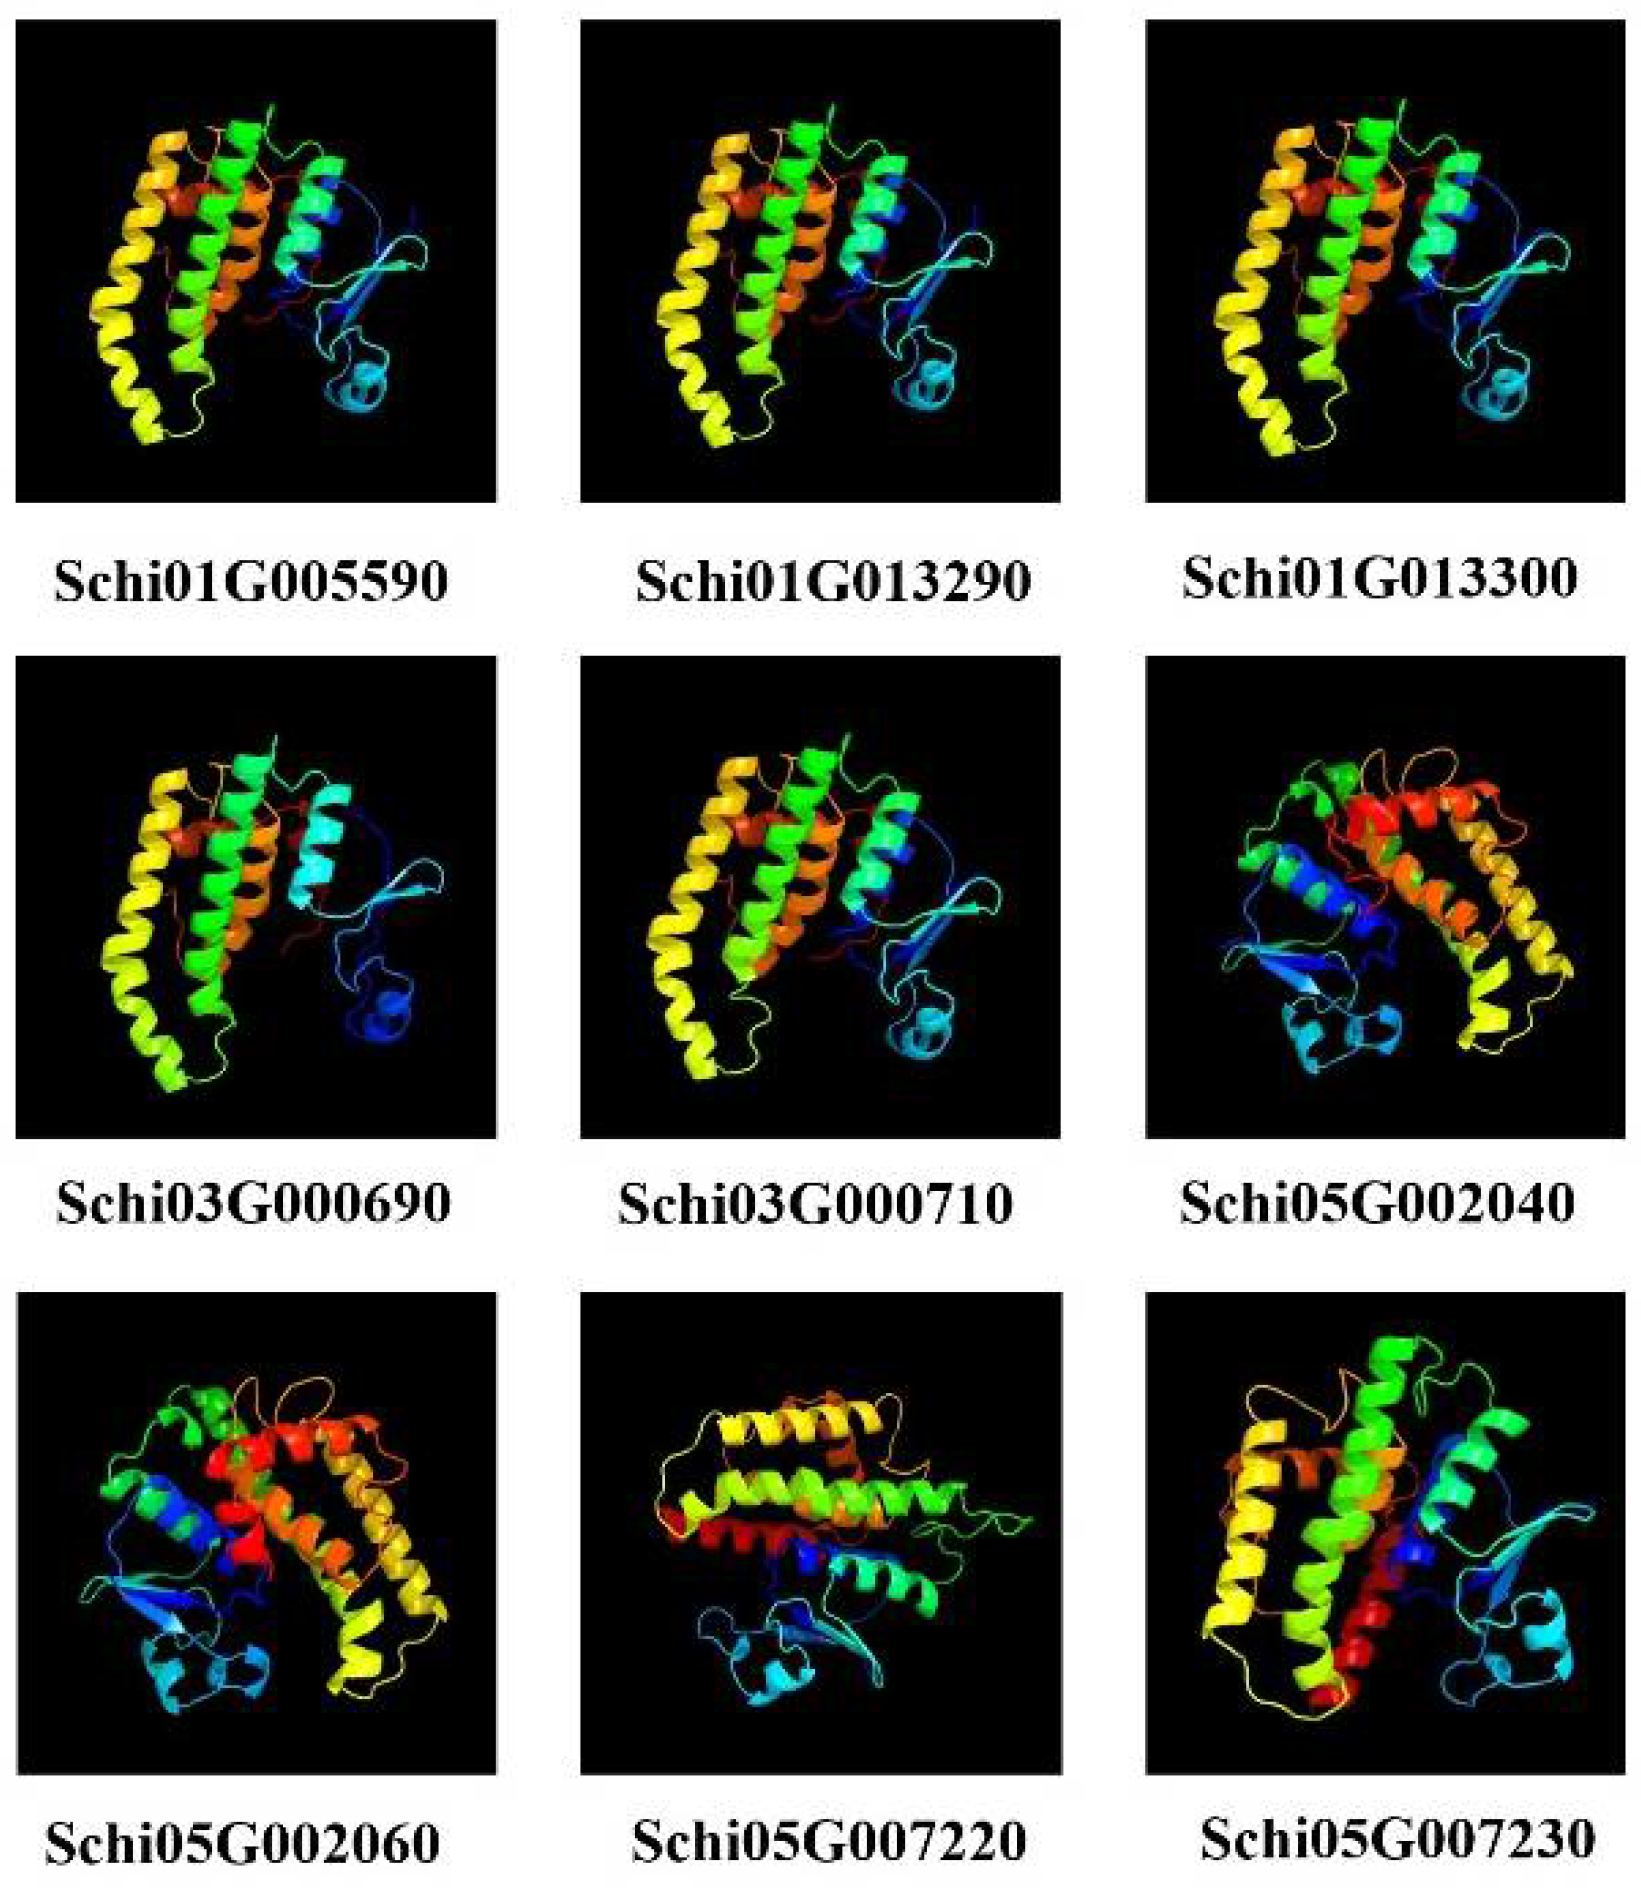
3.6. Prediction of Protein Multi-Level Structures of Detoxification Gene Products in S. chinensis
4. Discussion
4.1. Expansion and Contraction of Detoxification Genes in S. chinensis
4.2. Characteristics and Expression of the Detoxification Genes of S. chinensis
4.3. Collinearity, Chromosome Position and Evolutionary Rate of Detoxification Genes of S. chinensis
5. Conclusions
Author Contributions
Funding
Institutional Review Board Statement
Informed Consent Statement
Data Availability Statement
Conflicts of Interest
References
- Bell, J. Chinese galls. Pharmaceut. J. 1851, 10, 128. [Google Scholar]
- Tang, C.; Tsai, P.H. Studies on the Chinese gallnuts of meitan, Kweichow. Acta Entomol. Sin. 1957, 7, 131–142. [Google Scholar]
- Zhang, G.X.; Qiao, G.X.; Zhong, T.S.; Zhang, W.Y. Fauna Sinica Insecta. Homoptera: Mindaridae and Pemphigidae; Science Press: Beijing, China, 1999; p. 14. [Google Scholar]
- Baker, A.C. On the Chinese gall (Aphididae-Hom). Ent. News. 1917, 28, 385–393. [Google Scholar]
- Li, Z.G.; Yang, W.Y.; Xia, D.J. Study on the Chinese gallnuts. For. Res. 2003, 16, 760–767. [Google Scholar]
- Blackman, R.L.; Eastop, V.F. Aphids on the World’s Crops: An Identification and Information Guide; John Wiley and Sons: New York, NY, USA, 1984. [Google Scholar]
- Heie, O.E. The Aphidoidea (Hemiptera) of Fennoscandia and Denmark. I. General part, the families Mindaridae, Hormaphididae, Thelaxidae, Anoeciidae, and Pemphigidae. Fauna Entomol. Scand. 1980, 9, 206–207. [Google Scholar]
- Remaudière, G.; Remaudière, M. Catalogue of the World’s Aphididae (Homoptera Aphidoidea); INRA: Paris, France, 1997. [Google Scholar]
- Zhang, G.X.; Zhong, T.S. Economic Insect Fauna of China, Fasc. 25, Homoptera: Aphidinea; Science Press: Beijing, China, 1983. (In Chinese) [Google Scholar]
- Yang, Z.X.; Chen, X.M.; Nathan, H.; Feng, Y. Phylogeny of Rhus gall aphids (Hemiptera: Pemphigidae) based on combined molecular analysis of nuclear EF1a and mitochondrial COII genes. Entomol. Sci. 2010, 13, 351–357. [Google Scholar] [CrossRef]
- Chen, M.S. Inducible direct plant defense against insect herbivores: A review. Insect Sci. 2008, 15, 101–114. [Google Scholar] [CrossRef]
- Dermauw, W.; Van-Leeuwen, T. The ABC gene family in arthropods: Comparative genomics and role in insecticide transport and resistance. Insect Biochem. Mol. Biol. 2014, 45, 89–110. [Google Scholar] [CrossRef]
- Després, L.; David, J.P.; Gallet, C. The evolutionary ecology of insect resistance to plant chemicals. Trends Ecol. Evol. 2007, 22, 298–307. [Google Scholar] [CrossRef]
- Li, X.; Schuler, M.A.; Berenbaum, M.R. Molecular mechanisms of metabolic resistance to synthetic and natural xenobiotics. Annu. Rev. Entomol. 2007, 52, 231–253. [Google Scholar] [CrossRef]
- Urlacher, V.B.; Girhard, M. Cytochrome P450 Monooxygenases in Biotechnology and Synthetic Biology. Trends Biotechnol. 2019, 37, 882–897. [Google Scholar] [CrossRef] [PubMed]
- Chertemps, T.; Le-Goff, G.; Maïbèche, M.; Hilliou, F. Detoxification gene families in Phylloxera: Endogenous functions and roles in response to the environment. Comp. Biochem. Physiol. Part D Genom. Proteom. 2021, 40, 100867. [Google Scholar] [CrossRef] [PubMed]
- Oakeshott, J.G.; Devonshire, A.L.; Claudianos, C.; Sutherland, T.D.; Horne, I.; Campbell, P.M.; Ollis, D.L.; Russell, R.J. Comparing the organophosphorus and carbamate insecticide resistance mutations in cholin- and carboxyl-esterases. Chem. Biol. Interact. 2005, 157, 269–275. [Google Scholar] [CrossRef] [PubMed]
- Wu, X.M.; Xu, B.Y.; Si, F.L.; Li, J.; Yan, Z.T.; Yan, Z.W.; He, X.; Chen, B. Identification of carboxylesterase genes associated with pyrethroid resistance in the malaria vector Anopheles sinensis (Diptera: Culicidae). Pest Manag. Sci. 2018, 74, 159–169. [Google Scholar] [CrossRef]
- Jakoby, W.B.; Ziegler, D.M. The enzymes of detoxication. J. Biol. Chem. 1990, 265, 20715–20718. [Google Scholar] [CrossRef]
- Shi, H.; Pei, L.; Gu, S.; Zhu, S.; Wang, Y.; Zhang, Y.; Li, B. Glutathione S-transferase (GST) genes in the red flour beetle, Tribolium castaneum and comparative analysis with five additional insects. Genomics 2012, 100, 327–335. [Google Scholar] [CrossRef]
- Cheng, T.; Wu, J.; Wu, Y.; Chilukuri, R.V.; Huang, L.; Yamamoto, K. Genomic adaptation to polyphagy and insecticides in a major East Asian noctuid pest. Nat. Ecol. Evol. 2017, 1, 1747–1756. [Google Scholar] [CrossRef]
- Xiao, L.F.; Zhang, W.; Jing, T.X.; Zhang, M.Y.; Miao, Z.Q.; Wei, D.D.; Yuan, G.R.; Wang, J.J. Genome-wide identification, phylogenetic analysis, and expression profiles of ATP-binding cassette transporter genes in the oriental fruit fly, Bactrocera dorsalis (Hendel) (Diptera: Tephritidae). Comp. Biochem. Physiol. Part D Genom. Proteom. 2018, 25, 1–8. [Google Scholar] [CrossRef]
- Geer, L.Y.; Geer, R.C.; Gonzales, N.R. CDD: A conserved domain database for the functional annotation of proteins. Nucleic Acids Res. 2011, 39, 225–229. [Google Scholar]
- Kumar, S.; Stecher, G.; Li, M.; Knyaz, C.; Tamura, K. MEGA X: Molecular Evolutionary Genetics Analysis across Computing Platforms. Mol. Biol. Evol. 2018, 35, 1547–1549. [Google Scholar] [CrossRef]
- Bolger, A.M.; Marc, L.; Bjoern, U. Trimmomatic: A flexible trimmer for Illumina sequence data. Bioinformatics 2014, 15, 2114–2120. [Google Scholar] [CrossRef] [PubMed]
- Saitou, N.; Nei, M. The neighbor-joining method: A new method for reconstructing phylogenetic trees. Mol. Biol. Evol. 1987, 4, 406–425. [Google Scholar] [PubMed]
- Bailey, T.L.; Boden, M.; Buske, F.A.; Frith, M.; Grant, C.E.; Clementi, L.; Ren, J.Y.; Li, W.W.; Noble, W.S. MEME SUITE: Tools for motif discovery and searching. Nucleic Acids Res. 2009, 37, W202–W208. [Google Scholar] [CrossRef] [PubMed]
- Hu, B.; Jin, J.; Guo, A.-Y.; Zhang, H.; Luo, J.; Gao, G. GSDS 2.0: An upgraded gene features visualization server. Bioinformatics 2015, 31, 1296–1297. [Google Scholar] [CrossRef] [PubMed]
- Chen, C.; Chen, H.; Zhang, Y.; Thomas, H.R.; Xia, R. TBtools: An Integrative Toolkit Developed for Interactive Analyses of Big Biological Data. Mol. Plant 2020, 13, 289660. [Google Scholar] [CrossRef]
- Wang, Y.P.; Tang, H.B.; Debarry, J.D.; Tan, X.; Li, J.P.; Wang, X.Y.; Lee, T.; Jin, H.Z.; Marler, B.; Guo, H.; et al. MCScanX: A toolkit for detection and evolutionary analysis of gene synteny and collinearity. Nucleic Acids Res. 2012, 40, e49. [Google Scholar] [CrossRef] [Green Version]
- Krzywinski, M.; Schein, J.; Birol, I.; Connors, J.; Gascoyne, R.; Horsman, D.; Jones, S.J.; Marra, M.A. Circos: An information aesthetic for comparative genomics. Genome Res. 2009, 19, 1639–1645. [Google Scholar] [CrossRef]
- Zhang, Z.; Li, J.; Zhao, X.Q.; Wang, J.; Wong, G.K.; Yu, J. Ka Ks_Calculator: Calculating Ka and Ks through model selection and model averaging. Genom. Proteom. Bioinf. 2006, 4, 259–263. [Google Scholar] [CrossRef]
- Wang, D. An Improved TRIzol Method to Extract Total RNA from Skin Tissue of Rana dybowskii. Chin. J. Wildl. 2012, 33, 127–128. [Google Scholar]
- Sharon, D.; Tilgner, H.; Grubert, F.; Snyder, M. A single-molecule long-read survey of the human transcriptome. Nat. Biotechnol. 2013, 31, 1009–1014. [Google Scholar] [CrossRef]
- Mak, S.; Gopalakrishnan, S.; Car, E.C. Comparative performance of the BGISEQ-500 vs Illumina HiSeq2500 sequencing platforms for palaeogenomic sequencing. Giga Sci. 2017, 6, gix049. [Google Scholar] [CrossRef] [PubMed]
- Mckinney, G.J.; Hale, M.C.; Goetz, G.; Gribskov, M.; Thrower, F.P.; Nichols, K.M. Filtered trinity assembly. 2015, 8, 1494–1512. [Google Scholar]
- Deng, Y.Y.; Li, J.Q.; Wu, S.F.; Zhu, Y.P. Integrated NR Database in Protein Annotation System and Its Localization. Comput. Eng. 2006, 32, 71–74. [Google Scholar]
- Apweiler, R.; Bairoch, A.; Wu, C.H.; Barker, W.C. UniProt: The Universal Protein knowledgebase. Nucleic Acids Res. 2004, 132, D115–D119. [Google Scholar] [CrossRef]
- Ashburner, M.; Ball, C.A.; Blake, J.A.; Botstein, D. Gene ontology: Tool for the unification of biology. Nat. Genet. 2000, 25, 25–29. [Google Scholar] [CrossRef]
- Tatusov, R.L.; Galperin, M.Y.; Natale, D.A. The COG database: A tool for genome scale analysis of protein functions and evolution. Nucleic Acids Res. 2000, 28, 33–36. [Google Scholar] [CrossRef]
- Koonin, E.V.; Fedorova, N.D.; Jackson, J.D. A comprehensive evolutionary classification of proteins encoded in complete eukaryotic genomes. Genome Biol. 2004, 5, R7. [Google Scholar] [CrossRef]
- Finn, R.D.; Bateman, A.; Clements, J. Pfam: The protein families database. Nucleic Acids Res. 2013, 42, gkt1223. [Google Scholar]
- Kanehisa, M.; Goto, S.; Kawashima, S.; Okuno, Y. The KEGG resource for deciphering the genome. Nucleic Acids Res. 2004, 32, D277–D280. [Google Scholar] [CrossRef]
- Kazutaka, K.; Standley, D.M. A simple method to control over-alignment in the MAFFT multiple sequence alignment program. Bioinformatics 2016, 13, 1933–1942. [Google Scholar]
- Ison, J.; Kalas, M.; Jonassen, I.; Bolser, D.; Uludag, M.; McWilliam, H.; Malone, J.; Lopez, R.; Pettifer, S.; Rice, P. EDAM: An ontology of bioinformatics operations, types of data and identifiers, topics and formats. Bioinformatics 2013, 15, 1325–1332. [Google Scholar] [CrossRef] [PubMed] [Green Version]
- Almagro-Armenteros, J.J.; Tsirigos, K.D.; Sønderby, C.K.; Petersen, T.N.; Winther, O.; Brunak, S.; Nielsen, H. SignalP 5.0 improves signal peptide predictions using deep neural networks. Nat. Biotechnol. 2019, 37, 420–423. [Google Scholar] [CrossRef] [PubMed]
- Krogh, A.; Larsson, B.; Sonnhammer, E.L. Predicting transmembrane protein topology with a hidden Markov model: Application to complete genomes. J. Mol. Biol. 2001, 305, 567–580. [Google Scholar] [CrossRef] [PubMed]
- Geourjon, G. SOPMA: Significant improvements in protein secondary structure prediction by consensus prediction from multiple alignments. Comput. Appl. Biosci. 1995, 11, 681–684. [Google Scholar] [CrossRef] [PubMed]
- Kelley, L.A.; Mezulis, S.; Yates, C.M. The Phyre2 web portal for protein modeling, prediction and analysis. Nat. Protoc. 2015, 10, 845–858. [Google Scholar] [CrossRef] [PubMed]
- Ramsey, J.S.; Rider, D.S.; Walsh, T.K.; de Vos, M.; Gordon, K.H.; Ponnala, L.; Macmil, S.L.; Roe, B.A.; Jander, G. Comparative analysis of detoxification enzymes in Acyrthosiphon pisum and Myzus persicae. Insect Mol. Biol. 2010, 9, 155–164. [Google Scholar] [CrossRef]
- Julca, I.; Marcet-Houben, M.; Cruz, F.; Vargas-Chavez, C.; Johnston, J.S.; Gómez-Garrido, J.; Frias, L.; Corvelo, A.; Loska, D.; Cámara, F.; et al. Phylogenomics Identifies an Ancestral Burst of Gene Duplications Predating the Diversification of Aphidomorpha. Mol. Biol. Evol. 2020, 37, 730–756. [Google Scholar] [CrossRef]
- Feyereisen, R. Arthropod CYP omes illustrate the tempo and mode in P450 evolution. Biochim. Biophys. Acta Proteins Proteom. 2011, 1814, 19–28. [Google Scholar] [CrossRef]
- Dermauw, W.; van-Leeuwen, T.; Feyereisen, R. Diversity and evolution of the P450 family in arthropods. Insect Biochem. Mol. Biol. 2020, 127, 103490. [Google Scholar] [CrossRef]
- Mathers, T.C.; Chen, Y.; Kaithakottil, G.; Legeai, F.; Mugford, S.T.; Baa-Puyoulet, P. Rapid transcriptional plasticity of duplicated gene clusters enables a clonally reproducing aphid to colonize diverse plant species. Genome Biol. 2017, 18, 27. [Google Scholar] [CrossRef]
- Yates, A.D.; Michel, A. Mechanisms of aphid adaptation to host plant resistance. Curr. Opin. Insect Sci. 2018, 26, 41–49. [Google Scholar] [CrossRef] [PubMed]
- Lin, R.; Yang, M.; Yao, B. The phylogenetic and evolutionary analyses of detoxification gene families in Aphidinae species. PLoS ONE 2022, 17, e0263462. [Google Scholar] [CrossRef] [PubMed]
- Heidel-Fischer, H.M.; Vogel, H. Molecular mechanisms of insect adaptation to plant secondary compounds. Curr. Opin. Insect Sci. 2015, 8, 8–14. [Google Scholar] [CrossRef]
- Xu, Y.L.; He, P.; Zhang, L.; Fang, S.Q.; Dong, S.L.; Zhang, Y.J.; Li, F. Large-scale identification of odorant-binding proteins and chemosensory proteins from expressed sequence tags in insects. BMC Genom. 2009, 10, 632. [Google Scholar] [CrossRef] [PubMed]
- Cao, J.; Shi, F. Evolution of the RALF gene family in plants: Gene duplication and selection patterns, Evol. Bioinf. 2012, 8, 271–292. [Google Scholar] [CrossRef]
- Cannon, S.B.; Mitra, A.; Baumgarten, A.; Young, N.D.; May, G. The roles of segmental and tandem gene duplication in the evolution of large gene families in Arabidopsis thaliana. BMC Plant Biol. 2004, 4, 10. [Google Scholar] [CrossRef] [Green Version]


| Species | S. chinensis | A. pisum | C. cedri | M. persicae | |
|---|---|---|---|---|---|
| delta | 2 | 8 | 3 | 3 | |
| Sigma | 5 | 5 | 6 | 6 | |
| GST | Theta | 2 | 1 | 1 | 1 |
| other | 0 | 6 | 1 | 1 | |
| Microsomal | 0 | 2 | 3 | 2 | |
| Total | 9 | 22 | 14 | 13 | |
| ABC | A | 5 | 5 | 5 | 1 |
| B | 5 | 3 | 5 | 3 | |
| C | 15 | 1 | 1 | 0 | |
| D | 2 | 2 | 2 | 2 | |
| E | 1 | 1 | 1 | 1 | |
| F | 3 | 4 | 3 | 3 | |
| G | 24 | 22 | 33 | 13 | |
| Total | 55 | 38 | 50 | 23 | |
| CCE | Venom | 3 | 2 | 3 | 4 |
| Esterase | 6 | 18 | 12 | 20 | |
| Acetylcholinesterase | 2 | 8 | 3 | 2 | |
| neuroligins | 5 | 4 | 11 | 5 | |
| Pyrethroid | 2 | 2 | 0 | 2 | |
| Acyl-protein | 0 | 0 | 3 | 0 | |
| Pancreatic | 0 | 0 | 2 | 0 | |
| Total | 18 | 34 | 34 | 33 | |
| CYP | CYP2 | 15 | 10 | 14 | 10 |
| CYP6 | 5 | 23 | 7 | 25 | |
| CYP4 | 27 | 23 | 38 | 23 | |
| mito | 1 | 8 | 1 | 7 | |
| Total | 48 | 64 | 60 | 65 | |
| UDP | UGT4 | 7 | 8 | 8 | 10 |
| UGT5 | 7 | 10 | 9 | 10 | |
| Total | 14 | 18 | 17 | 20 | |
| Total detoxification genes number | 144 | 176 | 175 | 157 |
| Chromosome | Gene ID | Chromosome | Gene ID | Gene Family | Ka | Ks | Ka/Ks |
|---|---|---|---|---|---|---|---|
| ChrA1 | Apis007359 | LG01 | Schi01G019250 | P450s | 0.0960 | 1.1974 | 0.0802 |
| ChrA1 | Apis008190 | LG01 | Schi01G019490 | UDPs | 0.1782 | 1.1658 | 0.1529 |
| ChrA1 | Apis008119 | LG01 | Schi01G012970 | UDPs | 0.1767 | 0.6031 | 0.2930 |
| ChrA1 | Apis004941 | LG01 | Schi01G032520 | UDPs | 0.2523 | 1.2278 | 0.2055 |
| ChrA1 | Apis007513 | LG01 | Schi01G006260 | ABCs | 0.1484 | 1.0116 | 0.1467 |
| ChrA1 | Apis006331 | LG05 | Schi05G007220 | GSTs | 0.1966 | 1.0702 | 0.1837 |
| ChrA1 | Apis005733 | LG05 | Schi05G006460 | ABCs | 0.3801 | 1.5960 | 0.2382 |
| ChrA1 | Apis007503 | LG06 | Schi06G007150 | ABCs | 0.1901 | 0.7266 | 0.2616 |
| ChrA1 | Apis007306 | LG06 | Schi06G004390 | GSTs | 0.0826 | 3.3468 | 0.0247 |
| ChrA1 | Apis008003 | LG06 | Schi06G010000 | P450s | 0.1018 | 0.7825 | 0.1301 |
| ChrA1 | Apis005719 | LG06 | Schi06G003040 | P450s | 0.1275 | 2.1154 | 0.0603 |
| ChrA1 | Apis005195 | LG06 | Schi06G009880 | ABCs | 0.0255 | 1.2537 | 0.0203 |
| ChrA2 | Apis009460 | LG04 | Schi04G003120 | P450s | 0.1320 | 1.2539 | 0.1053 |
| ChrA3 | Apis010999 | LG01 | Schi01G040830 | P450s | 0.1155 | 1.2887 | 0.0897 |
| ChrA3 | Apis015091 | LG01 | Schi01G040920 | P450s | 0.2035 | 1.2475 | 0.1631 |
| ChrA3 | Apis014264 | LG01 | Schi01G008900 | ABCs | 0.1457 | 1.6398 | 0.0888 |
| ChrA3 | Apis013170 | LG01 | Schi01G030540 | UDPs | 0.0639 | 0.8659 | 0.0738 |
| ChrA3 | Apis011342 | LG02 | Schi02G004480 | CCEs | 0.4770 | 1.6018 | 0.2978 |
| ChrA3 | Apis011920 | LG02 | Schi02G004050 | P450s | 0.0970 | 1.0765 | 0.0901 |
| ChrA3 | Apis013813 | LG02 | Schi02G004380 | UDPs | 0.0807 | 0.7942 | 0.1017 |
| ChrA3 | Apis016003 | LG02 | Schi02G008970 | ABCs | 0.0530 | 0.7650 | 0.0693 |
| ChrA3 | Apis012170 | LG02 | Schi02G005610 | ABCs | 0.0683 | 0.6467 | 0.1055 |
| ChrA3 | Apis015017 | LG02 | Schi02G004480 | CCEs | 0.0121 | 0.5458 | 0.0222 |
| ChrA3 | Apis013379 | LG03 | Schi03G008990 | ABCs | 0.0307 | 0.8186 | 0.0375 |
| ChrA3 | Apis015108 | LG03 | Schi03G001540 | ABCs | 0.0462 | 0.9221 | 0.0501 |
| ChrA3 | Apis013979 | LG03 | Schi03G003720 | UDPs | 0.3973 | 1.2232 | 0.3248 |
| ChrA3 | Apis015779 | LG03 | Schi03G000690 | GSTs | 0.2557 | 2.9061 | 0.0880 |
| ChrA3 | Apis013557 | LG03 | Schi03G001480 | ABCs | 0.1222 | 1.6464 | 0.0742 |
| ChrA3 | Apis013139 | LG03 | Schi03G001540 | ABCs | 0.1233 | 1.8349 | 0.0672 |
| ChrA3 | Apis015626 | LG03 | Schi03G003720 | UDPs | 0.0960 | 1.1974 | 0.0802 |
| ChrA3 | Apis012434 | LG04 | Schi04G000750 | ABCs | 0.1782 | 1.1658 | 0.1529 |
| ChrA3 | Apis013152 | LG04 | Schi04G008270 | ABCs | 0.1767 | 0.6031 | 0.2930 |
| ChrA3 | Apis016040 | LG05 | Schi05G004480 | ABCs | 0.2523 | 1.2278 | 0.2055 |
| ChrA3 | Apis013491 | LG05 | Schi05G003020 | ABCs | 0.1484 | 1.0116 | 0.1467 |
| ChrA3 | Apis013103 | LG05 | Schi05G003270 | CCEs | 0.1966 | 1.0702 | 0.1837 |
| ChrX | Apis002253 | LG08 | Schi08G001700 | P450s | 0.3801 | 1.5960 | 0.2382 |
| ChrX | Apis002712 | LG08 | Schi08G002470 | P450s | 0.1901 | 0.7266 | 0.2616 |
| ChrX | Apis003375 | LG08 | Schi08G003750 | ABCs | 0.0826 | 3.3468 | 0.0247 |
| Gene Family | Gene ID | Transcriptome ID | A4601 | A4603 | A4621 |
|---|---|---|---|---|---|
| ABCs | Schi05G003020 | TRINITY_DN11865_c0_g1 | 14.69 | 31.81 | 10.8 |
| Schi01G030320 | TRINITY_DN15325_c0_g1 | 4.37 | 9.1 | 3.15 | |
| Schi03G004900 | TRINITY_DN1743_c0_g1 | 58.06 | 31.76 | 58.18 | |
| Schi02G007740 | TRINITY_DN217_c0_g1 | 48.23 | 30.84 | 44.34 | |
| Schi03G001540 | TRINITY_DN3732_c0_g1 | 45.22 | 41.05 | 45.98 | |
| Schi01G023860 | TRINITY_DN4691_c0_g1 | 4.4 | 11.24 | 3.2 | |
| Schi08G003750 | TRINITY_DN5271_c0_g1 | 9.21 | 24.36 | 6.8 | |
| Schi01G006320 | TRINITY_DN6971_c0_g2 | 12.12 | 30.29 | 8.88 | |
| Schi01G030320 | TRINITY_DN7197_c0_g1 | 7.91 | 19.44 | 6.43 | |
| Schi02G008970 | TRINITY_DN7586_c0_g2 | 59.9 | 45.04 | 36.17 | |
| Schi06G007150 | TRINITY_DN761_c0_g1 | 33.79 | 52.68 | 30.66 | |
| Schi03G003460 | TRINITY_DN8762_c0_g1 | 15.04 | 36.19 | 10.17 | |
| Schi01G002380 | TRINITY_DN9280_c0_g3 | 98.6 | 79.59 | 117.28 | |
| CCEs | Schi05G003310 | TRINITY_DN204_c0_g1 | 62.97 | 68.46 | 62.34 |
| Schi02G003120 | TRINITY_DN3432_c0_g1 | 35.65 | 23.98 | 36.87 | |
| Schi05G003270 | TRINITY_DN400_c0_g2 | 151.5 | 142.6 | 87.47 | |
| Schi05G003280 | TRINITY_DN400_c0_g3 | 16.68 | 33.05 | 14.58 | |
| Schi02G008710 | TRINITY_DN433_c0_g1 | 63.77 | 51.81 | 44.62 | |
| Schi06G007520 | TRINITY_DN5_c0_g1 | 9.38 | 6.88 | 11.28 | |
| Schi02G004480 | TRINITY_DN5_c0_g2 | 67.24 | 45.68 | 70.95 | |
| Schi03G008370 | TRINITY_DN6210_c0_g1 | 2.54 | 4.9 | 2.21 | |
| Schi01G016690 | TRINITY_DN9661_c0_g1 | 6.44 | 15.25 | 3.19 | |
| GSTs | Schi01G005590 | TRINITY_DN1619_c0_g1 | 243.24 | 358.54 | 153.26 |
| Schi06G004390 | TRINITY_DN1656_c0_g1 | 66.68 | 94.35 | 46.85 | |
| Schi05G002040 | TRINITY_DN2301_c0_g1 | 30.17 | 36.47 | 19.08 | |
| Schi05G002060 | TRINITY_DN2393_c0_g1 | 23.44 | 47.37 | 20.04 | |
| Schi01G013300 | TRINITY_DN4283_c0_g1 | 10.46 | 7.58 | 6.84 | |
| Schi01G013290 | TRINITY_DN7068_c0_g1 | 11.88 | 7.23 | 7.74 | |
| Schi01G005590 | TRINITY_DN1619_c0_g1 | 243.24 | 358.54 | 153.26 | |
| P450s | Schi01G035210 | TRINITY_DN12170_c0_g1 | 1.64 | 2.36 | 1.66 |
| Schi01G003300 | TRINITY_DN12662_c0_g1 | 159.04 | 172.47 | 169.26 | |
| Schi05G007430 | TRINITY_DN13254_c0_g1 | 3.1 | 9.25 | 0 | |
| Schi06G002630 | TRINITY_DN13524_c0_g2 | 5.09 | 9.8 | 3.91 | |
| Schi04G003130 | TRINITY_DN1463_c0_g1 | 27.16 | 46.06 | 29.89 | |
| Schi05G007400 | TRINITY_DN1506_c0_g1 | 45.49 | 15.18 | 22.98 | |
| Schi06G003040 | TRINITY_DN18244_c0_g1 | 2.71 | 5.45 | 1.97 | |
| Schi05G007440 | TRINITY_DN19060_c0_g1 | 0 | 8.66 | 0 | |
| Schi06G003050 | TRINITY_DN2747_c0_g1 | 71.64 | 22.18 | 57.66 | |
| Schi01G040920 | TRINITY_DN3861_c0_g1 | 6.54 | 6.95 | 5.63 | |
| Schi01G031590 | TRINITY_DN4207_c0_g1 | 21.92 | 8.28 | 23.68 | |
| Schi06G008170 | TRINITY_DN4410_c0_g1 | 5.75 | 20.11 | 4.91 | |
| Schi08G004540 | TRINITY_DN6310_c0_g1 | 11.6 | 26.8 | 9.39 | |
| Schi02G004050 | TRINITY_DN7229_c0_g1 | 11.07 | 13.29 | 4.56 | |
| Schi06G010020 | TRINITY_DN7575_c0_g1 | 4.26 | 0.54 | 0.4 | |
| Schi06G010020 | TRINITY_DN7575_c0_g3 | 4.73 | 0 | 0 | |
| Schi01G040830 | TRINITY_DN9199_c0_g1 | 1.92 | 0.19 | 1.37 | |
| Schi08G002470 | TRINITY_DN9598_c0_g2 | 112.17 | 167.03 | 51.8 | |
| Schi04G003120 | TRINITY_DN9796_c0_g1 | 41.5 | 74.21 | 39.17 | |
| UDPs | Schi01G019500 | TRINITY_DN10423_c1_g1 | 1.26 | 3.27 | 0.94 |
| Schi01G039250 | TRINITY_DN12730_c0_g2 | 1.31 | 9.08 | 5.64 | |
| Schi01G040430 | TRINITY_DN13038_c0_g1 | 2.31 | 1.89 | 1.81 | |
| Schi01G039420 | TRINITY_DN1305_c0_g2 | 3.84 | 2.98 | 1.74 | |
| Schi03G003710 | TRINITY_DN18843_c0_g1 | 146.64 | 80.5 | 57.87 | |
| Schi01G012970 | TRINITY_DN2128_c0_g1 | 22.23 | 23.55 | 22.69 | |
| Schi03G009580 | TRINITY_DN317_c0_g1 | 15.2 | 12.18 | 9.12 | |
| Schi01G001200 | TRINITY_DN3281_c0_g1 | 4.04 | 11.34 | 3.64 | |
| Schi03G003720 | TRINITY_DN7236_c0_g1 | 4.15 | 4.55 | 6.76 | |
| Schi01G030560 | TRINITY_DN8152_c0_g1 | 64.69 | 106.98 | 50.32 | |
| Schi01G030530 | TRINITY_DN8293_c0_g1 | 9.97 | 15.36 | 10.36 |
| Sequence ID | Number of Amino Acid | Molecular Weight | Theoretical pI | Instability Index | Aliphatic Index | Grand Average of Hydropathicity |
|---|---|---|---|---|---|---|
| Schi01G002380 | 593 | 65274 | 9.14 | 38.36 | 93.19 | −0.032 |
| Schi01G004180 | 697 | 78885.97 | 8.01 | 43.68 | 87.99 | −0.105 |
| Schi01G006260 | 613 | 69226.58 | 8.24 | 34.52 | 104.44 | 0.062 |
| Schi01G006320 | 1764 | 199951.12 | 6.69 | 32.6 | 100.96 | 0.084 |
| Schi01G008900 | 498 | 57553.93 | 8.99 | 40.15 | 99.04 | −0.086 |
| Schi01G014120 | 840 | 95851.13 | 6.94 | 33.89 | 112.86 | 0.279 |
| Schi01G023860 | 1499 | 170713.27 | 8.49 | 36.64 | 109.17 | 0.231 |
| Schi01G030320 | 641 | 71130.22 | 9.58 | 35.86 | 110.11 | 0.168 |
| Schi02G005610 | 908 | 100248.13 | 8.01 | 49.66 | 95.9 | 0.071 |
| Schi02G007740 | 1521 | 167840.78 | 6.38 | 41.08 | 89.57 | −0.134 |
| Schi02G008970 | 1293 | 142261.06 | 6.3 | 34.07 | 91.01 | −0.01 |
| Schi03G001480 | 684 | 76921.85 | 6.71 | 41.96 | 99.37 | 0.186 |
| Schi03G001540 | 1635 | 185425.46 | 8.04 | 35.94 | 90.94 | 0.017 |
| Schi03G002100 | 686 | 77033.25 | 9.02 | 41.24 | 96.47 | 0.054 |
| Schi03G003460 | 585 | 66430.83 | 8.85 | 35.58 | 105.85 | 0.306 |
| Schi03G003470 | 601 | 69150.27 | 8.86 | 28.79 | 106.67 | 0.192 |
| Schi03G003490 | 600 | 68562.17 | 8.96 | 36.69 | 100.35 | 0.149 |
| Schi03G003540 | 617 | 69493.45 | 8.19 | 32.78 | 100.29 | 0.212 |
| Schi03G004900 | 629 | 71054.84 | 8.31 | 42.09 | 92.05 | 0.1 |
| Schi03G008990 | 640 | 71570.56 | 7 | 39.29 | 95.33 | 0.097 |
| Schi04G000750 | 633 | 71548.71 | 8.55 | 36.92 | 94.04 | 0.085 |
| Schi04G008270 | 685 | 76112.09 | 8.65 | 33.16 | 93.18 | 0.053 |
| Schi05G003020 | 608 | 68690.7 | 8.34 | 35.97 | 95.21 | −0.235 |
| Schi05G004480 | 905 | 101044.93 | 8.95 | 49.4 | 91.8 | −0.127 |
| Schi05G004490 | 639 | 71771.98 | 8.74 | 39.2 | 92.35 | 0.085 |
| Schi05G006460 | 693 | 77850.75 | 6.83 | 45.54 | 96.44 | 0.101 |
| Schi06G004340 | 620 | 69928.82 | 8.79 | 29.38 | 112.35 | 0.278 |
| Schi06G007150 | 664 | 75912.44 | 9.47 | 33.85 | 95.99 | −0.088 |
| Schi06G009880 | 612 | 69573.74 | 6.58 | 43 | 105.23 | 0.053 |
| Schi06G009890 | 760 | 84442.58 | 6.55 | 48.21 | 101.42 | 0.219 |
| Schi07G000280 | 685 | 76153.91 | 7.76 | 42.6 | 106.98 | 0.237 |
| Schi08G003750 | 952 | 107624.75 | 5.34 | 39.13 | 82.31 | −0.81 |
| Schi01G016690 | 821 | 93445.09 | 6.75 | 40.89 | 76.86 | −0.355 |
| Schi01G037470 | 572 | 64581.95 | 6.04 | 38.14 | 84.34 | −0.148 |
| Schi02G003120 | 819 | 89348.73 | 8.2 | 38.23 | 76.96 | −0.344 |
| Schi02G004480 | 1185 | 129059.87 | 8.96 | 47.73 | 74.78 | −0.481 |
| Schi02G008710 | 604 | 68570.23 | 6.13 | 41.21 | 82.65 | −0.219 |
| Schi05G003270 | 571 | 64053.44 | 6.03 | 39.38 | 78.83 | −0.194 |
| Schi05G003280 | 562 | 63291.26 | 5.78 | 44.64 | 82.19 | −0.161 |
| Schi05G003290 | 544 | 61533.78 | 6.11 | 45.8 | 82.78 | −0.218 |
| Schi05G003300 | 580 | 64668.35 | 5.77 | 33.81 | 84.52 | −0.097 |
| Schi05G007230 | 216 | 24128.85 | 6.1 | 20.08 | 98.01 | −0.103 |
| Schi01G005590 | 203 | 23406.02 | 5.19 | 31.63 | 98.47 | −0.164 |
| Schi03G000690 | 178 | 20632.58 | 5.96 | 31.48 | 93.54 | −0.358 |
| Schi06G004390 | 239 | 27282.58 | 6.44 | 41.82 | 80.84 | −0.204 |
| Schi05G002060 | 232 | 27348.65 | 7.61 | 49.68 | 88.62 | −0.342 |
| Schi01G013290 | 203 | 23437.29 | 5.69 | 41.89 | 106.65 | −0.055 |
| Schi03G000710 | 200 | 23003.31 | 6.22 | 27.1 | 92.05 | −0.277 |
| Schi05G007220 | 245 | 27570.38 | 5.96 | 39.51 | 92.73 | −0.149 |
| Schi01G013300 | 199 | 22898.4 | 4.93 | 48.42 | 98.94 | −0.091 |
| Schi05G002040 | 232 | 27362.88 | 8.79 | 46.39 | 94.57 | −0.399 |
| Schi01G003300 | 499 | 57013.79 | 6.17 | 41.35 | 86.33 | −0.179 |
| Schi01G019250 | 511 | 58805.92 | 8.65 | 41.65 | 91.94 | −0.188 |
| Schi01G019260 | 524 | 59948.91 | 8.8 | 35.91 | 80 | −0.262 |
| Schi01G031590 | 507 | 57702.75 | 7.52 | 40.12 | 83.27 | −0.117 |
| Schi01G035210 | 396 | 45966.59 | 9.04 | 45.29 | 95.96 | −0.252 |
| Schi01G040830 | 507 | 58238.17 | 8.57 | 43.6 | 88.58 | −0.143 |
| Schi01G040920 | 560 | 62588.1 | 7.94 | 45.02 | 88.12 | −0.093 |
| Schi02G004050 | 488 | 56109.11 | 9.07 | 34.91 | 96.29 | −0.134 |
| Schi04G003120 | 528 | 61269.32 | 8.84 | 47.3 | 86.93 | −0.357 |
| Schi04G003130 | 518 | 60267.63 | 9.17 | 46.5 | 89.02 | −0.402 |
| Schi06G002630 | 476 | 54574.68 | 9.07 | 37.99 | 100.53 | −0.026 |
| Schi06G003040 | 497 | 56659.03 | 6.2 | 43.24 | 97.71 | −0.022 |
| Schi06G003050 | 511 | 58396.33 | 6.63 | 39.11 | 84.5 | −0.268 |
| Schi06G008170 | 533 | 61800.84 | 8.66 | 47.71 | 92.51 | −0.211 |
| Schi06G010000 | 511 | 58109.91 | 8.06 | 48.69 | 93.27 | −0.18 |
| Schi06G010010 | 650 | 73866.86 | 9.14 | 43.18 | 92.26 | −0.238 |
| Schi06G010020 | 526 | 60232.45 | 8.65 | 41.22 | 96.9 | −0.196 |
| Schi08G001700 | 317 | 37661.5 | 5.85 | 43.89 | 92.43 | −0.309 |
| Schi08G002470 | 503 | 57336.76 | 8.29 | 41.37 | 103.34 | −0.069 |
| Schi08G004540 | 517 | 60112.02 | 8.86 | 44.51 | 86.91 | −0.142 |
| Schi01G012990 | 539 | 61628.03 | 8.45 | 41.01 | 94.55 | −0.074 |
| Schi01G030560 | 501 | 56860.86 | 9.43 | 34.5 | 98.82 | 0.049 |
| Schi01G012970 | 531 | 59853.37 | 8.87 | 50.01 | 92.86 | −0.025 |
| Schi01G032520 | 523 | 57472.95 | 8.77 | 34.76 | 87.59 | 0.044 |
| Schi01G039280 | 520 | 59713.36 | 8.47 | 32.2 | 91.98 | −0.056 |
| Schi01G040430 | 509 | 56991.26 | 8.24 | 33.94 | 99 | 0.148 |
| Schi01G030550 | 522 | 60046.73 | 8.74 | 33.29 | 91.99 | −0.012 |
| Schi01G019490 | 980 | 112852.53 | 8.53 | 44.63 | 101.61 | 0.054 |
| Schi01G030540 | 469 | 50823.23 | 7.26 | 47.68 | 88.64 | −0.023 |
| Schi03G003720 | 500 | 57925.31 | 6.01 | 47.58 | 96.64 | 0.023 |
| Schi01G039290 | 516 | 58981.55 | 7.31 | 31.68 | 97.05 | 0.041 |
| Schi01G039250 | 493 | 56824.73 | 6.64 | 40.2 | 97.26 | 0.045 |
| Schi02G004380 | 492 | 56852.92 | 8.46 | 39.2 | 92.09 | −0.073 |
| Schi01G030530 | 503 | 57393.02 | 8.44 | 35.94 | 91.63 | −0.094 |
| Schi02G001900 | 521 | 58931.78 | 8.83 | 40.85 | 96.74 | 0.07 |
| Schi01G012980 | 540 | 62271.05 | 7.32 | 43.43 | 92.59 | −0.069 |
| Protein | α Helix (%) | Extended Strand (%) | β Turn (%) | Random Coil (%) |
|---|---|---|---|---|
| Schi05G007230 | 49.54 | 13.43 | 6.94 | 30.09 |
| Schi01G005590 | 53.69 | 8.87 | 3.94 | 33.5 |
| Schi03G000690 | 58.43 | 6.74 | 5.06 | 29.78 |
| Schi05G002060 | 50.43 | 9.05 | 5.17 | 35.34 |
| Schi01G013290 | 51.23 | 11.33 | 4.43 | 33 |
| Schi03G000710 | 50.5 | 9.5 | 4 | 36 |
| Schi05G007220 | 45.71 | 16.73 | 6.94 | 30.61 |
| Schi01G013300 | 55.78 | 11.06 | 4.02 | 29.15 |
| Schi05G002040 | 52.59 | 7.33 | 5.17 | 34.91 |
Publisher’s Note: MDPI stays neutral with regard to jurisdictional claims in published maps and institutional affiliations. |
© 2022 by the authors. Licensee MDPI, Basel, Switzerland. This article is an open access article distributed under the terms and conditions of the Creative Commons Attribution (CC BY) license (https://creativecommons.org/licenses/by/4.0/).
Share and Cite
He, H.; Crabbe, M.J.C.; Ren, Z. Detoxification Gene Families at the Genome-Wide Level of Rhus Gall Aphid Schlechtendalia chinensis. Genes 2022, 13, 1627. https://doi.org/10.3390/genes13091627
He H, Crabbe MJC, Ren Z. Detoxification Gene Families at the Genome-Wide Level of Rhus Gall Aphid Schlechtendalia chinensis. Genes. 2022; 13(9):1627. https://doi.org/10.3390/genes13091627
Chicago/Turabian StyleHe, Hongli, M. James C. Crabbe, and Zhumei Ren. 2022. "Detoxification Gene Families at the Genome-Wide Level of Rhus Gall Aphid Schlechtendalia chinensis" Genes 13, no. 9: 1627. https://doi.org/10.3390/genes13091627
APA StyleHe, H., Crabbe, M. J. C., & Ren, Z. (2022). Detoxification Gene Families at the Genome-Wide Level of Rhus Gall Aphid Schlechtendalia chinensis. Genes, 13(9), 1627. https://doi.org/10.3390/genes13091627