
GALNT2 rs4846914 SNP Is Associated with Obesity, Atherogenic Lipid Traits, and ANGPTL3 Plasma Level

 ,
,  ,
,  ,
,
Abstract
:1. Introduction
2. Materials and Methods
2.1. Recruitment of Participants and Study Cohort
2.2. Blood Sample Collection and Processing
2.3. Estimation of HbA1c, Plasma Glucose and Lipid Parameters
2.4. Estimation of Plasma Levels of Various Biomarkers
2.5. Bioelectric Impedance Measurements
2.6. Targeted Genotyping of the Study Variant
2.7. Quality Procedures for SNP and Trait Measurements
2.8. Allele-Based Association Tests and Thresholds for Ascertaining Statistical Significance
3. Results
4. Discussion
Supplementary Materials
Author Contributions
Funding
Institutional Review Board Statement
Informed Consent Statement
Data Availability Statement
Acknowledgments
Conflicts of Interest
References
- Hebbar, P.; Abubaker, J.A.; Abu-Farha, M.; Alsmadi, O.; Elkum, N.; Alkayal, F.; John, S.E.; Channanath, A.; Iqbal, R.; Pitkaniemi, J.; et al. Genome-wide landscape establishes novel association signals for metabolic traits in the arab population. Hum. Genet. 2021, 140, 505–528. [Google Scholar] [CrossRef] [PubMed]
- Ng, M.; Fleming, T.; Robinson, M.; Thomson, B.; Graetz, N.; Margono, C.; Mullany, E.C.; Biryukov, S.; Abbafati, C.; Abera, S.F.; et al. Global, regional, and national prevalence of overweight and obesity in children and adults during 1980–2013: A systematic analysis for the global burden of disease study 2013. Lancet 2014, 384, 766–781. [Google Scholar] [CrossRef] [Green Version]
- Abuyassin, B.; Laher, I. Obesity-linked diabetes in the arab world: A review. East. Mediterr. Health J. 2015, 21, 420–439. [Google Scholar] [CrossRef]
- Bamba, V.; Rader, D.J. Obesity and atherogenic dyslipidemia. Gastroenterology 2007, 132, 2181–2190. [Google Scholar] [CrossRef] [PubMed]
- Hebbar, P.; Nizam, R.; Melhem, M.; Alkayal, F.; Elkum, N.; John, S.E.; Tuomilehto, J.; Alsmadi, O.; Thanaraj, T.A. Genome-wide association study identifies novel recessive genetic variants for high tgs in an arab population. J. Lipid Res. 2018, 59, 1951–1966. [Google Scholar] [CrossRef] [Green Version]
- Graham, S.E.; Clarke, S.L.; Wu, K.H.; Kanoni, S.; Zajac, G.J.M.; Ramdas, S.; Surakka, I.; Ntalla, I.; Vedantam, S.; Winkler, T.W.; et al. The power of genetic diversity in genome-wide association studies of lipids. Nature 2021, 600, 675–679. [Google Scholar] [CrossRef]
- Kathiresan, S.; Melander, O.; Guiducci, C.; Surti, A.; Burtt, N.P.; Rieder, M.J.; Cooper, G.M.; Roos, C.; Voight, B.F.; Havulinna, A.S.; et al. Six new loci associated with blood low-density lipoprotein cholesterol, high-density lipoprotein cholesterol or triglycerides in humans. Nat. Genet. 2008, 40, 189–197. [Google Scholar] [CrossRef]
- Willer, C.J.; Sanna, S.; Jackson, A.U.; Scuteri, A.; Bonnycastle, L.L.; Clarke, R.; Heath, S.C.; Timpson, N.J.; Najjar, S.S.; Stringham, H.M.; et al. Newly identified loci that influence lipid concentrations and risk of coronary artery disease. Nat. Genet. 2008, 40, 161–169. [Google Scholar] [CrossRef] [Green Version]
- Schjoldager, K.T.; Clausen, H. Site-specific protein o-glycosylation modulates proprotein processing—Deciphering specific functions of the large polypeptide galnac-transferase gene family. Biochim. Biophys. Acta 2012, 1820, 2079–2094. [Google Scholar] [CrossRef]
- Schjoldager, K.T.; Vester-Christensen, M.B.; Bennett, E.P.; Levery, S.B.; Schwientek, T.; Yin, W.; Blixt, O.; Clausen, H. O-glycosylation modulates proprotein convertase activation of angiopoietin-like protein 3: Possible role of polypeptide galnac-transferase-2 in regulation of concentrations of plasma lipids. J. Biol. Chem. 2010, 285, 36293–36303. [Google Scholar] [CrossRef] [Green Version]
- Marucci, A.; Mangiacotti, D.; Trischitta, V.; di Paola, R. Galnt2 mrna levels are associated with serum triglycerides in humans. Endocrine 2016, 53, 331–334. [Google Scholar] [CrossRef] [PubMed]
- Di Paola, R.; Marucci, A.; Trischitta, V. Galnt2 effect on hdl-cholesterol and triglycerides levels in humans: Evidence of pleiotropy? Nutr. Metab. Cardiovasc. Dis. 2017, 27, 281–282. [Google Scholar] [CrossRef] [PubMed]
- Chen, J.; Guan, L.; Liu, H.; Liu, Q.; Fan, P.; Bai, H. Galnt2 gene variant rs4846914 is associated with insulin and insulin resistance depending on bmi in pcos patients: A case-control study. Reprod. Sci. 2021, 28, 1122–1132. [Google Scholar] [CrossRef] [PubMed]
- Marucci, A.; Antonucci, A.; de Bonis, C.; Mangiacotti, D.; Scarale, M.G.; Trischitta, V.; di Paola, R. Galnt2 as a novel modulator of adipogenesis and adipocyte insulin signaling. Int. J. Obes. 2019, 43, 2448–2457. [Google Scholar] [CrossRef] [Green Version]
- Buniello, A.; MacArthur, J.A.L.; Cerezo, M.; Harris, L.W.; Hayhurst, J.; Malangone, C.; Mc Mahon, A.; Morales, J.; Mountjoy, E.; Sollis, E.; et al. The nhgri-ebi gwas catalog of published genome-wide association studies, targeted arrays and summary statistics 2019. Nucleic Acids Res. 2019, 47, D1005–D1012. [Google Scholar] [CrossRef] [PubMed] [Green Version]
- Kulminski, A.M.; Loika, Y.; Nazarian, A.; Culminskaya, I. Quantitative and qualitative role of antagonistic heterogeneity in genetics of blood lipids. J. Gerontol. A Biol. Sci. Med. Sci. 2020, 75, 1811–1819. [Google Scholar] [CrossRef]
- Bentley, A.R.; Sung, Y.J.; Brown, M.R.; Winkler, T.W.; Kraja, A.T.; Ntalla, I.; Schwander, K.; Chasman, D.I.; Lim, E.; Deng, X.; et al. Multi-ancestry genome-wide gene-smoking interaction study of 387,272 individuals identifies new loci associated with serum lipids. Nat. Genet. 2019, 51, 636–648. [Google Scholar] [CrossRef]
- Spracklen, C.N.; Chen, P.; Kim, Y.J.; Wang, X.; Cai, H.; Li, S.; Long, J.; Wu, Y.; Wang, Y.X.; Takeuchi, F.; et al. Association analyses of east asian individuals and trans-ancestry analyses with european individuals reveal new loci associated with cholesterol and triglyceride levels. Hum. Mol. Genet. 2017, 26, 1770–1784. [Google Scholar] [CrossRef]
- Hoffmann, T.J.; Theusch, E.; Haldar, T.; Ranatunga, D.K.; Jorgenson, E.; Medina, M.W.; Kvale, M.N.; Kwok, P.Y.; Schaefer, C.; Krauss, R.M.; et al. A large electronic-health-record-based genome-wide study of serum lipids. Nat. Genet. 2018, 50, 401–413. [Google Scholar] [CrossRef]
- Abu-Farha, M.; Al-Khairi, I.; Cherian, P.; Chandy, B.; Sriraman, D.; Alhubail, A.; Al-Refaei, F.; AlTerki, A.; Abubaker, J. Increased angptl3, 4 and angptl8/betatrophin expression levels in obesity and t2d. Lipids Health Dis. 2016, 15, 181. [Google Scholar] [CrossRef] [Green Version]
- Abu-Farha, M.; Cherian, P.; Qaddoumi, M.G.; AlKhairi, I.; Sriraman, D.; Alanbaei, M.; Abubaker, J. Increased plasma and adipose tissue levels of angptl8/betatrophin and angptl4 in people with hypertension. Lipids Health Dis. 2018, 17, 35. [Google Scholar] [CrossRef] [PubMed] [Green Version]
- Abu-Farha, M.; Abubaker, J.; Noronha, F.; Al-Khairi, I.; Cherian, P.; Alarouj, M.; Bennakhi, A.; Elkum, N. Lack of associations between betatrophin/angptl8 level and c-peptide in type 2 diabetic subjects. Cardiovasc. Diabetol. 2015, 14, 112. [Google Scholar] [CrossRef] [PubMed] [Green Version]
- Bera, T.K. Bioelectrical impedance methods for noninvasive health monitoring: A review. J. Med. Eng. 2014, 2014, 381251. [Google Scholar] [CrossRef] [PubMed] [Green Version]
- Chang, C.C.; Chow, C.C.; Tellier, L.C.; Vattikuti, S.; Purcell, S.M.; Lee, J.J. Second-generation plink: Rising to the challenge of larger and richer datasets. Gigascience 2015, 4, 7. [Google Scholar] [CrossRef]
- Genomes Project, C.; Auton, A.; Brooks, L.D.; Durbin, R.M.; Garrison, E.P.; Kang, H.M.; Korbel, J.O.; Marchini, J.L.; McCarthy, S.; McVean, G.A.; et al. A global reference for human genetic variation. Nature 2015, 526, 68–74. [Google Scholar]
- Cunningham, F.; Allen, J.E.; Allen, J.; Alvarez-Jarreta, J.; Amode, M.R.; Armean, I.M.; Austine-Orimoloye, O.; Azov, A.G.; Barnes, I.; Bennett, R.; et al. Ensembl 2022. Nucleic Acids Res. 2022, 50, D988–D995. [Google Scholar] [CrossRef]
- Li, Q.; Yin, R.X.; Yan, T.T.; Miao, L.; Cao, X.L.; Hu, X.J.; Aung, L.H.; Wu, D.F.; Wu, J.Z.; Lin, W.X. Association of the galnt2 gene polymorphisms and several environmental factors with serum lipid levels in the mulao and han populations. Lipids Health Dis. 2011, 10, 160. [Google Scholar] [CrossRef] [Green Version]
- Richardson, T.G.; Sanderson, E.; Palmer, T.M.; Ala-Korpela, M.; Ference, B.A.; Davey Smith, G.; Holmes, M.V. Evaluating the relationship between circulating lipoprotein lipids and apolipoproteins with risk of coronary heart disease: A multivariable mendelian randomisation analysis. PLoS Med. 2020, 17, e1003062. [Google Scholar] [CrossRef] [Green Version]
- Hebbar, P.; Abu-Farha, M.; Mohammad, A.; Alkayal, F.; Melhem, M.; Abubaker, J.; Al-Mulla, F.; Thanaraj, T.A. Fto variant rs1421085 associates with increased body weight, soft lean mass, and total body water through interaction with ghrelin and apolipoproteins in arab population. Front. Genet. 2019, 10, 1411. [Google Scholar] [CrossRef]
- Li, X.; Zhang, Y.; Zhang, M.; Wang, Y. Galnt2 regulates angptl3 cleavage in cells and in vivo of mice. Sci. Rep. 2020, 10, 16168. [Google Scholar] [CrossRef]
- Fuior, E.V.; Gafencu, A.V. Apolipoprotein c1: Its pleiotropic effects in lipid metabolism and beyond. Int. J. Mol. Sci. 2019, 20, 5939. [Google Scholar] [CrossRef] [PubMed] [Green Version]
- Bis, J.C.; Kavousi, M.; Franceschini, N.; Isaacs, A.; Abecasis, G.R.; Schminke, U.; Post, W.S.; Smith, A.V.; Cupples, L.A.; Markus, H.S.; et al. Meta-analysis of genome-wide association studies from the charge consortium identifies common variants associated with carotid intima media thickness and plaque. Nat. Genet. 2011, 43, 940–947. [Google Scholar] [CrossRef] [PubMed] [Green Version]
- Franceschini, N.; Giambartolomei, C.; de Vries, P.S.; Finan, C.; Bis, J.C.; Huntley, R.P.; Lovering, R.C.; Tajuddin, S.M.; Winkler, T.W.; Graff, M.; et al. Gwas and colocalization analyses implicate carotid intima-media thickness and carotid plaque loci in cardiovascular outcomes. Nat. Commun. 2018, 9, 5141. [Google Scholar] [CrossRef] [PubMed] [Green Version]
- Guan, L.; Fan, P.; Liu, X.; Zhou, M.; Wu, Y.; Liu, R.; Liu, Y.; Bai, H. Maternal galnt2 variations affect blood pressure, atherogenic index, and fetal growth, depending on bmi in gestational diabetes mellitus. Front. Endocrinol. 2021, 12, 690229. [Google Scholar] [CrossRef]


| Traits | All Participants (Mean ± SD) | Obese (n = 143) (Mean ± SD) | Non-Obese (n = 135) (Mean ± SD) | p-Value for Differences in the Mean Values between the Two Sub-Cohorts @ |
|---|---|---|---|---|
| Male:Female | 125:153 | 62:81 | 63:72 | 0.660 |
| Age (years) | 46.25 ± 12.38 | 48.31 ± 12.70 | 44.30 ± 12.37 | 6.7 × 10⁻³ |
| Weight (kg) | 81.40 ± 16.23 | 93.18 ± 11.73 | 70.45 ± 11.48 | <1.0 × 10⁻⁴ |
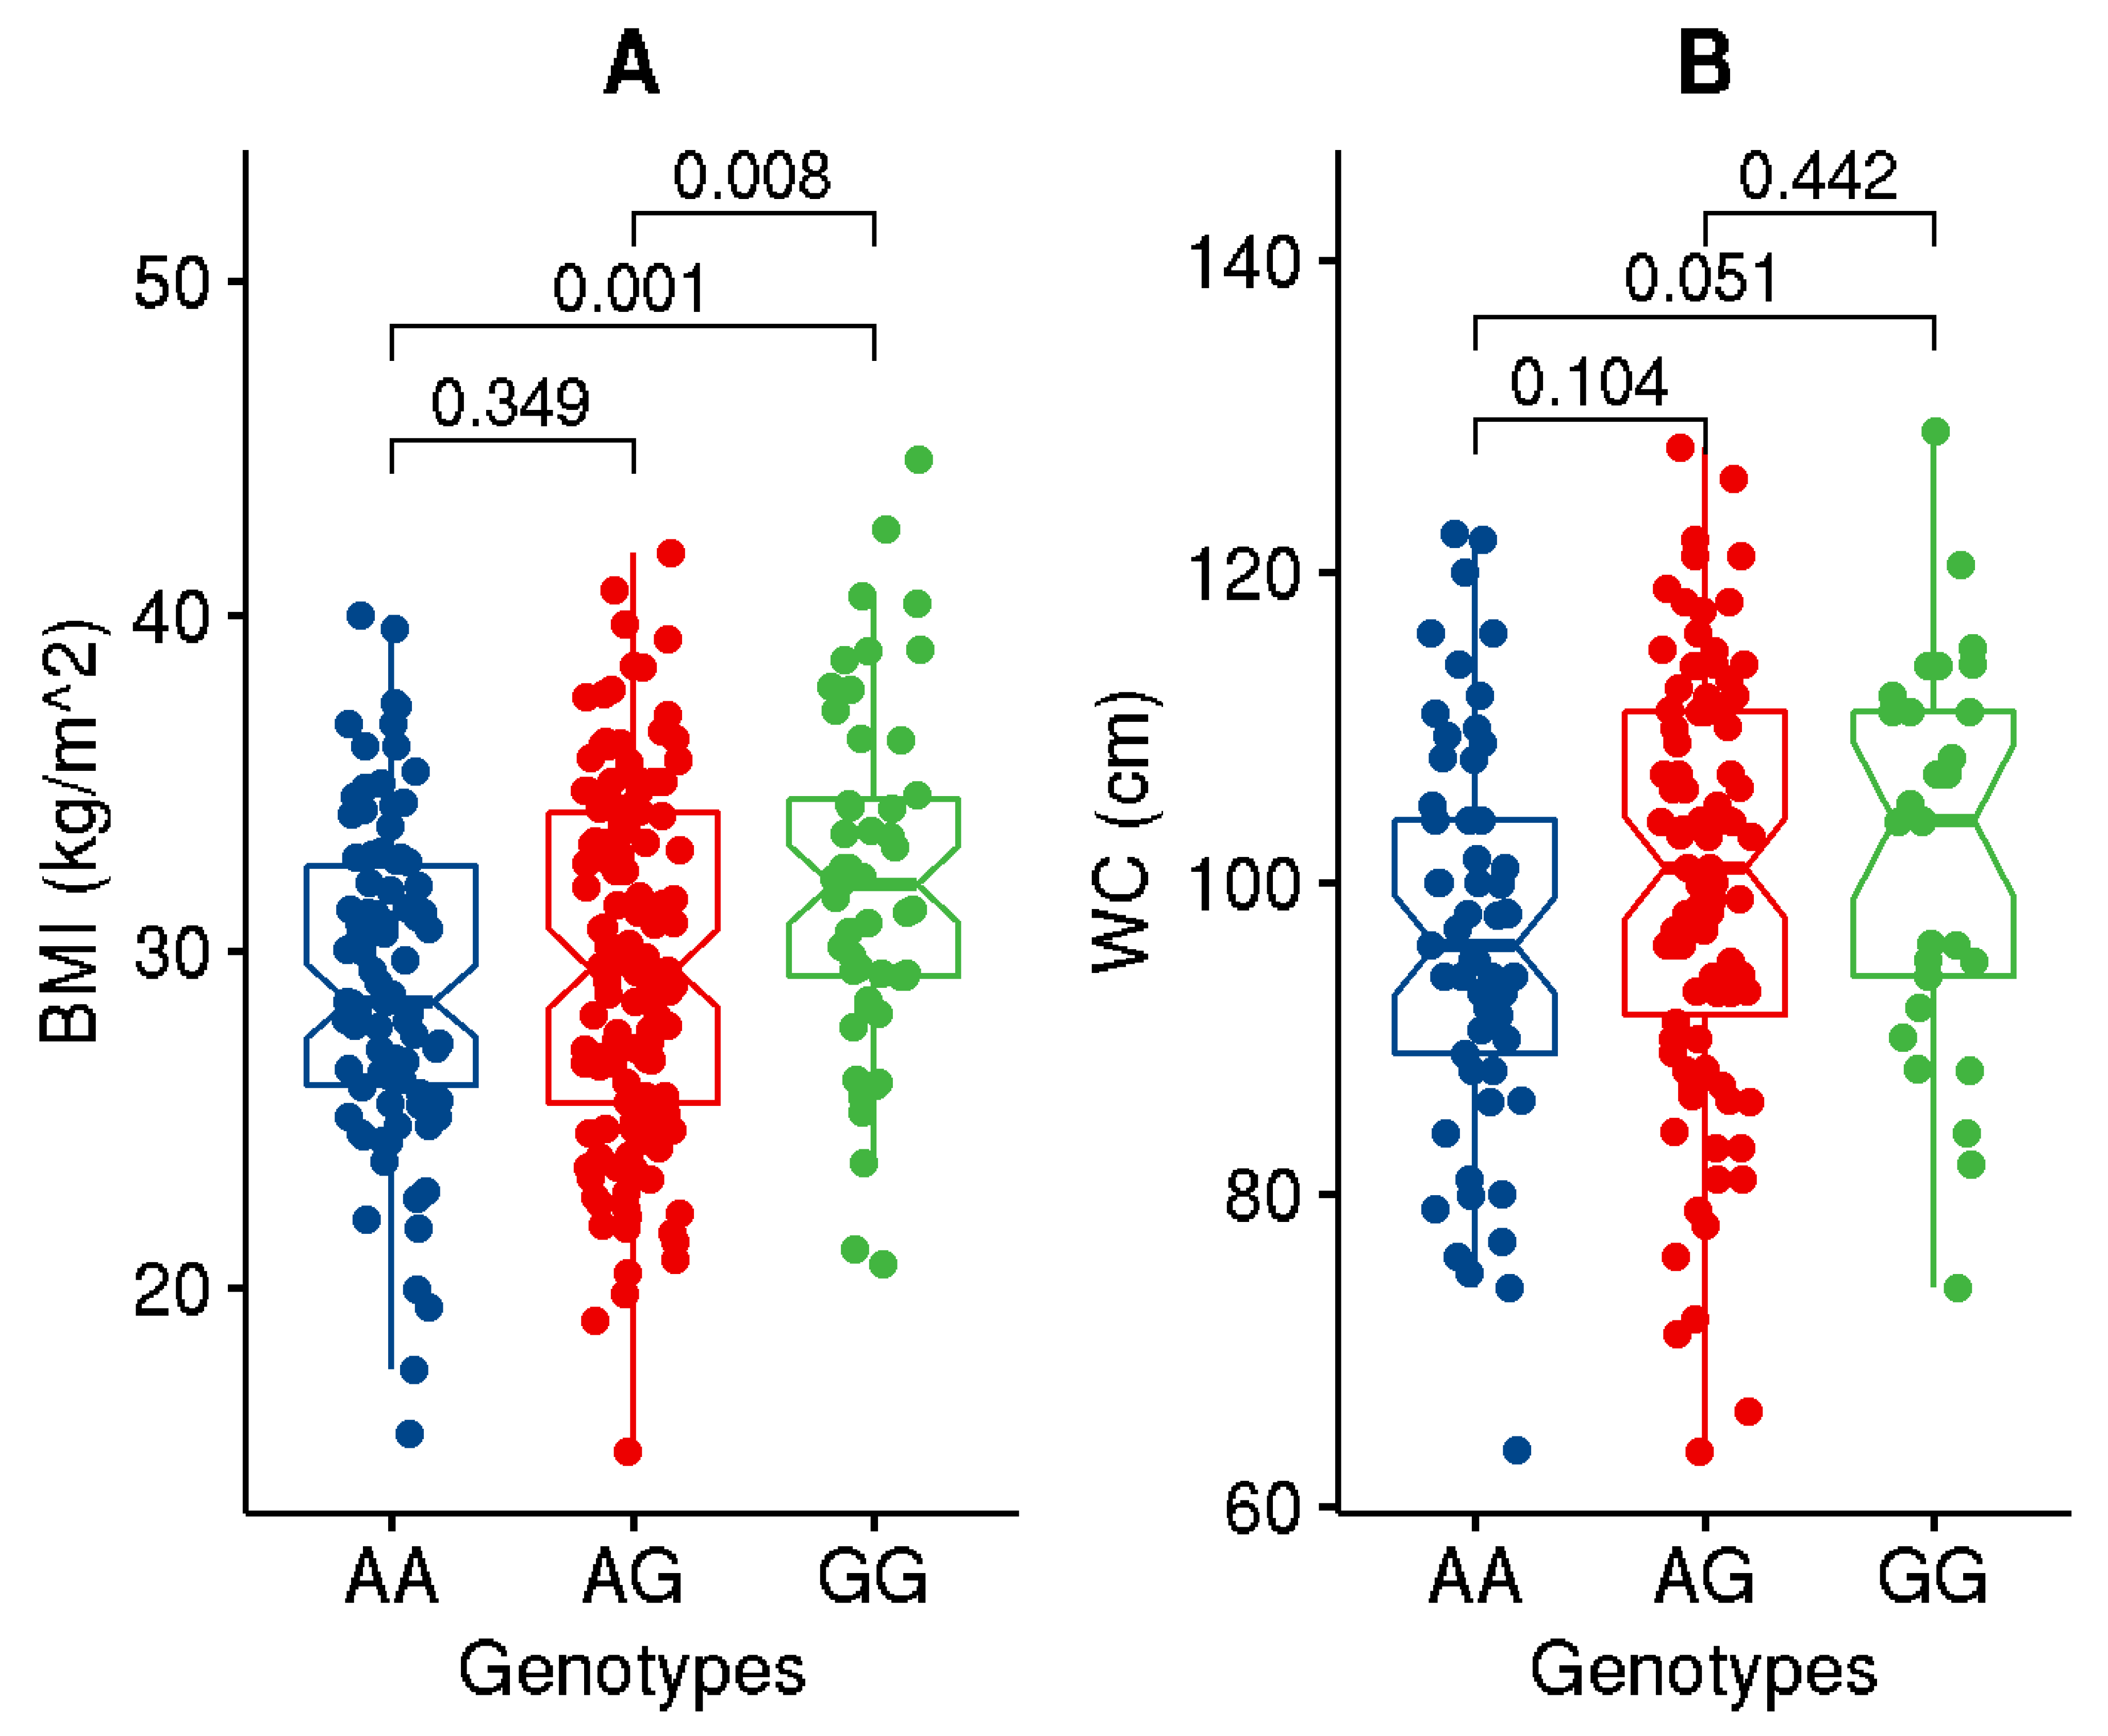
| BMI (kg/m2) | 29.93 ± 5.17 | 34.25 ± 3.00 | 25.85 ± 3.04 | <1.0 × 10⁻⁴ |
| WC (cm) | 99.36 ± 13.36 | 108.02 ± 9.66 | 89.98 ± 10.09 | <1.0 × 10⁻⁴ |
| PBF (%) | 35.52 ± 5.68 | 38.19 ± 4.78 | 32.67 ± 5.17 | <1.0 × 10⁻⁴ |
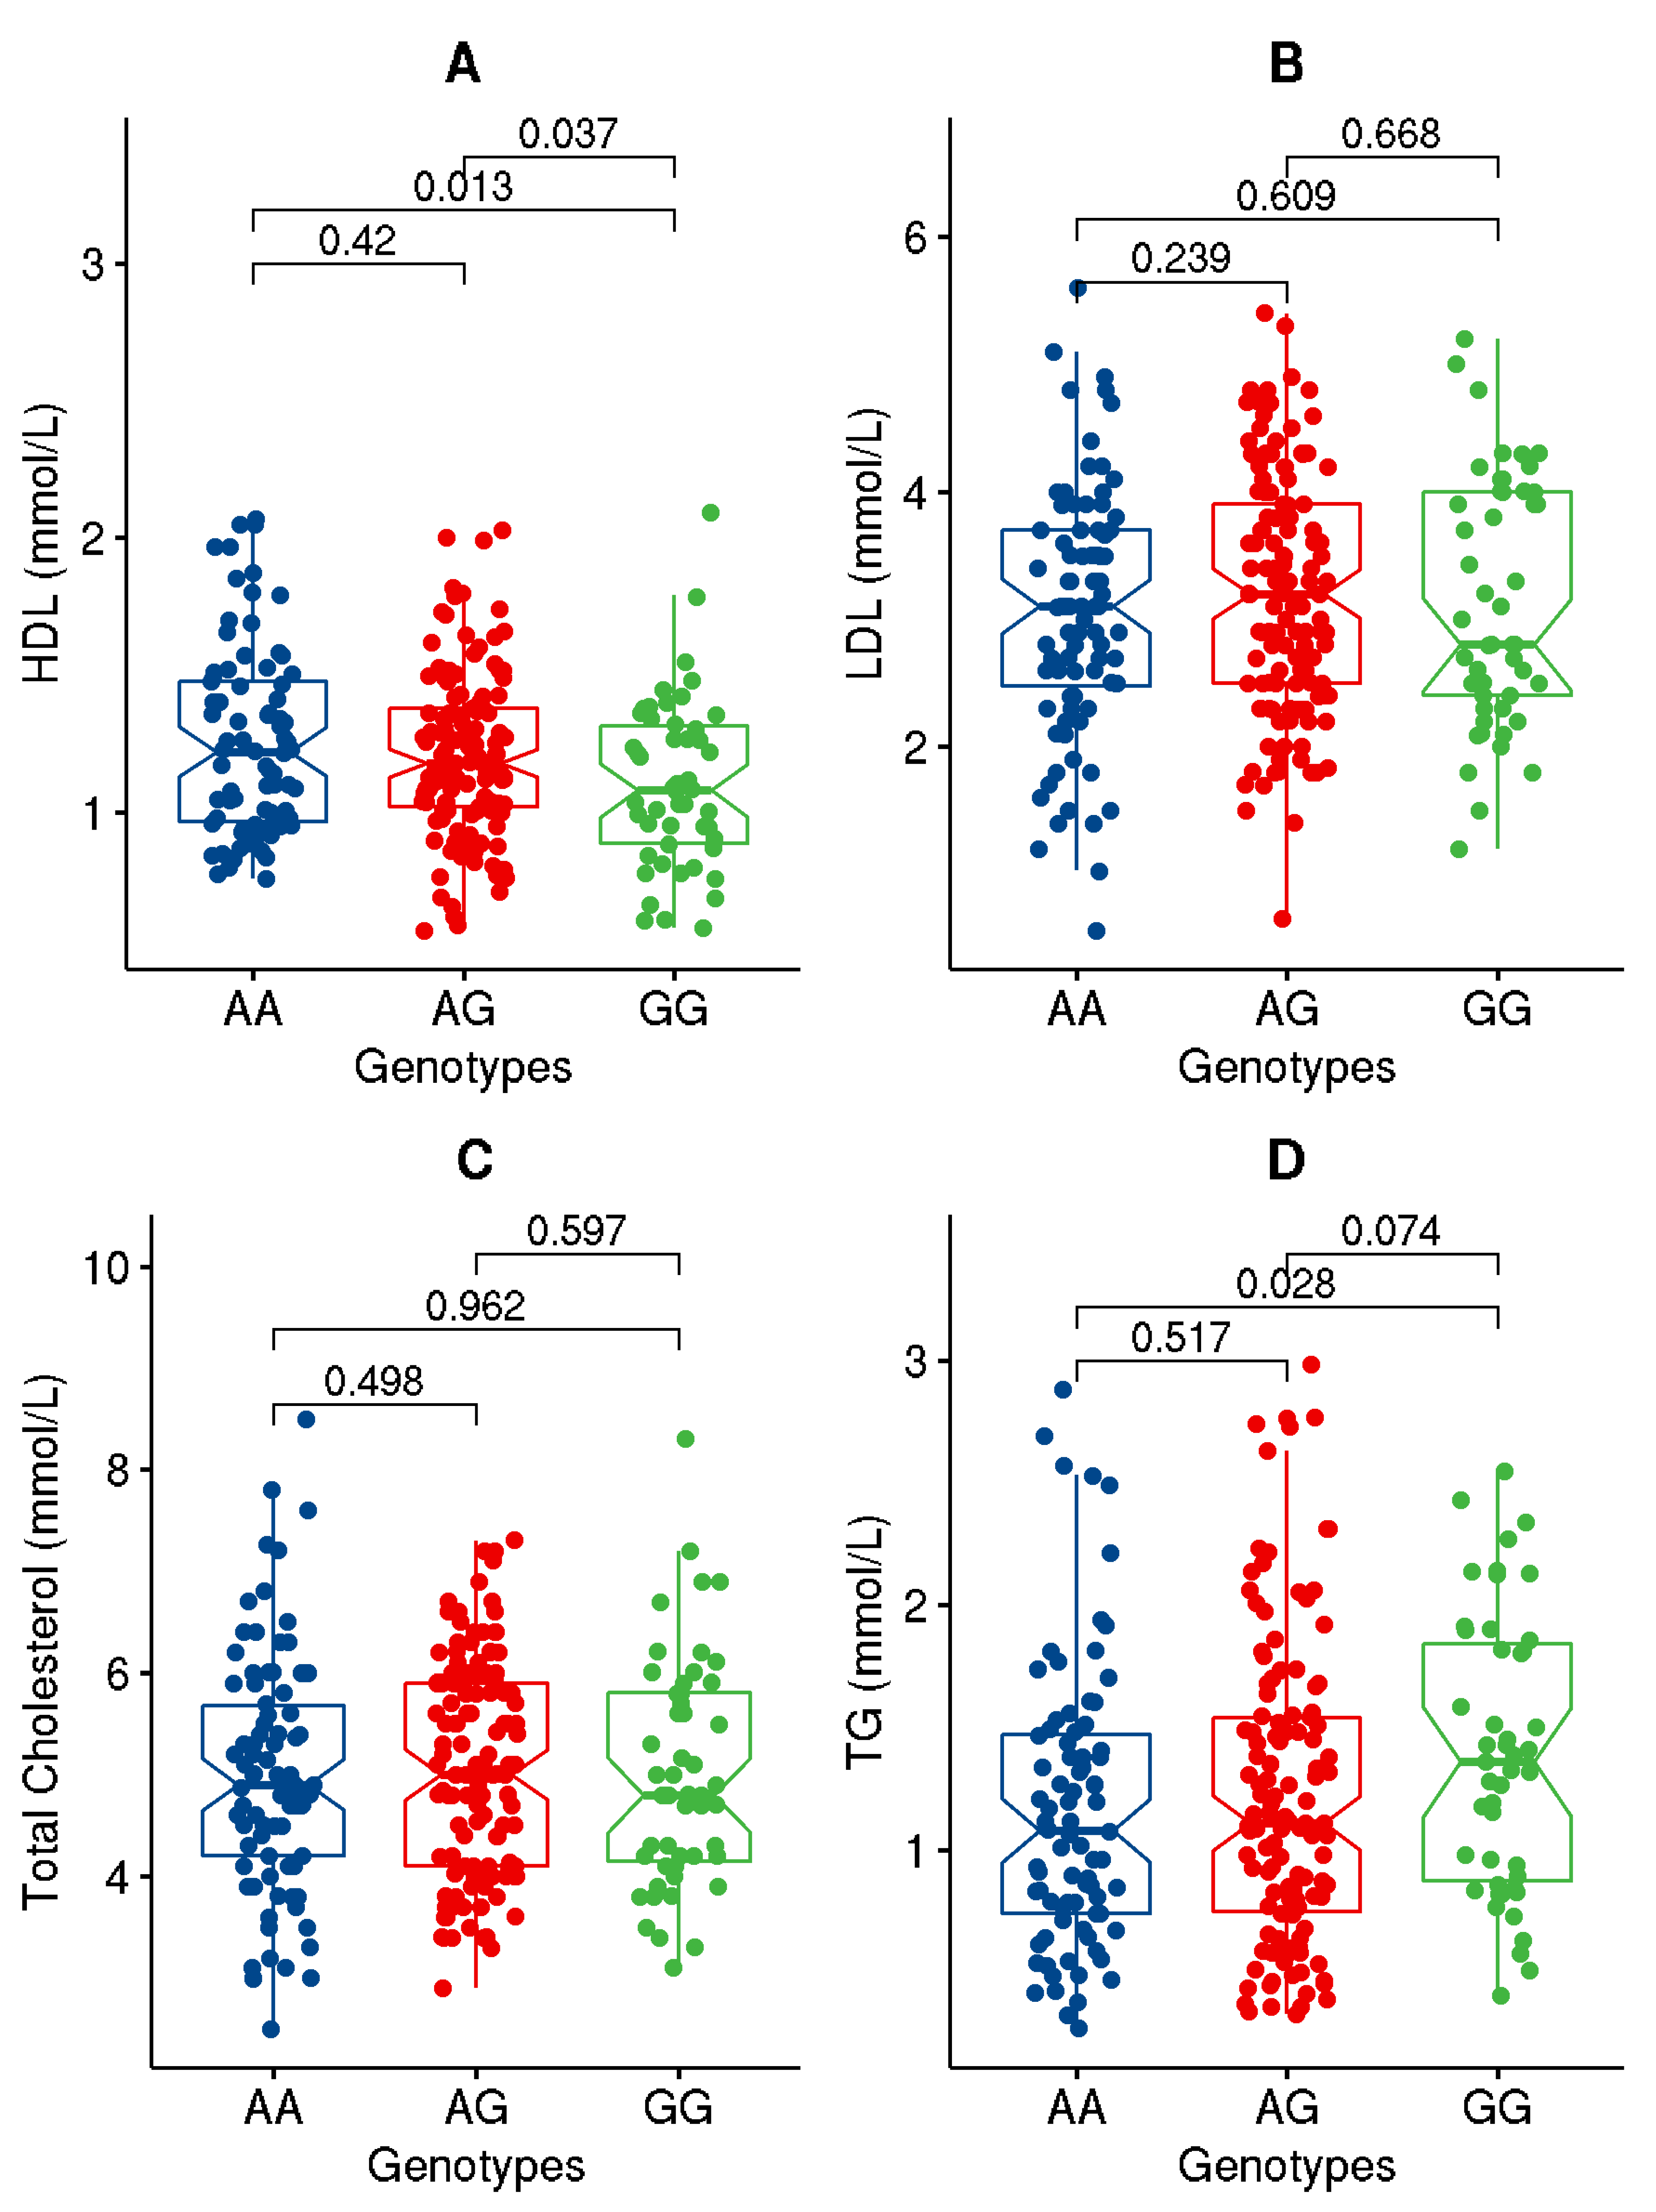
| LDL (mmol/L) | 3.38 ± 0.94 | 3.15 ± 0.97 | 3.10 ± 0.95 | 0.633 |
| HDL (mmol/L) | 1.20 ± 0.32 | 1.17 ± 0.32 | 1.22 ± 0.32 | 0.260 |
| TC (mmol/L) | 5.27 ± 1.04 | 5.04 ± 1.06 | 5.00 ± 1.12 | 0.742 |
| TG (mmol/L) | 1.22 ± 0.59 | 1.34 ± 0.55 | 1.11 ± 0.61 | 1.0 × 10⁻³ |
| FPG (mmol/L) | 5.77 ± 1.24 | 6.03 ± 1.30 | 5.57 ± 1.14 | 5.0 × 10⁻³ |
| HbA1c (%) | 6.31 ± 1.29 | 6.73 ± 1.48 | 5.90 ± 0.92 | <1.0 × 10⁻⁴ |
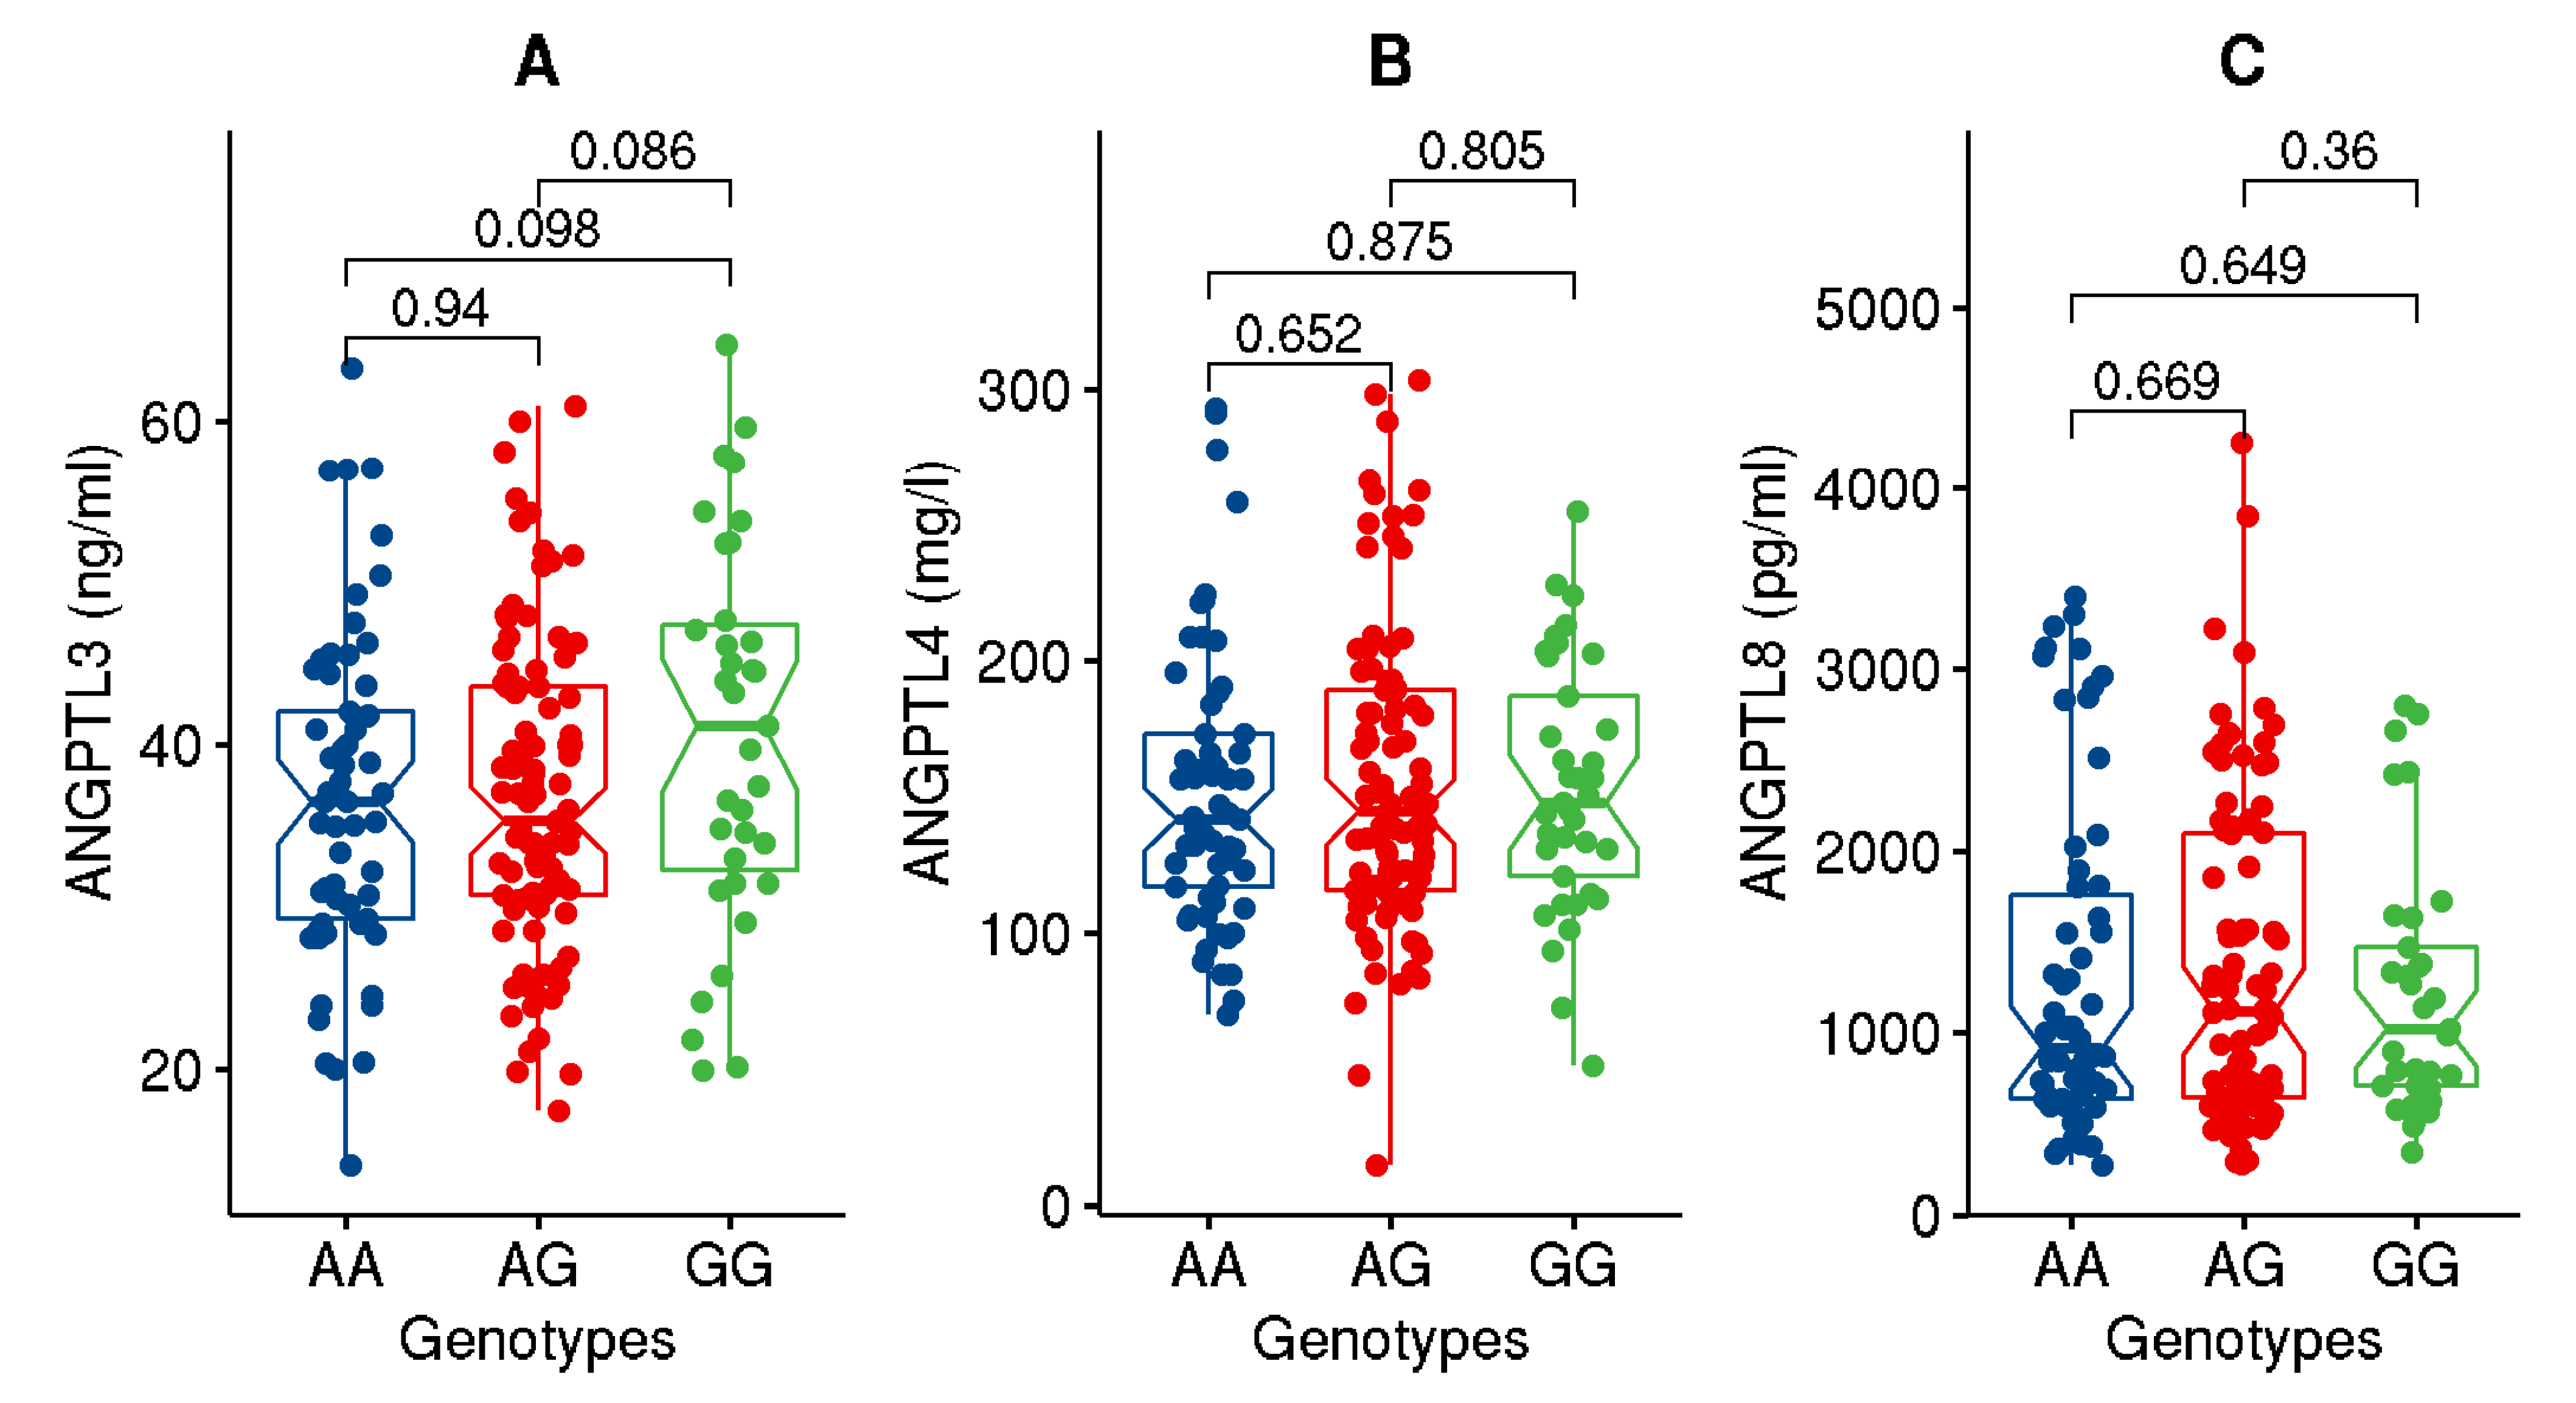
| ANGPTL3 (ng/mL) | 37.42 ± 10.29 | 38.84 ± 10.81 | 35.83 ± 9.48 | 3.9 × 10⁻² |
| ANGPTL4 (ng/mL) | 153.4 ± 51.9 | 145.0 ± 42.4 | 161.1 ± 58.6 | 2.7 × 10⁻² |
| ANGPTL8 (pg/mL) | 1321.74 ± 861.4 | 1465.4 ± 878.9 | 1176.5 ± 822.7 | 2.1 × 10⁻² |
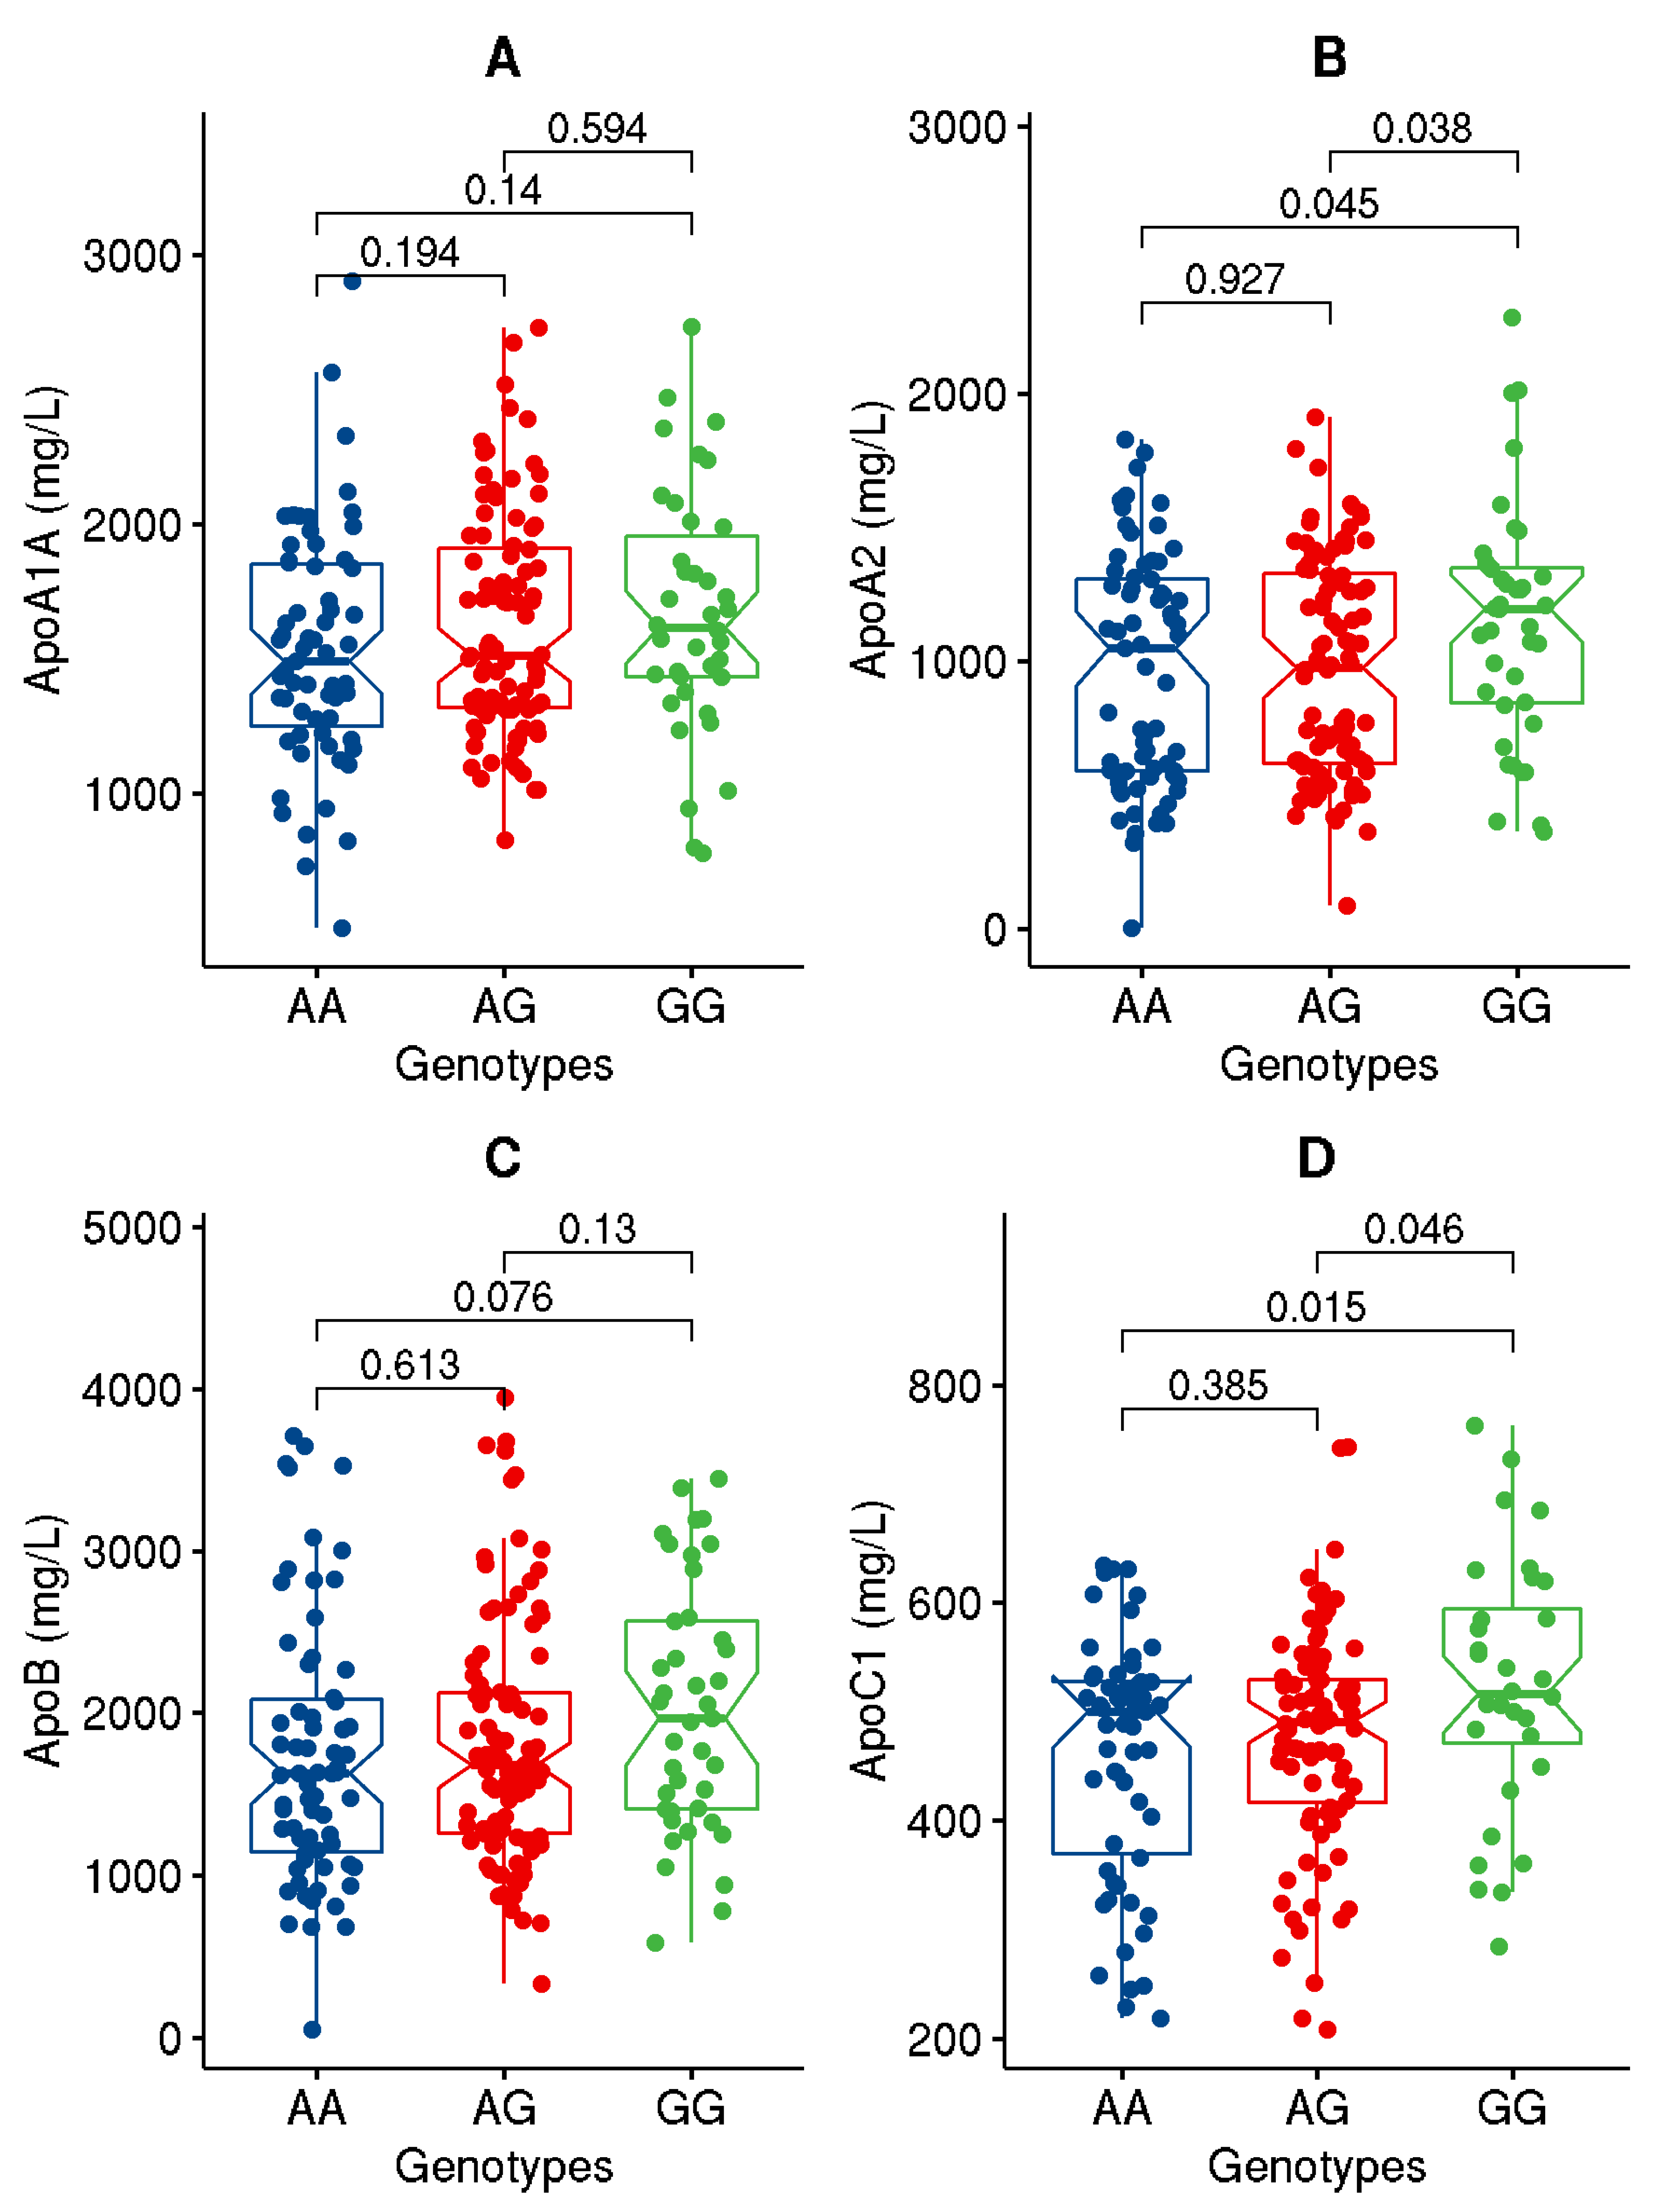
| ApoA1 (mg/L) | 1600.9 ± 429.7 | 1612.0 ± 439.1 | 1590.2.6 ± 422.3 | 0.726 |
| ApoA2 (mg/L) | 1001.4 ± 426.7 | 1023.8 ± 433.8 | 979.2 ± 420.5 | 0.450 |
| ApoB (mg/L) | 1829.2 ± 774.9 | 1874.6 ± 824.1 | 1783.2 ± 723.0 | 0.391 |
| ApoC1 (ng/mL) | 477.7 ± 109.9 | 477.2 ± 116.2 | 478.3 ± 103.5 | 0.945 |
| Diabetes status (Yes:No) | 120:158 | 73:62 | 47:96 | 7.0 × 10⁻⁴ |
| Anti-diabetic medication (Yes:No) | 101:177 | 67:67 | 34:109 | <1.0 × 10⁻⁴ |
| Lipid lowering medication (Yes:No) | 88:190 | 58:76 | 30:113 | 1.1 × 10⁻⁴ |
| Category | Allele Frequency (G/A) | OR (CI 95%) * | p-Value * |
|---|---|---|---|
| All | 0.43/0.57 | - | - |
| Obese | 0.47/0.53 | 1.47 [1.04–2.05] | 3.1 × 10⁻² |
| Non-obese | 0.37/0.63 | ||
| Diabetic | 0.44/0.56 | 1.12 [0.79–1.58] | 0.540 |
| Non-diabetic | 0.42/0.58 |
| Trait | Correction * | Sample Size | β | p-Value @ |
|---|---|---|---|---|
| BMI | R | 274 | 1.342 | 2.2 × 10⁻³ |
| R + DS | 274 | 1.312 | 2.4 × 10⁻³ | |
| R + OS | 273 | 1.31 | 2.6 × 10⁻³ | |
| Weight | R | 270 | 3.83 | 2.7 × 10⁻³ |
| R + DS | 270 | 3.733 | 2.8 × 10⁻³ | |
| R + OS | 269 | 3.837 | 2.3 × 10⁻³ | |
| HDL | R | 256 | −0.056 | 2.8 × 10⁻² |
| R + DS | 256 | −0.052 | 3.9 × 10⁻² | |
| R + OS | 255 | −0.052 | 4.1 × 10⁻² | |
| LDL | R | 265 | 0.065 | 0.441 |
| R + DS | 265 | 0.070 | 0.410 | |
| R + OS | 264 | 0.073 | 0.392 | |
| TC | R | 269 | 0.023 | 0.803 |
| R + DS | 269 | 0.028 | 0.760 | |
| R + OS | 268 | 0.032 | 0.734 | |
| TG | R | 256 | 0.086 | 0.881 |
| R + DS | 256 | 0.079 | 0.103 | |
| R + OS | 255 | 0.081 | 0.102 | |
| ANGPTL3 | R | 193 | 2.029 | 5.2 × 10⁻² |
| R + DS | 193 | 2.034 | 5.2 × 10⁻² | |
| R + OS | 193 | 2.03 | 5.3 × 10⁻² | |
| ANGPTL4 | R | 195 | 430.5 | 0.932 |
| R + DS | 195 | −174.0 | 0.970 | |
| R + OS | 195 | 953.4 | 0.850 | |
| ANGPTL8 | R | 186 | −28.27 | 0.723 |
| R + DS | 186 | −28.55 | 0.654 | |
| R + OS | 186 | 7.142 | 0.911 | |
| ApoC1 | R | 178 | 32.00 | 6.0 × 10⁻³ |
| R + DS | 178 | 32.03 | 6.1 × 10⁻³ | |
| R + OS | 177 | 30.88 | 8.9 × 10⁻³ | |
| ApoA1A | R | 193 | 88.10 | 3.9 × 10⁻² |
| R + DS | 193 | 88.12 | 4.0 × 10⁻² | |
| R + OS | 192 | 79.51 | 6.4 × 10⁻² | |
| ApoA2 | R | 204 | 84.73 | 4.5 × 10⁻² |
| R + DS | 204 | 84.80 | 4.2 × 10⁻² | |
| R + OS | 204 | 86.30 | 4.4 × 10⁻² | |
| ApoB | R | 206 | 147.30 | 5.1 × 10⁻² |
| R + DS | 206 | 149.60 | 4.7 × 10⁻² | |
| R + OS | 205 | 141.10 | 6.5 × 10⁻² | |
| PBF | R | 175 | 0.632 | 0.175 |
| R + DS | 175 | 0.521 | 0.263 | |
| R + OS | 175 | 0.324 | 0.321 |
| Trait (Response/Dependent Variable) | Genotypes and/or Interacting Traits (Predict Variable) | Estimate | Std. Error | p-Value | Adj. R-Square | Model p-Value |
|---|---|---|---|---|---|---|
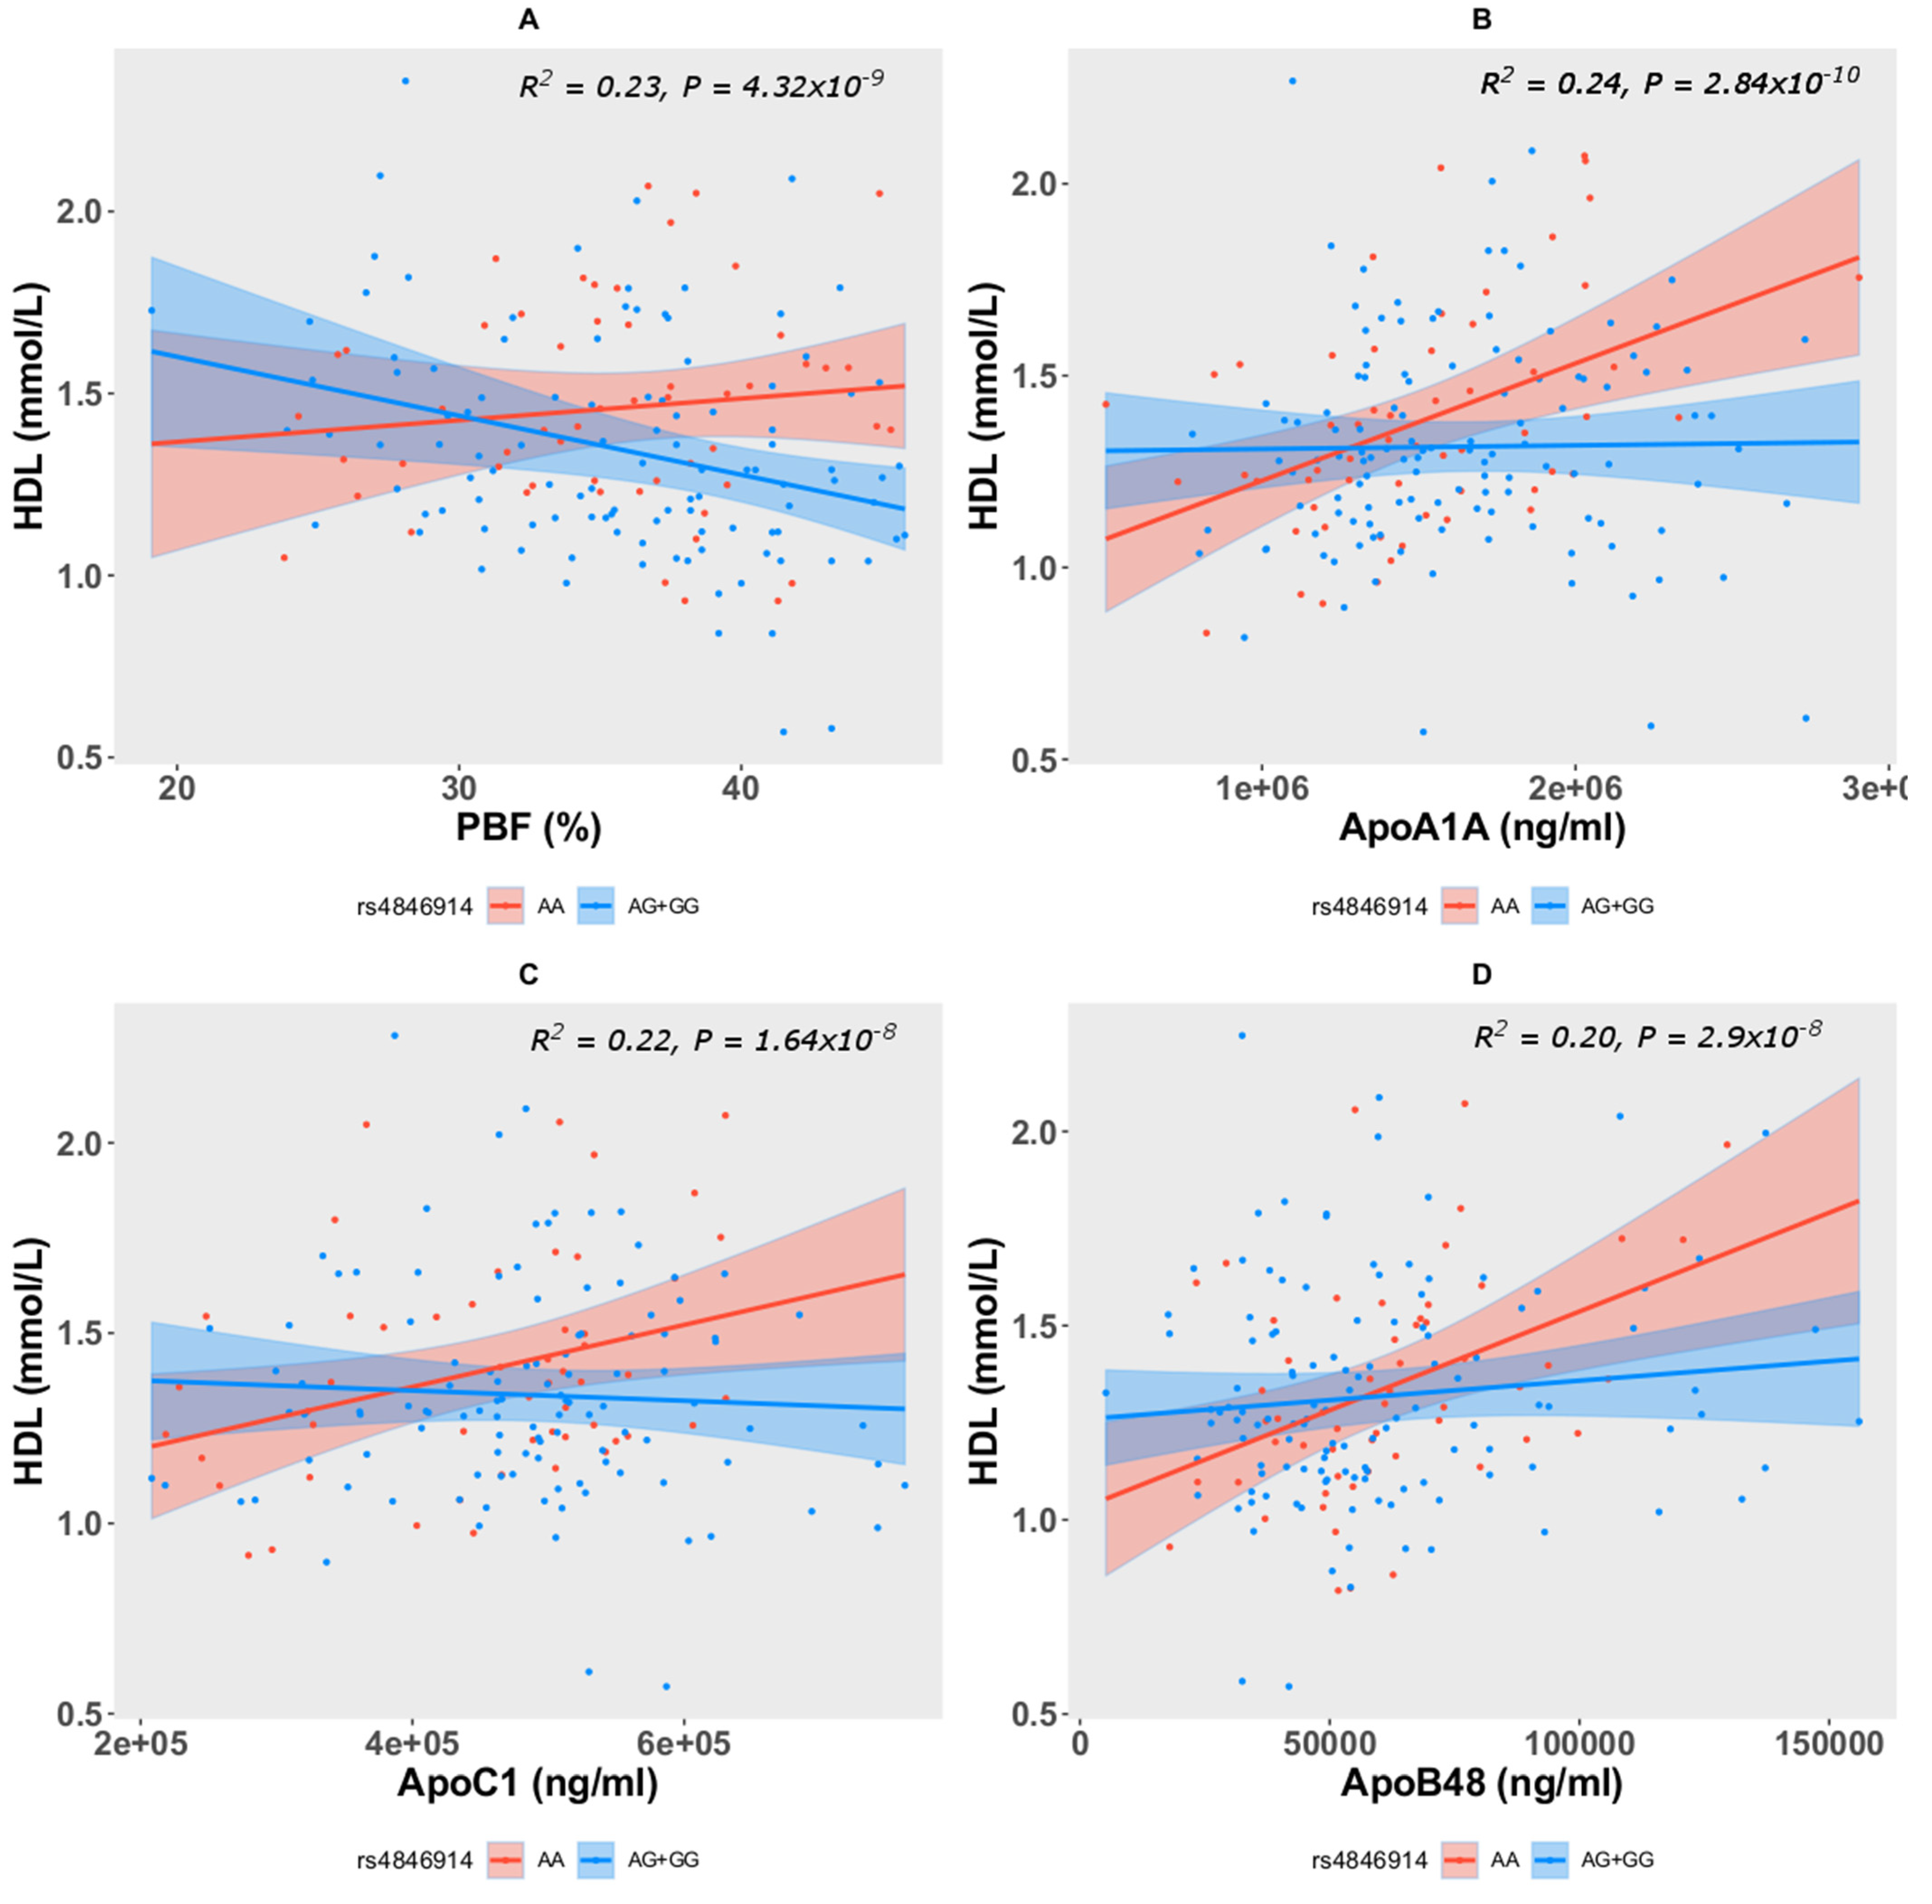
| Model: HDL~rs4846914 + Age + Sex + PBF + rs4846914 * PBF | ||||||
| HDL | Intercept | 0.534 | 0.271 | 0.051 | 0.233 | 4.32 × 10⁻⁹ |
| AG + GG | 0.677 | 0.318 | 0.034 | |||
| PBF | 0.0059 | 0.0083 | 0.474 | |||
| AG + GG*PBF | −0.0022 | 0.0088 | 0.013 | |||
| Model: HDL~rs4846914 + Age + Sex + ApoA1A + rs4846914 * ApoA1A | ||||||
| HDL | Intercept | 0.300 | 0.175 | 0.087 | 0.239 | 2.84 × 10⁻¹⁰ |
| AG + GG | 0.378 | 0.167 | 0.024 | |||
| ApoA1A | 3.05 × 10⁻⁷ | 8.69 × 10⁻⁸ | 5.6 × 10⁻⁴ | |||
| AG + GG*ApoA1A | −2.96 × 10⁻⁷ | 1.04 × 10⁻⁷ | 5.1 × 10⁻³ | |||
| Model: HDL~rs4846914 + Age + Sex + ApoC1 + rs4846914 * ApoC1 | ||||||
| HDL | Intercept | 0.440 | 0.197 | 0.026 | 0.221 | 1.64 × 10⁻⁸ |
| AG + GG | 0.369 | 0.202 | 0.069 | |||
| ApoC1 | 8.14 × 10⁻⁷ | 3.46 × 10⁻⁷ | 0.020 | |||
| AG + GG*ApoC1 | −9.47 × 10⁻⁷ | 4.22 × 10⁻⁷ | 0.026 | |||
| Model: HDL~rs4846914 + Age + Sex + ApoB48 + rs4846914 * ApoB48 | ||||||
| HDL | Intercept | 0.482 | 0.155 | 0.002 | 0.199 | 2.9 × 10⁻⁸ |
| AG + GG | 0.231 | 0.122 | 0.061 | |||
| ApoB48 | 5.08 × 10⁻⁶ | 1.62 × 10⁻⁶ | 0.002 | |||
| AG + GG*ApoB48 | −4.08 × 10⁻⁶ | 1.85 × 10⁻⁶ | 0.028 | |||
Publisher’s Note: MDPI stays neutral with regard to jurisdictional claims in published maps and institutional affiliations. |
© 2022 by the authors. Licensee MDPI, Basel, Switzerland. This article is an open access article distributed under the terms and conditions of the Creative Commons Attribution (CC BY) license (https://creativecommons.org/licenses/by/4.0/).
Share and Cite
Qaddoumi, M.; Hebbar, P.; Abu-Farha, M.; Al Somaly, A.; Melhem, M.; Al-Kayal, F.; AlKhairi, I.; Cherian, P.; Alanbaei, M.; Al-Mulla, F.; et al. GALNT2 rs4846914 SNP Is Associated with Obesity, Atherogenic Lipid Traits, and ANGPTL3 Plasma Level. Genes 2022, 13, 1201. https://doi.org/10.3390/genes13071201
Qaddoumi M, Hebbar P, Abu-Farha M, Al Somaly A, Melhem M, Al-Kayal F, AlKhairi I, Cherian P, Alanbaei M, Al-Mulla F, et al. GALNT2 rs4846914 SNP Is Associated with Obesity, Atherogenic Lipid Traits, and ANGPTL3 Plasma Level. Genes. 2022; 13(7):1201. https://doi.org/10.3390/genes13071201
Chicago/Turabian StyleQaddoumi, Mohammad, Prashantha Hebbar, Mohamed Abu-Farha, Aseelah Al Somaly, Motasem Melhem, Fadi Al-Kayal, Irina AlKhairi, Preethi Cherian, Muath Alanbaei, Fahd Al-Mulla, and et al. 2022. "GALNT2 rs4846914 SNP Is Associated with Obesity, Atherogenic Lipid Traits, and ANGPTL3 Plasma Level" Genes 13, no. 7: 1201. https://doi.org/10.3390/genes13071201
APA StyleQaddoumi, M., Hebbar, P., Abu-Farha, M., Al Somaly, A., Melhem, M., Al-Kayal, F., AlKhairi, I., Cherian, P., Alanbaei, M., Al-Mulla, F., Abubaker, J., & Thanaraj, T. A. (2022). GALNT2 rs4846914 SNP Is Associated with Obesity, Atherogenic Lipid Traits, and ANGPTL3 Plasma Level. Genes, 13(7), 1201. https://doi.org/10.3390/genes13071201