Article

Integrated Analyses of DNA Methylation and Gene Expression of Rainbow Trout Muscle under Variable Ploidy and Muscle Atrophy Conditions

1
Department of Animal and Avian Sciences, University of Maryland, College Park, MD 20742, USA
2
Computational Science Program, Middle Tennessee State University, Murfreesboro, TN 37132, USA
3
Division of Animal and Nutritional Sciences, West Virginia University, Morgantown, WV 26506, USA
*
Author to whom correspondence should be addressed.
Genes 2022, 13(7), 1151; https://doi.org/10.3390/genes13071151
Submission received: 1 June 2022 / Revised: 19 June 2022 / Accepted: 24 June 2022 / Published: 26 June 2022
(This article belongs to the Special Issue Functional Genomics in Aquaculture)

Abstract

:
Rainbow trout, Oncorhynchus mykiss, is an important cool, freshwater aquaculture species used as a model for biological research. However, its genome reference has not been annotated for epigenetic markers affecting various biological processes, including muscle growth/atrophy. Increased energetic demands during gonadogenesis/reproduction provoke muscle atrophy in rainbow trout. We described DNA methylation and its associated gene expression in atrophying muscle by comparing gravid, diploid females to sterile, triploid females. Methyl Mini-seq and RNA-Seq were simultaneously used to characterize genome-wide DNA methylation and its association with gene expression in rainbow trout muscle. Genome-wide enrichment in the number of CpGs, accompanied by depleted methylation levels, was noticed around the gene transcription start site (TSS). Hypermethylation of CpG sites within ±1 kb on both sides of TSS (promoter and gene body) was weakly/moderately associated with reduced gene expression. Conversely, hypermethylation of the CpG sites in downstream regions of the gene body +2 to +10 kb was weakly associated with increased gene expression. Unlike mammalian genomes, rainbow trout gene promotors are poor in CpG islands, at <1% compared to 60%. No signs of genome-wide, differentially methylated (DM) CpGs were observed due to the polyploidy effect; only 1206 CpGs (0.03%) were differentially methylated, and these were primarily associated with muscle atrophy. Twenty-eight genes exhibited differential gene expression consistent with methylation levels of 31 DM CpGs. These 31 DM CpGs represent potential epigenetic markers of muscle atrophy in rainbow trout. The DM CpG-harboring genes are involved in apoptosis, epigenetic regulation, autophagy, collagen metabolism, cell membrane functions, and Homeobox proteins. Our study also identified genes explaining higher water content and modulated glycolysis previously shown as characteristic biochemical signs of rainbow trout muscle atrophy associated with sexual maturation. This study characterized DNA methylation in the rainbow trout genome and its correlation with gene expression. This work also identified novel epigenetic markers associated with muscle atrophy in fish/lower vertebrates.

1. Introduction

Rainbow trout is one of the most well-studied fish [1]; however, complete genome annotation of it is still under development [2,3]. Availability of a genome sequence reference with complete annotation is essential for genomics- and epigenomics-based animal selection for aquaculture applications. Additionally, a completely annotated genome sequence will facilitate functional genomics and proteomics approaches for rainbow trout research and establish methods for comparative epigenomic analysis in a highly complex and duplicated genome [1]. Little is known about the methylome of fish, particularly the non-model species such as rainbow trout. A minimal number of DNA methylation studies have been conducted on rainbow trout, with almost no focus on annotation of the genome reference or integrated DNA methylation to gene expression [4,5]. Identifying the methylated DNA, epigenetic tags are essential for functional annotation of the rainbow trout genome.
Methylation of DNA cytosine is a critical epigenetic modification necessary for many vital biological functions, including cell differentiation, organismal development, epigenomic imprinting, and chromosome stability [6,7]. More than 99% of DNA methylation occurs in human somatic cells in a CpG context, while non-CpG methylation accounts for 25% in stem cells [8]. About 98% of methylated Cs in pufferfish was in the CpG context [9].
Despite many studies, the exact role of DNA methylation in regulating gene expression is still far from understood. The reported relationship between DNA methylation and gene expression varies between different classes of eukaryotes and may or may not be tissue-type specific [10]. For a long time, hyper-methylation of the gene promoter has been shown to regulate gene expression negatively by recruiting or blocking the binding of transcription factors or repressors to the promoter [6,7,11]. However, recent studies contradicted this notion and suggested enhancement of gene expression due to promoter hyper-methylation [10,12].
The muscle makes up about 50% of the fish body and is the most significant edible part of fish. However, few studies have targeted DNA methylation in fish muscle atrophy. 17β-Estradiol treatment increased non-CpG methylation of the MyoD gene exon-1 of the rainbow trout without affecting CpG sites. The study suggested a mechanism involving DNA methylation by which E2 reduces MyoD gene expression and decreases muscle growth [13]. In mammals, the exact mechanism of DNA methylation in muscle atrophy is still not well described. Loss of de novo DNA methylation in Dnmt3a knock-out mice caused decreased muscle mass, impaired muscle regeneration, and proliferation [14]. Muscle denervation causes reduced expression of DNMT3a and hypomethylation in the fibroblast growth factor-inducible-14 (Fn14) gene promoter. On the other hand, increased expression of DNMT3a reduces the expression of Fn14 and causes muscle atrophy [15]. Variations in DNA methylation of ten genes were reported in cancer-induced muscle atrophy [16]. Genome-wide DNA hypermethylation was associated with aging in a human muscle study. Differentially methylated CpGs were more predominant in the gene body than promoters [17]. The study did not find a correlation between DNA methylation with differential expression and identified 500 differentially methylated sites that distinguish between aged and young individuals. Therefore, the current study aimed to increase our understanding of the role of DNA methylation in mechanisms controlling muscle atrophy, particularly in fish.
The diploid versus triploid fish used in this study offers a unique opportunity to investigate the role of DNA methylation on global gene silencing/regulation due to the polyploidy effect associated with gene dosage. An increase in the number of genomic sets in polyploidy is usually accompanied by infertility, lower genome stability, and dosage compensation [18,19]. A study of rice showed that ploidy (diploid to haploid and diploid to triploid) affects CHH methylation frequency [20]. The autotetraploid fish genome of Carassius auratus exhibited a lower genome-wide DNA methylation level than diploid fish [21]. A small-scale study on brown trout detected only 408 methylation loci and no difference in methylation between tripods and diploid fish [22].
This study investigated the potential role of DNA methylation in gene expression of gravid female diploid fish with atrophying muscle compared to sterile triploid rainbow trout. The elevated energetic demands during gonadogenesis/reproduction provide a unique model for investigating the role of DNA methylation in muscle atrophy in rainbow trout. Previously, we used this model to identify molecular/metabolic pathways characteristic of muscle atrophy in fish, including transcriptomic changes of protein-coding genes, microRNAs and long noncoding RNAs, and variations at the proteomics level [23,24,25,26]. The study’s first objective was to characterize the genome-wide methylome of rainbow trout muscle. The study’s second objective was to investigate the relationship between DNA methylation and gene expression. This study provides a genome-wide DNA methylation profiling of the polyploidy effect on DNA methylation of salmonids.

2. Materials and Methods

2.1. Fish Population and Muscle Sampling

The samples used in this study were previously described in a previous study [26]. Mature fertile/gravid (diploid) and sterile (triploid) female rainbow trout (~500 g) were sampled from Flowing Springs Trout Farm (Delray, WV, USA) during the sexual maturation/spawning season. Fish were cultivated in two identical raceways supplied with spring water at a temperature 13 ± 3 °C. All fish were fed as much as desired through a commercial diet demand feeder (Zeigler Gold; Zeigler Bros., Gardeners, PA, USA). Muscle samples were collected, and the gonado-somatic index (GSI) was 15.8 ± 0.3 (n = 5) in gravid fish compared to 0.3 ± 0.2 (n = 5) in sterile fish. The muscle tissue of 8 fish (4 fertile and 4 sterile) was collected from the dorsal side, flash-frozen in liquid nitrogen, and stored at −80 °C until DNA and RNA extraction. The muscle phenotypic characteristics of gravid and sterile fish have been previously described [26]. Briefly, gravid fish had lower muscle/whole body weight (49.9% ± 6.7% vs. 62.6% ± 2.2%, p = 0.01), less muscle protein content (16.9% ± 0.7% vs. ~19.1% ± 0.7%, p = 0.01), and softer muscle (shear force 178 ± 19 g/g vs. 240 ± 18 g/g, p = 0.01). Conversely, atrophied muscle had a higher water content (80.3% ± 0.7% vs. 77.2% ± 0.6%) and pH (6.61 ± 0.03 vs. 6.41 ± 0.04).

2.2. RNA Sequencing and Analyses

The transcriptomics results have been previously published [26] and re-analyzed here using the Swanson rainbow trout genome reference NCBI Accession: PRJNA335610 in combination with new DNA methylation data. The total RNA was extracted from muscle using the TRIzol method (Invitrogen, Carlsbad, CA, USA). The concentrations of RNA were determined using a Qubit 2 Fluorometer with Invitrogen™ Qubit™ RNA High Sensitivity assay kit. RNA was treated with DNase, and RNA integrity was assessed using gel electrophoresis. RNA sequencing was conducted at the University of Illinois at Urbana-Champaign, Roy J. Carver Biotechnology Center. RNA sequencing libraries were prepared using Illumina TruSeq stranded total RNA with Ribo-Zero gold protocol according to the manufacturer’s recommendations (Illumina Inc., San Diego, CA, USA). One barcoded sequencing library was prepared from each fish, and equal amounts of all libraries were pooled and sequenced in a single lane (2 × 100 reads) of an Illumina HiSeq 2000 sequencing platform. RNA-Seq data are available through the Sequence Read Archive (SRA), NCBI accession: SRP131630. Read mapping to genome reference and identification of DE genes were performed using the CLC genomics workbench (Qiagen Inc., Redwood City, CA, USA). DE genes between gravid and sterile fish were identified using EDGE test (FDR-p-value < 0.05, fold change: >2 or <−2) as previously described [26].

2.3. Methyl-MiniSeq Sequencing and Analyses

Muscle samples were processed and analyzed using the Methyl-MiniSeq® Service; genome-wide bisulfite sequencing was completed at Zymo Research (Irvine, CA, USA). DNA was extracted using Quick-DNA Plus Miniprep Kit. Five hundred nanograms of genomic DNA was digested first with 60 units of TaqαI followed by 30 units of MspI (NEB) and then purified with Zymo Research DNA Clean & Concentrator™-5. According to Illumina’s specified guidelines, fragments were ligated to pre-annealed adapters containing 5′-methylcytosine instead of cytosine. Adaptor-ligated fragments of 150–250 bp and 250–350 bp were retrieved from a 2.5% NuSieve 1:1 agarose gel using Zymoclean™ Gel DNA Recovery Kit. The EZ DNA Methylation-Lightning™ Kit was used for the bisulfite treatment. PCR was performed and the products were purified with DNA Clean & Concentrator™-5 for sequencing on an Illumina HiSeq. Sequence data are available through the Sequence Read Archive (SRA), NCBI accession: PRJNA431930.
Sequence reads from Methyl-MiniSeq libraries were identified using standard Illumina base-calling software. Raw FASTQ files were adapter- and quality-trimmed using TrimGalore 0.6.5. Filled-in nucleotides were also trimmed using TrimGalore 0.6.5. FastQC 0.11.8 was used to assess the effect of trimming and the overall quality distributions of the data. Reads with low quality (<20) were filtered out. Duplicate reads were removed using the deduplication function in Bismark. Alignment to the rainbow trout genome (https://www.ncbi.nlm.nih.gov/assembly/GCF_002163495.1/, accessed on 2 May 2022) was performed using Bismark 0.22.3 [27]. Using Bismark Methylation Extractor, methylated and unmethylated read totals for each CpG site were called. Sites with coverage of fewer than ten reads were not considered for subsequent analyses. The methylation level of the cytosines was calculated as the number of reads calling C, divided by the total number of reads calling C and T. Rainbow trout CpG islands were extracted from NCBI genome reference to annotate the methylation sites. The MethylKit R package was used to calculate the differential methylation between the diploid/gravid and triploid/sterile fish [28]. CpG sites with less than ten read depths or more than 99.9th percentile of coverage in each sample were filtered out to account for PCR bias. CpG sites exiting in a minimum of three samples of each group (3 out of 4) were kept for further analysis. CalculateDiffMeth function was used to determine the differential CpG site using logistic regression to calculate p-values [28]. Hyper- and Hypo-methylation were determined based on a q-value < 0.01 and a more than 25% methylation difference. JMP Pro®, Version 15. SAS Institute Inc., (Cary, NC, USA) was used to generate figures and statistical analyses to produce measures of association between DNA methylation percent and gene transcription expression deciles within each 1 kb or specific region, as mentioned in the results, flanking the TSS, using the correlation multivariate and nonparametric Spearman’s correlation functions. PROMO was used to identify putative transcription factor binding sites in DNA sequences [29].

3. Results and Discussion

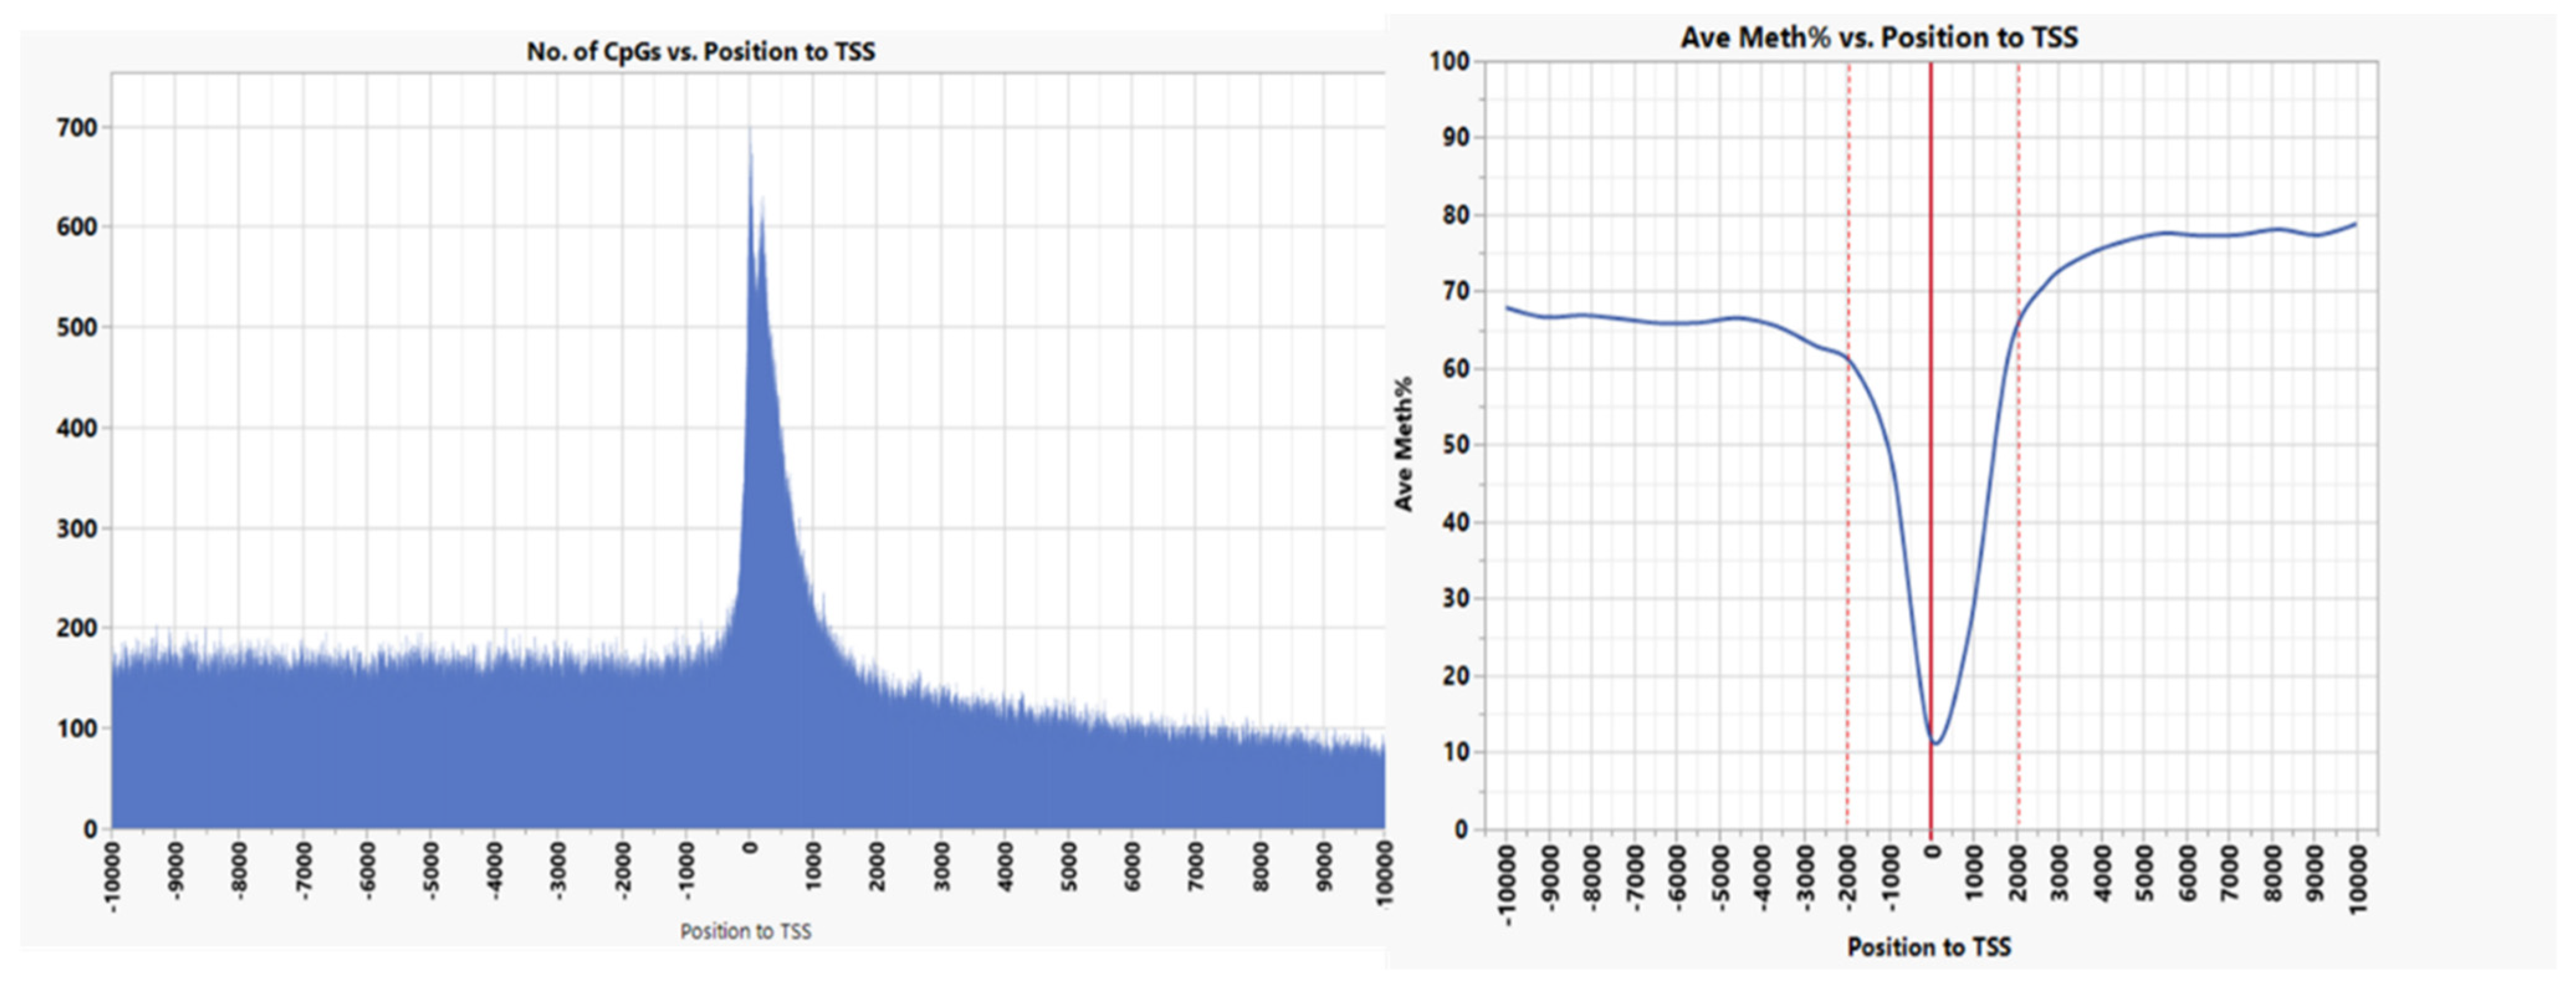
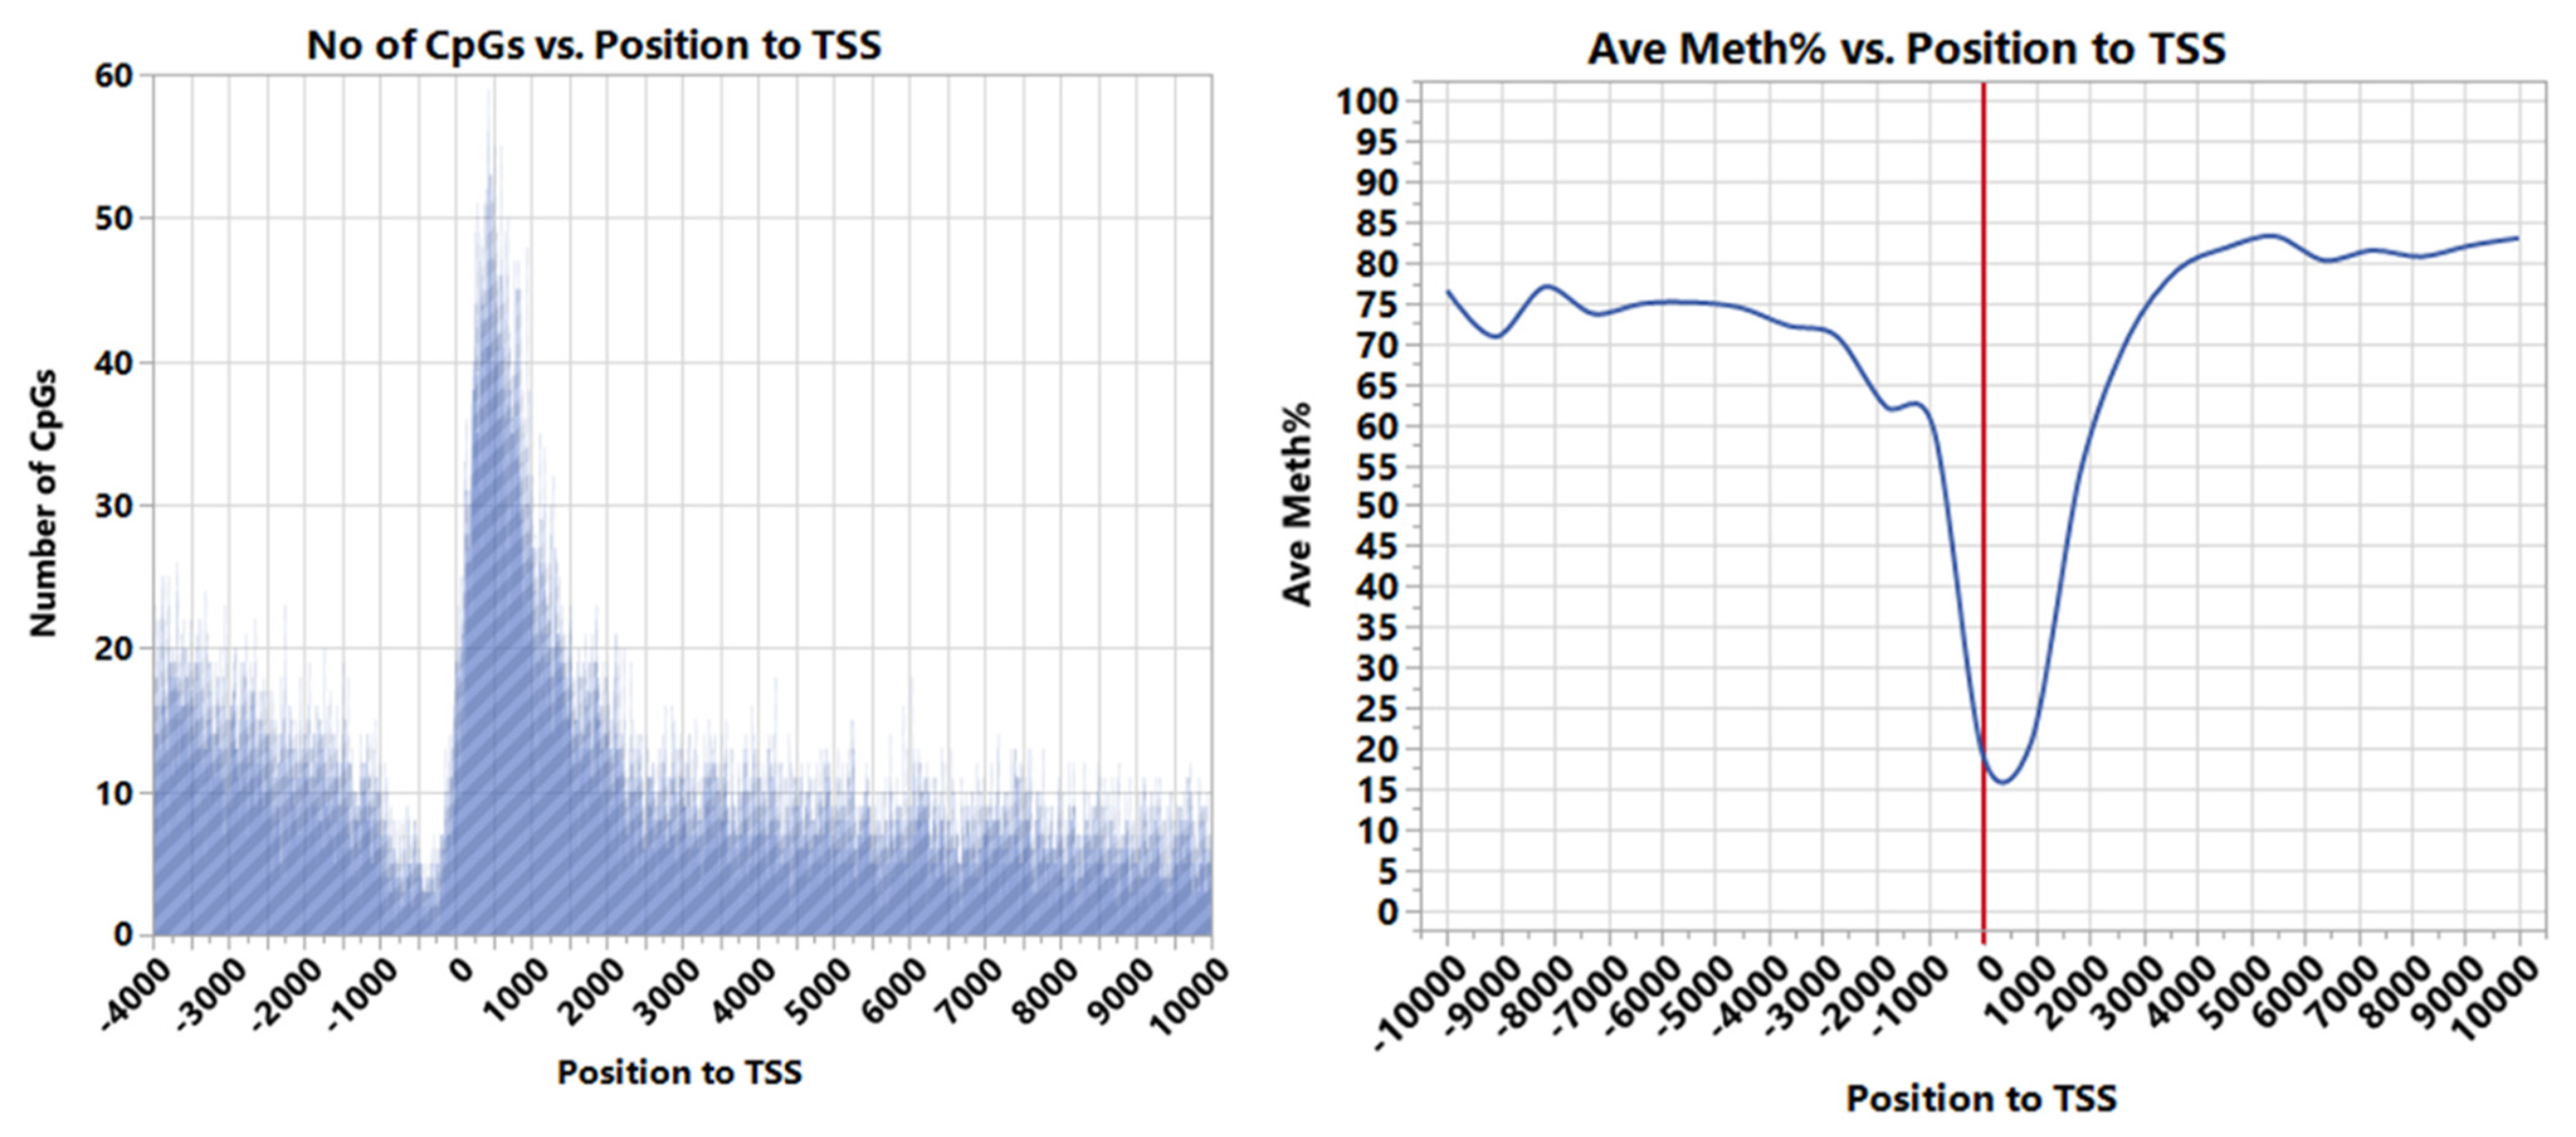
3.1. CpG Dinucleotide Content in the Rainbow Trout Genome

The average number of sequence read pairs per sample analyzed in this study was 44,610,663. The average cytosine percentage in the CpGs context was 11.74 ± 1%, compared to 22.56 ± 0% in CHG and 65.69 ± 1% in CHH (where H corresponds to A, T, or C). The highest percentage of the methylated cytosines (62.18 ± 1%) was in the CpG context compared to only 1.09 ± 0% in CHG and 1.78 ± 0% in CHH contexts.
The highest percentage of the methylated cytosines (62.18%) was in the CpG context compared to only 1.09% in CHG and 1.78% in CHH contexts. The number of CpGs in the rainbow trout genome is 35,336,288. The CpG dinucleotide frequency in the genome is 1.83%, which is 3.4-fold less than the expected frequencies of the sixteen dinucleotides. Mammalian genomes have ~5-fold fewer CpG dinucleotides than expected [30], with 70–80% of the CpGs being methylated [31]. Spontaneous mutations of methylated C residues to T by deamination explain the CpG under-representation in genomes. On the other hand, unmethylated C mutates to U, which is quickly repaired [32].
Consistent with our data, 69.60% of mature tilapia muscle CpG cytosines are methylated compared to only 0.57% and 0.47% of the CHH and CHG context, respectively [33]. Similar results were reported in pufferfish and zebrafish, where 65–80%, 0.25–1%, and 0.34–1% of cytosines are methylated in CpG, CHG, and CHH, respectively [33,34]. In humans, on the other hand, almost all DNA methylation (99.98%) exists in CpG dinucleotides; non-CpG methylation accounts for 25% of cytosines in stem cells, though [8]. Mice also have about 74% methylated CpGs compared to about 0.6% non-methylated CpGs [33]. These data generally indicate conservation of CpG methylation in eukaryotic genomes.
In this study, 3,161,570 cytosines in the CpG context were classified as genic (located within ±10 kb of the TSS) and were considered in the subsequent analysis. The rest of the data were intergenic.

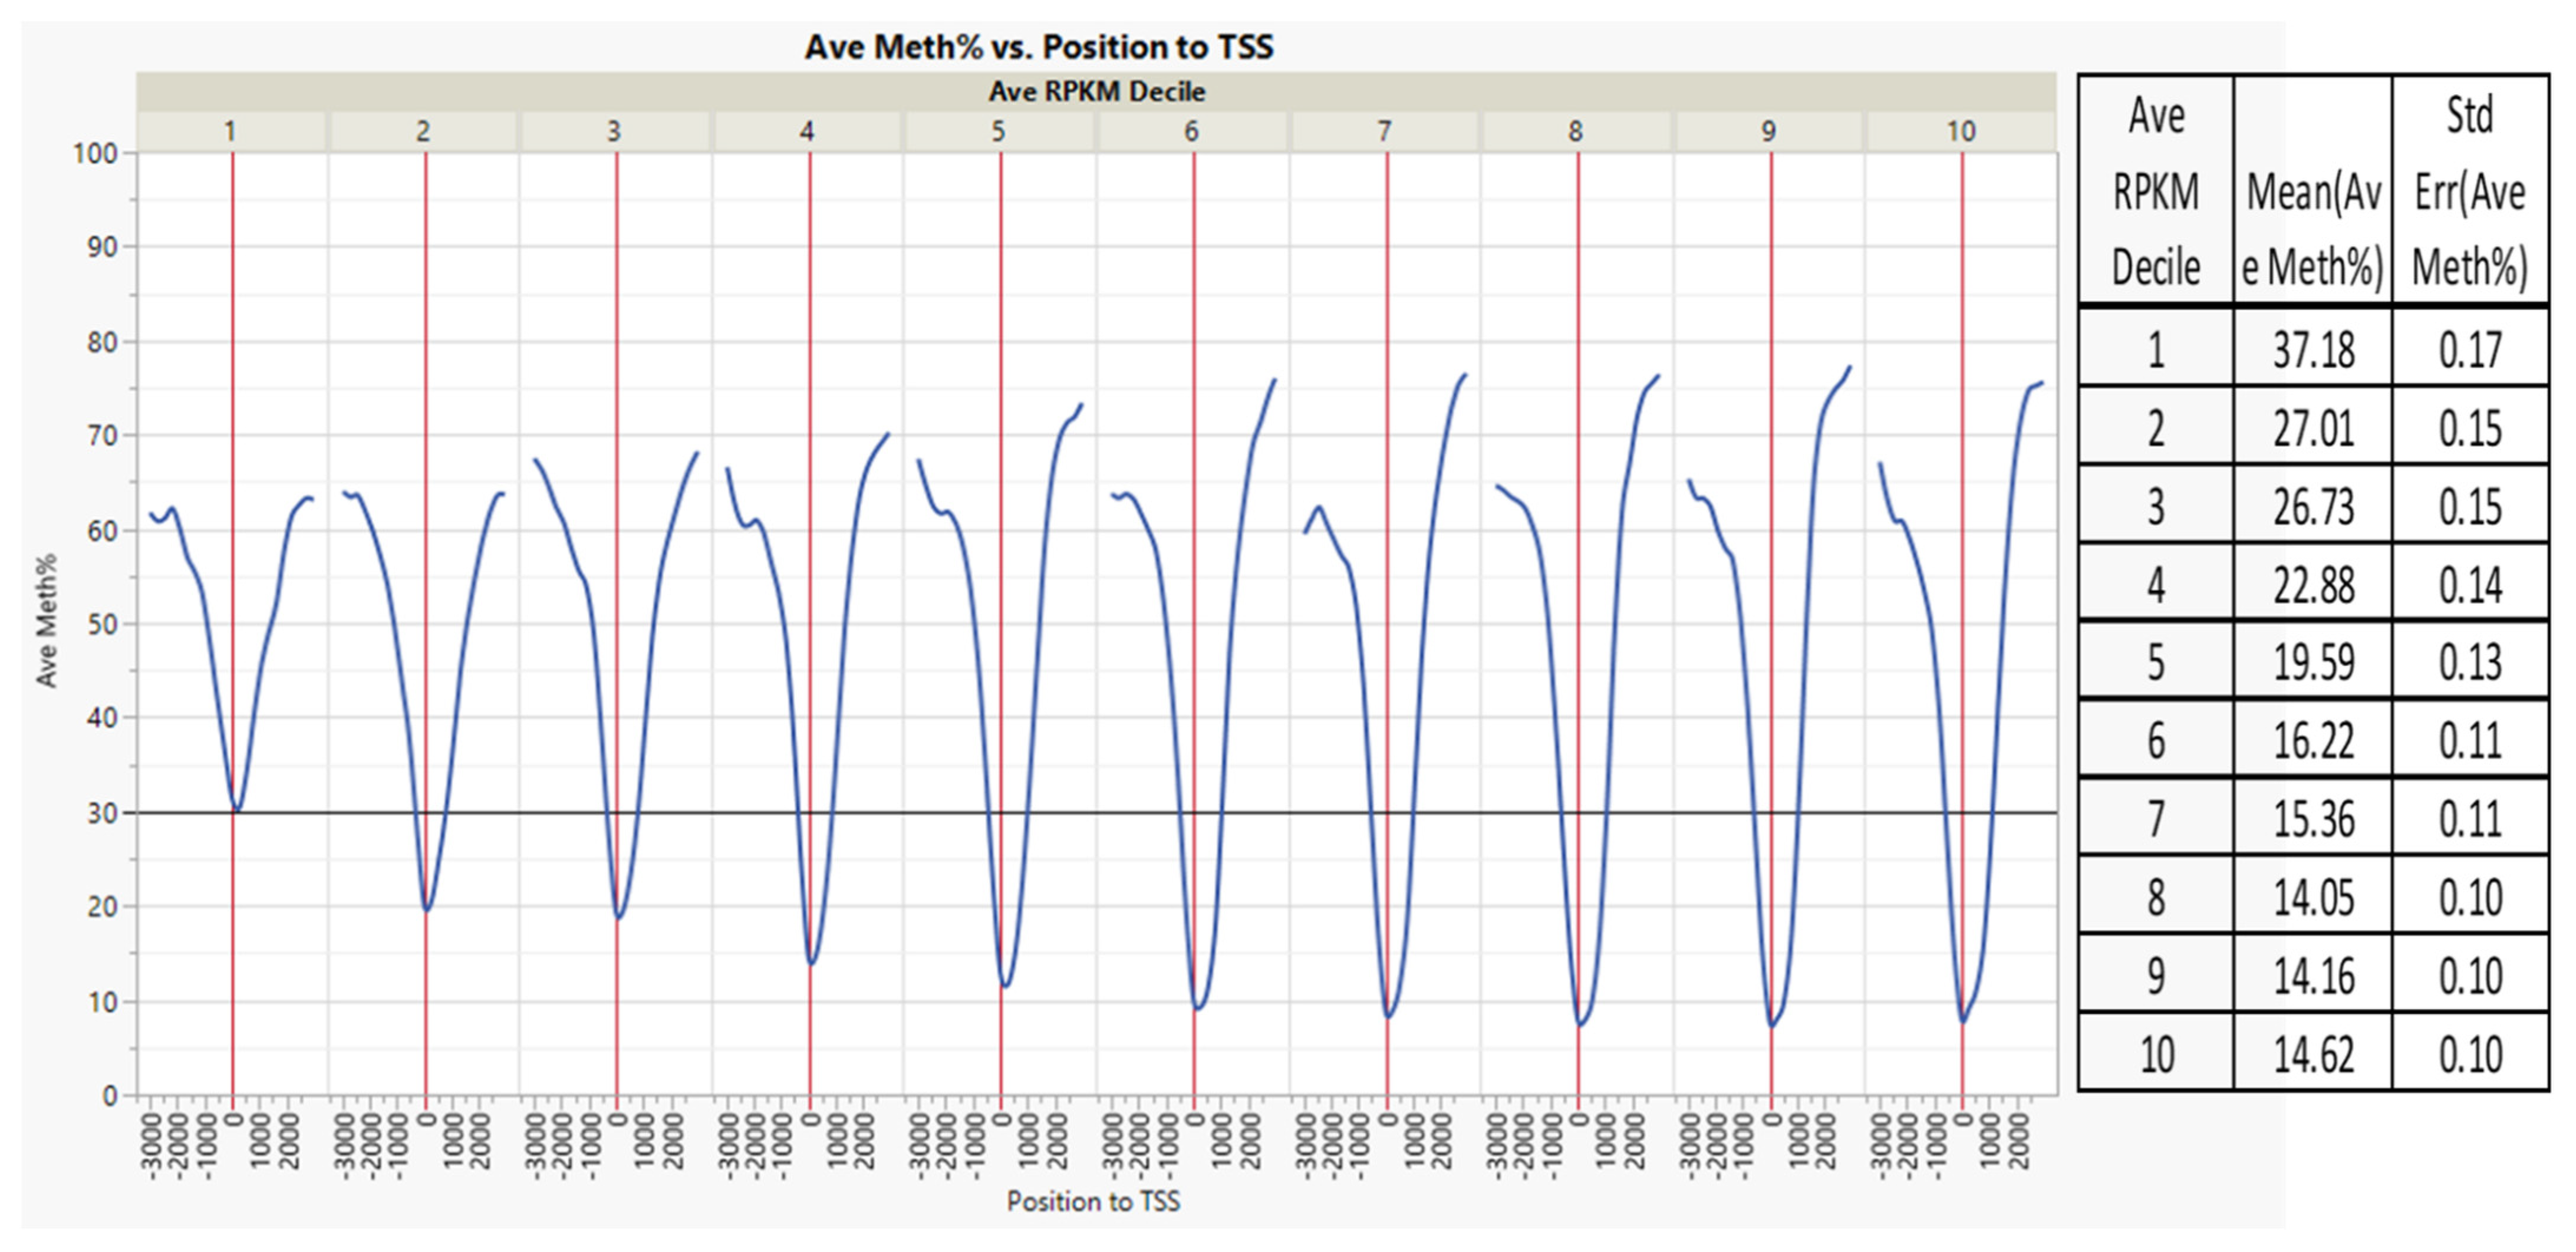
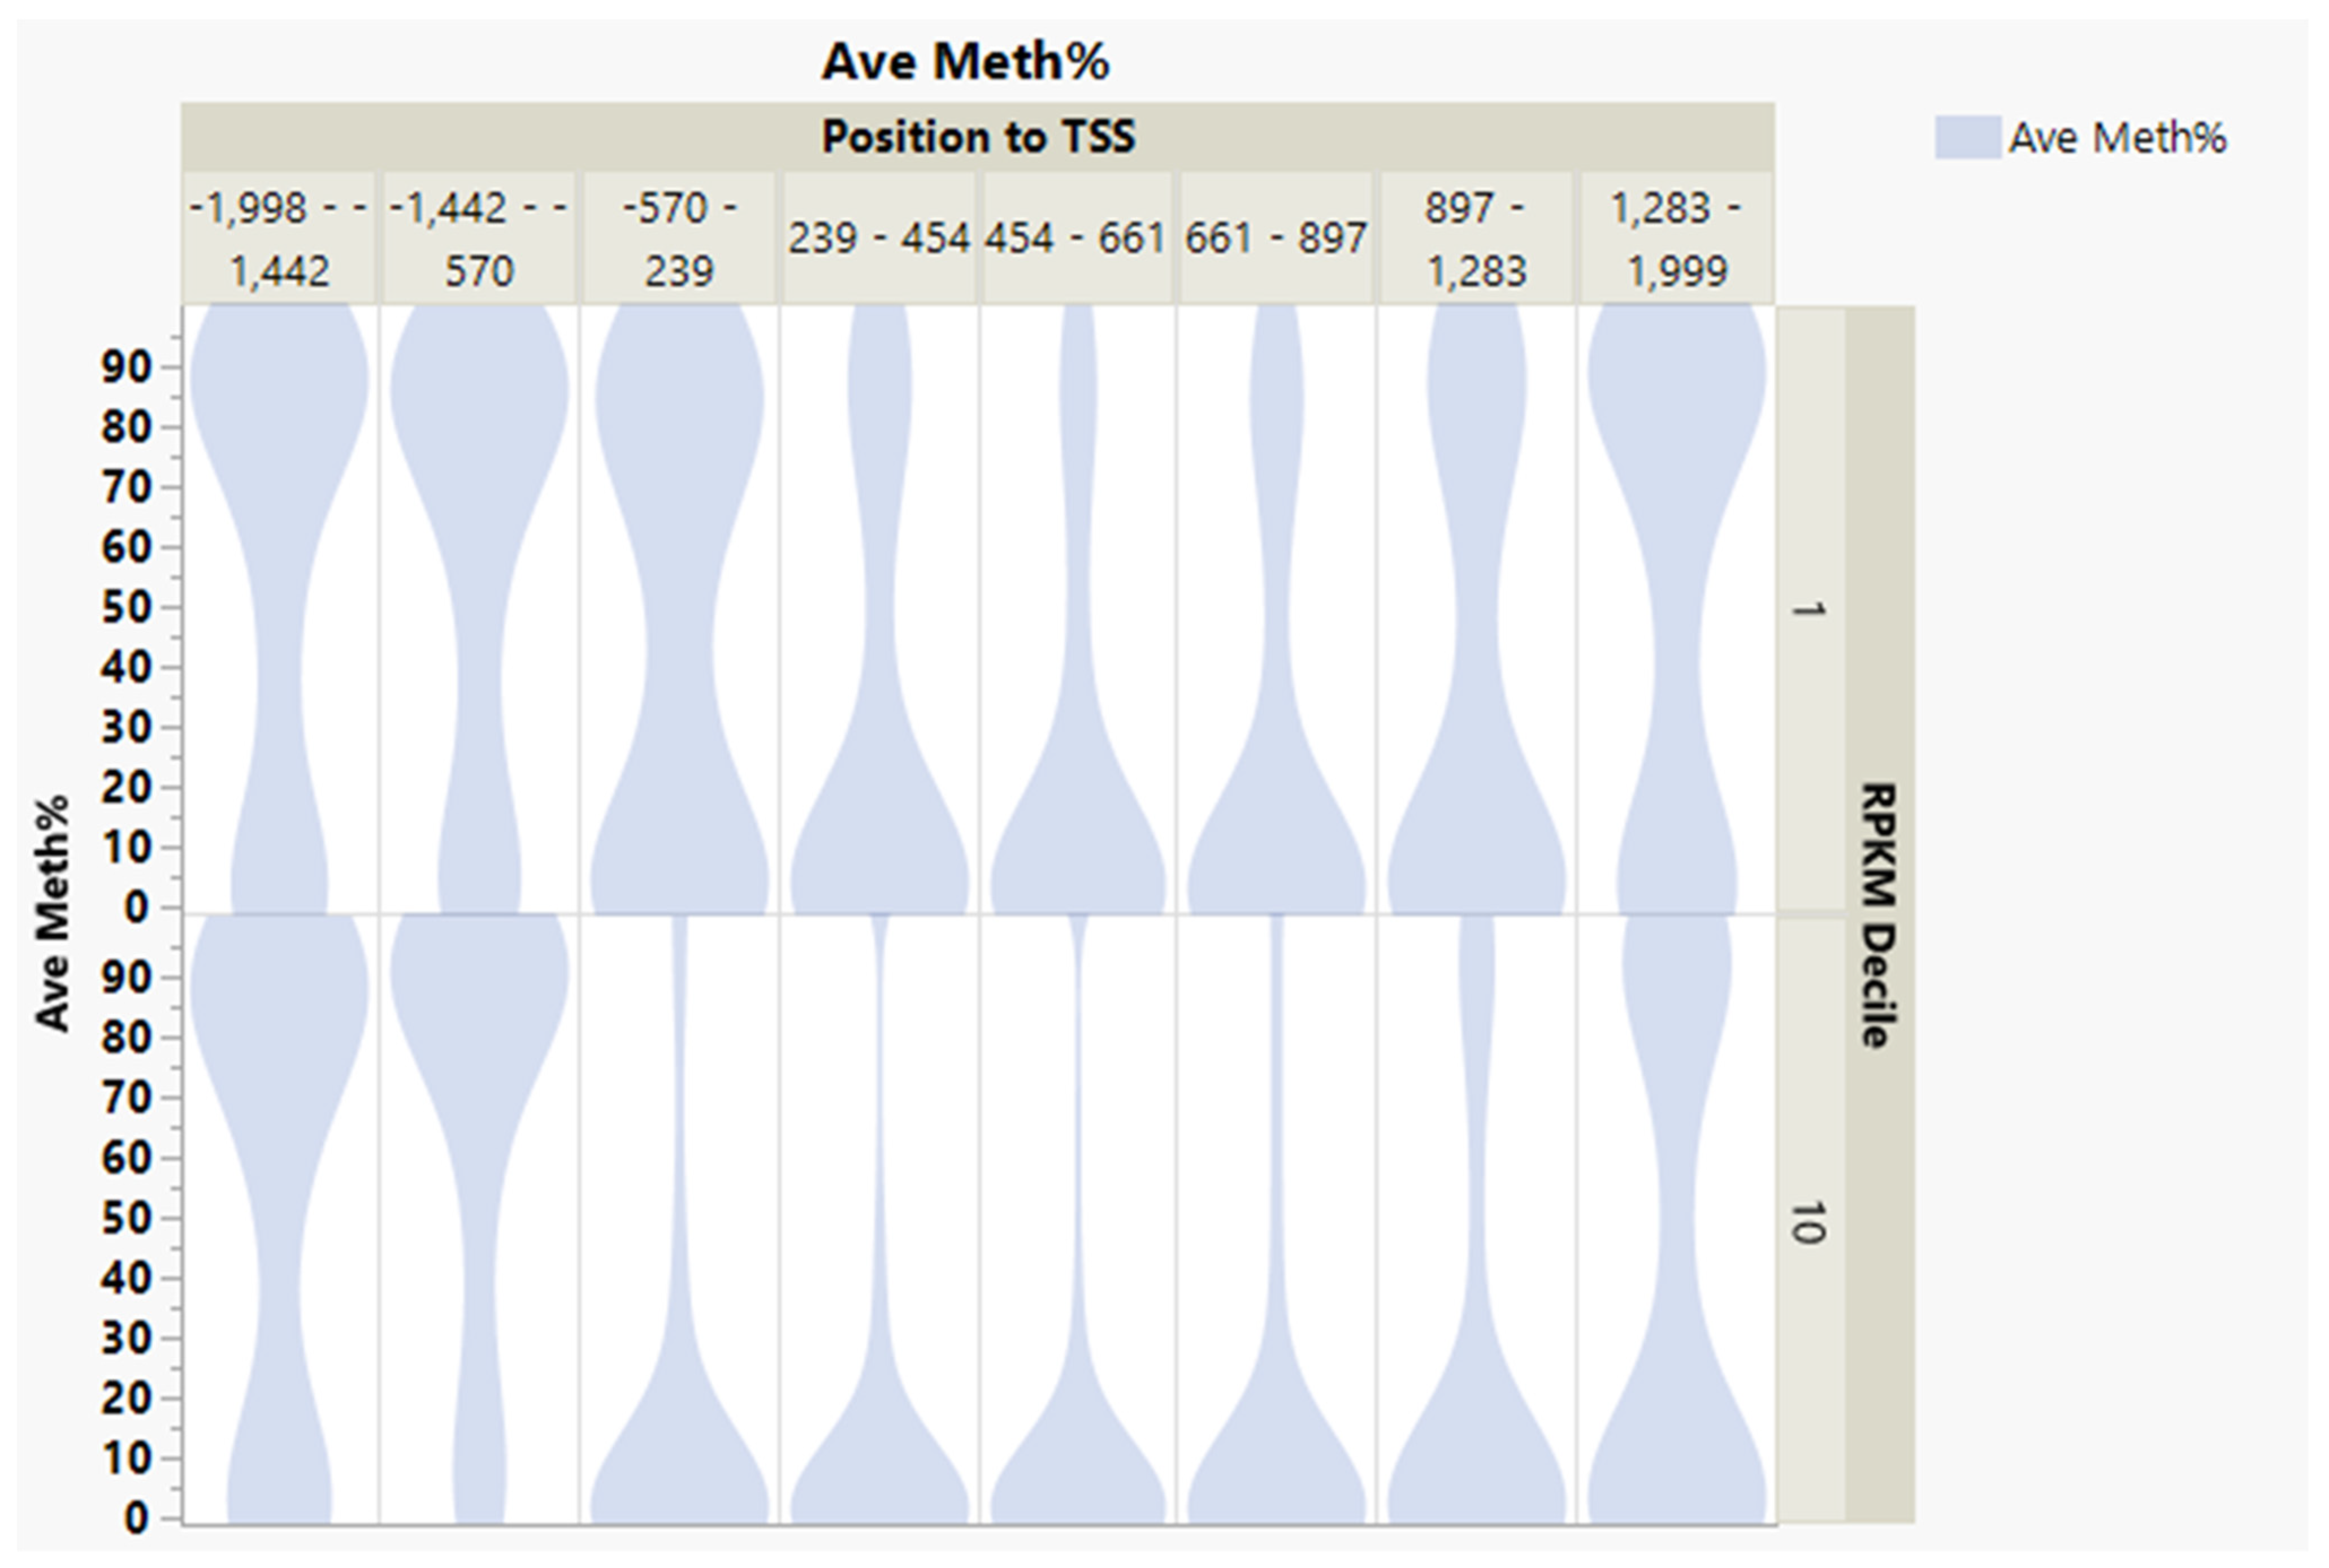
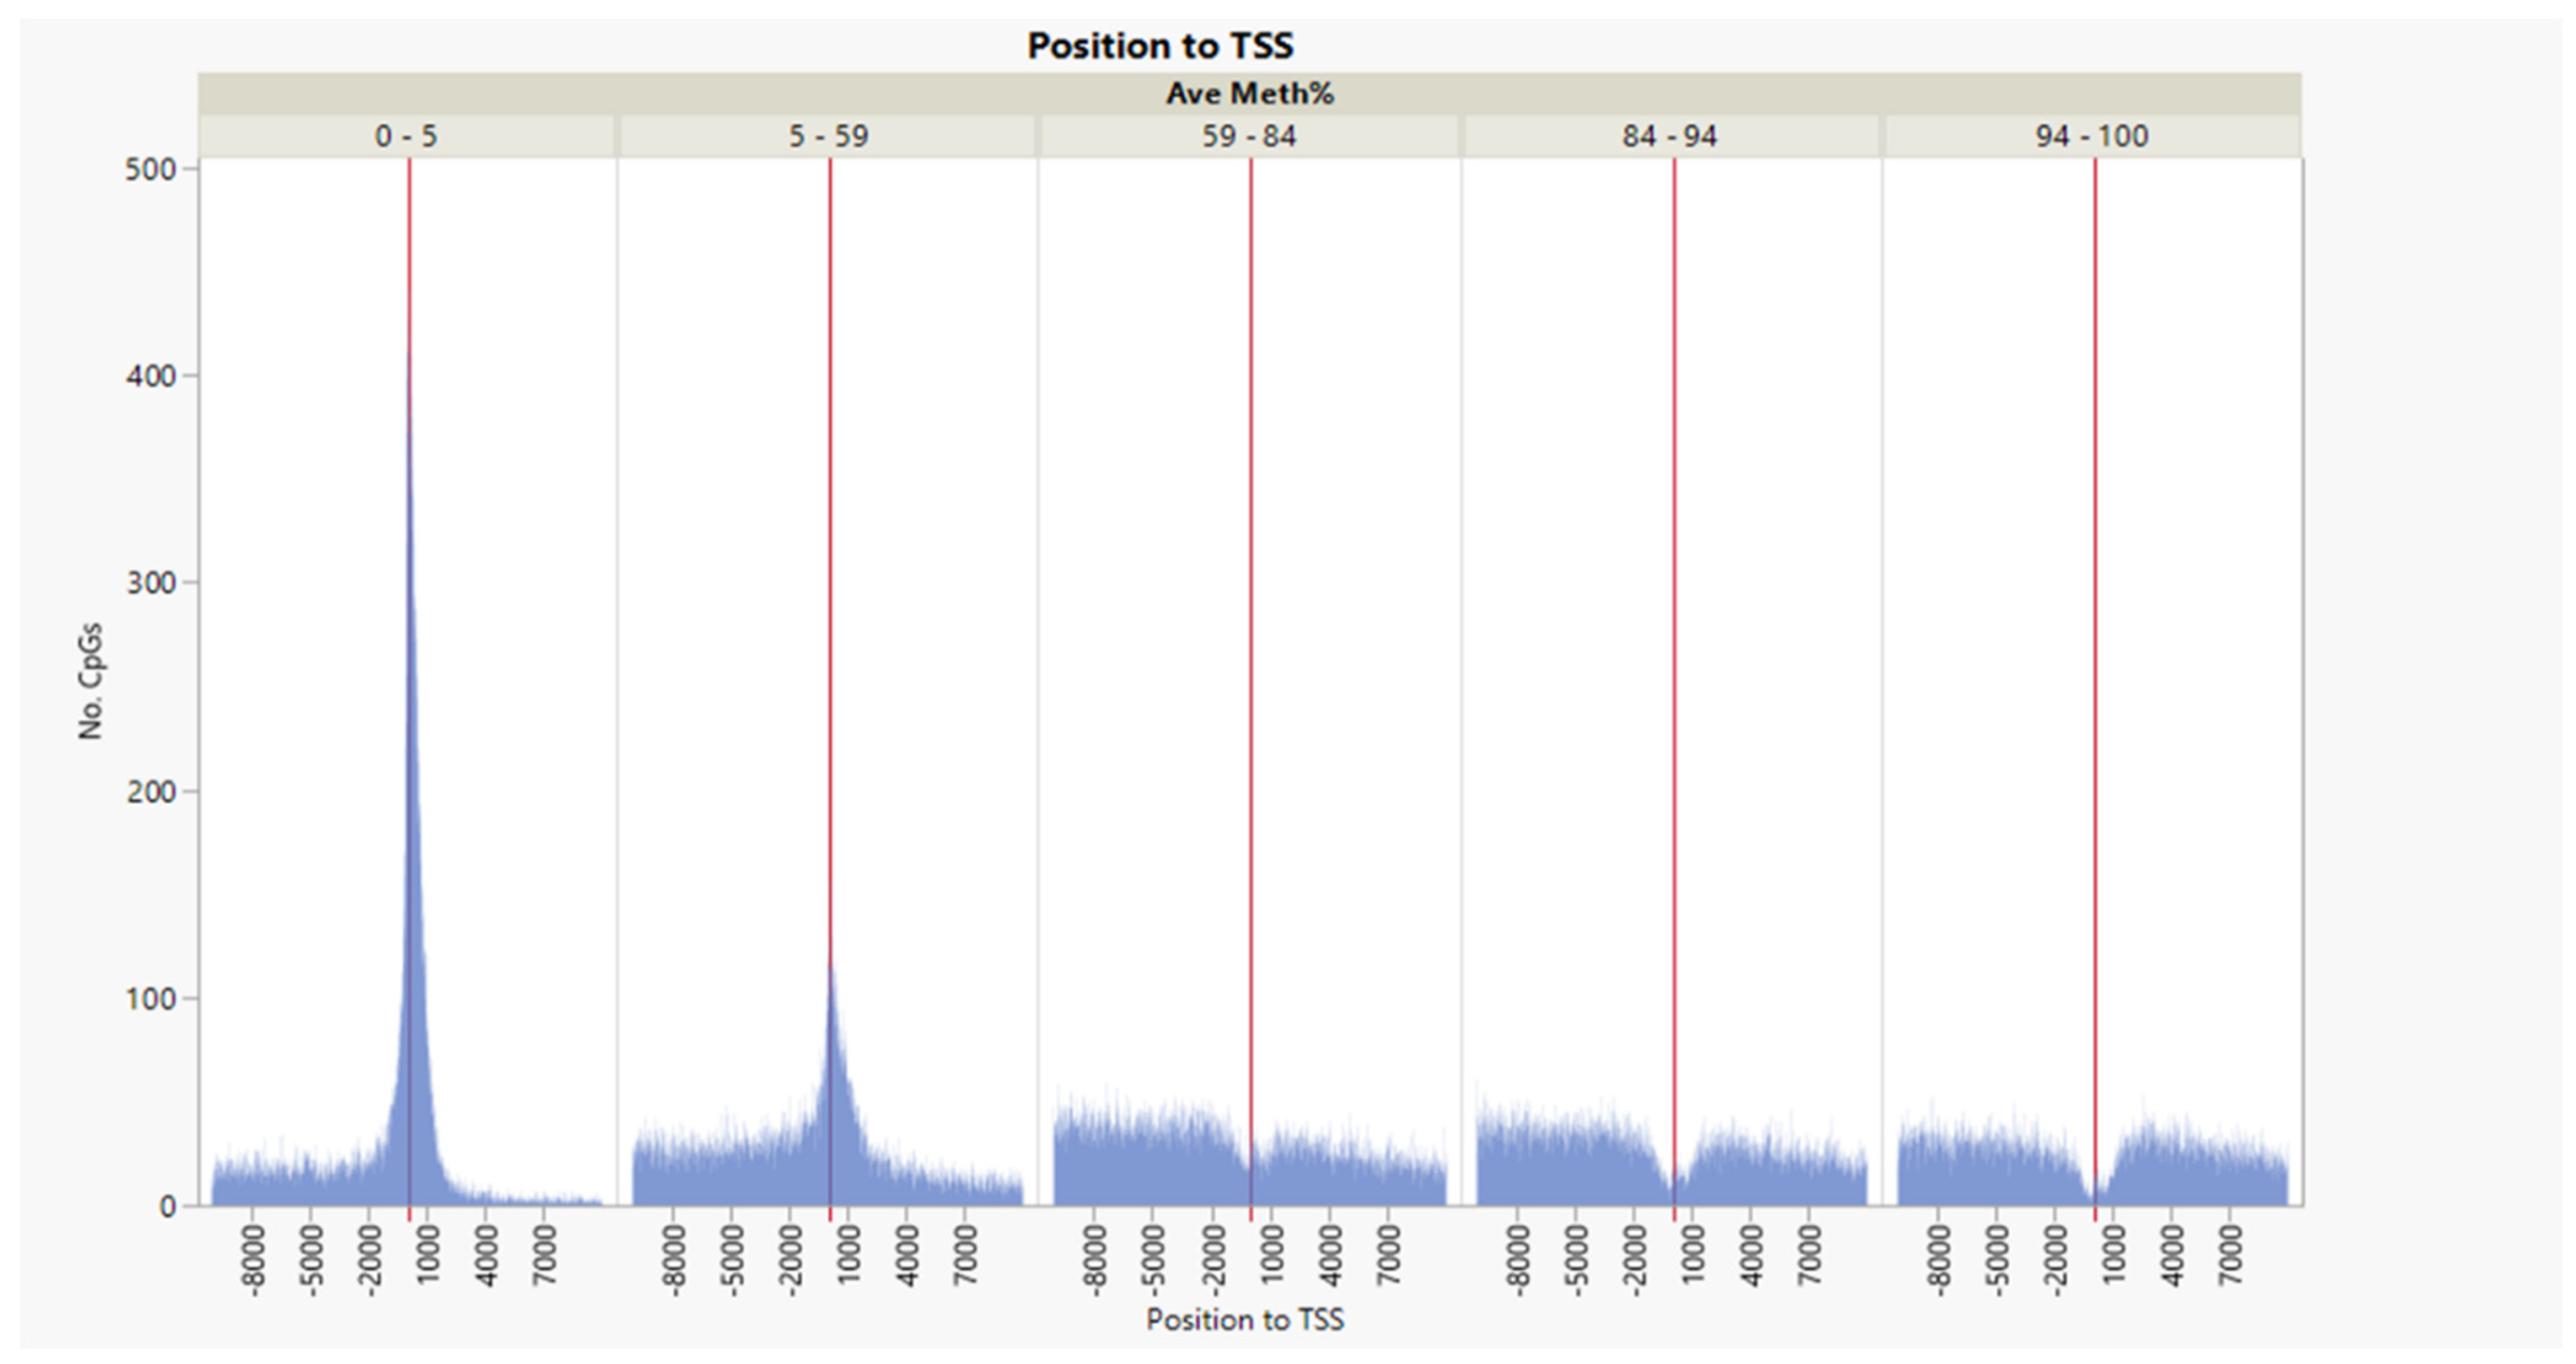
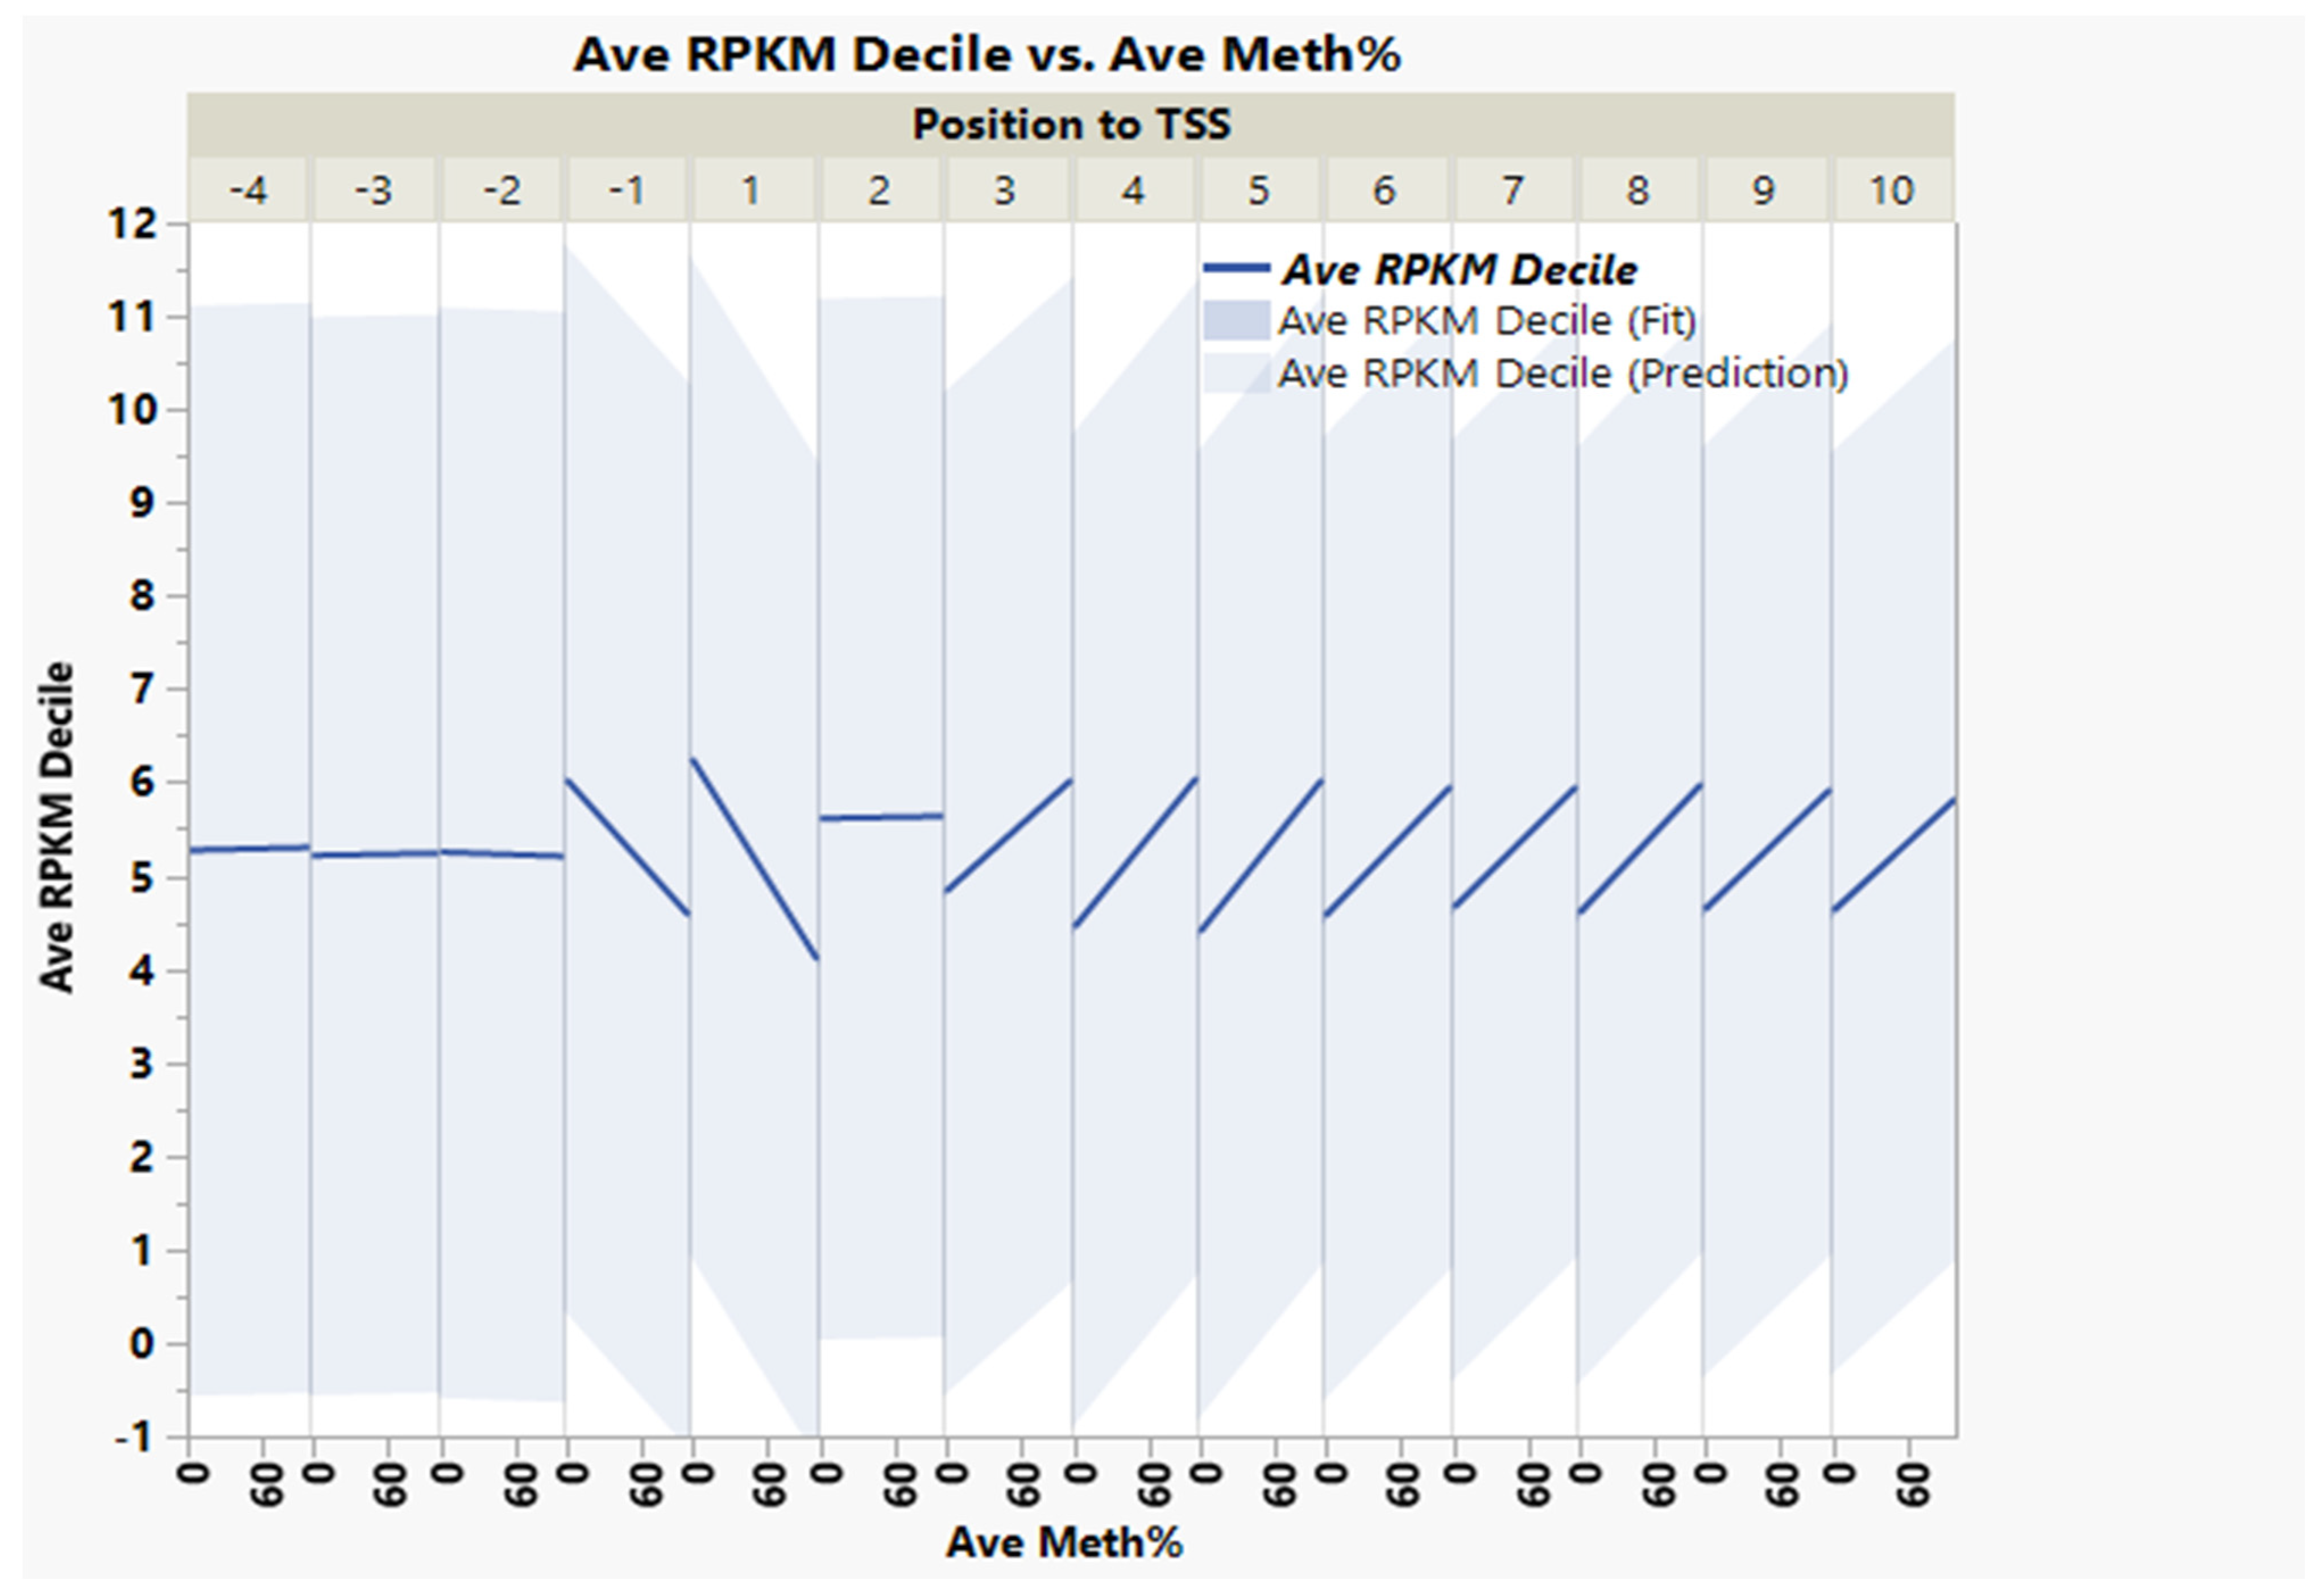
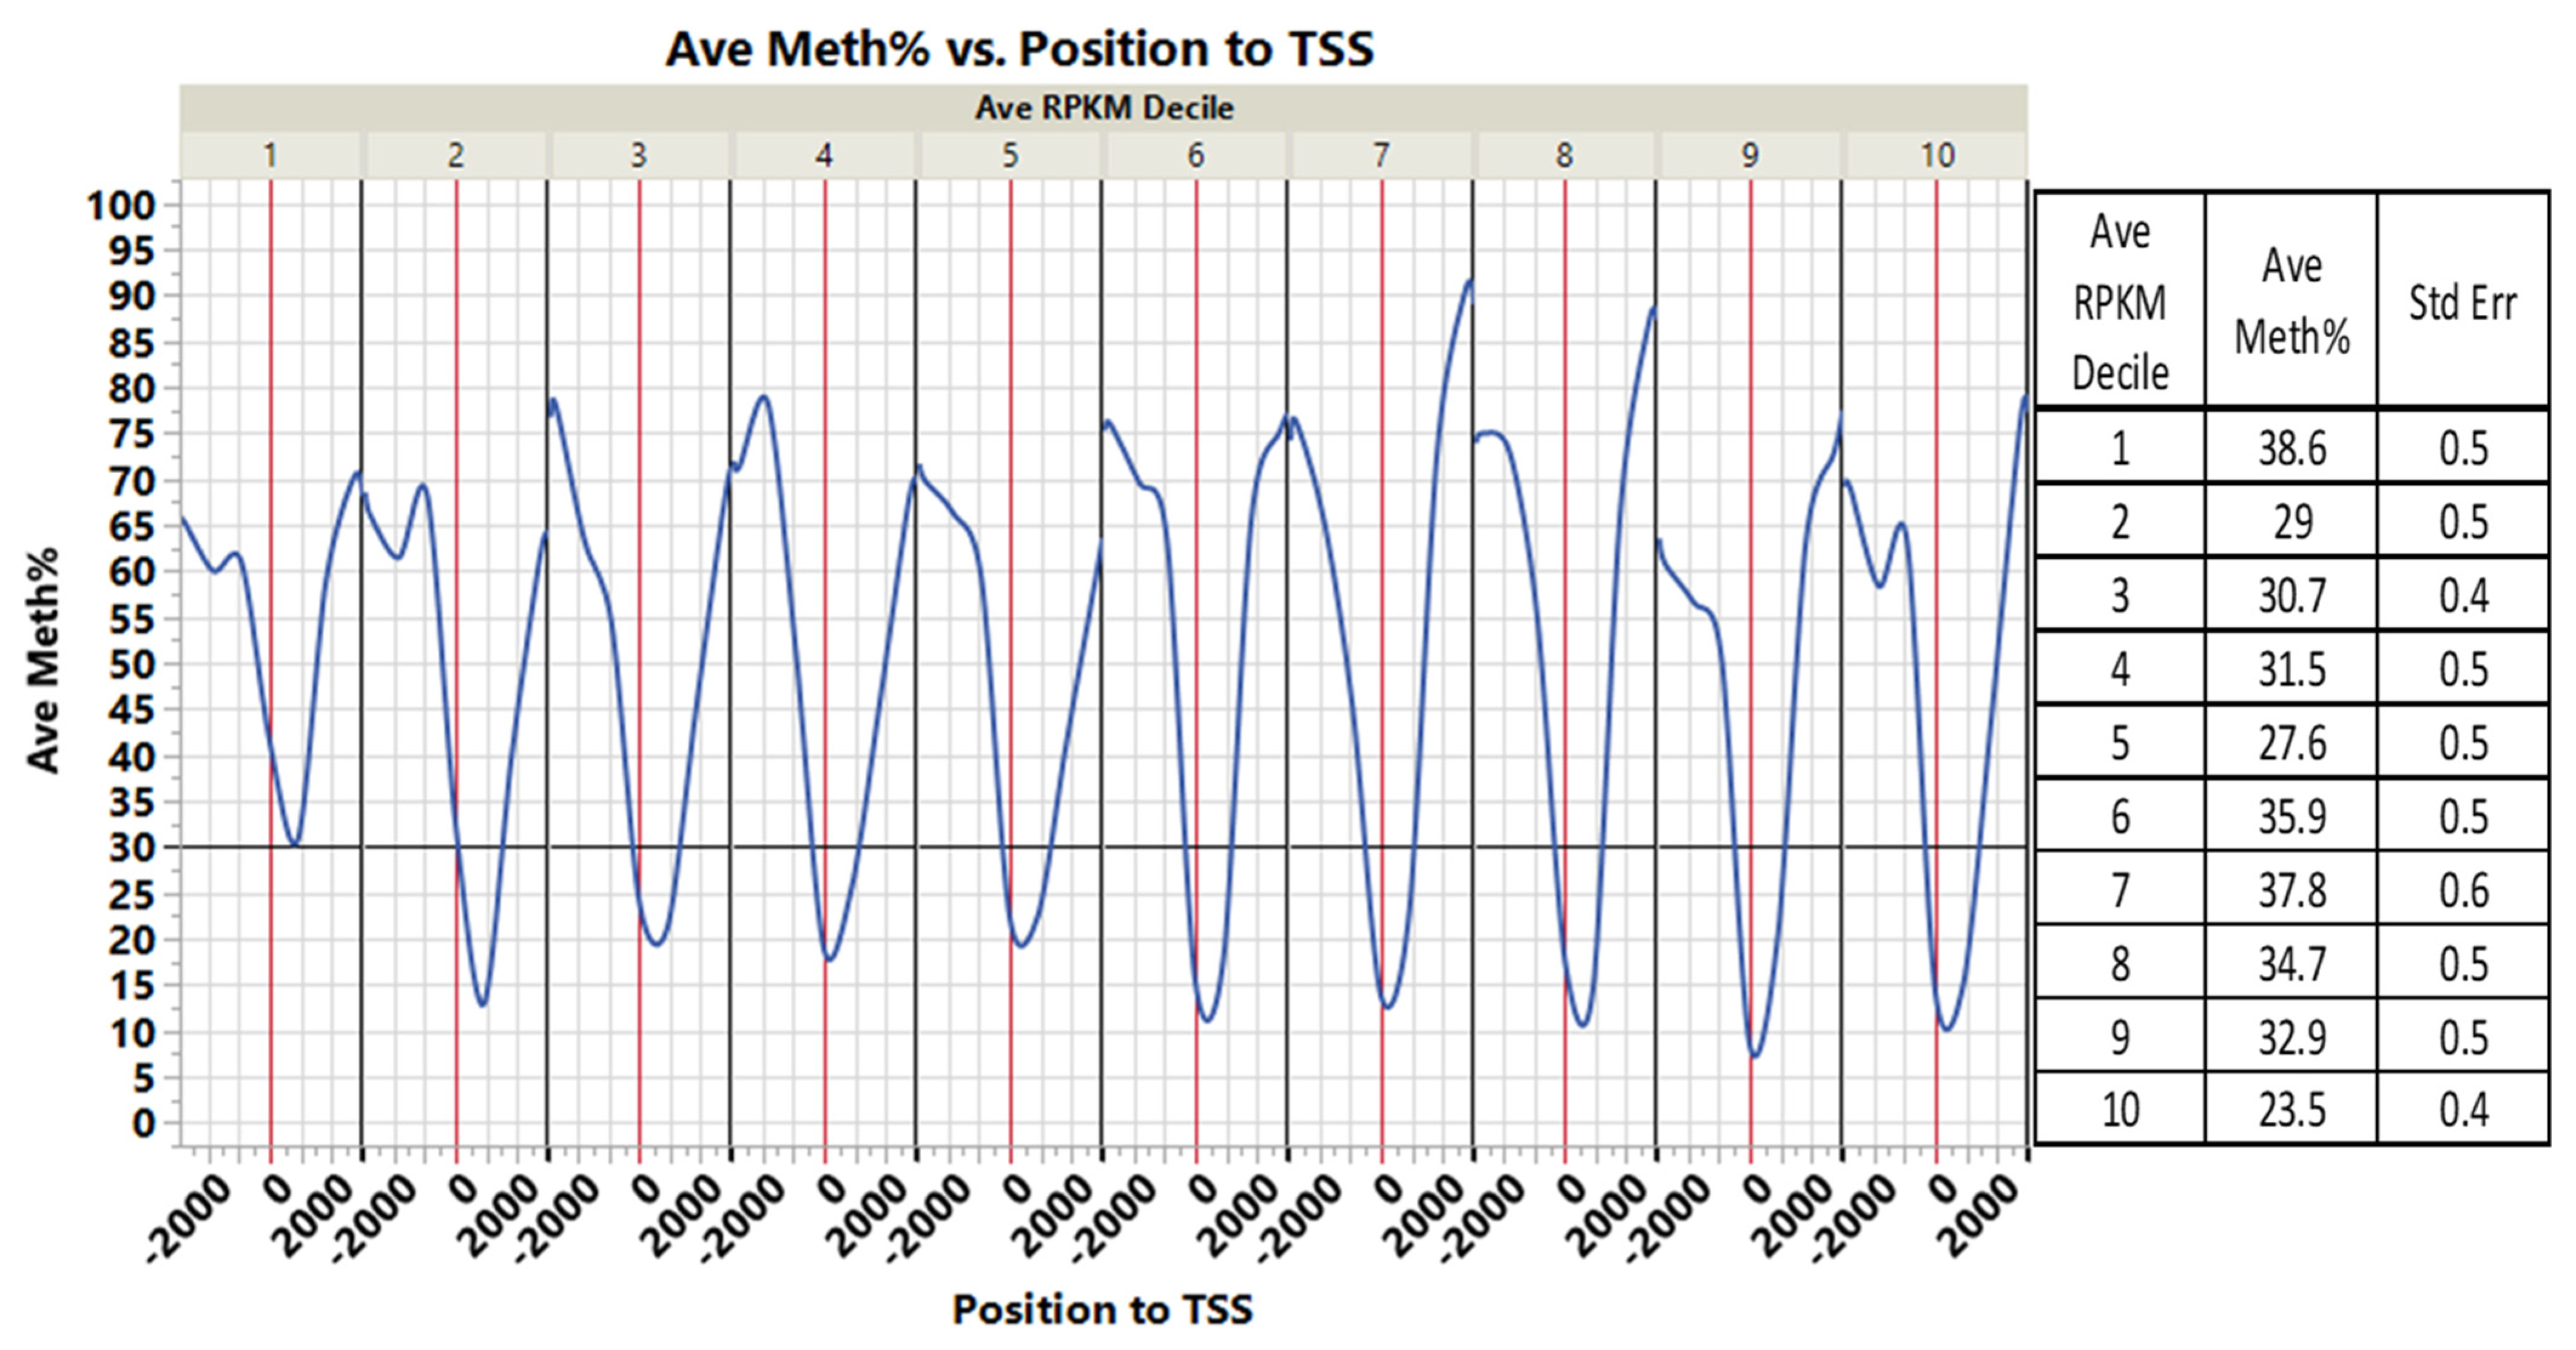
3.2. Non-Island Genic CpGs and Their Associated Gene Expression

Methyl Mini-seq revealed the existence of 2,916,293 non-island CpGs located within ±10 kb of TSS of 42,104 loci/genes. The overall CpGs density per nucleotide within the ±10 kb region was 145.8 CpGs/NT (Figure 1). However, the CpG density in the ±1 kb region flanking the TSS was 295.3 CpGs/NT, indicating enrichment of CpGs around TSS compared to other genic regions.
Consistent with our observations, comparative epigenomic studies revealed conserved high CpG density around TSS. In fish, higher CpG density around TSS has been reported; however, the depletion of the CpG number, up-and down-stream of TSS, was less than that in mammals, perhaps due to lower GC content of fish genomes [35].
The average percent of CpGs methylation in ±10 kb flanking TSS was 57.7%; nevertheless, a sharp decline in DNA methylation was noticed in the ±2 kb region flanking the TSS. The average methylation percent of this region was 31.6% and reached as low as 12% near the TSS (Figure 1). Although CpGs increased near TSS, most of the CpGs were under-methylated. Figure 2 presents the number of CpGs per nucleotide near the TSS at different intervals of average methylation percentages.
Few studies investigated the genome-wide DNA methylation patterns in fish. A comparative epigenomics study including fish revealed that CpG density is strongly associated with the unmethylated state of DNA. Higher CpG density and lower methylation was reported around TSS in mouse and zebrafish livers [36]. Pufferfish promoters showed hypomethylated promoters in genes with intermediate CpG densities [35]. Studies explained that some proteins, such as CXXC-containing proteins and CG-rich binding transcription factors recruited by CpG-rich regions, maintain the unmethylated DNA state [35,37,38]. Another comparative study, including plants and animals, reported genome-wide high levels of CpGs methylation (~80%) in zebrafish larvae and mouse embryos [39]. A study on the tilapia genome showed a gradual decrease in CpG methylation level to 25% near the TSS compared to 75% in the gene body [33]. Low methylation levels on both sides of the TSS were reported in pufferfish with higher methylation levels in the gene body and downstream of genes [35].
Integrated analysis of Methyl Mini-seq and RNA-Seq showed a weak/moderate correlation between the average percentage of DNA methylation and gene transcription expression deciles calculated based on the expression ranking measured in RPKM (Reads Per Kilobase Million). However, this correlation was dependent on CpG position relative to TSS (p value < 0.0001).
Within ±1 kb of the TSS, there was a negative correlation between the average DNA methylation percent and gene transcription expression deciles (Figure 3, correlation multivariate = −0.2046, p < 0.0001, nonparametric Spearman’s correlation = −0.2098, p < 0.0001). The average percentage DNA methylation within ±1 kb of the genes’ TSS at the first decile (lowest) of the expression range was 37.2%, compared to 14.6% in the 10th decile (highest) (Figure 4).
Conversely, within +3 to +10 kb in the gene body, there was a weak positive correlation between DNA methylation and gene expression (Figure 3, correlation multivariate = 0.1378, p < 0.0001, nonparametric Spearman’s correlation = 0.2000, p < 0.0001).
Regarding the effect of CpG location on TSS and consistent with our data, fish and mammalian studies showed that gene expression is inversely correlated with DNA methylation in the first exon and the promoter [40,41]. A study of European sea bass showed a negative correlation between gene expression and the first intron, and the study speculated that the relationship might be due to transcription factor-binding motifs enrichment [40]. Conversely, a positive correlation has been demonstrated between gene expression and gene body methylation levels [42]. Moore et al. reported that the positive correlation between gene–body DNA methylation and gene expression is only in the dividing, not nondividing, cells [6]. In birds, however, CpG methylation at TSS and gene bodies of the great tit genome were negatively correlated with gene expression (Spearman’s rank correlation, Spearman’s rho < −0.23) [43]. The transcription factors’ sensitivity to DNA methylation can explain the TSS-flanking region methylation effect on gene expression [44]. However, the mechanism for explaining how gene body DNA methylation influences gene expression is still not clear. Guo et al. suggested a mechanistic link between gene transcription and DNA methylation at gene bodies. As gene transcription proceeds, H3K36me3 is deposited in gene bodies and helps recruit the DNA methyltransferase 3-DNMT3 PWWP domain [45]. The effects of DNA methylation on gene expression and splicing were also suggested, as reviewed in [30].
Few studies have investigated the relationship of DNA methylation to gene expression at the genome-wide level in fish. In tilapia as a general trend, a moderate negative correlation between CpG methylation in the gene promoter region (1000 bp upstream from TSS) and expression level was observed in male versus female fish (y = −0.28x + 43.7) [33]. Other studies have investigated DNA methylation relationships with a limited number of gene expressions. Atlantic Salmon challenged with high temperatures and hypoxia showed an inconsistent (positive and negative) correlation between CpG methylation levels and transcriptional changes of a few genes [46]. Another study on European sea bass detected global changes in DNA methylation caused by small ocean temperature increases. However, the study did not find a causal relationship between DNA methylation and gene expression [47]. Another study of sea bass looked at a few sex-relevant genes and reported a relationship between cyp19a1a methylation and its expression, but only under a methylation level of about 80%. However, the relationship was positive in males and negative in females [48]. In tongue sole fish, a correlation in expression of the dmrt1 gene and its DNA methylation during gonadal sex determination was reported after hatching [49]. The study showed that male-specific expression of dmrt1 during development was coordinated with the hypermethylation of the gene promoter in ovaries. Interestingly, this hypermethylation was reverted in genotypic females by high-temperature incubation, leading to the development of testes.
These studies suggest that DNA methylation is one of several epigenetic mechanisms regulating gene expression. Other mechanisms, such as histone modification or noncoding RNA, are also suggested to be necessary. A negative correlation between DNA methylation and histone H3K4me3 was observed across mammalian genomes [45]. Guo et al. showed that DNMT3A activity is induced when the histone H3K4 becomes unmethylated [45]. Additionally, if CpG is located in an enhancer or transcription factor- or repressor- binding site, CpG location may define the relationship between DNA methylation and gene expression, positive or negative [11,44].

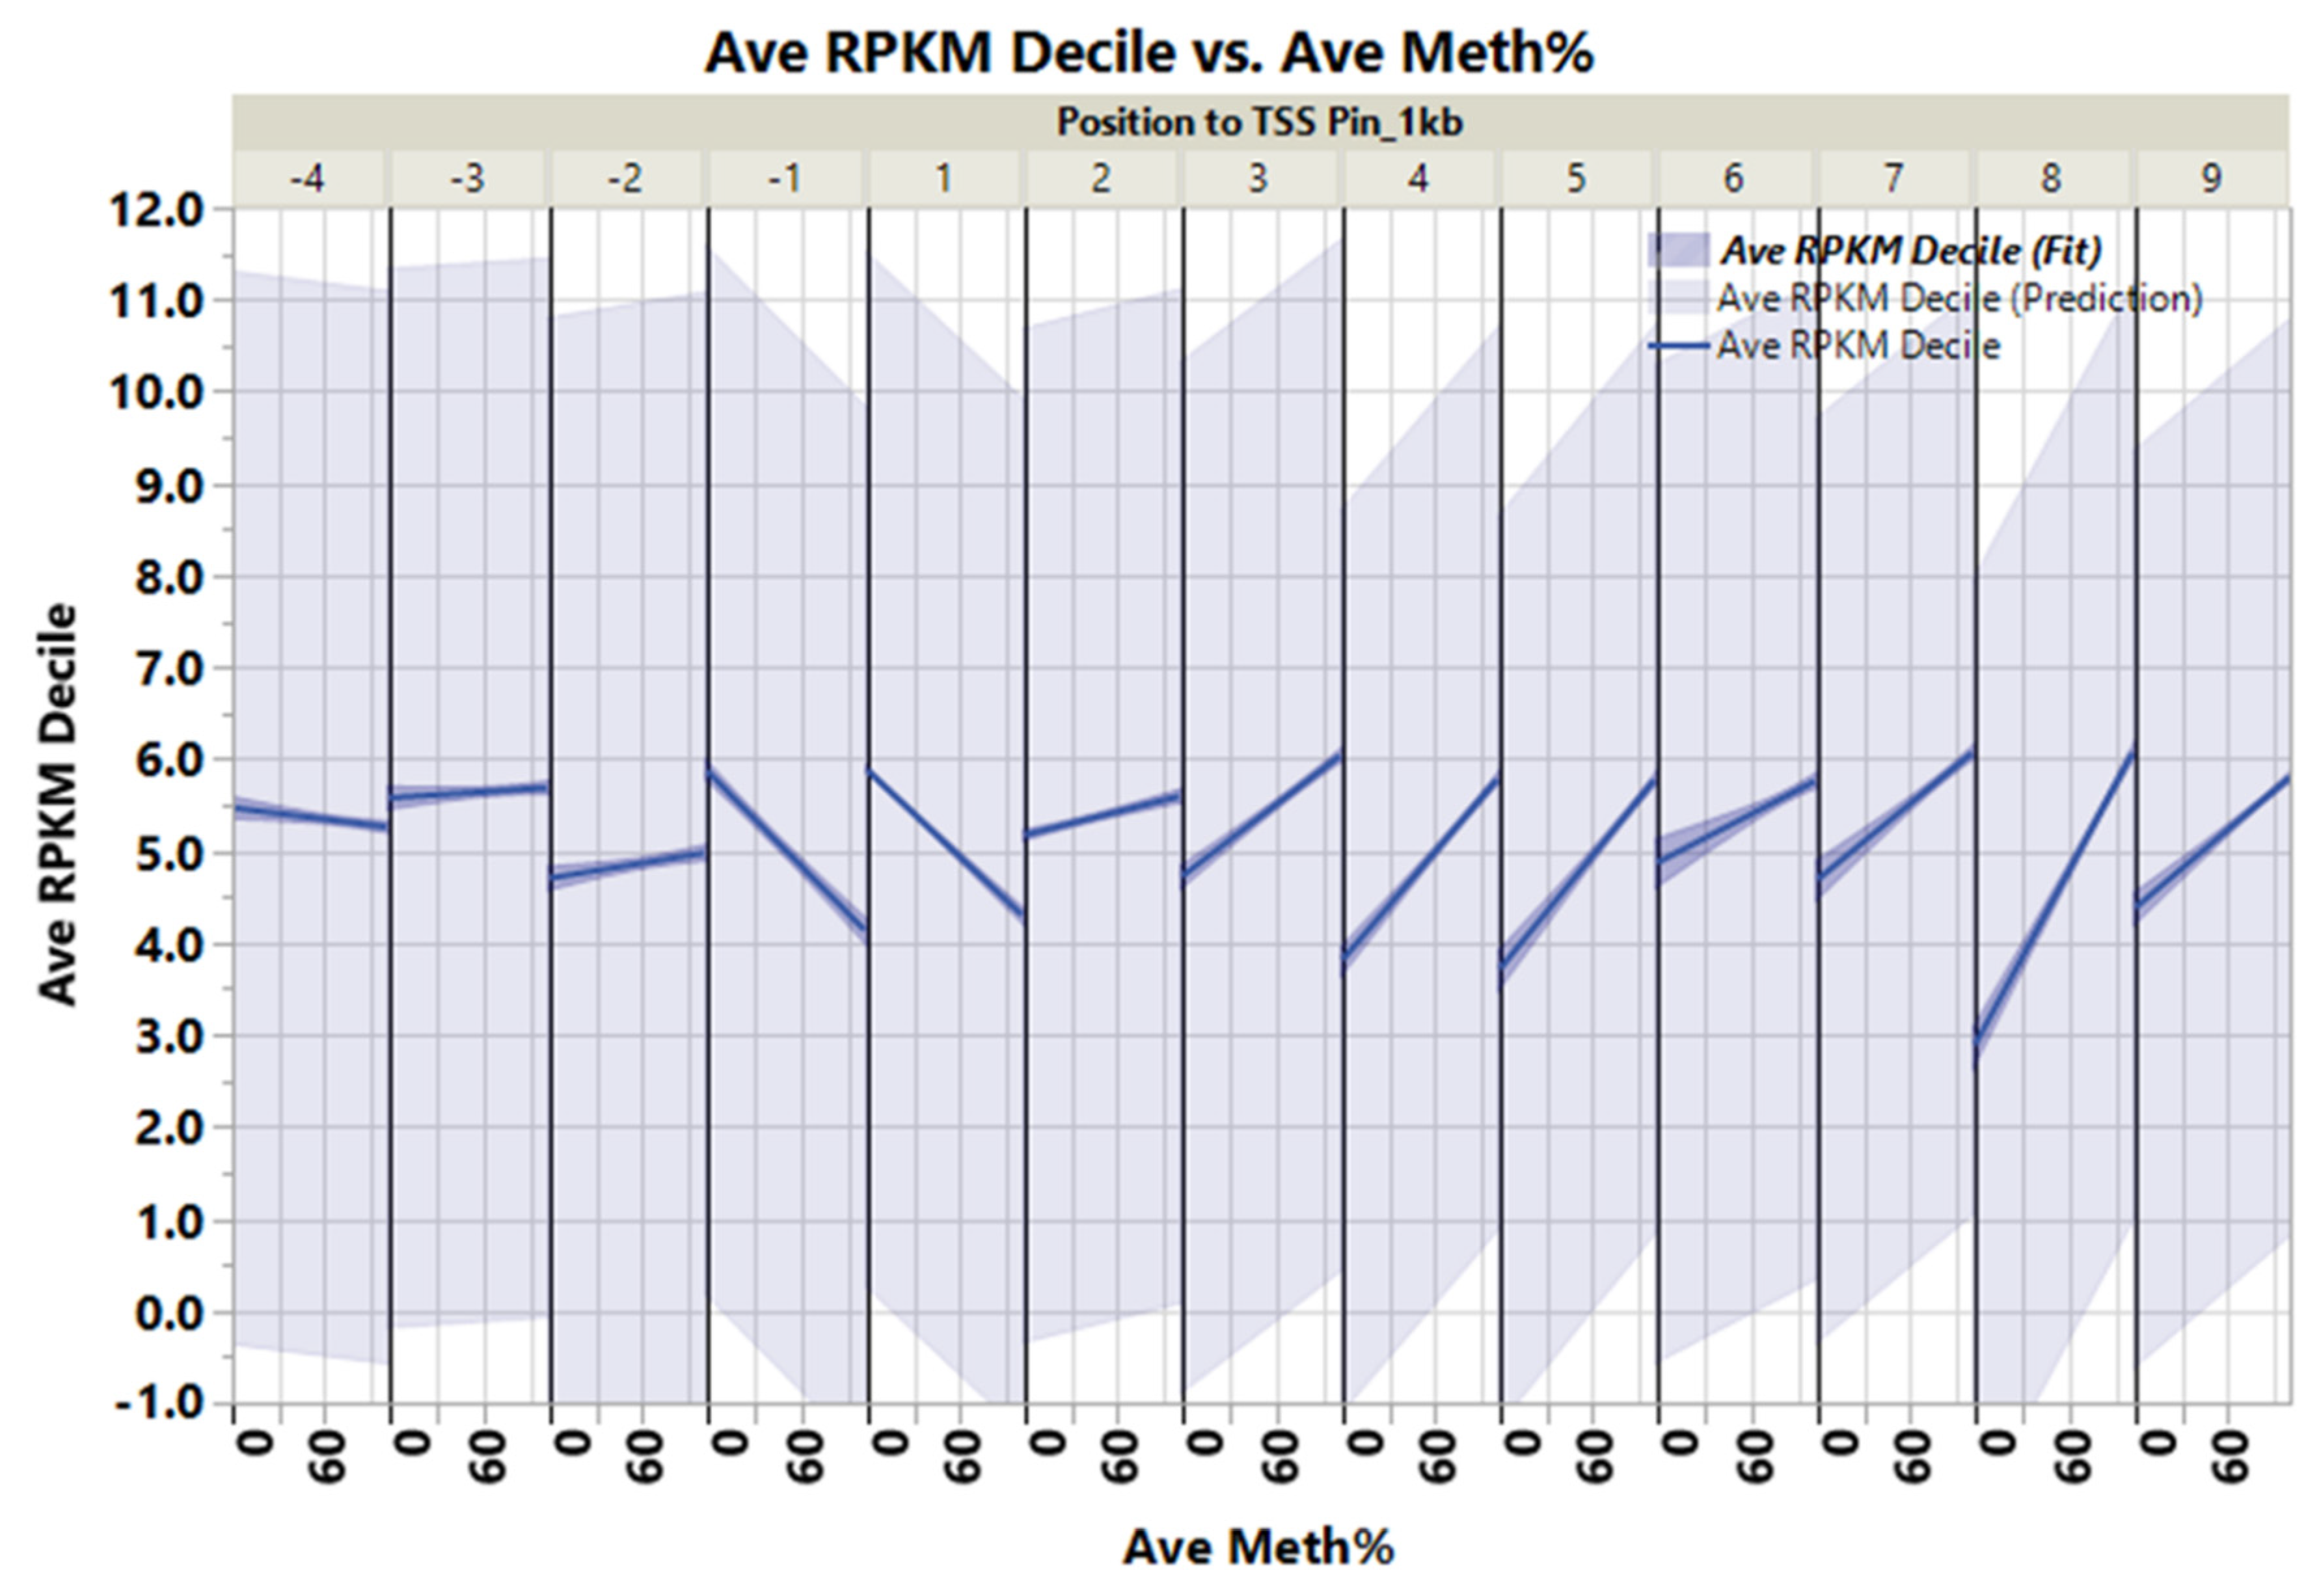
3.3. CpGs Islands within or near Genes and Their Associated Gene Expression

Methyl Mini-seq revealed 245,287 CpGs within 6372 islands (CGI) in 6537 genes (±10 kb of TSS). Only 669 CGI were in the promoters (−2 kb of TSS) of 681 genes. The genes with promoter CGI comprise 10.4% of the total number of genes with CGI reported in this study (6537). This percentage of genes with promotor CGIs is a much smaller fraction than expected since the majority of the mammalian gene promoters, especially human housekeeping promoters, contain CGIs at an approximate frequency of 60% [50]. Moreover, promoters with CGIs are conserved between humans and mice [51]. To further explore our observation, we looked at the rainbow trout NCBI genome reference annotation and found only 349 genes with promotor CGIs within −1 kb of TSS, which is less than 1% of the genes in the genome. By contrast, 721 genes had CGIs in the first 1 kb of the gene body (discussed below, Figure 8). These data may indicate that rainbow trout gene promotors are generally CGI-poor relative to mammalian genomes. However, CGI density in fish genes, particularly promoters, has not been thoroughly investigated. Variation in the number and density of CGIs reported in 4 fish genomes was much broader than in other vertebrates, including mammals [52]. Computational CGI prediction models, based on mammalian species [53], may not accurately predict CGIs in cold-blooded vertebrates, shifting CGIs away from gene promoters [54]. In addition, the TSS of all the genes may not be completely annotated in the rainbow trout genome. Further studies are needed to explore CGI density in gene promotors of rainbow trout and other fish.
The average methylation level of promotor CGIs in this study was 55.73%. CGIs are usually hypomethylated to permit housekeeping and tissue-specific gene expression [50]. CpG-poor regions, on the other hand, are usually hypermethylated and involved in gene silencing [55].
The CpG density within CGIs was 12.26 CpGs/NT, lower than that of the non-island CpGs (145.8 CpGs/NT) (Figure 5 vs. Figure 1). The CpG density −1 kb upstream of the TSS was 5.27 CpGs/NT, even lower than other genic regions, contrary to the sharp increase in CpG density +1 kb downstream of the TSS; 34.8 CpGs/NT, the highest density in the gene body.
Average percent methylation of CpGs located in CGIs was 63.20%, compared to 57.7% of non-island CpGs. However, similar to non-island CpGs, a steep decline in DNA methylation was noticed in the TSS-flanking regions (i.e., 1 kb in the gene promoter compared to +3 kb in the gene body). Average percent methylation of this region was 25.3% and declined to as low as 15% near the TSS (Figure 5). Beyond the −1 kb to +3 kb region flanking the TSS, a general trend of increasing DNA methylation levels was observed as the genomic window moved away from the TSS (Figure 5). Like the non-island CpGs, CpGs near TSS were predominantly unmethylated, although they were more abundant in number (data similar in trend to Figure 2 and not shown).
A comparative study, including plants and animals, reported high levels of CpG methylation (~80%) genome-wide in zebrafish larvae and mouse embryos; however, CGI methylation was low [39]. The study also reported slightly higher CpG methylation in the gene body and depletion of DNA methylation around TSS overlapping with CGI.
Combined analysis of the Methyl Mini-seq and RNA-Seq showed a trend similar to non-island CpGs in the relationship between average percent DNA methylation and gene transcription and expression deciles. This correlation varied according to CpG position relative to TSS (p value < 0.0001).
Within ±1 kb of the TSS, there was a weak negative correlation between the average percentage of DNA methylation and gene transcription expression deciles (Figure 6, correlation multivariate = −0.1780, p < 0.0001, nonparametric Spearman’s correlation = −0.1954, p < 0.0001). This inverse relationship between gene expression decile and DNA methylation in the ±1 kb flanking TSS is further demonstrated in Figure 7. The average percent DNA methylation within ±1 kb of genes’ TSS at the first decile of the expression range was 38.6%, compared to 23.5% in the 10th decile (Figure 7).
In opposition and within +3 to +10 kb in the gene body, there was positive correlation between DNA methylation and gene expression in (Figure 6, correlation multivariate = 0.1546, p < 0.0001, nonparametric Spearman’s correlation = 0.2239, p < 0.0001).
Similar to our study, a negative correlation between CpG density and DNA methylation relative to TSS was reported in humans and other mammals, implying importance in essential molecular functions such as gene expression. However, precisely how the CGIs regulate gene expression is still unclear. Although TSS exist in about half of the CpG islands, those TSS often lack common promoter sequences [6,56]. DNA methylation’s role in regulating gene expression was suggested through interaction with nucleosome histone modification [6,57].
Studies concerning the relationship between CGI density, methylation, and gene expression are scarce in fish, especially non-model species. Zebrafish embryos exhibit low DNA methylation in CGIs [39]. Decreased de novo DNA methylation at the CpG island of the no-tail gene of zebrafish embryos is correlated with gene repression [58]. In gilthead sea bream, and although at a low level, DNA methylation was correlated with expression of the sirtuin-1 gene, a master regulator of metabolism. However, the involvement of other mechanisms in transcriptional regulation was suggested in the study [59].
In non-fish species, a recent study in chicken analyzed more than 3000 CGIs from 20 tissues and their association with gene expression. Scientists identified only 121 significantly correlated CGI-gene pairs, suggesting that alteration of CGI methylation rarely affects gene expression [60]. In a recent review, Bird, A. [50] claimed that embryonic gene transcriptional activity put methylation-free footprints on CGIs; methylation does not silence actively transcribed genes and only affects genes already silenced by other means. The involvement of DNA methylation in gene expression and its interaction with other epigenomics modifications warrants further investigation in fish.
We noticed that most CGIs in the 0-to+2 kb region were hypomethylated (0–44%); however, this was not correlated with gene expression (Figure 8). A total of 1221 genes containing 1241 CGI (39,933 CpGs) showed these hypomethylated CGI marks. Interestingly, gene ontology annotation of the genes with these CGI marks revealed high enrichment of molecular functions relevant to DNA-binding and transcription regulation activity (Supplementary Tables S1 and S2). Examples of genes with essential functions in this list are 51 genes relevant to homeobox proteins, 24 forkhead box genes, 5 fibroblast growth factors, and 4 CCAAT/enhancer-binding protein genes. Homeobox gene methylation was reported in human lung cancer with reduced methylation in the CpG-rich region. This reduction was correlated with active histone H3 lysine-4 methylation chromatin mark in the HOXA region [61]. DNA methylation of some homeobox genes correlated with gene expression associated with muscle degradation (discussed below).
In addition, an increased percentage of hypermethylated CGIs (>97%) was noticed in the gene body (+2 to +10 kb) of the highly expressed genes (> 6 deciles). Moreover, most CGI in −2 to −10 upstream of genes were moderate- to hyper-methylated (>44%), regardless of gene expression (Figure 8).
A comparison between most-expressed genes (Decile 10) and silenced genes (Decile 1) revealed that silenced genes have more hypermethylated CGI around TSS −570 to 2 kb (Figure 9, Supplementary Table S4).

3.4. Differential DNA Methylation and Gene Expression between Diploid/Gravid and Triploid/Sterile Fish

3.4.1. Differentially Methylated (DM) CpGs

We restricted our analyses of DM CpGs within −1 to +10 kb flanking the TSS of genes due to this region’s potential effect on gene expression. Between the diploid/gravid and triploid/sterile fish, there were 1206 DM CpGs located in 971 genes (Supplementary Table S3). This number of DM CpGs represents only 0.03% of the total CpGs (3,161,570) identified in this study, indicating no genome-wide effect of ploidy on DNA methylation, as hypothesized. Several genes had multiple CpGs, 11 had more than 4 DM CpGs, and 131 genes had 2 DM CpGs or more. Gene ontology (GO) enrichment analysis of the DM CpGs revealed enriched terms involved in regulating gene expression, metal transport, and cell adhesion under molecular functions and biological processes, as seen in Table 1.
Interestingly, our previous studies showed associations between cell adhesion genes and fillet softness in rainbow trout [62]. The gravid fish in this study had softer fillets than sterile fish [24]. Therefore, the identified DM CpGs could be used as epigenetic markers associated with muscle atrophy and quality. Further studies are needed to investigate the causal relationship between these DM CpGs and muscle atrophy.

3.4.2. Integrated Analysis of Differential Gene Expression and DNA Methylation

Integrated analysis of differential gene expression and DNA methylation identified 31 DM CpGs associated with 28 differentially expressed genes involved in muscle atrophy, primarily (Table 2). The table shows that most DM CpGs were located in transcription factor binding sites. The list of transcription factors includes Pax 2/5/6 and 9, myogenin, and Hoxa5, which possess relevant muscle functions.
The genes spanning these 31 DM CpGs epigenetic markers were classified according to their functions in the following categories:

3.4.3. Apoptosis and Epigenetic Regulation Genes

Apoptosis is a common mechanism of muscle atrophy associated with muscle denervation, muscular dystrophy, spinal cord injury, limb suspension, and immobilization [62]. This list includes two DM CpGs in the promotor of the programmed cell death protein-5 and one DM CpG in the apoptosis-enhancing nuclease. Moreover, we previously showed the involvement of apoptosis in rainbow trout muscle degeneration, using the same fish model as this study [23].
The epigenetic list includes a hypomethylated CpG in the gene body associated with the downregulated expression of the Histone-lysine N-methyl transferase SMYD1 gene. SMYD1 gene encodes a muscle-specific lysine methyltransferase with an essential role in fast-twitch muscle physiology and myofibril integrity. Mouse myofibers lacking the SMYD1 are susceptible to atrophy [63].
There was also a hypermethylated CpG in the promotor associated with downregulated expression of the Cyclin-dependent kinase 2-associated protein-1 (CDK2AP1) gene. This gene impacts the cell cycle by negatively regulating the CDK2 activity and epigenetic regulation by participating in nucleosome remodeling and histone deacetylation [64].
Another gene involved in epigenetic regulation of muscle growth is ATP-dependent RNA helicase DDX39A, which had two hypomethylated CpGs in the gene body associated with reduced gene expression. Homozygous mutants of DDX39A exhibited cardiac and trunk muscle dystrophy in zebrafish due to early terminal differentiation of cardiomyocyte and myoblast; the mechanism of action of DDX39A involves obstructing mRNA splicing of members of the KMT2 gene family [65].

3.4.4. Autophagy, Glycolysis, Collagen Metabolism, Cell Membrane Functions Genes

The gene list for this category includes two genes relevant to autophagy named Autophagy-related protein-13 (ATG13), Sestrin-3, and 6-phosphofructo-2-kinase (PFKFB3), which is related to autophagy and glycolysis.
The autophagy gene pathway is vital for muscle energy homeostasis and bulk protein turnover. Dysregulation in the autophagy pathway can cause alterations in muscle growth, atrophy, and disorders, as reviewed in [66]. In vitro studies in rainbow trout showed that amino acid deprivation increases autophagosome formation and expression of autophagy-related genes [67]. Twenty-two genes involved in autophagy-related proteolysis were upregulated in rainbow trout muscle atrophy [26]. ATG13 was upregulated in this study with hypomethylated CpG in the promoter regions. Interestingly, this CpG is located in the binding site of three transcription factors, PAX2, 9a/b.
Sestrins can induce autophagy that can cause cell death or have a cytoprotective effect depending on the metabolic and environmental context of the cell [68]. Sestrin can prevent muscle atrophy due to disuse and aging by coordinating anabolic and catabolic signals [69].
PFKFB3 regulates glycolysis by modulating the level of fructose-2,6-bisphosphate. We previously reported that PFKFB3 is upregulated in rainbow trout muscle atrophy [70]. PFKFB4 was suggested to be a novel autophagy regulator through the suppression of oxidative stress [71]. Autophagy protects cells from severe conditions such as limitations in energy supplies and nutrients, and autophagy was suggested to be regulated by glycolysis in cancer cells [72]. Our previous studies showed reduced expression of genes involved in glucose use at transcription and proteomics levels [23,25], which is a common symptom of muscle atrophy shared with several mammalian models, including diabetes, fasting, cancer, renal failure, and muscle unload [73,74]. In this study, crosstalk between autophagy and glycolysis in atrophying muscle cells is logical because severe muscle atrophy occurs in response to the higher energetic demands of fish ovarian development/spawning.
The genes with DM CpG include three genes related to collagen metabolism. The first is collagen α-1(VIII), which was downregulated in atrophied muscle. In addition, collagen Prolyl 3-hydroxylase-4 (non-enzymatic) (P3H4) is a part of an enzyme complex that catalyzes the hydroxylation of lysine in collagen α chains and thus is required for normal collagen biosynthesis and its fibrils cross-linking [75]. P3H4 was downregulated in the gravid fish. This list also includes Proline dehydrogenase-1 (PRODHB), an inner mitochondrial membrane flavoprotein related to the electron transport system and ATP production derived from the breakdown of extracellular collagen to sustain intracellular ATP under nutrient stress conditions [76].
The gene list includes glycerophosphodiester phosphodiesterase domain-containing protein-5 (GDPD5), which was 20-fold downregulated in atrophying muscle with a hypomethylated CpG in the gene body. A study in mice showed that the expression of a functionally relevant gene named GDE5 was downregulated in atrophied muscles. The study suggested a muscle atrophy protective role for GDE5 reduction [77].
Three affected genes are involved in cell membrane functions named Aquaporin-7 and transmembrane protein 151B (TMEM151B). Aquaporin-7 is aquaglyceroporin, a component of the muscle cell membrane involved in transporting water molecules and glycerol. Aquaporin-7 mRNA expression is upregulated in the skeletal and cardiac muscles of obese Type II diabetic mice, an insulin resistance model that accelerates muscle protein degradation [78]. We previously observed increased water content in the atrophying muscle cells to fill the mobilized proteins and fat voids, which explains the differential expression and methylation of the Aquaporin gene [24,79]. The other two genes associated with membrane functions are TMEM151B, with SNPs associated with lean mass in humans [80], and Ankyrin-1, involved in cell motility and proliferation [81].
A significant outcome of this study is that the previously reported dominant biochemical signs of sexual maturation associated with muscle atrophy, high water content, [24] and reduced glycolysis [23] had relevant genes with congruent differential expression and methylation. Another notable result is that genes described in this section, PRODHB, GDPD5, and Sestrin, are all involved in activating cells’ survival mode due to the significant loss of muscle mass.

3.4.5. Homeobox Proteins

The study showed 3 DM CpGs in 2 homeobox genes that were downregulated in atrophying muscle; HOX-C5A and SIX homeobox 4. These genes are the only genes that showed DE among 51 genes relevant to homeobox proteins exhibiting DM CpGs (discussed above). Downregulation of a homeobox member HOXA10 was reported during muscle regeneration after damage in mice [82], and hypermethylation of HOX genes in myogenic cells was reported to help regulate HOX gene expression [83]. In addition, several HOX genes were hypermethylated in geriatric versus young human muscle; a negative relationship between DNA methylation and gene expression was observed. Physical activity was reported to help reverse these age-related epigenetic changes [84].

3.4.6. Other Epigenetic Markers

This category includes 11 genes with various or uncharacterized functions. The list includes HSP90ß1A, whose expression was downregulated in starved Atlantic salmon and upregulated during muscle differentiation [85]. The list also includes a molecular chaperone gene family member, T-complex protein-1 subunit epsilon [86]. Other genes with essential functions include cytochrome c1, which encodes a subunit of the cytochrome bc1 complex; CACNA1SB, a subunit of the skeletal muscle calcium channel; and cleavage and polyadenylation specificity factor subunit-1.

Supplementary Materials

The following supporting information can be downloaded at: https://www.mdpi.com/article/10.3390/genes13071151/s1. Supplementary Table S1—Genes with hypomethylated (0–44%) CGIs marks in the 0-to+2 kb region (shown in Figure 8). Supplementary Table S2—Gene Ontology annotations of genes with hypomethylated (0–44%) CGIs marks in the 0-to+2 kb region (Figure 8). Supplementary Table S3: DM CpGs within −1 to +10 kb flaking TSS. Supplementary Table S4: Silenced genes (RPKM Decile 1) in rainbow trout muscle have more hypermethylated CGIs in the promoter region compared to the most highly expressed genes (Decile 10).

Author Contributions

M.S. and B.K. conceived and designed the experiments and performed the experiment. M.S., R.A.-T. and A.A. analyzed the data. M.S. wrote the paper. All authors reviewed and approved the publication. All authors have read and agreed to the published version of the manuscript.

Funding

This study was supported by competitive grants No. 2014-67015-21602, 2021-67015-33388 and 2020-67015-30770 from the United States Department of Agriculture, National Institute of Food and Agriculture. The content is solely the authors’ responsibility and does not necessarily represent the official views of any of the funding agents.

Institutional Review Board Statement

Fish muscle tissues were obtained from a commercial private farm; for this reason ethical review and approval were waived for this study. All methods were carried out in accordance with relevant guidelines and regulations of West Virginia University.

Informed Consent Statement

Not applicable.

Conflicts of Interest

The authors declare that the research was conducted without any commercial or financial relationships that could be construed as a potential conflict of interest. The authors declare that they have no competing interest.

Availability of Data and Materials

The sequencing datasets supporting the conclusions of this article Sequence data are available through the Sequence Read Archive (SRA), NCBI accession: PRJNA431930. All datasets generated for this study are included, referred to in the manuscript and/or the Supplementary Files.

Consent for Publication

Not applicable.

References

  1. Aquaculture Genomics, G.; Breeding, W.; Abdelrahman, H.; ElHady, M.; Alcivar-Warren, A.; Allen, S.; Al-Tobasei, R.; Bao, L.; Beck, B.; Blackburn, H.; et al. Aquaculture genomics, genetics and breeding in the United States: Current status, challenges, and priorities for future research. BMC Genom. 2017, 18, 191. [Google Scholar] [CrossRef] [Green Version]
  2. Gao, G.; Magadan, S.; Waldbieser, G.C.; Youngblood, R.C.; Wheeler, P.A.; Scheffler, B.E.; Thorgaard, G.H.; Palti, Y. A long reads-based de-novo assembly of the genome of the Arlee homozygous line reveals chromosomal rearrangements in rainbow trout. G3 Bethesda 2021, 11, jkab052. [Google Scholar] [CrossRef] [PubMed]
  3. Ali, A.; Thorgaard, G.H.; Salem, M. PacBio Iso-Seq Improves the Rainbow Trout Genome Annotation and Identifies Alternative Splicing Associated with Economically Important Phenotypes. Front. Genet. 2021, 12, 683408. [Google Scholar] [CrossRef] [PubMed]
  4. Lallias, D.; Bernard, M.; Ciobotaru, C.; Dechamp, N.; Labbe, L.; Goardon, L.; Le Calvez, J.M.; Bideau, M.; Fricot, A.; Prezelin, A.; et al. Sources of variation of DNA methylation in rainbow trout: Combined effects of temperature and genetic background. Epigenetics 2021, 16, 1031–1052. [Google Scholar] [CrossRef] [PubMed]
  5. Gavery, M.R.; Nichols, K.M.; Berejikian, B.A.; Tatara, C.P.; Goetz, G.W.; Dickey, J.T.; Van Doornik, D.M.; Swanson, P. Temporal Dynamics of DNA Methylation Patterns in Response to Rearing Juvenile Steelhead (Oncorhynchus mykiss) in a Hatchery versus Simulated Stream Environment. Genes 2019, 10, 356. [Google Scholar] [CrossRef] [PubMed] [Green Version]
  6. Moore, L.D.; Le, T.; Fan, G. DNA methylation and its basic function. Neuropsychopharmacology 2013, 38, 23–38. [Google Scholar] [CrossRef] [Green Version]
  7. Suzuki, M.M.; Bird, A. DNA methylation landscapes: Provocative insights from epigenomics. Nat. Rev. Genet. 2008, 9, 465–476. [Google Scholar] [CrossRef]
  8. Lister, R.; Pelizzola, M.; Dowen, R.H.; Hawkins, R.D.; Hon, G.; Tonti-Filippini, J.; Nery, J.R.; Lee, L.; Ye, Z.; Ngo, Q.M.; et al. Human DNA methylomes at base resolution show widespread epigenomic differences. Nature 2009, 462, 315–322. [Google Scholar] [CrossRef] [Green Version]
  9. Zhou, H.; Zhuang, Z.X.; Sun, Y.Q.; Chen, Q.; Zheng, X.Y.; Liang, Y.T.; Mahboob, S.; Wang, Q.; Zhang, R.; Al-Ghanim, K.A.; et al. Changes in DNA methylation during epigenetic-associated sex reversal under low temperature in Takifugu rubripes. PLoS ONE 2019, 14, e0221641. [Google Scholar] [CrossRef]
  10. Spainhour, J.C.; Lim, H.S.; Yi, S.V.; Qiu, P. Correlation Patterns Between DNA Methylation and Gene Expression in The Cancer Genome Atlas. Cancer Inf. 2019, 18, 1176935119828776. [Google Scholar] [CrossRef]
  11. Stadler, M.B.; Murr, R.; Burger, L.; Ivanek, R.; Lienert, F.; Scholer, A.; van Nimwegen, E.; Wirbelauer, C.; Oakeley, E.J.; Gaidatzis, D.; et al. DNA-binding factors shape the mouse methylome at distal regulatory regions. Nature 2011, 480, 490–495. [Google Scholar] [CrossRef] [PubMed]
  12. Rishi, V.; Bhattacharya, P.; Chatterjee, R.; Rozenberg, J.; Zhao, J.; Glass, K.; Fitzgerald, P.; Vinson, C. CpG methylation of half-CRE sequences creates C/EBPalpha binding sites that activate some tissue-specific genes. Proc. Natl. Acad. Sci. USA 2010, 107, 20311–20316. [Google Scholar] [CrossRef] [PubMed] [Green Version]
  13. Koganti, P.P.; Wang, J.; Cleveland, B.; Yao, J. 17beta-Estradiol Increases Non-CpG Methylation in Exon 1 of the Rainbow Trout (Oncorhynchus mykiss) MyoD Gene. Mar. Biotechnol. 2017, 19, 321–327. [Google Scholar] [CrossRef] [PubMed]
  14. Naito, M.; Mori, M.; Inagawa, M.; Miyata, K.; Hashimoto, N.; Tanaka, S.; Asahara, H. Dnmt3a Regulates Proliferation of Muscle Satellite Cells via p57Kip2. PLoS Genet. 2016, 12, e1006167. [Google Scholar] [CrossRef] [Green Version]
  15. Tajrishi, M.M.; Shin, J.; Hetman, M.; Kumar, A. DNA methyltransferase 3a and mitogen-activated protein kinase signaling regulate the expression of fibroblast growth factor-inducible 14 (Fn14) during denervation-induced skeletal muscle atrophy. J. Biol. Chem. 2014, 289, 19985–19999. [Google Scholar] [CrossRef] [Green Version]
  16. Blackwell, T.A.; Cervenka, I.; Khatri, B.; Brown, J.L.; Rosa-Caldwell, M.E.; Lee, D.E.; Perry, R.A., Jr.; Brown, L.A.; Haynie, W.S.; Wiggs, M.P.; et al. Transcriptomic analysis of the development of skeletal muscle atrophy in cancer-cachexia in tumor-bearing mice. Physiol. Genom. 2018, 50, 1071–1082. [Google Scholar] [CrossRef] [Green Version]
  17. Zykovich, A.; Hubbard, A.; Flynn, J.M.; Tarnopolsky, M.; Fraga, M.F.; Kerksick, C.; Ogborn, D.; MacNeil, L.; Mooney, S.D.; Melov, S. Genome-wide DNA methylation changes with age in disease-free human skeletal muscle. Aging Cell 2014, 13, 360–366. [Google Scholar] [CrossRef] [Green Version]
  18. Matzke, M.A.; Mittelsten Scheid, O.; Matzke, A.J. Rapid structural and epigenetic changes in polyploid and aneuploid genomes. Bioessays 1999, 21, 761–767. [Google Scholar] [CrossRef]
  19. Madlung, A. Polyploidy and its effect on evolutionary success: Old questions revisited with new tools. Heredity 2013, 110, 99–104. [Google Scholar] [CrossRef] [Green Version]
  20. Zhang, H.; Ali, A.; Hou, F.; Wu, T.; Guo, D.; Zeng, X.; Wang, F.; Zhao, H.; Chen, X.; Xu, P.; et al. Effects of ploidy variation on promoter DNA methylation and gene expression in rice (Oryza sativa L.). BMC Plant Biol. 2018, 18, 314. [Google Scholar] [CrossRef]
  21. Wang, C.; Zhou, Y.; Qin, H.; Zhao, C.; Yang, L.; Yu, T.; Zhang, Y.; Xu, T.; Qin, Q.; Liu, S. Genetic and Epigenetic Changes Are Rapid Responses of the Genome to the Newly Synthesized Autotetraploid Carassius auratus. Front. Genet. 2020, 11, 576260. [Google Scholar] [CrossRef] [PubMed]
  22. Covelo-Soto, L.; Leunda, P.M.; Perez-Figueroa, A.; Moran, P. Genome-wide methylation study of diploid and triploid brown trout (Salmo trutta L.). Anim. Genet. 2015, 46, 280–288. [Google Scholar] [CrossRef] [PubMed]
  23. Salem, M.; Kenney, P.B.; Rexroad, C.E., 3rd; Yao, J. Microarray gene expression analysis in atrophying rainbow trout muscle: A unique nonmammalian muscle degradation model. Physiol. Genom. 2006, 28, 33–45. [Google Scholar] [CrossRef] [Green Version]
  24. Salem, M.; Kenney, P.B.; Rexroad, C.E.; Yao, J. Molecular characterization of muscle atrophy and proteolysis associated with spawning in rainbow trout. Comp. Biochem. Physiol. Part D Genom. Proteom. 2006, 1, 227–237. [Google Scholar] [CrossRef] [PubMed]
  25. Salem, M.; Kenney, P.B.; Rexroad, C.E., 3rd; Yao, J. Proteomic signature of muscle atrophy in rainbow trout. J. Proteom. 2010, 73, 778–789. [Google Scholar] [CrossRef]
  26. Paneru, B.; Ali, A.; Al-Tobasei, R.; Kenney, B.; Salem, M. Crosstalk among lncRNAs, microRNAs and mRNAs in the muscle ‘degradome’ of rainbow trout. Sci. Rep. 2018, 8, 8416. [Google Scholar] [CrossRef] [Green Version]
  27. Krueger, F.; Andrews, S.R. Bismark: A flexible aligner and methylation caller for Bisulfite-Seq applications. Bioinformatics 2011, 27, 1571–1572. [Google Scholar] [CrossRef] [PubMed]
  28. Akalin, A.; Kormaksson, M.; Li, S.; Garrett-Bakelman, F.E.; Figueroa, M.E.; Melnick, A.; Mason, C.E. methylKit: A comprehensive R package for the analysis of genome-wide DNA methylation profiles. Genome Biol. 2012, 13, R87. [Google Scholar] [CrossRef] [Green Version]
  29. Farre, D.; Roset, R.; Huerta, M.; Adsuara, J.E.; Rosello, L.; Alba, M.M.; Messeguer, X. Identification of patterns in biological sequences at the ALGGEN server: PROMO and MALGEN. Nucleic Acids Res. 2003, 31, 3651–3653. [Google Scholar] [CrossRef] [Green Version]
  30. Greenberg, M.V.C.; Bourc’his, D. The diverse roles of DNA methylation in mammalian development and disease. Nat. Rev. Mol. Cell Biol. 2019, 20, 590–607. [Google Scholar] [CrossRef]
  31. Li, E.; Zhang, Y. DNA methylation in mammals. Cold Spring Harb. Perspect. Biol. 2014, 6, a019133. [Google Scholar] [CrossRef] [PubMed]
  32. Law, J.A.; Jacobsen, S.E. Establishing, maintaining and modifying DNA methylation patterns in plants and animals. Nat. Rev. Genet. 2010, 11, 204–220. [Google Scholar] [CrossRef] [PubMed]
  33. Wan, Z.Y.; Xia, J.H.; Lin, G.; Wang, L.; Lin, V.C.; Yue, G.H. Genome-wide methylation analysis identified sexually dimorphic methylated regions in hybrid tilapia. Sci. Rep. 2016, 6, 35903. [Google Scholar] [CrossRef] [PubMed] [Green Version]
  34. Zemach, A.; McDaniel, I.E.; Silva, P.; Zilberman, D. Genome-wide evolutionary analysis of eukaryotic DNA methylation. Science 2010, 328, 916–919. [Google Scholar] [CrossRef] [Green Version]
  35. Hartono, S.R.; Korf, I.F.; Chedin, F. GC skew is a conserved property of unmethylated CpG island promoters across vertebrates. Nucleic Acids Res. 2015, 43, 9729–9741. [Google Scholar] [CrossRef] [Green Version]
  36. Zhang, C.; Hoshida, Y.; Sadler, K.C. Comparative Epigenomic Profiling of the DNA Methylome in Mouse and Zebrafish Uncovers High Interspecies Divergence. Front. Genet. 2016, 7, 110. [Google Scholar] [CrossRef] [Green Version]
  37. Saadeh, H.; Schulz, R. Protection of CpG islands against de novo DNA methylation during oogenesis is associated with the recognition site of E2f1 and E2f2. Epigenetics Chromatin 2014, 7, 26. [Google Scholar] [CrossRef] [Green Version]
  38. Baubec, T.; Schubeler, D. Genomic patterns and context specific interpretation of DNA methylation. Curr. Opin. Genet. Dev. 2014, 25, 85–92. [Google Scholar] [CrossRef]
  39. Feng, S.; Cokus, S.J.; Zhang, X.; Chen, P.Y.; Bostick, M.; Goll, M.G.; Hetzel, J.; Jain, J.; Strauss, S.H.; Halpern, M.E.; et al. Conservation and divergence of methylation patterning in plants and animals. Proc. Natl. Acad. Sci. USA 2010, 107, 8689–8694. [Google Scholar] [CrossRef] [Green Version]
  40. Anastasiadi, D.; Esteve-Codina, A.; Piferrer, F. Consistent inverse correlation between DNA methylation of the first intron and gene expression across tissues and species. Epigenetics Chromatin 2018, 11, 37. [Google Scholar] [CrossRef]
  41. Brenet, F.; Moh, M.; Funk, P.; Feierstein, E.; Viale, A.J.; Socci, N.D.; Scandura, J.M. DNA methylation of the first exon is tightly linked to transcriptional silencing. PLoS ONE 2011, 6, e14524. [Google Scholar] [CrossRef] [PubMed]
  42. Ball, M.P.; Li, J.B.; Gao, Y.; Lee, J.H.; LeProust, E.M.; Park, I.H.; Xie, B.; Daley, G.Q.; Church, G.M. Targeted and genome-scale strategies reveal gene-body methylation signatures in human cells. Nat. Biotechnol. 2009, 27, 361–368. [Google Scholar] [CrossRef] [PubMed] [Green Version]
  43. Laine, V.N.; Gossmann, T.I.; Schachtschneider, K.M.; Garroway, C.J.; Madsen, O.; Verhoeven, K.J.; de Jager, V.; Megens, H.J.; Warren, W.C.; Minx, P.; et al. Evolutionary signals of selection on cognition from the great tit genome and methylome. Nat. Commun. 2016, 7, 10474. [Google Scholar] [CrossRef] [Green Version]
  44. Heberle, E.; Bardet, A.F. Sensitivity of transcription factors to DNA methylation. Essays Biochem. 2019, 63, 727–741. [Google Scholar] [CrossRef] [PubMed] [Green Version]
  45. Guo, X.; Wang, L.; Li, J.; Ding, Z.; Xiao, J.; Yin, X.; He, S.; Shi, P.; Dong, L.; Li, G.; et al. Structural insight into autoinhibition and histone H3-induced activation of DNMT3A. Nature 2015, 517, 640–644. [Google Scholar] [CrossRef] [PubMed]
  46. Beemelmanns, A.; Ribas, L.; Anastasiadi, D.; Moraleda-Prados, J.; Zanuzzo, F.S.; Rise, M.L.; Gamperl, A.K. DNA Methylation Dynamics in Atlantic Salmon (Salmo salar) Challenged With High Temperature and Moderate Hypoxia. Front. Mar. Sci. 2021, 7, 604878. [Google Scholar] [CrossRef]
  47. Anastasiadi, D.; Diaz, N.; Piferrer, F. Small ocean temperature increases elicit stage-dependent changes in DNA methylation and gene expression in a fish, the European sea bass. Sci. Rep. 2017, 7, 12401. [Google Scholar] [CrossRef] [Green Version]
  48. Anastasiadi, D.; Vandeputte, M.; Sanchez-Baizan, N.; Allal, F.; Piferrer, F. Dynamic epimarks in sex-related genes predict gonad phenotype in the European sea bass, a fish with mixed genetic and environmental sex determination. Epigenetics 2018, 13, 988–1011. [Google Scholar] [CrossRef] [Green Version]
  49. Shao, C.; Li, Q.; Chen, S.; Zhang, P.; Lian, J.; Hu, Q.; Sun, B.; Jin, L.; Liu, S.; Wang, Z.; et al. Epigenetic modification and inheritance in sexual reversal of fish. Genome Res. 2014, 24, 604–615. [Google Scholar] [CrossRef] [Green Version]
  50. Bird, A. DNA methylation patterns and epigenetic memory. Genes Dev. 2002, 16, 6–21. [Google Scholar] [CrossRef] [Green Version]
  51. Jiang, C.; Han, L.; Su, B.; Li, W.H.; Zhao, Z. Features and trend of loss of promoter-associated CpG islands in the human and mouse genomes. Mol. Biol. Evol. 2007, 24, 1991–2000. [Google Scholar] [CrossRef] [PubMed] [Green Version]
  52. Han, L.; Zhao, Z. Comparative analysis of CpG islands in four fish genomes. Comp. Funct. Genom. 2008, 2008, 565631. [Google Scholar] [CrossRef] [PubMed] [Green Version]
  53. Takai, D.; Jones, P.A. Comprehensive analysis of CpG islands in human chromosomes 21 and 22. Proc. Natl. Acad. Sci. USA 2002, 99, 3740–3745. [Google Scholar] [CrossRef] [PubMed] [Green Version]
  54. Long, H.K.; Sims, D.; Heger, A.; Blackledge, N.P.; Kutter, C.; Wright, M.L.; Grutzner, F.; Odom, D.T.; Patient, R.; Ponting, C.P.; et al. Epigenetic conservation at gene regulatory elements revealed by non-methylated DNA profiling in seven vertebrates. Elife 2013, 2, e00348. [Google Scholar] [CrossRef] [PubMed] [Green Version]
  55. Chen, F.; Zhang, Q.; Deng, X.; Zhang, X.; Chen, C.; Lv, D.; Li, Y.; Li, D.; Zhang, Y.; Li, P.; et al. Conflicts of CpG density and DNA methylation are proximally and distally involved in gene regulation in human and mouse tissues. Epigenetics 2018, 13, 721–741. [Google Scholar] [CrossRef] [PubMed]
  56. Carninci, P.; Sandelin, A.; Lenhard, B.; Katayama, S.; Shimokawa, K.; Ponjavic, J.; Semple, C.A.; Taylor, M.S.; Engstrom, P.G.; Frith, M.C.; et al. Genome-wide analysis of mammalian promoter architecture and evolution. Nat. Genet. 2006, 38, 626–635. [Google Scholar] [CrossRef] [PubMed]
  57. Choi, J.K. Contrasting chromatin organization of CpG islands and exons in the human genome. Genome Biol. 2010, 11, R70. [Google Scholar] [CrossRef] [Green Version]
  58. Yamakoshi, K.; Shimoda, N. De novo DNA methylation at the CpG island of the zebrafish no tail gene. Genesis 2003, 37, 195–202. [Google Scholar] [CrossRef]
  59. Simo-Mirabet, P.; Perera, E.; Calduch-Giner, J.A.; Perez-Sanchez, J. Local DNA methylation helps to regulate muscle sirtuin 1 gene expression across seasons and advancing age in gilthead sea bream (Sparus aurata). Front. Zool. 2020, 17, 15. [Google Scholar] [CrossRef]
  60. Lim, W.J.; Kim, K.H.; Kim, J.Y.; Jeong, S.; Kim, N. Identification of DNA-Methylated CpG Islands Associated With Gene Silencing in the Adult Body Tissues of the Ogye Chicken Using RNA-Seq and Reduced Representation Bisulfite Sequencing. Front. Genet. 2019, 10, 346. [Google Scholar] [CrossRef]
  61. Rauch, T.; Wang, Z.; Zhang, X.; Zhong, X.; Wu, X.; Lau, S.K.; Kernstine, K.H.; Riggs, A.D.; Pfeifer, G.P. Homeobox gene methylation in lung cancer studied by genome-wide analysis with a microarray-based methylated CpG island recovery assay. Proc. Natl. Acad. Sci. USA 2007, 104, 5527–5532. [Google Scholar] [CrossRef] [PubMed] [Green Version]
  62. Ali, A.; Al-Tobasei, R.; Lourenco, D.; Leeds, T.; Kenney, B.; Salem, M. Genome-Wide Association Study Identifies Genomic Loci Affecting Filet Firmness and Protein Content in Rainbow Trout. Front. Genet. 2019, 10, 386. [Google Scholar] [CrossRef] [PubMed]
  63. Stewart, M.D.; Lopez, S.; Nagandla, H.; Soibam, B.; Benham, A.; Nguyen, J.; Valenzuela, N.; Wu, H.J.; Burns, A.R.; Rasmussen, T.L.; et al. Mouse myofibers lacking the SMYD1 methyltransferase are susceptible to atrophy, internalization of nuclei and myofibrillar disarray. Dis. Model. Mech. 2016, 9, 347–359. [Google Scholar] [CrossRef] [PubMed] [Green Version]
  64. Gene, N. CDK2AP1 Cyclin Dependent Kinase 2 Associated Protein 1 [Homo sapiens (Human)]—Gene—NCBI. Available online: https://www.ncbi.nlm.nih.gov/pubmed/ (accessed on 15 March 2022).
  65. Zhang, L.; Yang, Y.; Li, B.; Scott, I.C.; Lou, X. The DEAD-box RNA helicase Ddx39ab is essential for myocyte and lens development in zebrafish. Development 2018, 145, dev161018. [Google Scholar] [CrossRef] [Green Version]
  66. Xia, Q.; Huang, X.; Huang, J.; Zheng, Y.; March, M.E.; Li, J.; Wei, Y. The Role of Autophagy in Skeletal Muscle Diseases. Front. Physiol. 2021, 12, 638983. [Google Scholar] [CrossRef]
  67. Seiliez, I.; Gabillard, J.C.; Riflade, M.; Sadoul, B.; Dias, K.; Averous, J.; Tesseraud, S.; Skiba, S.; Panserat, S. Amino acids downregulate the expression of several autophagy-related genes in rainbow trout myoblasts. Autophagy 2012, 8, 364–375. [Google Scholar] [CrossRef]
  68. Cordani, M.; Sanchez-Alvarez, M.; Strippoli, R.; Bazhin, A.V.; Donadelli, M. Sestrins at the Interface of ROS Control and Autophagy Regulation in Health and Disease. Oxid. Med. Cell. Longev. 2019, 2019, 1283075. [Google Scholar] [CrossRef]
  69. Segales, J.; Perdiguero, E.; Serrano, A.L.; Sousa-Victor, P.; Ortet, L.; Jardi, M.; Budanov, A.V.; Garcia-Prat, L.; Sandri, M.; Thomson, D.M.; et al. Sestrin prevents atrophy of disused and aging muscles by integrating anabolic and catabolic signals. Nat. Commun. 2020, 11, 189. [Google Scholar] [CrossRef]
  70. Salem, M.; Manor, M.L.; Aussanasuwannakul, A.; Kenney, P.B.; Weber, G.M.; Yao, J. Effect of sexual maturation on muscle gene expression of rainbow trout: RNA-Seq approach. Physiol. Rep. 2013, 1, e00120. [Google Scholar] [CrossRef] [Green Version]
  71. Strohecker, A.M.; Joshi, S.; Possemato, R.; Abraham, R.T.; Sabatini, D.M.; White, E. Identification of 6-phosphofructo-2-kinase/fructose-2,6-bisphosphatase as a novel autophagy regulator by high content shRNA screening. Oncogene 2015, 34, 5662–5676. [Google Scholar] [CrossRef] [Green Version]
  72. Chu, Y.; Chang, Y.; Lu, W.; Sheng, X.; Wang, S.; Xu, H.; Ma, J. Regulation of Autophagy by Glycolysis in Cancer. Cancer Manag. Res. 2020, 12, 13259–13271. [Google Scholar] [CrossRef]
  73. Raffaello, A.; Laveder, P.; Romualdi, C.; Bean, C.; Toniolo, L.; Germinario, E.; Megighian, A.; Danieli-Betto, D.; Reggiani, C.; Lanfranchi, G. Denervation in murine fast-twitch muscle: Short-term physiological changes and temporal expression profiling. Physiol. Genom. 2006, 25, 60–74. [Google Scholar] [CrossRef] [PubMed]
  74. Lecker, S.H.; Jagoe, R.T.; Gilbert, A.; Gomes, M.; Baracos, V.; Bailey, J.; Price, S.R.; Mitch, W.E.; Goldberg, A.L. Multiple types of skeletal muscle atrophy involve a common program of changes in gene expression. FASEB J. 2004, 18, 39–51. [Google Scholar] [CrossRef] [PubMed]
  75. Database, G.H.G. P3H4 Gene—GeneCards|SC65 Protein|SC65 Antibody. 2022. Available online: https://www.genecards.org/cgi-bin/carddisp.pl?gene=P3H4 (accessed on 15 March 2022).
  76. Pandhare, J.; Donald, S.P.; Cooper, S.K.; Phang, J.M. Regulation and function of proline oxidase under nutrient stress. J. Cell. Biochem. 2009, 107, 759–768. [Google Scholar] [CrossRef] [PubMed] [Green Version]
  77. Okazaki, Y.; Ohshima, N.; Yoshizawa, I.; Kamei, Y.; Mariggio, S.; Okamoto, K.; Maeda, M.; Nogusa, Y.; Fujioka, Y.; Izumi, T.; et al. A novel glycerophosphodiester phosphodiesterase, GDE5, controls skeletal muscle development via a non-enzymatic mechanism. J. Biol. Chem. 2010, 285, 27652–27663. [Google Scholar] [CrossRef] [Green Version]
  78. Wakayama, Y.; Hirako, S.; Ohtaki, H.; Arata, S.; Jimi, T.; Honda, K. Histopathological and aquaporin7 mRNA expression analyzes in the skeletal and cardiac muscles of obese db/db mice. J. Vet. Med. Sci. 2021, 83, 1155–1160. [Google Scholar] [CrossRef]
  79. Aussanasuwannakul, A.; Kenney, P.B.; Weber, G.M.; Yao, J.; Slider, S.D.; Manor, M.L.; Salem, M. Effect of sexual maturation on growth, fillet composition, and texture of female rainbow trout (Oncorhynchus mykiss) on a high nutritional plane. Aquaculture 2011, 317, 79–88. [Google Scholar] [CrossRef]
  80. Pei, Y.F.; Hu, W.Z.; Yang, X.L.; Wei, X.T.; Feng, G.J.; Zhang, H.; Shen, H.; Tian, Q.; Deng, H.W.; Zhang, L. Two functional variants at 6p21.1 were associated with lean mass. Skelet. Muscle 2019, 9, 28. [Google Scholar] [CrossRef] [Green Version]
  81. Database, G.H.G. ANK1 Gene—GeneCards|ANK1 Protein|ANK1 Antibody. 2022. Available online: https://www.genecards.org/cgi-bin/carddisp.pl?gene=ANK1 (accessed on 15 March 2022).
  82. Houghton, L.; Rosenthal, N. Regulation of a muscle-specific transgene by persistent expression of Hox genes in postnatal murine limb muscle. Dev. Dyn. 1999, 216, 385–397. [Google Scholar] [CrossRef]
  83. Tsumagari, K.; Baribault, C.; Terragni, J.; Chandra, S.; Renshaw, C.; Sun, Z.; Song, L.; Crawford, G.E.; Pradhan, S.; Lacey, M.; et al. DNA methylation and differentiation: HOX genes in muscle cells. Epigenetics Chromatin 2013, 6, 25. [Google Scholar] [CrossRef] [Green Version]
  84. Turner, D.C.; Gorski, P.P.; Maasar, M.F.; Seaborne, R.A.; Baumert, P.; Brown, A.D.; Kitchen, M.O.; Erskine, R.M.; Dos-Remedios, I.; Voisin, S.; et al. DNA methylation across the genome in aged human skeletal muscle tissue and muscle-derived cells: The role of HOX genes and physical activity. Sci. Rep. 2020, 10, 15360. [Google Scholar] [CrossRef] [PubMed]
  85. Garcia de la Serrana, D.; Johnston, I.A. Expression of heat shock protein (Hsp90) paralogues is regulated by amino acids in skeletal muscle of Atlantic salmon. PLoS ONE 2013, 8, e74295. [Google Scholar] [CrossRef] [Green Version]
  86. Database, G.H.G. CCT5 Gene—GeneCards|TCPE Protein|TCPE Antibody. 2022. Available online: https://www.genecards.org/cgi-bin/carddisp.pl?gene=CCT5 (accessed on 15 March 2022).
Figure 1. Number of CpGs per nucleotide (left) and their average methylation percentage relative to TSS (right). The average percent of CpGs methylation flanking TSS was 57.7% within ±10 kb and 31.6% within ±2 kb, reaching as low as 12% near the TSS.
Genes 13 01151 g001
Figure 2. Number of CpGs per nucleotide relative to TSS at different intervals of average methylation percentages.
Genes 13 01151 g002
Figure 3. Inverse weak/moderate correlation between gene expression decile and DNA methylation within ±1 kb flanking TSS and positive correlation within the gene body’s +3 to +10 kb region.
Genes 13 01151 g003
Figure 4. DNA methylation versus gene expression deciles. Inverse relationship between gene expression deciles (based on the increasing ranking of expression measured as RPKM) and gene methylation average percentages of CpGs within ±1 kb of TSS. The table shows the average gene methylation percentages and StdErr for each gene expression decile.
Genes 13 01151 g004
Figure 5. Number of CpGs located in CGI per nucleotide (left) and their average methylation percentage relative to gene TSS (right).
Genes 13 01151 g005
Figure 6. Inverse relationship between gene expression decile and DNA methylation in ±1 kb flanking TSS and positive correlation in +2 to +9 kb of the gene body.
Genes 13 01151 g006
Figure 7. DNA methylation versus gene expression deciles. There is an inverse relationship between gene expression deciles (based on an increasing ranking of expression measured RPKM) and gene methylation average percentages of CGI within −2 kb and +2 kb of TSS. The table shows the average gene methylation percentages and StdErr for each gene expression decile.
Genes 13 01151 g007
Figure 8. Density of CGIs in various genic regions and their relation to gene expression. Hypomethylation (0–44%) of CGIs was observed within 0 to +2 kb of TSS, regardless of gene expression level (top circle) and an increased percentage of the hypermethylated CGIs (>97%) in the highly expressed genes (right circle). Most CGIs at −2 to −10 upstream of genes are methylated (>44%), regardless of gene expression.
Genes 13 01151 g008
Figure 9. Silenced genes (RPKM Decile 1) in rainbow trout muscle have more hypermethylated CGIs in the promoter region compared to the most highly expressed genes (Decile 10).
Genes 13 01151 g009
Table 1. Gene ontology enrichment analysis of DM CpGs categorized in molecular functions (MF) and biological processes (BP).
SourceTerm_NameTerm_idAdj_p Value
GO:MFDNA-binding transcription factor activity, RNA polymerase II-specificGO:00009811.96 × 10−3
GO:MFMetal ion transmembrane transporter activityGO:00468732.24 × 10−2
GO:BPHomophilic cell adhesion via plasma membrane adhesion moleculesGO:00071566.60 × 10−5
GO:BPCell adhesionGO:00071553.18 × 10−2
GO:BPBiological adhesionGO:00226103.18 × 10−2
GO:BPCation transportGO:00068121.66 × 10−2
GO:BPMetal ion transportGO:00300019.59 × 10−3
GO:BPCell-cell adhesionGO:00986092.59 × 10−4
GO:BPCell–cell adhesion via plasma-membrane adhesion moleculesGO:00987421.28 × 10−4
Table 2. DM CpGs and their associated differential gene expression in atrophied muscle of gravid/2N fish compared to sterile/3N fish. Highlighted cells in green and red indicates positive and negative changes. Highlighted TFs are the most common transcription factors.
Chr PositionGene/LocusPosition to TSSHypo/Hyper Meth (2N–3N)Meth. Diff p ValueExp. Fold Change (2N/3N)Exp. FDRExp/Meth R ValueGene AnnotationTF
Apoptosis and epigenetic regulation
NC_035082.1_64665435LOC110526468/Pdcd5−89933.33.2 × 10−5−2.107.71 × 10−2−0.441Programmed cell death protein 5HES-1 [T01649]; RXR-alpha [T01345]; 3; MYB2 [T02536]; AR [T00040]; USF-1 [T00875]; NF-1 [T00537]; NF-1 [T00539]
NC_035082.1_64665694LOC110526468/Pdcd6−64063.53.2 × 10−5−2.107.71 × 10−2−0.497Programmed cell death protein 5c-Ets-1 [T00112]
NC_035078.1_41106515LOC110492018/AEN4446−48.87.5 × 10−6−3.521.01 × 10−40.434Apoptosis-enhancing nucleaseE2F-1 [T01542]; C/EBPbeta [T00581]; C/EBPgamma [T00216]; NF-1 [T00535]
NC_035081.1_29419783LOC110523624/Smyd13041−65.04.0 × 10−7−2.956.10 × 10−30.459Histone-lysine N-methyl transferase Smyd1LyF-1 [T00479]; PTF1-beta [T00701]; myogenin [T00528]; Pax-5 [T00070]
NC_035088.1_13620476LOC110537077/Cdk2ap1−58648.01.7 × 10−5−7.369.39 × 10−5−0.439Cyclin-dependent kinase 2-associated protein 1USF1 [T00874]; USF1 [T00874]; c-Myc [T00140]; RXR-beta [T01349]; RXR-beta [T01349]; PIF3 [T04492]; PIF3 [T04492]; SREBP-1c [T01562]; CBF1 [T00080]; CBF1 [T00080]; JunD [T00437]; JunD [T00437]
NC_035089.1_41352275LOC110486510/Ddx39a4421−50.09.9 × 10−6−2.265.57 × 10−20.625ATP-dependent RNA helicase DDX39AXBP-1 [T00902]; E2F-1 [T01542]; f(alpha)-f(epsilon) [T00287]
NC_035089.1_41352276LOC110486510/Ddx39a4422−55.05.2 × 10−6−2.265.57 × 10−20.264ATP-dependent RNA helicase DDX39AXBP-1 [T00902]; E2F-1 [T01542]; f(alpha)-f(epsilon) [T00287]
Autophagy, glycolysis, collagen metablisim, cell memberane
NC_035082.1_53102690LOC110526208/Atg13−752−50.61.3 × 10−52.507.86 × 10−2−0.674Autophagy-related protein 13Pax-2.2 [T03219]; Pax-9a [T03593] Pax-9b [T03594]
NC_035101.1_26128247LOC110504991/Sesn3551927.63.4 × 10−53.691.25 × 10−20.820Sestrin-3GAGA factor [T00301]
NC_035093.1_46301679LOC110494292/Pfkfb3556780.36.7 × 10−164.332.86 × 10−30.7256-phosphofructo-2-kinaseMCB1 [T06035]; MCB2 [T06036]; Pax-6 [T00682]
NC_035094.1_5494483LOC110495489/Col8a18739−55.63.5 × 10−5−7.931.30 × 10−40.686Collagen alpha-1(VIII) chainNF-E4 [T00560]; Sp1 [T00754]; Sp1 [T00759]
NC_035088.1_66751403/island11919LOC110538176/P3h42242−54.87.1 × 10−7−3.687.35 × 10−20.283Prolyl 3-hydroxylase family member 4 (non-enzymatic)USF1 [T00874]; USF1 [T00874]; c-Myc [T00140]; PHO4 [T00690]; USF-1 [T00875]; USF-1 [T00875]; HES-1 [T01649]; HES-1 [T01649]
NC_035082.1_40371257LOC110526004/Prodhb454746.46.4 × 10−62.741.73 × 10−20.594Proline dehydrogenase 1, mitochondrialPax-5 [T00070]; YY1 [T04970]; RXR-beta [T01349]; HES-1 [T01649]; AhR [T00018]; AhR [T01795]; JunD [T00437]
NC_035088.1_41298016LOC110537666/Gdpd56026−47.61.2 × 10−5−20.043.30 × 10−60.139Glycerophosphodiester phosphodiesterase domain-containing protein 5
NC_035093.1_33080772LOC110494010/Aqp7950929.39.4 × 10−66.052.32 × 10−30.358Aquaporin-7SXR:RXR-alpha [T05670]; HES-1 [T01649]
NC_035105.1_28018844/island23784LOC110509954/Tmem151b518530.63.3 × 10−510.351.65 × 10−30.639Transmembrane protein 151BPax-5 [T01201]; Nkx2-1 [T00857]; GAL4 [T00302]
NC_035087.1_56212451LOC110536085/Ank15063−59.51.2 × 10−5−2.446.32 × 10−20.079Ankyrin-1NFI/CTF [T00094]; NF-AT2 [T01945]; PEA3 [T00684]; NF-AT1 [T01948]; NF-AT1 [T01944];NF-AT1 [T00550]; HNF-4alpha1 [T00372]
Homeobox proteins
NC_035092.1_38302815LOC110492001/Hox-C5a1862−47.67.8 × 10−6−6.031.48 × 10−20.474Homeobox protein Hox-C5ac-Myb [T00138]
NC_035092.1_38302823LOC110492001/Hox-C5a1870−45.72.6 × 10−5−6.031.48 × 10−20.382Homeobox protein Hox-C5aSp1 [T00755]; Nkx2-1 [T00857]
NC_035101.1_61368566Six42175−50.83.6 × 10−5−3.086.73 × 10−20.015SIX homeobox 4MF3 [T00507]; ENKTF-1 [T00255]; Tll [T00789]; E2F [T00221]; POU4F1(l) [T01877]; Pax-5 [T00070]
Other epimarkers
NC_035084.1_10667325Hsp90ba612463.58.6 × 10−72.009.16 × 10−20.698Heat shock 90kDa protein 1 beta isoform aTAF [T00778]
NC_035091.1_7350831LOC110489569/Ccts3278−45.23.7 × 10−6−2.728.21 × 10−40.297T-complex protein 1 subunit epsilonMad [T04378]; LF-A1 [T00467]; MF3 [T00507]; E2F-1 [T01543]; YY1 [T00865]; XBP-1 [T00902]; YY1 [T00915]; Sp1 [T00754]; Sp1 [T00759]; YY1 [T00278]; ENKTF-1 [T00255]
NC_035084.1_34778859LOC110529890/PGBD492331.61.9 × 10−6−8.218.85 × 10−6−0.505PiggyBac transposable element-derived protein 4HNF-1B [T01950]; Crx [T03461]; POU2F1 [T00643]
NC_035077.1_13381573LOC110493215/Mast3452033.31.2 × 10−52.689.8 × 10−2−0.119Microtubule-associated serine/threonine-protein kinase 3C/EBP [T01388]; CREMtau [T01309]; CREMtaualpha [T01602]; CREMtau1 [T02108]; CREMtau2 [T02109]
NC_035092.1_36914362LOC110491948/Cacna1sb2646−38.62.0 × 10−6−5.372.96 × 10−60.858Dihydropyridine-sensitive L-type skeletal muscle calcium channel subunit alpha-1MED8 [T03491]; C/EBP [T01388]; C/EBP [T01388]
NC_035092.1_29706361LOC110491830/Cytc-14423−43.83.3 × 10−5−2.801.46 × 10−40.123Cytochrome c1Mad [T04378]; GA-BF [T00297]
NC_035090.1_23141191LOC110488198/Cpsf18837−50.02.1 × 10−7−3.831.34 × 10−20.406Cleavage and polyadenylation specificity factor subunit 1Pax-5 [T00070]
NC_035093.1_25737498LOC110493184/Znfx-12285−29.74.8 × 10−5−2.617.87 × 10−20.324NFX1-type zinc finger-containing protein 1
NC_035097.1_35527983LOC110500515/Gilgyf1628248.81.7 × 10−52.747.18 × 10−20.772GRB10-interacting GYF protein 1Mad [T04378]; Pax-6 [T00682]
NC_035095.1_15029930LOC110497457413647.82.0 × 10−567.328.65 × 10−30.637Vegetative cell wall protein gp1
NC_035097.1_10910032LOC11050101716451.65.3 × 10−8−4.362.37 × 10−2−0.417Uncharacterized LOC110501017HSF1 (long) [T01042]; HSF1 (short) [T02104]; AP-4 [T00036]; myogenin [T00528]; Cutl1 [T02042]; HOXA5 [T00377]; POU1F1a [T00691];PF1 [T04784]
Publisher’s Note: MDPI stays neutral with regard to jurisdictional claims in published maps and institutional affiliations.

