Article

The First Complete Mitochondrial Genome of Eucrate crenata (Decapoda: Brachyura: Goneplacidae) and Phylogenetic Relationships within Infraorder Brachyura

1
Tianjin Key Laboratory of Environmental Technology for Complex Trans-Media Pollution and Tianjin International Joint Research Center for Environmental Biogeochemical Technology, College of Environmental Science and Engineering, Nankai University, Tianjin 300350, China
2
Tianjin Fisheries Research Institute, Tianjin 300457, China
3
Shanghai Universities Key Laboratory of Marine Animal Taxonomy and Evolution, Shanghai Ocean University, Shanghai 201306, China
4
Engineering Research Center of Environmental DNA and Ecological Water Health Assessment, Shanghai Ocean University, Shanghai 201306, China
*
Authors to whom correspondence should be addressed.
Genes 2022, 13(7), 1127; https://doi.org/10.3390/genes13071127
Submission received: 15 May 2022 / Revised: 12 June 2022 / Accepted: 15 June 2022 / Published: 23 June 2022
(This article belongs to the Section Animal Genetics and Genomics)

Abstract

:
Characterizing the complete mitochondrial genome (mitogenome) of an organism is useful for genomic studies in taxonomy and evolution. The mitogenomic characteristics of Eucrate crenata (Decapoda: Brachyura: Goneplacidae) have never been studied. The present study decodes the first mitogenome of E. crenata by high-throughput sequencing (HTS). The length of the mitogenome is 15,597 bp, and it contains 13 protein-coding genes, 2 ribosomal RNA genes (rrnS and rrnL), and 22 transfer RNA genes. There are 14 and 23 genes observed on the heavy and light strands, respectively. E. crenata possesses a trnH-cac translocation, with the trnH-cac shifted between trnE-gaa and trnF-ttc instead of the usual location between nad5 and nad4 in decapods. Phylogenetic analyses based on the current dataset of 33 Brachyuran mitogenomes indicate that E. crenata. is closely related to Ashtoret lunaris of Matutidae. The similar codon usage and rearrangements in the two species provide evidence for their close phylogenetic relationship. Positive selection analysis showed that one residue located in cox1 was identified as a positively selected site with high BEB value (>95%), indicating that this gene was under positive selection pressure. This study is the first complete mitogenome record for the family Goneplacidae, and the results obtained may improve the understanding of the phylogeny of Goneplacidae in Brachyura.

1. Introduction

Mitochondria are involved in various processes, such as ATP generation, signaling, cell differentiation, growth, and apoptosis [1]. Based on this, the mitochondrial genome (mitogenome) has been widely used in studies of molecular evolution and the reconstruction of phylogeny [2,3]. Nucleotide sequences or amino acid data, and the gene arrangement of mitogenomes, are greatly useful for inferring relationships among metazoan lineages [3,4]. In general, a metazoan mitogenome is a closed circular DNA molecule, ranging in size from 14 to 20 kb, and typically contains 37 genes: 13 protein-coding genes (PCGs) (atp6, atp8, cox1-3, cob, nad1-6, and nad4l), 2 rRNA genes (rrnS and rrnL), 22 tRNA genes, and an AT-rich region (also known as the control region) that contains some of the initiation sites for genome transcription and replication [5]. The structural characteristics and arrangements of these genomic features of mitogenome differ across each species [6,7]. Mitogenomic composition can thus be examined for species identification, genetic diversity assessment, phylogenetics, and selection pressure analysis at various taxonomic levels [8,9]. Therefore, this may be helpful in revealing evidence of energy metabolism regulation mechanisms of species adapting to a specific environment.
The Brachyura crab is the largest clade of the Decapoda crustacean group, with more than 7250 known species, including 98 marine, freshwater, and terrestrial habitat families [10]. Marine Brachyura has a wide range of morphological and ecological diversity, leading to a complex taxonomy [11]. Goneplacidae belongs to the infraorder Brachyura and is known for its morphological complexity, and most are economically important. According to the literature [12], 66 species of the family Goneplacidae have been reported in total. Furthermore, based on ecological characteristics, economic values, and market values, these species in Goneplacidae are not only key functional species for strengthening the fishery community structure in aquatic ecosystem, but also important economic resources in marine pastures [13,14]. Thus, the investigations about the species mitogenomes in Goneplacidae and their phylogenetic relationships within the infraorder Brachyura are worthy of great attention. Up to now, the phylogenetic relationships within the infraorder Brachyura of several crabs belonging to some families, i.e., Grapsidae, Sesarmidae, Panopeidae, have been studied [15,16,17]. However, the species mitogenomes in the family Goneplacidae have never been reported, nor have their phylogenies within the infraorder Brachyura. Eucrate crenata (De Haan, 1835) (Decapoda: Brachyura: Goneplacidae) generally inhabits the sandy seabed with a depth of 10–100 m and occurs in the Korean Strait, the Red Sea, Japan, Thailand, India, and China. As an important bioindicator in Goneplacidae, most studies of this species focus solely on morphology and growth [18]. As reported, the carapace of E. crenata is cream-colored, with purple spots in the central area and distinctly pale anterolateral edges; and the outline is quadrilateral, slightly wider than the length [18].
Prior to this study, the mitogenomic characteristics of E. crenata have never been studied. We sequenced and annotated the first complete mitogenome of E. crenata based on specimen from the Bohai Bay in China. The mitogenome organization, codon usage, and gene order information of E. crenata were revealed. Combined with published data, the phylogenetic relationships of Brachyura were reconstructed based on mitogenomes to explore the potential status of Goneplacidae. We also performed positive selection analysis of Brachyura mitochondrial PCGs to understand the adaptive evolution of Brachyura.

2. Materials and Methods

2.1. Sample Collection, Identification and DNA Extraction

An adult of E. crenata (sample ID of LX2) was collected from Bohai Bay(38°32.12′ N, 118°1.50′ E), China in November 2021. Species-level morphological identification was carried out according to the main ideas of Nayak et al. [18]. The voucher specimen was preserved in 95% ethanol and stored at −80 °C until DNA extraction in the College of Environmental Science and Engineering at Nankai University (Tianjin, China). Genomic DNA was extracted from the first pinched muscle using the SDS method [19]. The harvested DNA was detected using agarose gel electrophoresis and quantified by a Qubit® 2.0 Fluorometer (Thermo Scientific, Shanghai, China).

2.2. Illumina Sequencing, Mitogenome Assembly and Annotation

The DNA was first isolated, and then the 2 μg purified DNA was fragmented. Paired-end libraries (350 bp) were performed using the NEBNext® Ultra™ DNA Library Prep Kit for Illumina (NEB, USA) following manufacturer’s instructions, then sequenced using an Illumina NovaSeq 6000 at the Beijing Novogene Bioinformatics Technology Co., Ltd. (Beijing, China).
Raw reads were filtered by Trimmomatic v0.39 before the assembly [20]. This filtering step was performed to remove the reads with connectors, the reads showing a quality score below 20 (Q < 20), the reads containing a percentage of uncalled bases (“N” characters) equal to or greater than 10%, and repeated sequences. A combination of de novo and reference-guided assemblies was applied to reconstruct the mitochondrial genome, and the following three steps were performed to assemble the mitogenome. First of all, the filtered reads were assembled into contigs with SPAdes 3.14.1 (http://bioinf.spbau.ru/spades, accessed on 30 December 2021). Then, BLAST (https://blast.ncbi.nlm.nih.gov/Blast.cgi, accessed on 30 December 2021) were used to align contigs with reference mitogenomes from the infraorder Brachyura species, and aligned contigs (≥80% similarity and query coverage) were ranked according to the reference mitogenomes. Finally, GapCloser 1.12 with default parameters were used to map the clean reads to the assembled draft mitogenome, and most gaps were filled by local assembly.
The mitochondrial genes were annotated using the online MITOS tool (http://mitos.bioinf.uni-leipzig.de/index.py, accessed on 30 December 2021), and the protein-coding genes, transfer RNA (tRNA) genes, and ribosome RNA (rRNA) genes were predicted with default parameters. BLAST searches for reference mitochondrion genes were used to determine the location of each coding gene. Manual corrections of genes for start/stop codons were carried out in SnapGene Viewer by referring to the reference mitogenomes. The circular map of mitogenome of E. crenata was drawn by the CGview tool (http://stothard.afns.ualberta.ca/cgview_server/, accessed on 30 December 2021). Several publicly available protein databases were functionally annotated using sequence-similarity Blast searches with a typical cut-off E-value of 10−5 against: NCBI non-redundant (Nr) protein database, Swiss-Prot, Clusters of Orthologous Groups (COGs), Kyoto Encyclopedia of Genes and Genomes (KEGG), and Gene Ontology (GO) terms.

2.3. Sequence Analysis

Relative synonymous codon usage (RSCU) was computed with cusp (EMBOSS v6.6.0.0). The AT and GC skews were calculated using the following formulas: AT skew = (A − T)/(A + T) and GC skew = (G − C)/(G + C) [21], where A, T, G and C refer to the occurrences of the four nucleotides. The complete mitochondrial DNA sequence has been deposited in GenBank with the accession number ON150678.

2.4. Phylogenetic Analysis

The phylogeny of the infraorder Brachyura was reconstructed using mitogenome data from 30 species (Table 1). Two species in the family Alpheidae were used as the outgroup (Table 1). Our data set was based on nucleotide sequences from 13 mitochondrial PCGs (atp6, atp8, cox1, cox2, cox3, cob, nad1, nad2, nad3, nad4, nad4l, nad5, and nad6). Multiple alignments of all 13 genes were performed with MUSCLE 3.8.31. In aligned sequences, blurred aligned regions and gaps were removed using Gblocks server 0.91b with the default setting. JModeltest v2.1.10 was used to select the most suitable evolutionary model GTR + I + G for the amino acid dataset. Maximum likelihood (ML) analysis of phylogenetic trees and model parameters was performed, and the best model was determined through AIC and BIC scores. The phylogenetic tree (http://www.atgc-montpellier.fr/phyml/, accessed on 23 February 2022) was constructed by PhyML v3.0 and graphically edited using the iTOL 3.4.3 (https://itol.embl.de/itol.cgi, accessed on 23 February 2022).

2.5. Positive Selection Analysis

The comparison of the nonsynonymous/synonymous substitution ratios (ω = dN/dS) is meaning for quantifying the impact of natural selection on molecular evolution [22]. Ω > 1, =1, and <1 respectively represent positive selection, neutrality, and purifying selection [23]. The codon-based maximum likelihood (CodeML) method, which implemented in the PAML package, [24] was used to estimate the ω values. A combined database of all 13 mitochondrial PCGs was used for selection pressure analyses. The ML phylogenetic tree was used as the working topology in CodeML analyses.
In this study, branch models were used to evaluate positive selection within the infraorder Brachyura. First, the one-ratio model (M0) estimated the distribution of the ω values as a baseline under the assumption that there is no adaptive evolution of the gene sequences, which assumes a single ω ratio for all branches of the phylogeny [25]. Then, positive selection acting on branches of interest was detected using a two-ratio model (M2), which allows the background and foreground lineages to have different ω ratio values [26,27]. Finally, the free-ratio model (M1), which allows the ω ratio variations between branches, was used to estimate the ω value on each branch [27]. The one-ratio model (M0) and the free-ratio model (M1) were compared to determine whether different clades in Brachyura had different ω values. The one-ratio model (M0) and the two-ratio model (M2) were compared to determine whether the ω values of the foreground and background branches were significantly different. In the one-ratio model, ω represents the value for the overall evolutionary tree. In the two-ratio model, ω0 and ω1 represent the values for the background branch and foreground branch, respectively. The paired models were compared with critical values of the Chi square (χ2) distribution using likelihood ratio tests (LRTs), where the test statistic was estimated to be twice the difference in log likelihood (2ΔL) and the degrees of freedom were estimated as the difference in the parameter number for each model.
In addition, we fit branch site models to check positive selection of some sites in the infraorder Brachyura. The branch-site models allow ω to vary between sites in proteins and between branches in trees. Branch-site model A (positive selection model) was used to identify the positively selected sites in Brachyuran species lineages (marked as foreground lineages). Comparing the significance level detection between Model A and the null Model with ω2 = 1 can be directly used to determine positive selection sites in the foreground Branch. The presence of sites with ω > 1 indicates that the data fitting of model A is significantly better than the corresponding null model. Bayes Empirical Bayes analysis was used to calculate a posterior probabilities in order to identify positive selection sites on the foreground lineages in the case of significant LRTs [28].

3. Results and Discussion

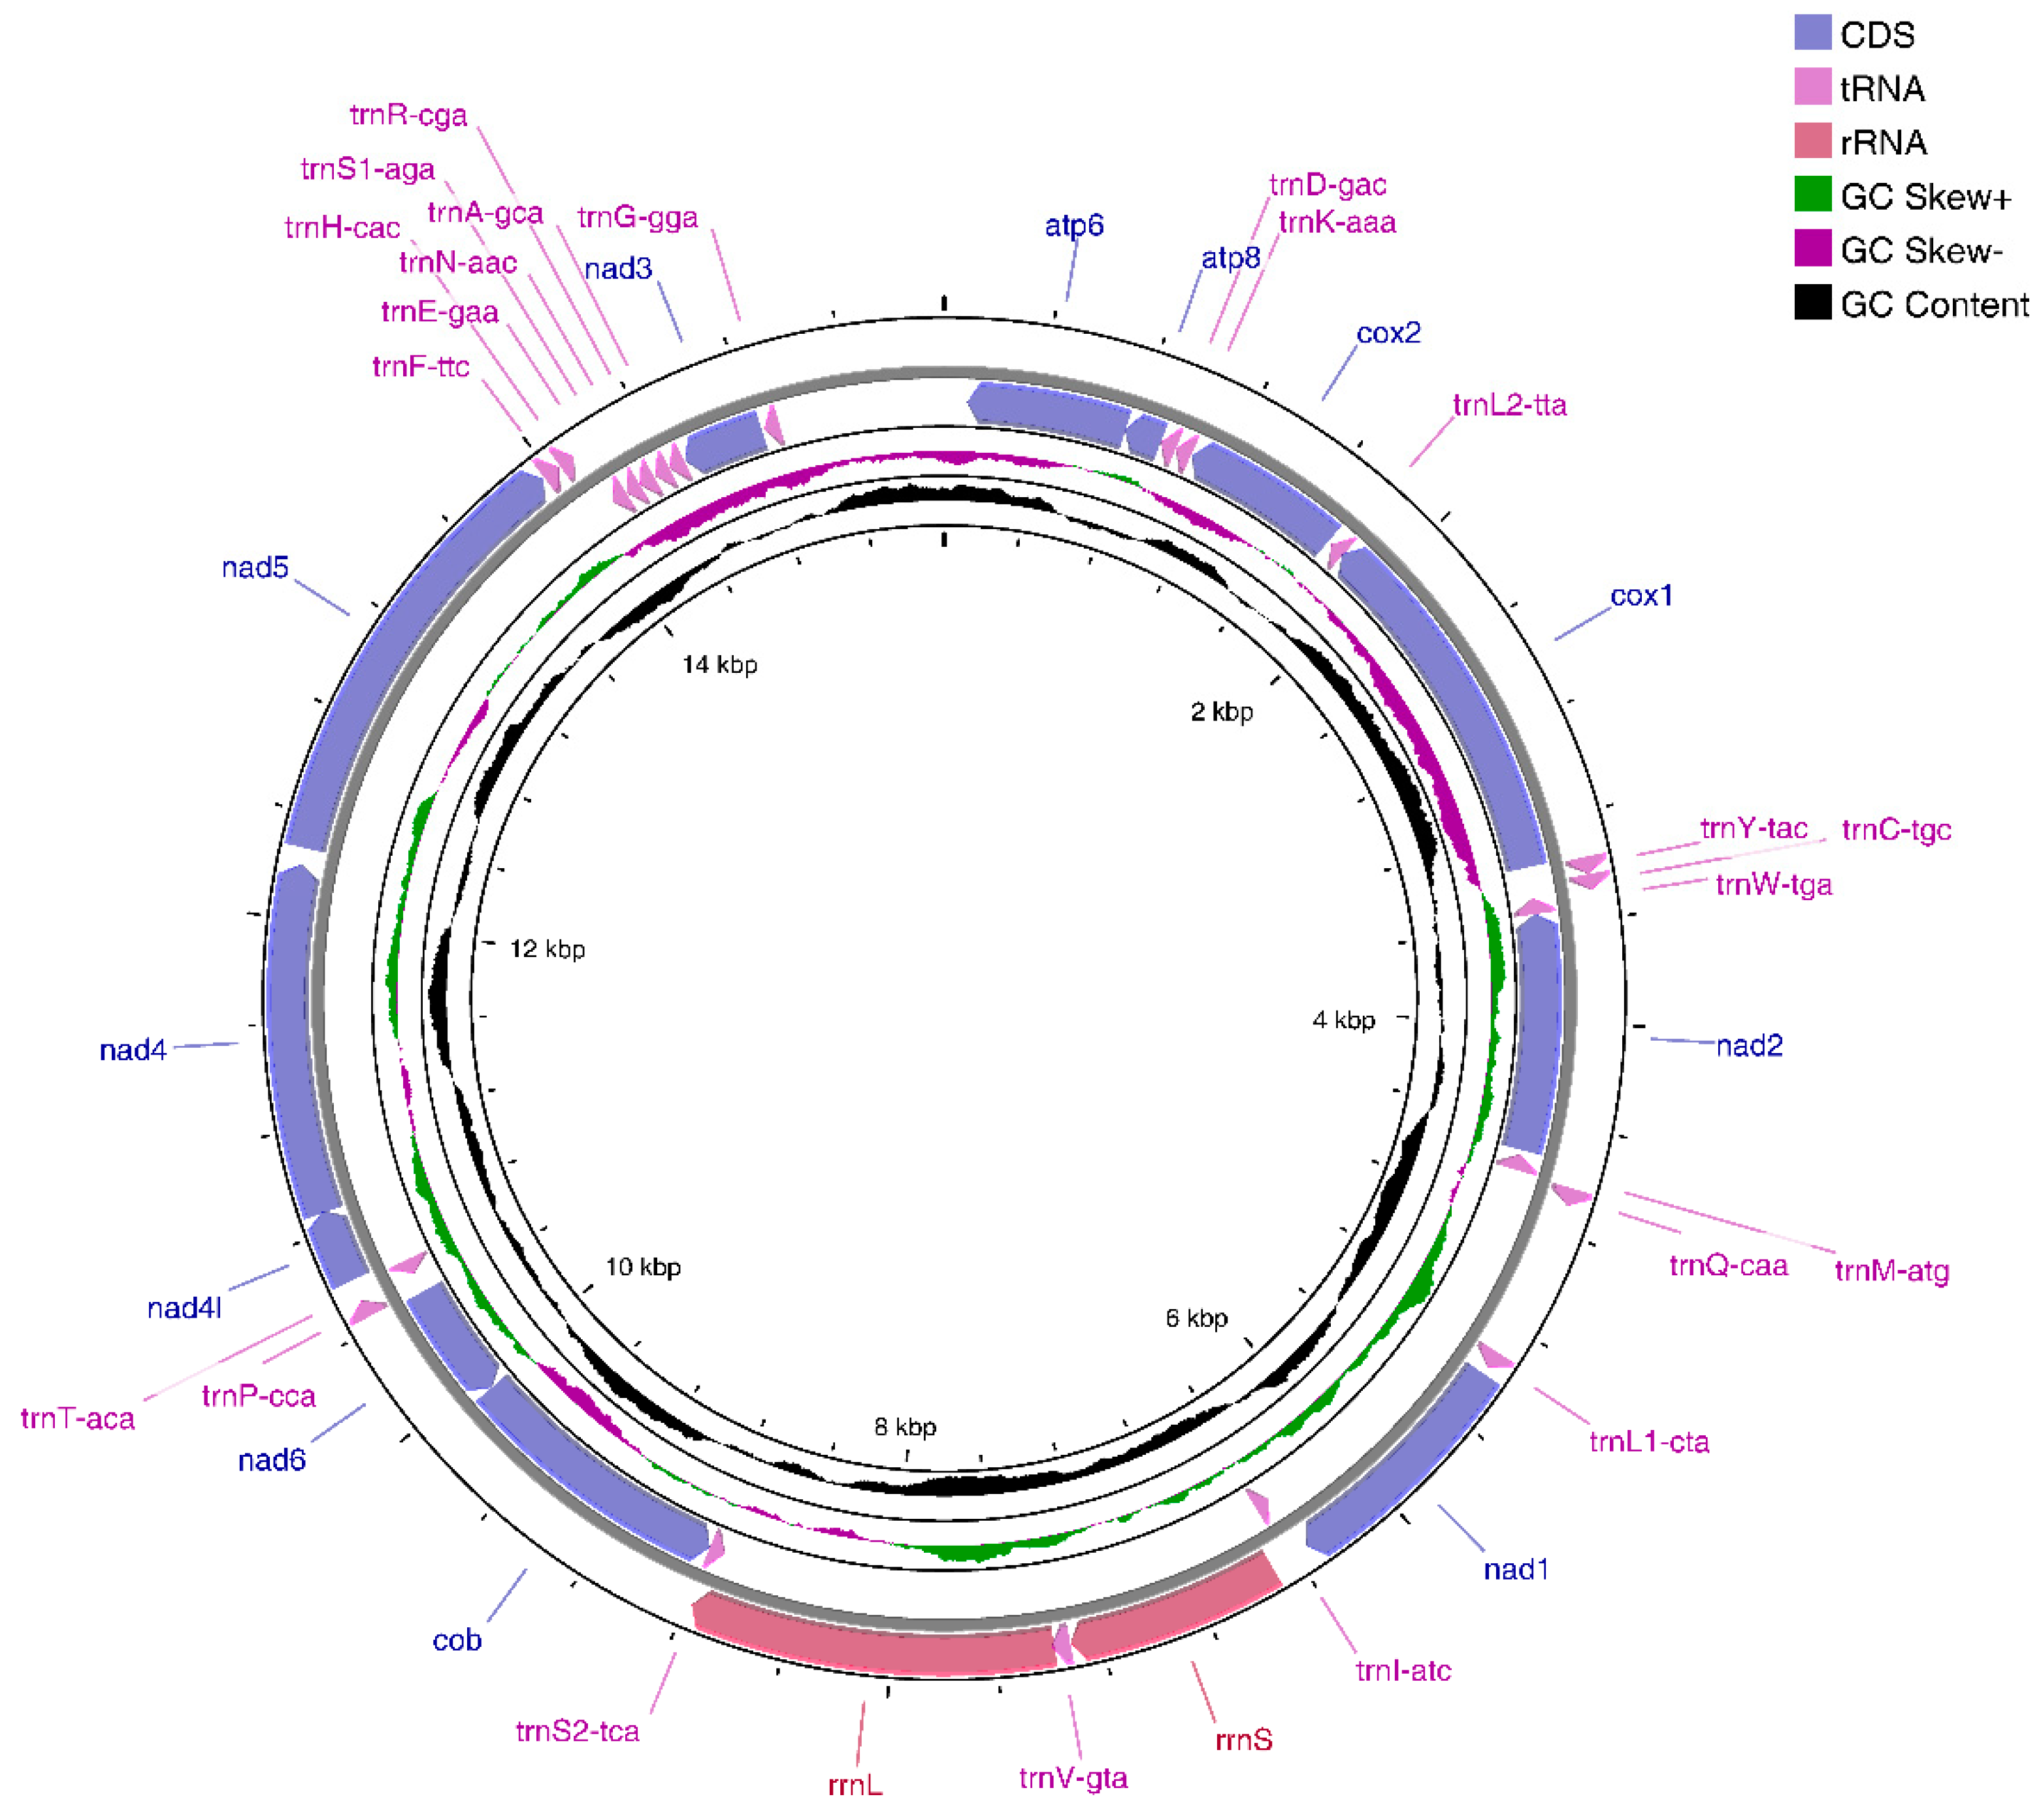
3.1. E. crenata Mitogenome Organization

The Illumina NovaSeq runs resulted in 38,947,830 paired-end reads from the E. crenata library with an insert size of 350 bp. According to selective-assembly analysis, 167,844 reads were assembled into a 15,597 bp circular molecule (ON150678), which represented the complete mitogenome of E. crenata (Figure 1 and Table 2). This length is shorter than that of the complete mitogenome of most Brachyura crabs, including Pseudohelice subquadrata, Macrophthalmus pacificus, Hemigrapsus penicillatus, and Grapsus tenuicrustatus [29,30,31,32]. The genome encodes 37 genes, including 13 PCGs, two rRNA genes, and 22 tRNA genes (duplication of trnL and trnS). Metazoan mitogenomes usually have a control region (D-loop area), which varies in length between species. However, the D-loop area was not obvious in E. crenata mitogenome. As opposed to other Brachyura crabs [15,17], only 14 genes are found on the heavy (H) strand, whereas the other 23 genes are found on the light (L) strand. In addition, there are nine overlaps between adjacent genes in the E. crenata mitogenome with a length range of 1 to 46 bp (cox3/atp6, atp6/atp8, trnL2-ttA/cox1, trnC-tgc/trnW-tga, trnW-tga/nad2, trnV-gta/rrnL, rrnL/trnS2-tca, cob/nad6, nad4l/nad4) (Table 2). The E. crenata mitogenome also contains 941 bp intergenic spacers between genes in 20 regions ranging from 1 to 614 bp (Table 2), indicating the occurrence of tandem repeats and the loss of redundant genes.
Mitochondrial gene rearrangement is known as an effective phylogenetic signal for studying mitochondrial evolution [8]. Several studies and results have confirmed that gene rearrangements in metazoan mitochondrial genomes are conserved [33] and gene rearrangements occur relatively randomly and rarely [10,33,34,35]. However, it can be used as direct evidence of evolutionary relationships between species [36]. Gene order and strand arrangement in E. crenata is unidentical to that reported before in co-order species with mitochondrial genomes deposited in Genbank, i.e., Perisesarma bidens, Parasesarma tripectinis, and Metopaulias depressus [16,37,38]. After comparison and analysis with the ancestor of Decapoda [15], we found that E. crenata had a trnH-cac translocation, where the trnH-cac shifted into trnE-gaa and trnF-ttc, instead of the usual location between nad5 and nad4. This phenomenon also occurs in several other species in Crustacea, such as Grapsus albolineatus, Metopograpsus frontalis, and Macrophthalmus pacificus [39,40,41]. As known, the tandem duplication/random loss model can explain the movement of trnH-cac, which is caused by tandem duplication in the region between trnE-gaa and nad4, followed by deletions of redundant genes that produce trnH-trnF-nad5.
The E. crenata mitogenome has a nucleotide composition of 36.19% A, 10.84% C, 16.90% G, and 36.07% T, with an overall AT content of 72.26% and GC content of 27.74%. This value of AT content was lower than the minimum value of 74.22% reported for Parasesarma tripectinis in the family Sesarmidae [36]. AT and GC skews are a measure of compositional asymmetry. The values of AT and GC skews found in E. crenata mitogenome were different in those of most animal mitogenomes. For E. crenata, the AT skew is 0.00166, and the GC skew is 0.218. As a representative of the family Goneplacidae, the AT skew and GC skew of E. crenata mitogenome showed different results with the species in the family Grapsidae, in which the AT skew and GC skew are always negative [15]. AT-skewed mitochondrial genomes are often reported in metazoan clades, such as crustaceans and brachyuran crabs [42,43,44], whereas GC-skewed mitochondrial genomes are not. The higher value of GC skew implies an apparent bias towards G in nucleotide composition.

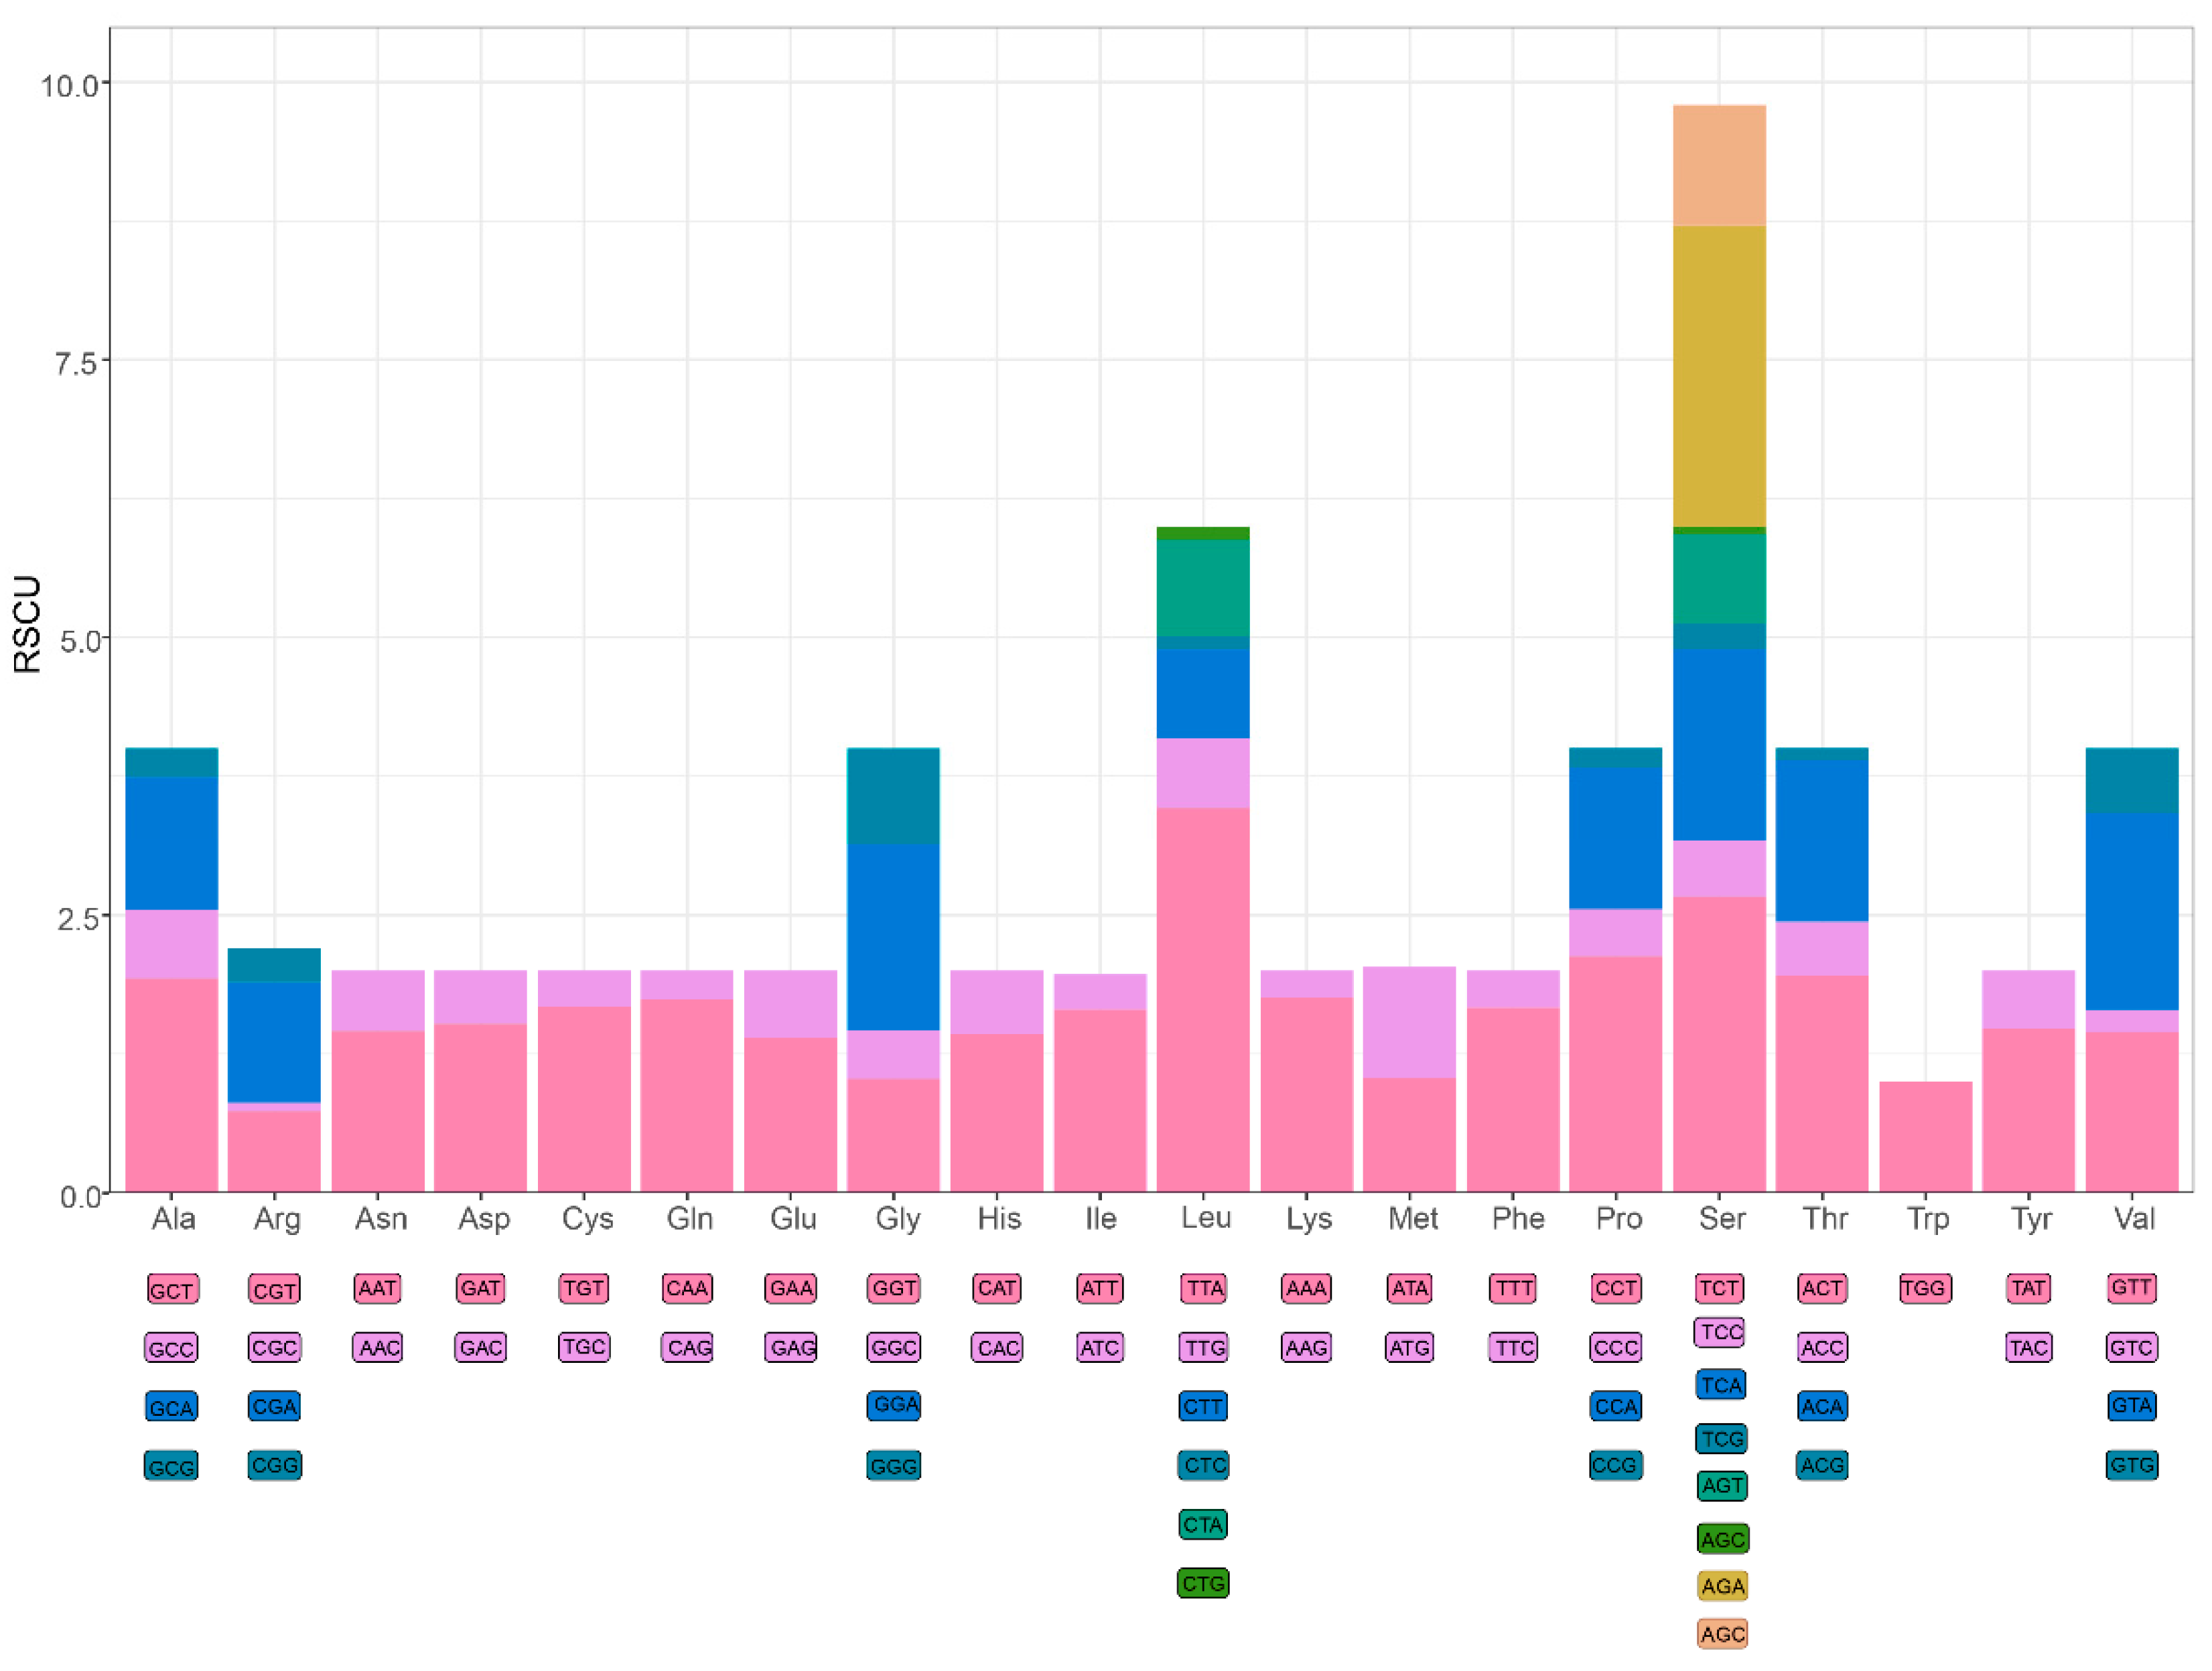
3.2. Protein-Coding Genes

The PCGs include seven NADH dehydrogenases (nad1nad6 and nad4l), three cytochrome c oxidases (cox1cox3), two ATPases (atp6 and atp8), and one cytochrome b (cob). The total length of all 13 PCGs found of E. crenata is 11,049 bp, accounting for 70.8% of the complete length of mitogenome, and the PCGs encode 3683 amino acids (Table 2). Nine PCGs (atp6, atp8, cob, cox1, cox2, cox3, nad2, nad3, and nad6) are encoded on the light strand, while the remaining four (nad1, nad4, nad4l, and nad5) are encoded on the heavy strand. This transcriptional polarity is identical to the reported Brachyura mitochondrial genomes. Furthermore, there are two reading-frame overlaps on the same strand: atp6 and atp8, and nad4 and nad4l each share four and seven nucleotides (Table 2). Start and stop codons varied among the PCGs. Five of thirteen PCGs use ATG (atp8, cox1, cob, nad4l and nad4) and ATA (atp6, cox2, nad2, nad1 and nad5), respectively, as a start codon, whereas nad6 and nad3 use ATT as a start codon. Nine PCGs use TAA (atp6, cox2, cox1, nad1, nad6, nad4l, nad4, nad5 and nad3) as a stop codon and two PCGs use TAG (atp8 and nad2). Finally, cob exhibit an incomplete (T) stop codon. An incomplete stop codon in the cob gene was also observed in the co-infraorder species Chiromantes neglectum, Parasesarma affine, Parasesarma pictum, and Episesarma lafondii [32,45,46,47]. It is assumed that truncated stop codons are completed via post-transcriptional polyadenylation [48]. Previous studies have shown that truncated stop codons were common in the metazoan mitogenomes and may be corrected by post-transcriptional polyadenylation [49,50].
A large number of studies have shown that metazoan mitogenomes always have a bias towards higher representation of nucleotides A and T, resulting in subsequent bias in the corresponding encoded amino acids [51,52,53,54]. In the mitogenome of E. crenata, the A+T contents of PCGs and third codon positions are 69.87% and 69.70%, respectively. The amino acid usage and relative synonymous codon usage (RSCU) values in the PCGs of E. crenata are summarized in Figure 2. The mitogenome encodes a total of 3683 amino acids, among which serine (16.1%) and tryptophan (1.6%) are the most and the least frequently used, respectively. The RSCU values indicate that the six most commonly used codons are TTA (Leu), AGA (Ser), TCT (Ser), CCT (Pro), ACT (Thr), GCT (Ala) (Figure 2). Based on RSCU and amino acid composition in the PCGs, comparative analyses showed that the codon usage pattern of E. crenata is not conserved, varying from those of most Brachyuran species, such as Grapsus albolineatus and Metopaulias depressus [15,16]. In particular, leucine (9.8%) was found to be used less than serine, and AGA (Ser) plays a key role in the codon usage.

3.3. Ribosomal RNA and Transfer RNA Genes

The rrnL and rrnS genes of E. crenata are 1398 bp and 819 bp in length, respectively. Consistent with many Brachyura crabs [15,16], rrnL and rrnS are typically separated by trnV (gta) (Table 2). The AT and GC content of rRNAs are 78.3% and 21.7%, and the AT skew and GC skew are 0.022 and 0.29, respectively, suggesting an apparent bias toward the use of A and G.
Twenty-two tRNA genes were identified in the mitogenome of E. crenata, which is typical for metazoans. As opposed to most Brachyura crabs, i.e., Eurypanopeus depressus, Panopeus herbstii, Rhithropanopeus harrisii and Grapsus albolineatus [15,17], only eight of them are encoded by the heavy strand, and the rest are encoded on the light strand. The total length of tRNAs was 1477 bp, accounting for 9.47% of the mitogenome, and the length of these genes ranges from 62 (trnC-tgc) to 73 (trnV-gta) bp (Table 2). The regions contained 3.06 times more A–T content (75.36%) than G–C content (24.64%). Both AT skew and GC skew were positive, and their values were 0.035 and 0.11, respectively, showing a slight bias toward the use of A and an apparent bias toward G. In addition, the codons with A and T in the third position are used more frequently than other synonymous codons. These characteristics reflect codon usage with A and T bias at the third codon position, similar to the bias found in many metazoans [55,56,57].

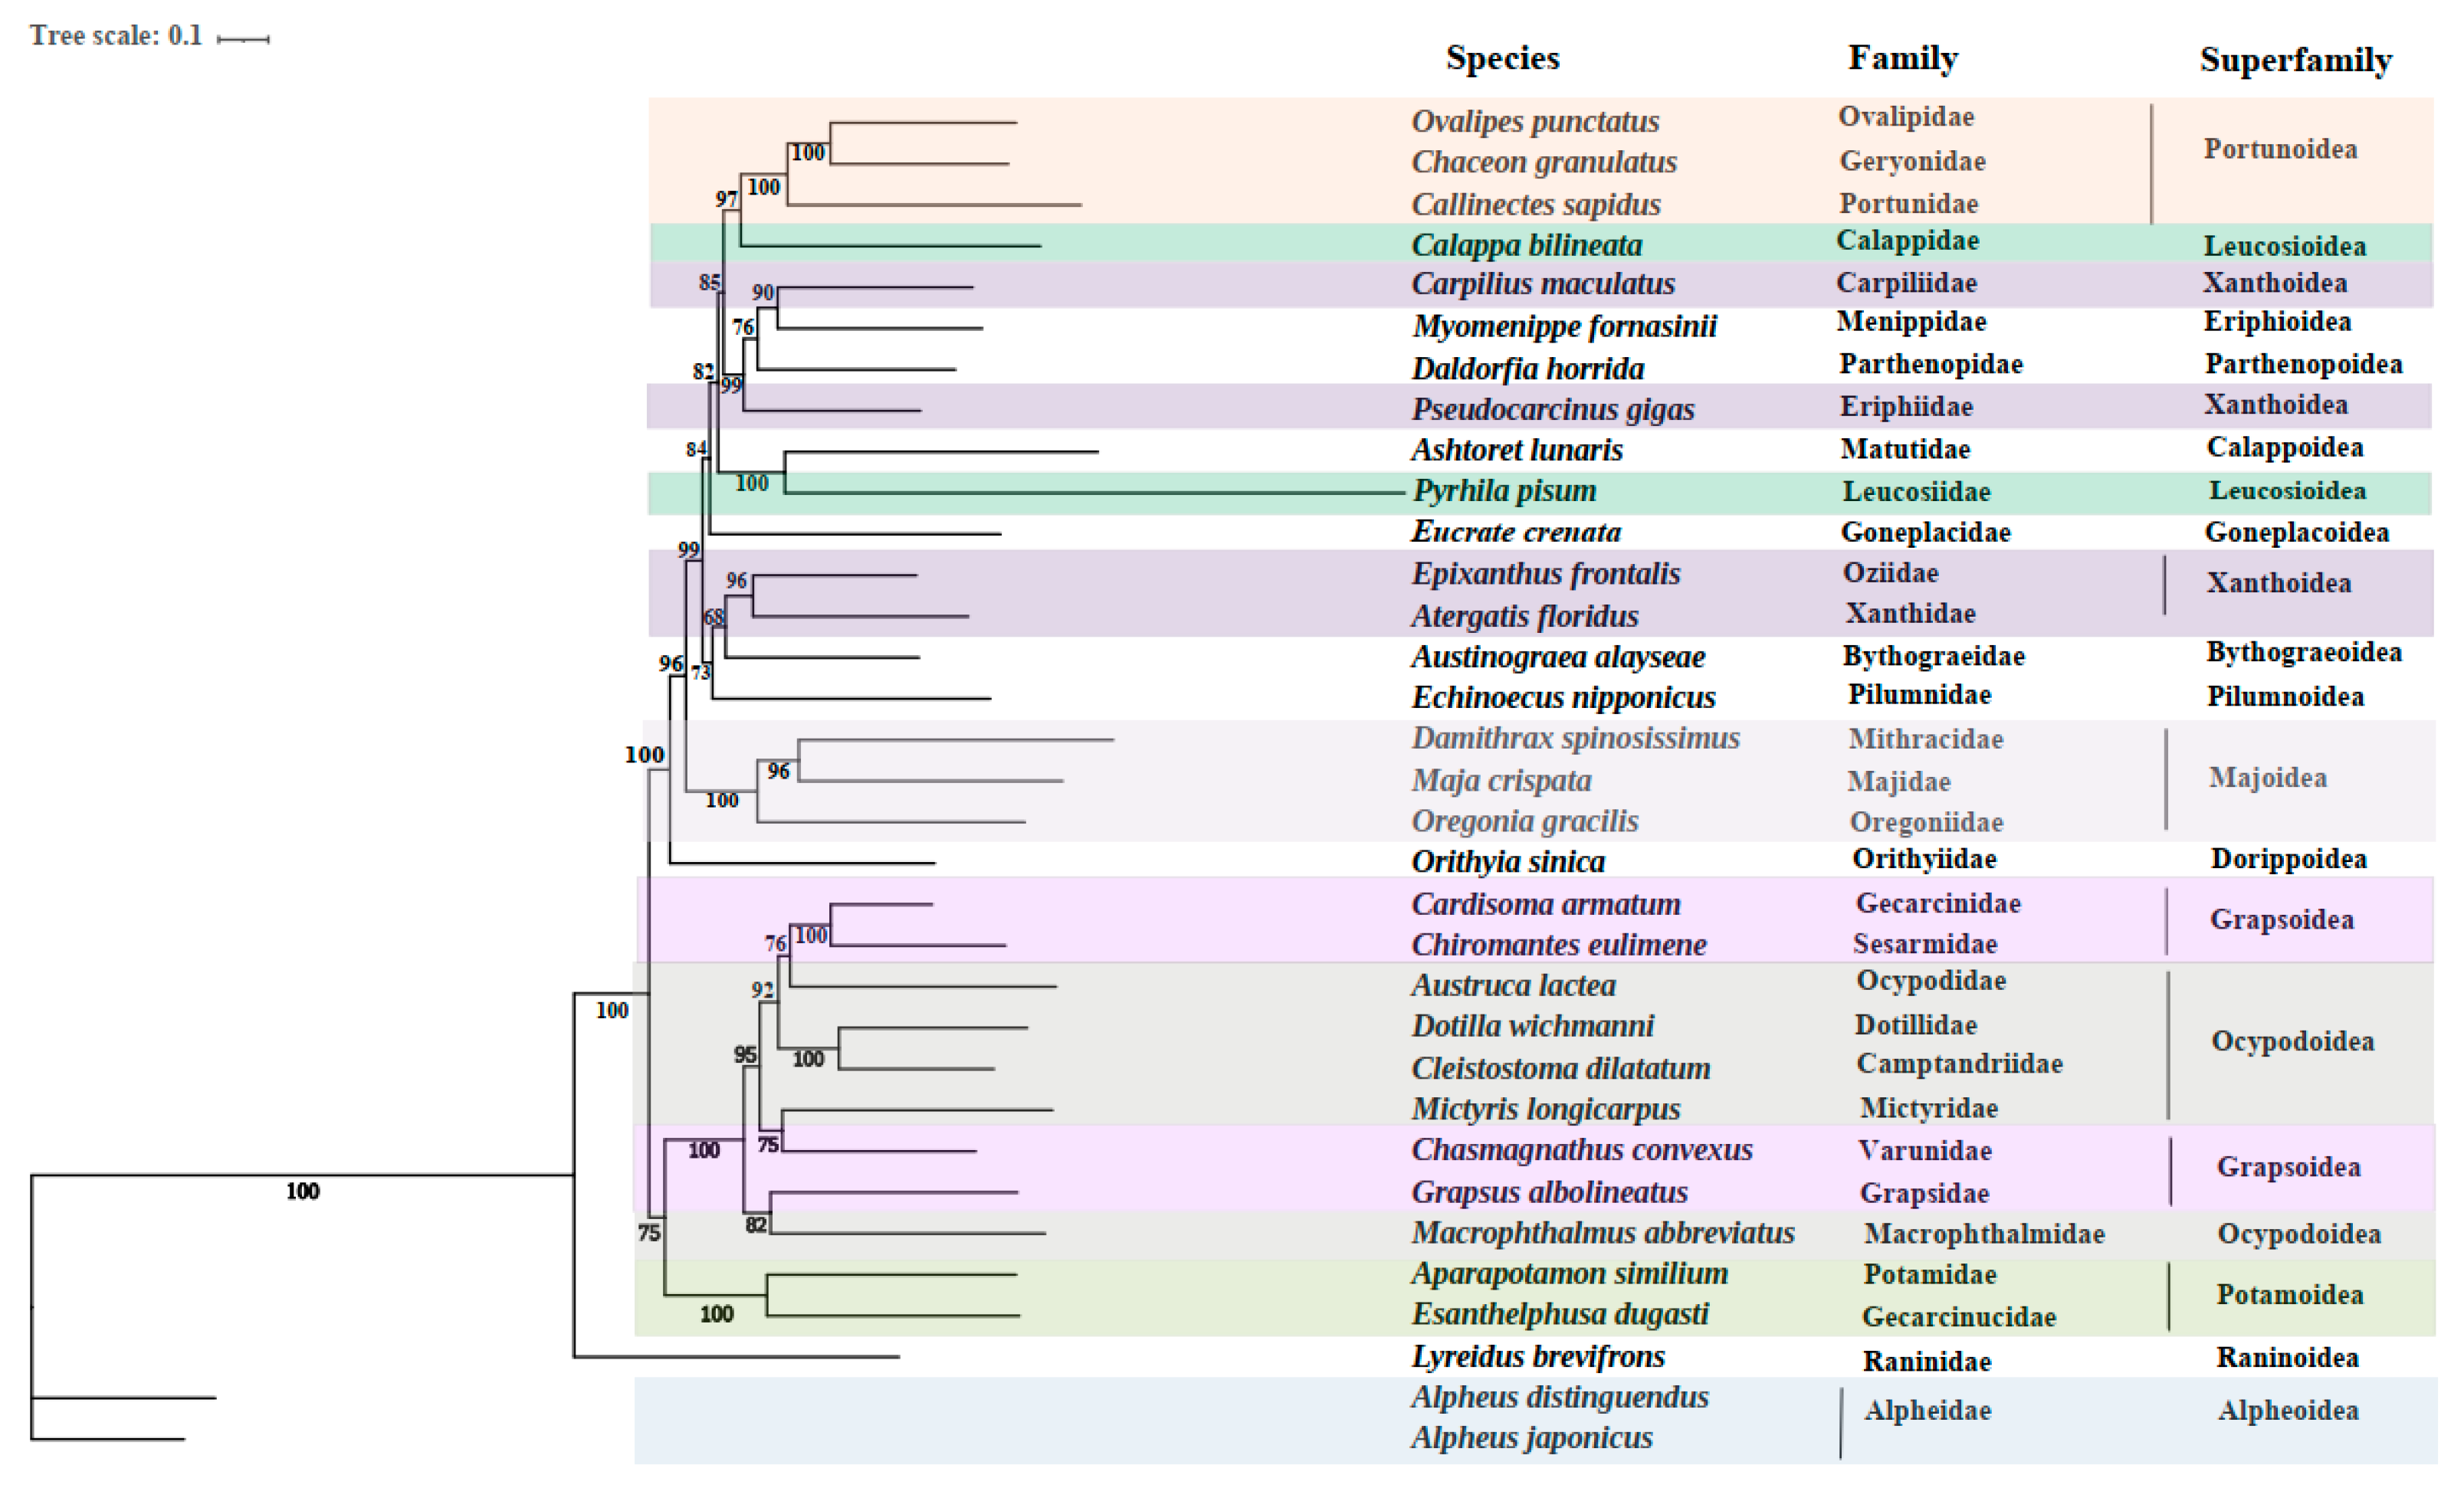
3.4. Phylogenetic Relationships

In the present study, the phylogenetic relationships were analyzed based on the sequences of the 13 PCGs to clarify the relationships in E. crenata and 33 other known Brachyuran species (Figure 3). Phylogenetic analyses were carried out based on nucleotide sequences of 13 mitochondrial PCGs (atp6, atp8, cox1, cox2, cox3, cob, nad1, nad2, nad3, nad4, nad4l, nad5, and nad6) by the ML method. In the phylogenetic tree, some species from the same superfamily such as Xanthoidea, Grapsoidea, and Leucosioidea are not closest related, which may be caused by the selection methods of species here or differences in gene expression and morphological classification. As for the family Goneplacidae, it united well with Matutidae and Leucosiidae, and this also confirms a phylogenetic position of the family Goneplacidae close to Matutidae and Leucosiidae in the infraorder Brachyura. Among the 33 species included in the phylogenetic tree, each species in the tree has a high nodal support value in the clade. It is obvious that Ashtoret lunaris in the family Matutidae is closely related to E. crenata. Phyrhila pisum belonging to the family Leucosiidae also reveals a close relationship with E. crenata, which is second only to Ashtoret lunaris. This may improve the understanding of the phylogenetic position of E. crenata in Brachyura.
As shown in the previous study [58], Ashtoret lunaris also possesses a trnH-cac translocation. That is, the trnH-cac shifted into trnE-gaa and trnF-ttc. Cob exhibits an incomplete (T) stop codon, as does E. crenata. According to data analysis based on the Ashtoret lunaris genome sequence, serine (13.8%) and tryptophan (0.9%) are the most and the least frequently used, respectively. The similar rearrangements and codon usage between Ashtoret lunaris and E. crenata support the results above and provide further evidence for their close phylogenetic relationship.

3.5. Positive Selection Analysis

Purifying selection is the dominant force in mitotic evolution. Weak and/or episodic positive selection may occur under the strong purifying selection of reduced oxygen availability or greater energy requirements, because mitochondria are the primary site of aerobic respiration and are essential for energy metabolism [59,60,61]. Numerous studies have demonstrated that mitochondrial PCGs experienced positive selection in animals that survived in low oxygen environments, such as Tibetan humans, Ordovician bivalves, diving cetaceans, and insects [62,63,64,65].
Potential positive selection in E. crenata using CodeML implemented in the PAML package was examined to investigate whether marine ecosystems influence the function of mitochondrial genes. In the analysis of branch models, the ω (dN/dS) ratio that calculated under the one-ratio model (M0) was 0.03928 for the 13 mitochondrial PCGs of E. crenata (Table 3), indicating that these genes have underwent constrained selection pressure to maintain the main function. In the two-ratio model, ω0 and ω1, which represent the values for the background branch and foreground branch, were 0.04084 and 999.00000, respectively. The ω ratio of the foreground branch (ω1 = 999.00000) was significantly more than 1, indicating a strong positive selection of E. crenata by the infraorder Brachyura. In addition, many studies have shown that positive selection usually occurs over a short evolutionary time and performed on only a few sites [59,66]. Therefore, the signals of positive selection are often overwhelmed by those for successive purifying selection that occur at most sites in the gene sequence [59,61,66]. In the current study, branch-site models were used to determine possible positively selected sites in E. crenata (Table 4). One residue, located in cox1, was identified as a positively selected site with high BEB value (>95%). It is known that mitochondrial PCGs are crucial in the oxidative phosphorylation pathway. Cytochrome c oxidase catalyzes the oxygen terminal reduction, and the catalytic core is encoded by three mitochondrial PCGs (cox1, cox2 and cox3) [61,67]. Cytochrome c oxidase has been confirmed to be a particularly important site of the positive selection in marine anoxic adaptation [68]. It has been reported that the cytochrome c oxidase requires reactive oxygen species (ROS) when the living cells are exposed to anoxia, and the increase in ROS concentration contributes to stabilize Hif-1α, which then results in the induction of Hif-1-dependent nuclear hypoxic genes [61,69,70]. The positive selection site in cox1 suggests a phylogenetic adaption of ATP synthase in the presence of reduced oxygen availability or increased energy requirements. In addition, cox1 in mitochondrion is involved in the regulation of platelet aggregation and vasomotor to maintain the stability of physiological functions of cells, tissues, and organs [61]. For E. crenata, functional modification mediated by positive selection mutations may increase the affinity between the enzyme and oxygen, and then efficiently utilize oxygen utilization under hypoxia conditions and maintain basic metabolic levels.
It’s well known that the marine environment is features with a lack of high pressure, variable temperatures, and low dissolved oxygen. Several studies have confirmed that all the above environmental factors could influence the mitochondrial aerobic respiration process [56,71,72]. In this study, the potentially adaptive residue was identified in the cox1 gene, supporting the adaptive evolution of the E. crenata mitogenome. Our results provide an important basis for understanding how marine crabs maintain aerobic respiration to obtain adequate energy in marine chemosynthesis environment at the mitochondrial level.

4. Conclusions

In this study, the mitogenome of E. crenata was sequenced by HTS sequencing, thereby the first complete mitogenome for the family Goneplacidae was revealed. The E. crenata mitogenome is a typical closed-circular animal molecule including 13 PCGs, 22 tRNA genes, and two rRNA genes. Different from the published results for most Brachyura crabs, the AT skew and GC skew in the mitogenome are both positive. E. crenata shows a trnH-cac translocation between trnE-gaa and trnF-ttc. The phylogenetic analyses indicate that E. crenata is closely related to Ashtoret lunaris of Matutidae. Positive selection analysis showed that one residue located in cox1 was identified as a positively selected site with high BEB value, which may suggest that this gene was under positive selection pressure in the marine ecosystem. The findings of this study could help to deepen the understanding of the phylogeny of Goneplacidae and the adaptive evolution at the mitochondrial level for marine crabs.

Author Contributions

Conceptualization, Methodology, Writing—Original Draft Preparation: X.P.; Resources: C.H., B.G. and K.L.; Writing—Review & Editing, Supervision: X.L. (Xiaolong Lin) and X.L. (Xueqiang Lu). All authors have read and agreed to the published version of the manuscript.

Funding

This research was funded by National Key Research & Development Program of China, grant number 2019YFE0122300.

Institutional Review Board Statement

Not applicable.

Informed Consent Statement

Not applicable.

Data Availability Statement

The mitochondrial genome has been deposited in the NCBI with accession number ON150678.

Conflicts of Interest

The authors declare no conflict of interest. The funders had no role in the design of the study; in the collection, analyses, or interpretation of data; in the writing of the manuscript; or in the decision to publish the results.

References

  1. Martijn, J.; Vosseberg, J.; Guy, L.; Offre, P.; Ettema, T.J.G. Deep mitochondrial origin outside the sampled alphaproteobacteria. Nature 2018, 557, 101–105. [Google Scholar] [CrossRef] [PubMed]
  2. Boore, J.L.; Brown, W.M. Big trees from little genomes: Mitochondrial gene order as a phylogenetic tool. Curr. Opin. Genet. Dev. 1998, 8, 668–674. [Google Scholar] [CrossRef]
  3. Boore, J.L.; Macey, J.R.; Medina, M. Sequencing and comparing whole mitochondrial genomes of animals. Method Enzymol. 2005, 395, 311–348. [Google Scholar]
  4. Boore, J.L.; Lavrov, D.V.; Brown, W.M. Gene translocation links insects and crustaceans. Nature 1998, 392, 667–668. [Google Scholar] [CrossRef] [PubMed]
  5. Boore, J.L. Animal mitochondrial genomes. Nucleic Acids Res. 1999, 27, 1767–1780. [Google Scholar] [CrossRef] [PubMed] [Green Version]
  6. Kundu, S.; Kumar, V.; Tyagi, K.; Chakraborty, R.; Chandra, K. The first complete mitochondrial genome of the Indian tent turtle, Pangshura tentoria (Testudines: Geoemydidae): Characterization and comparative analysis. Ecol. Evol. 2019, 9, 10854–10868. [Google Scholar] [CrossRef] [Green Version]
  7. Dhar, D.; Dey, D.; Basu, S.; Fortunato, H. Understanding the adaptive evolution of mitochondrial genomes in intertidal chitons. BioRxiv 2020, 3, 980664. [Google Scholar]
  8. Tan, M.H.; Gan, H.M.; Lee, Y.P.; Linton, S.; Grandjean, F.; Bartholomei-Santos, M.L.; Miller, A.D.; Austin, C.M. ORDER within the chaos: Insights into phylogenetic relationships within the Anomura (Crustacea: Decapoda) from mitochondrial sequences and gene order rearrangements. Mol. Phylogenet. Evol. 2018, 127, 320–331. [Google Scholar] [CrossRef] [PubMed]
  9. Schuster, A.; Vargas, S.; Knapp, I.S.; Pomponi, S.A.; Toonen, R.J.; Erpenbeck, D.; Worheide, G. Divergence times in demosponges (Porifera): First insights from new mitogenomes and the inclusion of fossils in a birthdeath clock model. BMC Evol. Biol. 2018, 18, 114. [Google Scholar] [CrossRef]
  10. Basso, A.; Babbucci, M.; Pauletto, M.; Riginella, E.; Patarnello, T.; Negrisolo, E. The highly rearranged mitochondrial genomes of the crabs Maja crispata and Maja squinado (Majidae) and gene order evolution in Brachyura. Sci. Rep. 2017, 7, 4096. [Google Scholar] [CrossRef] [PubMed] [Green Version]
  11. Ji, Y.K.; Wang, A.; Lu, X.L.; Song, D.H.; Jin, Y.H.; Lu, J.J.; Sun, H.Y. Mitochondrial genomes of two Brachyuran crabs (Crustacea: Decapoda) and phylogenetic analysis. J. Crustacean Biol. 2014, 34, 494–503. [Google Scholar] [CrossRef] [Green Version]
  12. Castro, P. A reappraisal of the family Goneplacidae MacLeay, 1838 (Crustacea, Decapoda, Brachyura) and revision of the subfamily Goneplacinae, with the description of 10 new genera and 18 new species. Zoosystema 2007, 29, 609–774. [Google Scholar]
  13. Karasawa, H.; Kato, H. The systematic status of the genus Miosesarma Karasawa, 1989 with a phylogenetic analysis within the family Grapsidae and a review of fossil records (Crustacea: Decapoda: Brachyura). Paleontol. Res. 2001, 5, 259–275. [Google Scholar]
  14. Ng, P.K.L.; Castro, P. A revision of Carcinoplax abyssicola (Miers, 1885) and seven related species of Carcinoplax, H. Milne Edwards, 1852, with the description of two new species and an updated key to the genus (Crustacea, Decapoda, Brachyura, Goneplacidae). Zoosystema 2020, 42, 239–284. [Google Scholar] [CrossRef]
  15. Lu, J.Y.; Xia, L.P.; Liu, X.J.; Ma, Y.W.; Li, J.J.; Ye, Y.Y.; Guo, B.Y. The mitochondrial genome of Grapsus albolineatus (Decapoda: Brachyura: Grapsidae) and phylogenetic associations in Brachyura. Sci. Rep. 2022, 12, 2104. [Google Scholar] [CrossRef]
  16. Rodriguez-Pilco, M.A.; Lesny, P.; Podsiadlowski, L.; Schubart, C.D.; Baeza, J.A. Characterization of the Complete Mitochondrial Genome of the Bromeliad Crab Metopaulias depressus (Rathbun, 1896) (Crustacea: Decapoda: Brachyura: Sesarmidae). Genes 2022, 13, 299. [Google Scholar] [CrossRef]
  17. Jennings, L.A.; Blakeslee, A.M.H.; McCoy, K.A.; Behringer, D.C.; Bojko, J. Systematic assessment of the Panopeidae and broader Eubrachyura (Decapoda: Brachyura) using mitochondrial genomics. Arthropod Syst. Phylo. 2021, 79, 569–585. [Google Scholar] [CrossRef]
  18. Nayak, A.; Roy, M.K.D.; Mohanty, B.; Rout, S.S.; Dash, B.; Raman, A.V.; Patnaik, L.; Raut, D. On the occurrence of an Euryplacid crab Eucrate crenata (De Haan, 1835), a first record from Odisha, India. Indian J. Geo-Mar. Sci. 2020, 49, 1105–1107. [Google Scholar]
  19. Lim, H.J.; Lee, E.H.; Yoon, Y.; Chua, B.; Son, A. Portable lysis apparatus for rapid single-step DNA extraction of Bacillus subtilis. J. Appl. Microbiol. 2016, 120, 379–387. [Google Scholar] [CrossRef] [Green Version]
  20. Bolger, A.M.; Lohse, M.; Usadel, B. Trimmomatic: A flexible trimmer for Illumina sequence data. Bioinformatics 2014, 30, 2114–2120. [Google Scholar] [CrossRef] [Green Version]
  21. Perna, N.T.; Kocher, T.D. Patterns of nucleotide composition at fourfold degenerate sites of animal mitochondrial genomes. J. Mol. Evol. 1995, 41, 353–358. [Google Scholar] [CrossRef] [PubMed]
  22. Ohta, T. The nearly neutral theory of molecular evolution. Annu. Rev. Ecol. S. 1992, 23, 263–286. [Google Scholar] [CrossRef]
  23. Yang, Z.H. Likelihood ratio tests for detecting positive selection and application to primate lysozyme evolution. Mol. Biol. Evol. 1998, 15, 568–573. [Google Scholar] [CrossRef]
  24. Yang, Z.H. PAML 4, a program package for phylogenetic analysis by maximum likelihood. Mol. Biol. Evol. 2007, 24, 1586–1591. [Google Scholar] [CrossRef] [Green Version]
  25. Yang, Z.H.; Nielsen, R.; Goldman, N.; Pedersen, A.M.K. Codon-substitution models for heterogeneous selection pressure at amino acid sites. Genetics 2000, 155, 431–449. [Google Scholar] [CrossRef]
  26. Nielsen, R.; Yang, Z.H. Likelihood models for detecting positively selected amino acid sites and applications to the HIV-1 envelope gene. Genetics 1998, 148, 929–936. [Google Scholar] [CrossRef]
  27. Yang, Z.H.; Wong, W.S.W.; Nielsen, R. Bayes empirical bayes inference of amino acid sites under positive selection. Mol. Biol. Evol. 2005, 22, 1107–1118. [Google Scholar] [CrossRef] [Green Version]
  28. Xu, X.D.; Wu, X.Y.; Yu, Z.N. The mitogenome of Paphia euglypta (Bivalvia: Veneridae) and comparative mitogenomic analyses of three venerids. Genome 2010, 53, 1041–1052. [Google Scholar] [CrossRef]
  29. Kim, H.S.; Kim, K.Y.; Lee, S.H.; Hong, S.S.; Cho, I.Y.; Yi, C.H.; Kim, I.H.; Yoon, M.; Kim, M.S. The complete mitochondrial genome of Pseudohelice subquadrata (Dana, 1851) (Crustacea: Decapoda: Varunidae). Mitochondrial DNA B 2019, 4, 103–104. [Google Scholar] [CrossRef] [Green Version]
  30. Wang, Q.; Tang, D.; Guo, H.Y.; Wang, J.; Xu, X.Y.; Wang, Z.F. Comparative mitochondrial genomic analysis of Macrophthalmus pacificus and insights into the phylogeny of the Ocypodoidea & Grapsoidea. Genomics 2020, 112, 82–91. [Google Scholar]
  31. Karagozlu, M.Z.; Kim, J.I.; Choi, T.J.; Dinh, T.D.; Kim, C.B. The complete mitochondrial genome of Hemigrapsus penicillatus (De Haan, 1835) (Decapoda, Varunidae). Mitochondrial DNA B 2018, 3, 261–262. [Google Scholar] [CrossRef] [PubMed] [Green Version]
  32. Sung, J.M.; Lee, J.; Kim, S.K.; Karagozlu, M.Z.; Kim, C.B. The complete mitochondrial genome of Grapsus tenuicrustatus (Herbst, 1783) (Decapoda, Grapsidae). Mitochondrial DNA B 2016, 1, 441–442. [Google Scholar] [CrossRef] [PubMed]
  33. Wang, Z.F.; Wang, Z.Q.; Shi, X.J.; Wu, Q.; Tao, Y.T.; Guo, H.Y.; Ji, C.Y.; Bai, Y.Z. Complete mitochondrial genome of Parasesarma affine (Brachyura: Sesarmidae): Gene rearrangements in Sesarmidae and phylogenetic analysis of the Brachyura. Int. J. Biol. Macromol. 2018, 118, 31–40. [Google Scholar] [CrossRef] [PubMed]
  34. Zhang, Y.; Gong, L.; Lu, X.T.; Jiang, L.H.; Liu, B.J.; Liu, L.Q.; Lu, Z.M.; Li, P.F.; Zhang, X. Gene rearrangements in the mitochondrial genome of Chiromantes eulimene (Brachyura: Sesarmidae) and phylogenetic implications for Brachyura. Int. J. Biol. Macromol. 2020, 162, 704–714. [Google Scholar] [CrossRef]
  35. Zhang, K.; Zhu, K.H.; Liu, Y.F.; Zhang, H.; Gong, L.; Jiang, L.H.; Liu, L.Q.; Lu, Z.M.; Liu, B.J. Novel gene rearrangement in the mitochondrial genome of Muraenesox cinereus and the phylogenetic relationship of Anguilliformes. Sci. Rep. 2021, 11, 2411. [Google Scholar] [CrossRef]
  36. Gong, L.; Lu, X.T.; Wang, Z.F.; Zhu, K.H.; Liu, L.Q.; Jiang, L.H.; Lu, Z.M.; Liu, B.J. Novel gene rearrangement in the mitochondrial genome of Coenobita brevimanus (Anomura: Coenobitidae) and phylogenetic implications for Anomura. Genomics 2020, 112, 1804–1812. [Google Scholar] [CrossRef]
  37. Park, Y.J.; Park, C.E.; Lee, S.H.; Ko, H.S.; Ullah, I.; Hwang, U.W.; Shin, J.H. The complete mitochondrial genome sequence of the intertidal crab Parasesarma tripectinis (Arthropoda, Decapoda, Sesarmidae). Mitochondrial DNA B 2018, 3, 193–194. [Google Scholar] [CrossRef] [Green Version]
  38. Li, Y.T.; Xin, Z.Z.; Tang, Y.Y.; Yang, T.T.; Tang, B.P.; Sun, Y.; Zhang, D.Z.; Zhou, C.L.; Liu, Q.N.; Yu, X.M. Comparative mitochondrial genome analyses of sesarmid and other brachyuran crabs reveal gene rearrangements and phylogeny. Front. Genet. 2020, 11, 536640. [Google Scholar] [CrossRef]
  39. Kennish, R.; Williams, G.A. Feeding preferences of the herbivorous crab Grapsus albolineatus: The differential influence of algal nutrient content and morphology. Mar. Ecol. Prog. Ser. 1997, 147, 87–95. [Google Scholar] [CrossRef] [Green Version]
  40. Guan, M.Y.; Liu, X.M.; Lin, F.; Xie, Z.F.; Fazhan, H.; Ikhwanuddin, M.; Tan, H.Q.; Ma, H.Y. The whole mitochondrial genome of the mangrove crab, Metopograpsus frontalis (Miers, 1880) (Decapoda, Grapsidae) and its phylogenetic relationship. Mitochondrial DNA B 2018, 3, 368–369. [Google Scholar] [CrossRef] [Green Version]
  41. Wang, Z.Q.; Shi, X.J.; Guo, H.Y.; Tang, D.; Bai, Y.Z.; Wang, Z.F. Characterization of the complete mitochondrial genome of Uca lacteus and comparison with other Brachyuran crabs. Genomics 2020, 112, 10–19. [Google Scholar] [CrossRef] [PubMed]
  42. Gan, H.Y.; Gan, H.M.; Tan, M.H.; Lee, Y.P.; Austin, C.M. The complete mitogenome of the hermit crab Clibanarius infraspinatus (Hilgendorf, 1869) (Crustacea: Decapoda: Diogenidae)—A new gene order for the Decapoda. Mitochondrial DNA A 2016, 27, 4099–4100. [Google Scholar] [CrossRef] [PubMed]
  43. Tang, B.P.; Xin, Z.Z.; Liu, Y.; Zhang, D.Z.; Wang, Z.F.; Zhang, H.B.; Chai, X.Y.; Zhou, C.L.; Liu, Q.N. The complete mitochondrial genome of Sesarmops sinensis reveals gene rearrangements and phylogenetic relationships in Brachyura. PLoS ONE 2017, 12, e0179800. [Google Scholar]
  44. Yang, J.S.; Nagasawa, H.; Fujiwara, Y.; Tsuchida, S.; Yang, W.J. The complete mitogenome of the hydrothermal vent crab Gandalfus yunohana (Crustacea: Decapoda: Brachyura): A link between the Bythograeoidea and Xanthoidea. Zool. Scr. 2010, 39, 621–630. [Google Scholar] [CrossRef]
  45. Xing, Y.H.; Ma, X.P.; Wei, Y.Q.; Pan, D.; Liu, W.L.; Sun, H.Y. The complete mitochondrial genome of the semiterrestrial crab, Chiromantes neglectum (Eubrachyura: Grapsoidea: Sesarmidae). Mitochondrial DNA B 2016, 1, 461–463. [Google Scholar] [CrossRef] [Green Version]
  46. Wang, Z.F.; Shi, X.J.; Tao, Y.T.; Wu, Q.; Bai, Y.Z.; Guo, H.Y.; Tang, D. The complete mitochondrial genome of Parasesarma pictum (Brachyura: Grapsoidea: Sesarmidae) and comparison with other Brachyuran crabs. Genomics 2019, 111, 799–807. [Google Scholar] [CrossRef]
  47. Zhang, Y.; Gao, Y.; Gong, L.; Lu, X.T.; Jiang, L.H.; Liu, B.J.; Liu, L.Q.; Lu, Z.M.; Li, P.F. Mitochondrial Genome of Episesarma lafondii (Brachyura: Sesarmidae) and Comparison with Other Sesarmid Crabs. J. Ocean. U. China 2021, 20, 1545–1556. [Google Scholar] [CrossRef]
  48. Baeza, J.A. The complete mitochondrial genome of the Caribbean spiny lobster Panulirus argus. Sci. Rep. 2018, 8, 17690. [Google Scholar] [CrossRef] [Green Version]
  49. Ojala, D.; Montoya, J.; Attardi, G. TRNA punctuation model of RNA processing in human mitochondria. Nature 1981, 290, 470–474. [Google Scholar] [CrossRef]
  50. Dreyer, H.; Steiner, G. The complete sequences and gene organisation of the mitochondrial genome of the heterodont bivalves Acanthocardia tuberculata and Hiatella arctica–and the first record for a putative Atpase subunit 8 gene in marine bivalves. Front. Zool. 2006, 3, 13. [Google Scholar] [CrossRef] [Green Version]
  51. Salvato, P.; Simonato, M.; Battisti, A.; Negrisolo, E. The complete mitochondrial genome of the bag-shelter moth Ochrogaster lunifer (Lepidoptera, Notodontidae). BMC Genom. 2008, 9, 331. [Google Scholar] [CrossRef] [PubMed] [Green Version]
  52. Yu, H.; Li, Q. Complete mitochondrial DNA sequence of Crassostrea nippona: Comparative and phylogenomic studies on seven commercial Crassostrea species. Mol. Biol. Rep. 2012, 39, 999–1009. [Google Scholar] [CrossRef] [PubMed]
  53. Wang, Z.L.; Li, C.; Fang, W.Y.; Yu, X.P. The complete mitochondrial genome of two Tetragnatha Spiders (Araneae: Tetragnathidae): Severe truncation of tRNAs and novel gene rearrangements in araneae. Int. J. Biol. Sci. 2016, 12, 109–119. [Google Scholar] [CrossRef] [PubMed] [Green Version]
  54. Sun, S.E.; Sha, Z.L.; Wang, Y.R. Complete mitochondrial genome of the first deep-sea spongicolid shrimp Spongiocaris panglao (Decapoda: Stenopodidea): Novel gene arrangement and the phylogenetic position and origin of Stenopodidea. Gene 2018, 676, 123–138. [Google Scholar] [CrossRef]
  55. Chai, H.N.; Du, Y.Z.; Zhai, B.P. Characterization of the complete mitochondrial genome of Cnaphalocrocis medinalis and Chilo suppressalis (Lepidoptera: Pyralidae). Int. J. Biol. Sci. 2012, 8, 561–579. [Google Scholar] [CrossRef] [Green Version]
  56. Zhang, B.; Zhang, Y.H.; Wang, X.; Zhang, H.X.; Lin, Q. The mitochondrial genome of a sea anemone Bolocera sp. exhibits novel genetic structures potentially involved in adaptation to the deep-sea environment. Ecol. Evol. 2017, 7, 4951–4962. [Google Scholar] [CrossRef] [Green Version]
  57. Sun, S.E.; Hui, M.; Wang, M.X.; Sha, Z.L. The complete mitochondrial genome of the alvinocaridid shrimp Shinkaicaris leurokolos (Decapoda, Caridea): Insight into the mitochondrial genetic basis of deep-sea hydrothermal vent adaptation in the shrimp. Comp. Biochem. Phys. D 2018, 25, 42–52. [Google Scholar] [CrossRef]
  58. Tan, M.H.; Gan, H.M.; Lee, Y.P.; Austin, C.M. The complete mitogenome of the moon crab Ashtoret lunaris (Forskal, 1775), (Crustacea; Decapoda; Matutidae). Mitochondrial DNA Part A 2016, 27, 1313–1314. [Google Scholar] [CrossRef]
  59. Shen, Y.Y.; Liang, L.; Zhu, Z.H.; Zhou, W.P.; Irwin, D.M.; Zhang, Y.P. Adaptive evolution of energy metabolism genes and the origin of flight in bats. Proc. Natl. Acad. Sci. USA 2010, 107, 8666–8671. [Google Scholar] [CrossRef] [Green Version]
  60. Tomasco, I.H.; Lessa, E.P. The evolution of mitochondrial genomes in subterranean caviomorph rodents: Adaptation against a background of purifying selection. Mol. Phylogenet. Evol. 2011, 61, 64–70. [Google Scholar] [CrossRef]
  61. Yang, M.; Gong, L.; Sui, J.X.; Li, X.Z. The complete mitochondrial genome of Calyptogena marissinica (Heterodonta: Veneroida: Vesicomyidae): Insight into the deep-sea adaptive evolution of vesicomyids. PLoS ONE 2019, 14, e0217952. [Google Scholar] [CrossRef] [PubMed] [Green Version]
  62. Da Fonseca, R.R.; Johnson, W.E.; O’Brien, S.J.; Ramos, M.J.; Antunes, A. The adaptive evolution of the mammalian mitochondrial genome. BMC Genom. 2008, 9, 119. [Google Scholar] [CrossRef] [PubMed] [Green Version]
  63. Gu, M.L.; Dong, X.Q.; Shi, L.; Shi, L.; Lin, K.Q.; Huang, X.Q.; Chu, J.Y. Differences in mtDNA whole sequence between Tibetan and Han populations suggesting adaptive selection to high altitude. Gene 2012, 496, 37–44. [Google Scholar] [CrossRef] [PubMed]
  64. Yang, Y.X.; Xu, S.X.; Xu, J.X.; Guo, Y.; Yang, G. Adaptive evolution of mitochondrial energy metabolism genes associated with increased energy demand in flying insects. PLoS ONE 2014, 9, e99120. [Google Scholar] [CrossRef] [Green Version]
  65. Plazzi, F.; Puccio, G.; Passamonti, M. Burrowers from the past: Mitochondrial signatures of Ordovician bivalve infaunalization. Genome Biol. Evol. 2017, 9, 956–967. [Google Scholar] [CrossRef] [Green Version]
  66. Zhang, J.Z.; Nielsen, R.; Yang, Z.H. Evaluation of an improved branch-site likelihood method for detecting positive selection at the molecular level. Mol. Biol. Evol. 2005, 22, 2472–2479. [Google Scholar] [CrossRef] [Green Version]
  67. Luo, Y.J.; Gao, W.X.; Gao, Y.Q.; Tang, S.; Huang, Q.Y.; Tan, X.L.; Chen, J.; Huang, T.S. Mitochondrial genome analysis of Ochotona curzoniae and implication of cytochrome c oxidase in hypoxic adaptation. Mitochondrion 2008, 8, 352–357. [Google Scholar] [CrossRef]
  68. Mahalingam, S.; McClelland, G.B.; Scott, G.R. Evolved changes in the intracellular distribution and physiology of muscle mitochondria in high-altitude native deer mice. J. Physiol. 2017, 595, 4785–4801. [Google Scholar] [CrossRef]
  69. Chandel, N.S.; Maltepe, E.; Goldwasser, E.; Mathieu, C.E.; Simon, M.C.; Schumacker, P.T. Mitochondrial reactive oxygen species trigger hypoxia-induced transcription. Proc. Natl. Acad. Sci. USA 1998, 95, 11715–11720. [Google Scholar] [CrossRef] [Green Version]
  70. Dirmeier, R.; O’Brien, K.M.; Engle, M.; Dodd, A.; Spears, E.; Poyton, R.O. Exposure of yeast cells to anoxia induces transient oxidative stress-Implications for the induction of hypoxic genes. J. Biol. Chem. 2002, 277, 34773–34784. [Google Scholar] [CrossRef] [Green Version]
  71. Mu, W.D.; Liu, J.; Zhang, H.B. Complete mitochondrial genome of Benthodytes marianensis (Holothuroidea: Elasipodida: Psychropotidae): Insight into deep sea adaptation in the sea cucumber. PLoS ONE 2018, 13, e0208051. [Google Scholar] [CrossRef] [PubMed]
  72. Mu, W.D.; Liu, J.; Zhang, H.B. The first complete mitochondrial genome of the Mariana Trench Freyastera benthophila (Asteroidea: Brisingida: Brisingidae) allows insights into the deep-sea adaptive evolution of Brisingida. Ecol. Evol. 2018, 8, 10673–10686. [Google Scholar] [CrossRef] [PubMed] [Green Version]
Figure 1. Complete mitogenome map of E. crenata. 14 genes are encoded on the heavy (H) strand and 23 genes are encoded on the light (L) strand. Genes for proteins and rRNAs are represented with standard abbreviations. Genes for tRNAs are shown in a single letter for the corresponding amino acid, with two leucine tRNAs and two serine tRNAs distinguished by numerals.
Genes 13 01127 g001
Figure 2. Relative synonymous codon usage (RSCU) of E. crenata mitochondrial PCGs. Numbers to the left mean the RSCU values. Codon families are represented on the X axis.
Genes 13 01127 g002
Figure 3. Phylogenetic tree derived from Maximum likelihood (ML) analysis based on nucleotide sequences of 13 mitochondrial PCGs (atp6, atp8, cox1, cox2, cox3, cob, nad1, nad2, nad3, nad4, nad4l, nad5 and nad6). Species belonging to the same superfamily are marked with the same color. Numbers on branches represent ML bootstrap values.
Genes 13 01127 g003
Table 1. List of Brachyuran species with their GenBank accession numbers.
SuperfamilyFamilySpeciesSize (bp)Accession. no
BythograeoideaBythograeidaeAustinograea alayseae15,620NC_020314
CalappoideaMatutidaeAshtoret lunaris15,807NC_024435
DorippoideaOrithyiidaeOrithyia sinica15,568NC_039639
EriphioideaMenippidaeMyomenippe fornasinii15,658NC_024437
GoneplacoideaGoneplacidaeEucrate crenata15,597ON150678
LeucosioideaCalappidaeCalappa bilineata15,606NC_047195
LeucosiidaePyrhila pisum15,516NC_030047
MajoideaMajidaeMaja crispate16,592NC_035424
MithracidaeDamithrax spinosissimus15,817NC_025518
OregoniidaeOregonia gracilis15,737NC_057204
ParthenopoideaParthenopidaeDaldorfia horrida15,737NC_049029
PilumnoideaPilumnidaeEchinoecus nipponicus16,173NC_039618
PortunoideaGeryonidaeChaceon granulatus16,135NC_023476
OvalipidaeOvalipes punctatus16,084NC_042695
PortunidaeCallinectes sapidus16,263NC_006281
PotamoideaGecarcinucidaeEsanthelphusa dugasti19,437NC_060554
PotamidaeAparapotamon similium19,236NC_053821
XanthoideaCarpiliidaeCarpilius maculatus15,761NC_049030
EriphiidaePseudocarcinus gigas15,515NC_006891
OziidaeEpixanthus frontalis15,993NC_039110
XanthidaeAtergatis floridus16,180NC_037201
RaninoideaRaninidaeLyreidus brevifrons16,112NC_026721
GrapsoideaGecarcinidaeCardisoma armatum15,586NC_057477
GrapsidaeGrapsus albolineatus15,578NC_057301
SesarmidaeChiromantes eulimene15,894NC_047209
VarunidaeChasmagnathus convexus15,107NC_052834
OcypodoideaCamptandriidaeCleistostoma dilatatum15,444NC_060620
DotillidaeDotilla wichmanni15,600NC_038180
MacrophthalmidaeMacrophthalmus abbreviatus16,322NC_057472
MictyridaeMictyris longicarpus15,548NC_025325
OcypodidaeAustruca lactea15,659NC_042401
OutgroupAlpheidaeAlpheus distinguendus15,700NC_014883
Alpheus japonicus16,619NC_038116
Table 2. Mitogenome organization of E. crenata.
GeneStrandPositionLength (bp)Intergenic_spacerStart_codenStop_codenAnticodon
cox3R1–9696---
atp6R96–767672−1ATATAA
atp8R764–922159−4ATGTAG
trnD-gacR923–990680--GAC
trnK-aaaR991–1059690--AAA
cox2R1064–17356724ATATAA
trnL2-ttaR1754–18186518--UUA
cox1R1814–33521539−5ATGTAA
trnY-tacF3362–3427669--UAC
trnC-tgcF3428–3489620--UGC
trnW-tgaR3482–354968−8--UGA
nad2R3548–4537990−2ATATAG
trnM-atgR4556–46236818--AUG
trnQ-caaF4630–4698696--CAA
trnL1-ctaF5313–538068614--CUA
nad1F5409–634793928ATATAA
trnI-atcR6371–64366623--AUC
rrnSF6500–731881963--
trnV-gtaF7320–7392731--GUA
rrnLF7381–87781398−12--
trnS2-tcaR8733–880068−46--UCA
cobR>8801–993511350ATGT
nad6R9935–10,426492−1ATTTAA
trnP-ccaF10,444–10,5106717--CCA
trnT-acaR10,511–10,574640--ACA
nad4lF10,595–10,87928520ATGTAA
nad4F10,873–12,2071335−7ATGTAA
nad5F12,271–13,965169563ATATAA
trnF-ttcF13,972–14,039686--UUC
trnH-cacF14,046–14,109646--CAC
trnE-gaaR14,136–14,2036826--GAA
trnS1-agaR14,204–14,269660--AGA
trnN-aacR14,270–14,337680--AAC
trnR-cgaR14,344–14,409666--CGA
trnA-gcaR14,411–14,478681--GCA
nad3R14,482–14,8263453ATTTAA
trnG-ggaR14,836–14,903689--GGA
Table 3. CodeML analyses of selection pressure on mitochondrial genes in Eucrate crenata.
TreesModelslnLParameter EstimatesModel Compared2ΔLLRT
p-Value
Branch models
ML treeM0−211,767.521149ω = 0.04109
Two-ratio−211,744.724139ω0 = 0.04084
ω1 = 999.00000
Two-ratio vs. M045.59402000001860
Free-tatio−210,762.85387 Free-ratio vs. M02009.334558000030
Branch-sits models
ML treeNull model−207,044.061032p0 = 0.76754;
p1 = 0.09376;
p2a = 0.12361;
p2b = 0.01510
ω0 = 0.03453;
ω1 = 1.00000;
ω2a = 1.00000;
ω2b = 1.00000
Model A−207,042.434633p0 = 0.87845;
p1 = 0.10727;
p2a = 0.01272;
p2b = 0.00155
Model A vs. null model3.252798000001340.071301646
ω0 = 0.03452;
ω1 = 1.00000;
ω2a = 20.67481;
ω2b = 20.67481
Table 4. Possible sites under positive selection in Eucrate crenata.
ML Tree
GeneCodonAmino AcidBEB Values
atp6607L0.884
cox11389V0.984 *
cox11459S0.888
cox11469T0.887
cox11828V0.876
cox11961L0.829
cox12015A0.876
cox12021T0.512
cox12033S0.826
cox22344M0.86
cox22411S0.769
cox22611A0.863
cox22955S0.908
cox33274L0.632
cox33308F0.886
cox33469V0.569
cox33475L0.535
cox33511L0.534
cox33515S0.841
cox33605S0.53
* 0.95 < BEB < 0.99.
Publisher’s Note: MDPI stays neutral with regard to jurisdictional claims in published maps and institutional affiliations.

