
Genome-Wide RNA Sequencing Analysis in Human Dermal Fibroblasts Exposed to Low-Dose Ultraviolet A Radiation


Abstract
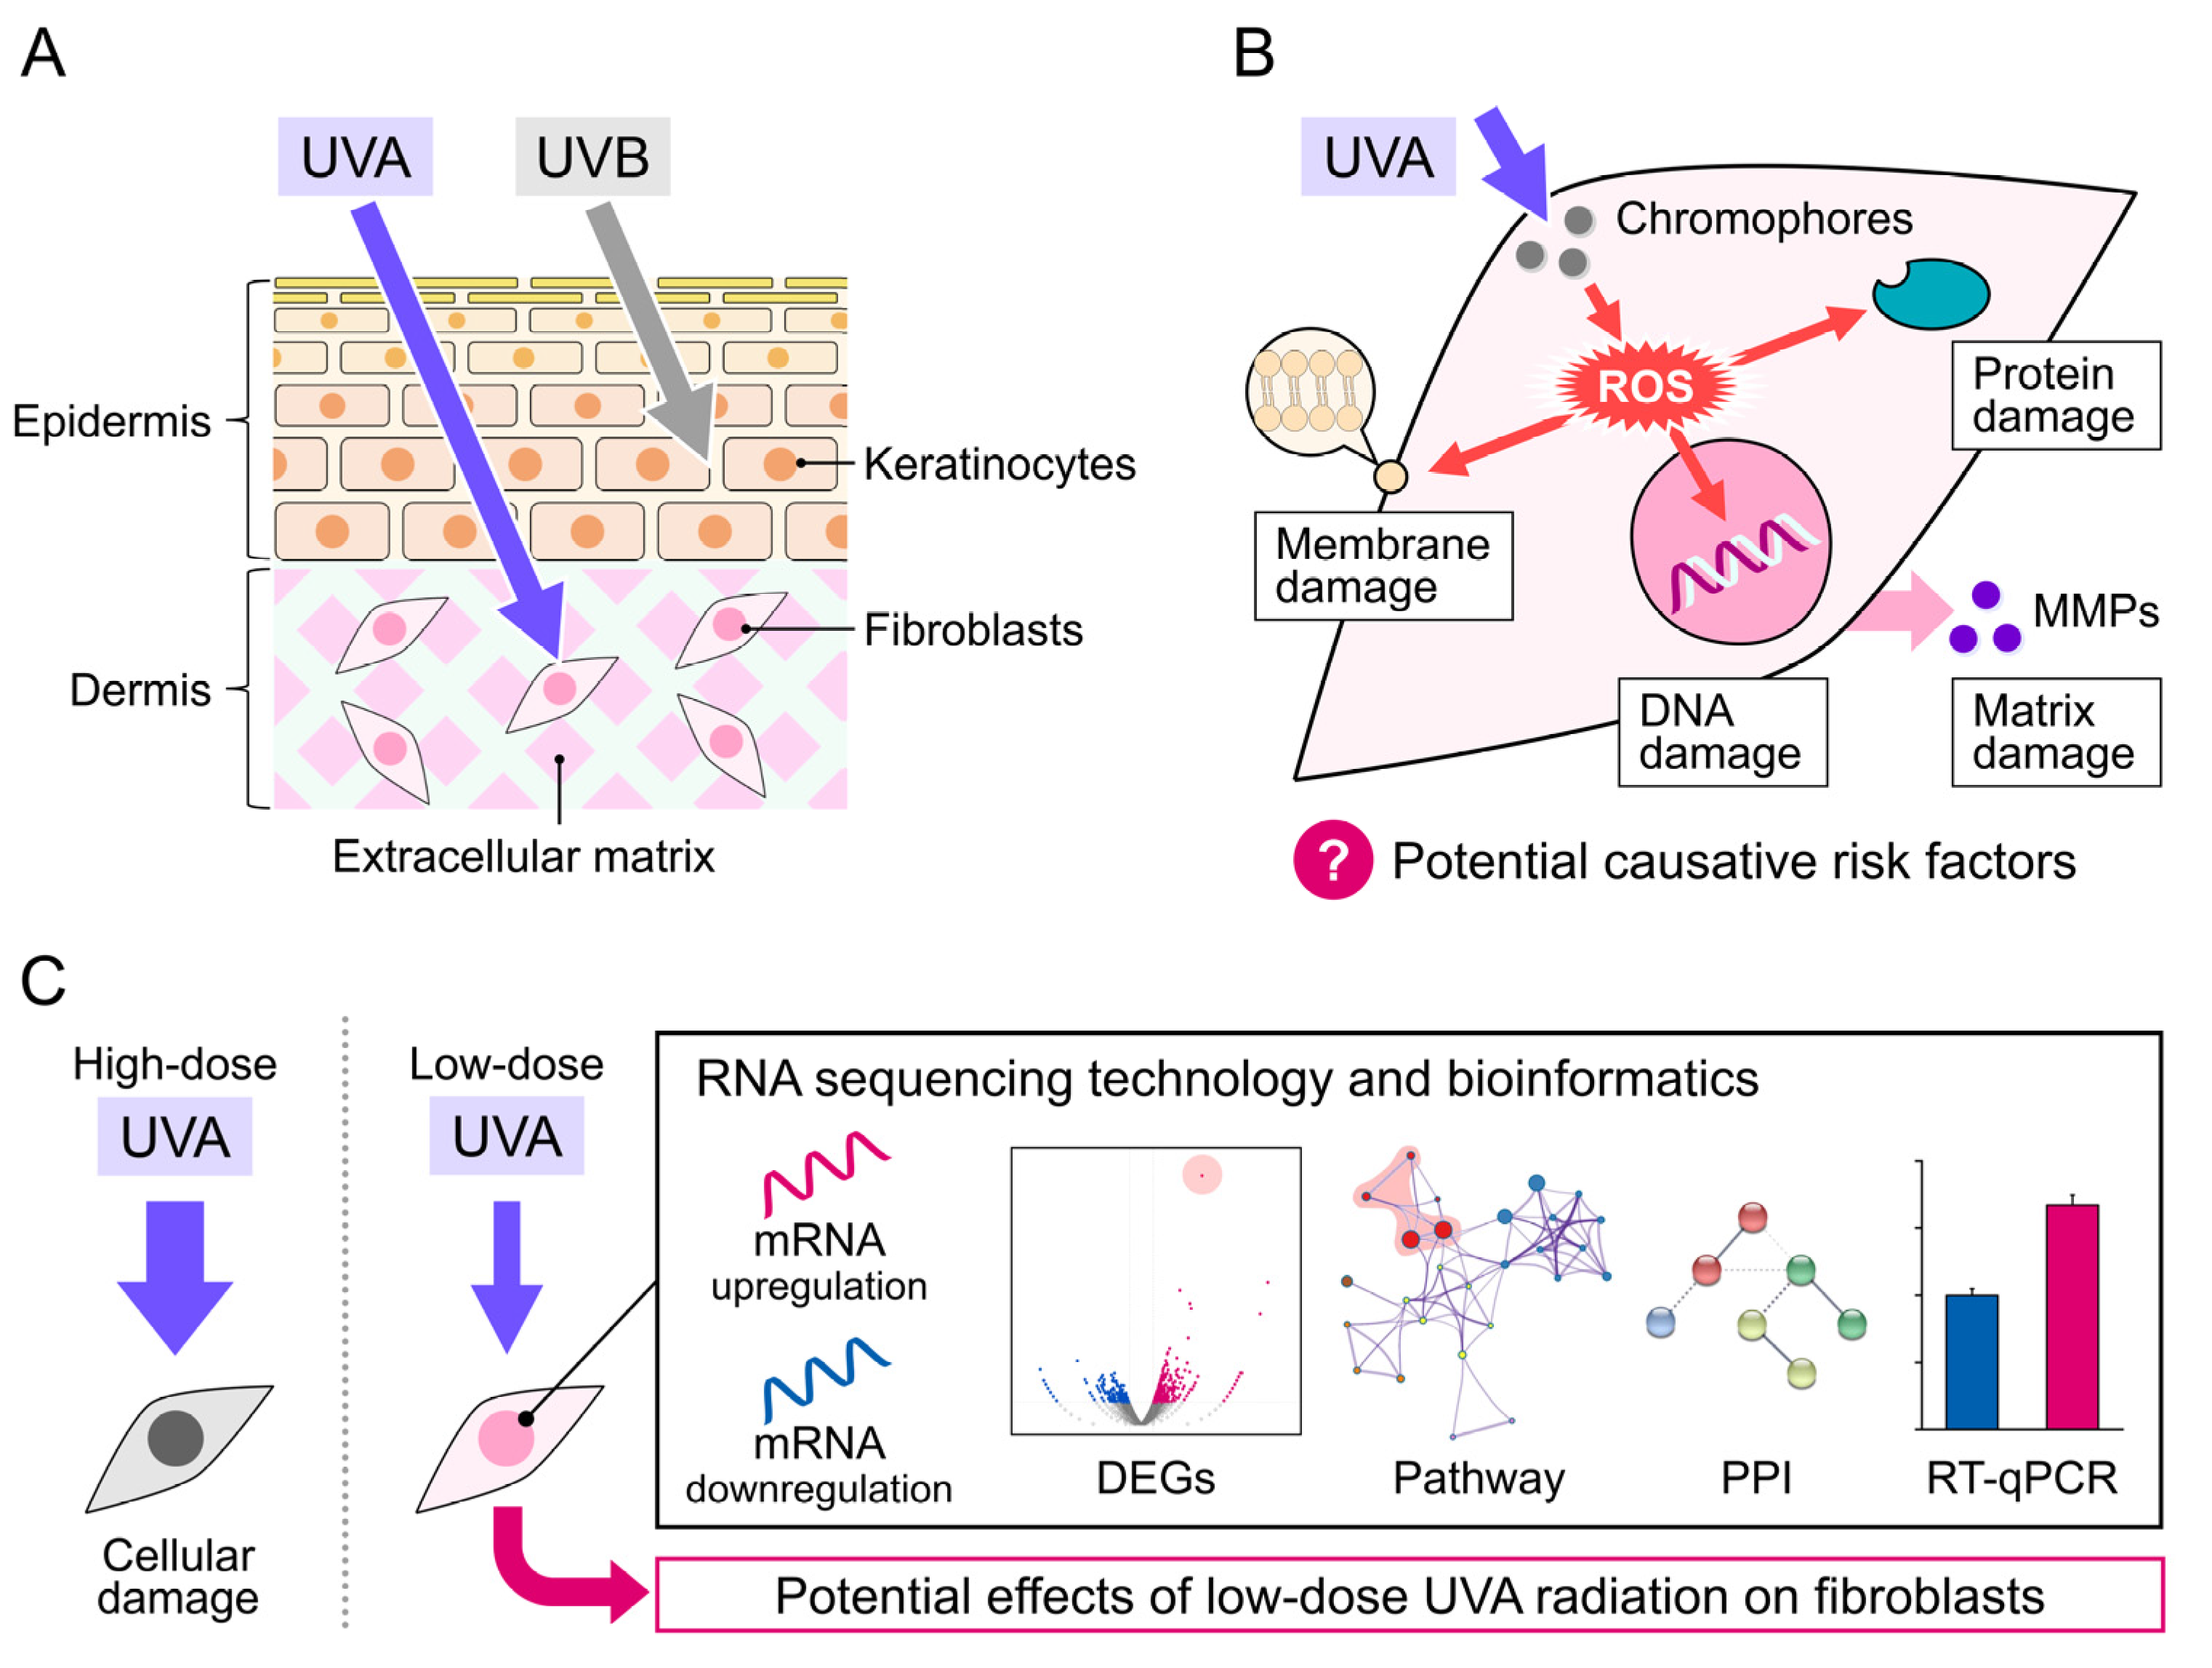
:1. Introduction
2. Materials and Methods
2.1. Cell Culture and UVA Irradiation
2.2. Cell Survival Assay
2.3. RNA Extraction and Sequencing
2.4. Bioinformatic Analysis
2.5. Reverse Transcription and RT-qPCR
2.6. Statistical Analysis
3. Results
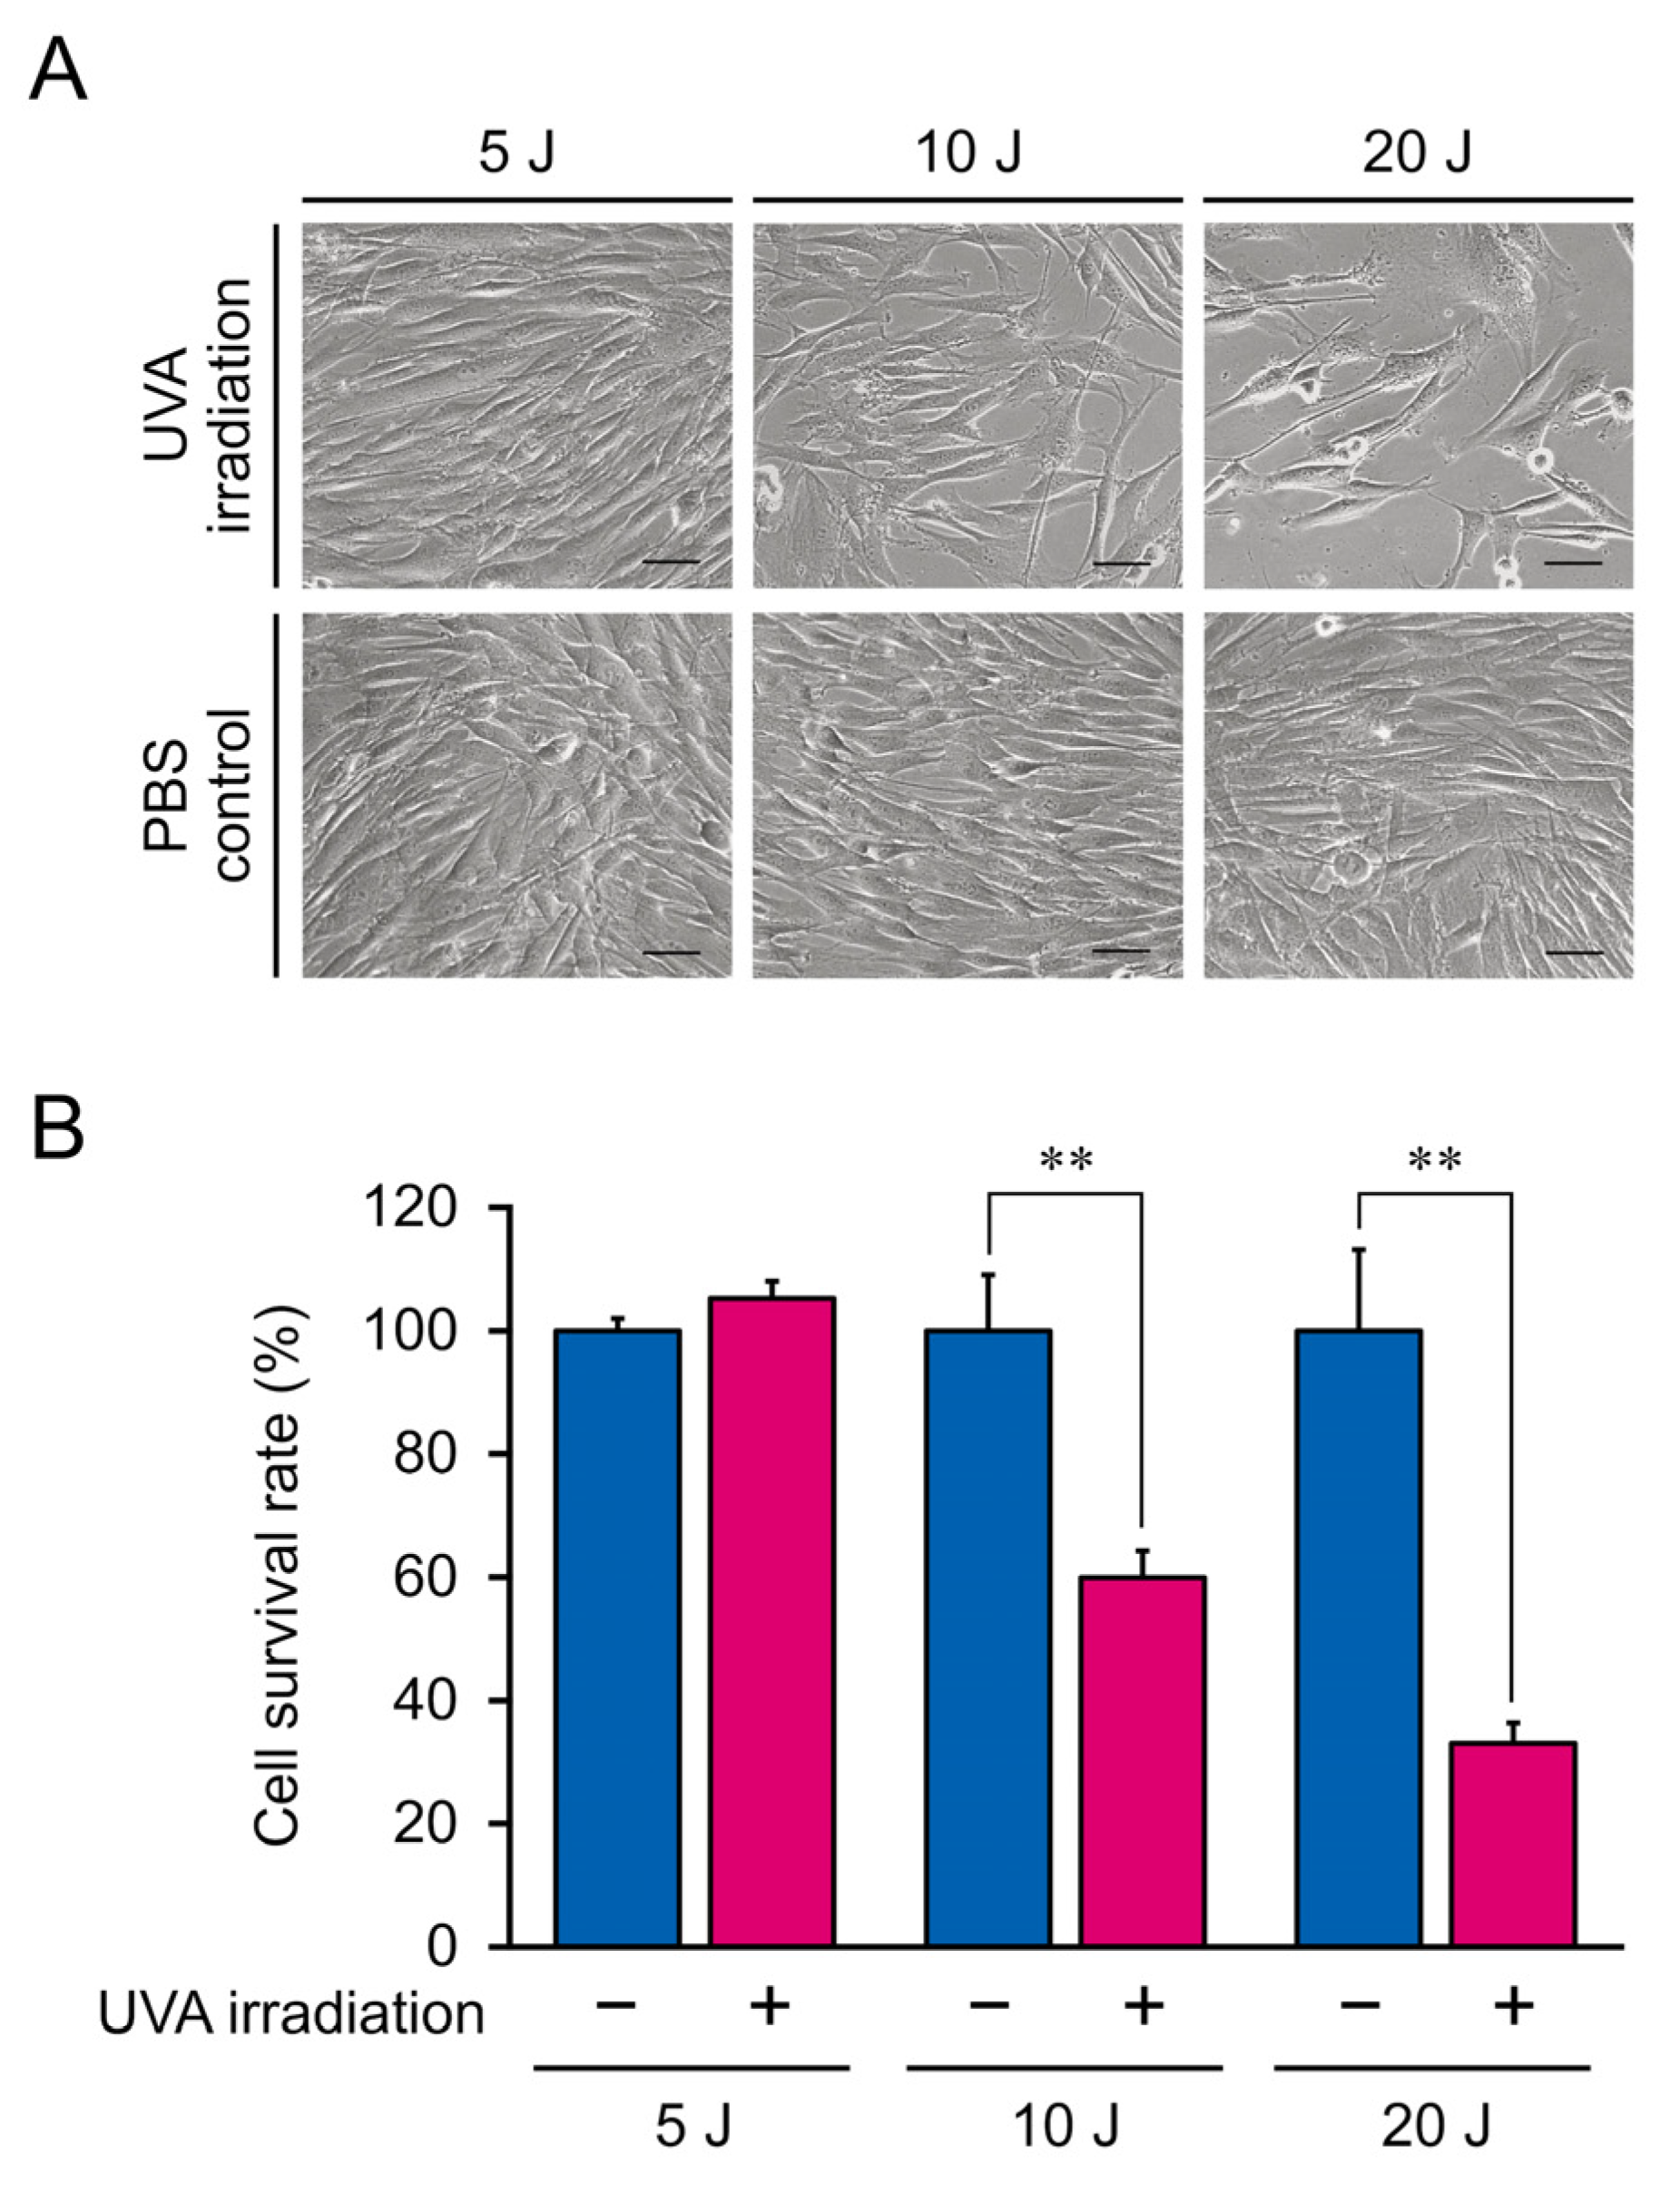
3.1. Morphology and Proliferation Rate of NB1RGB Fibroblasts Irradiated with UVA
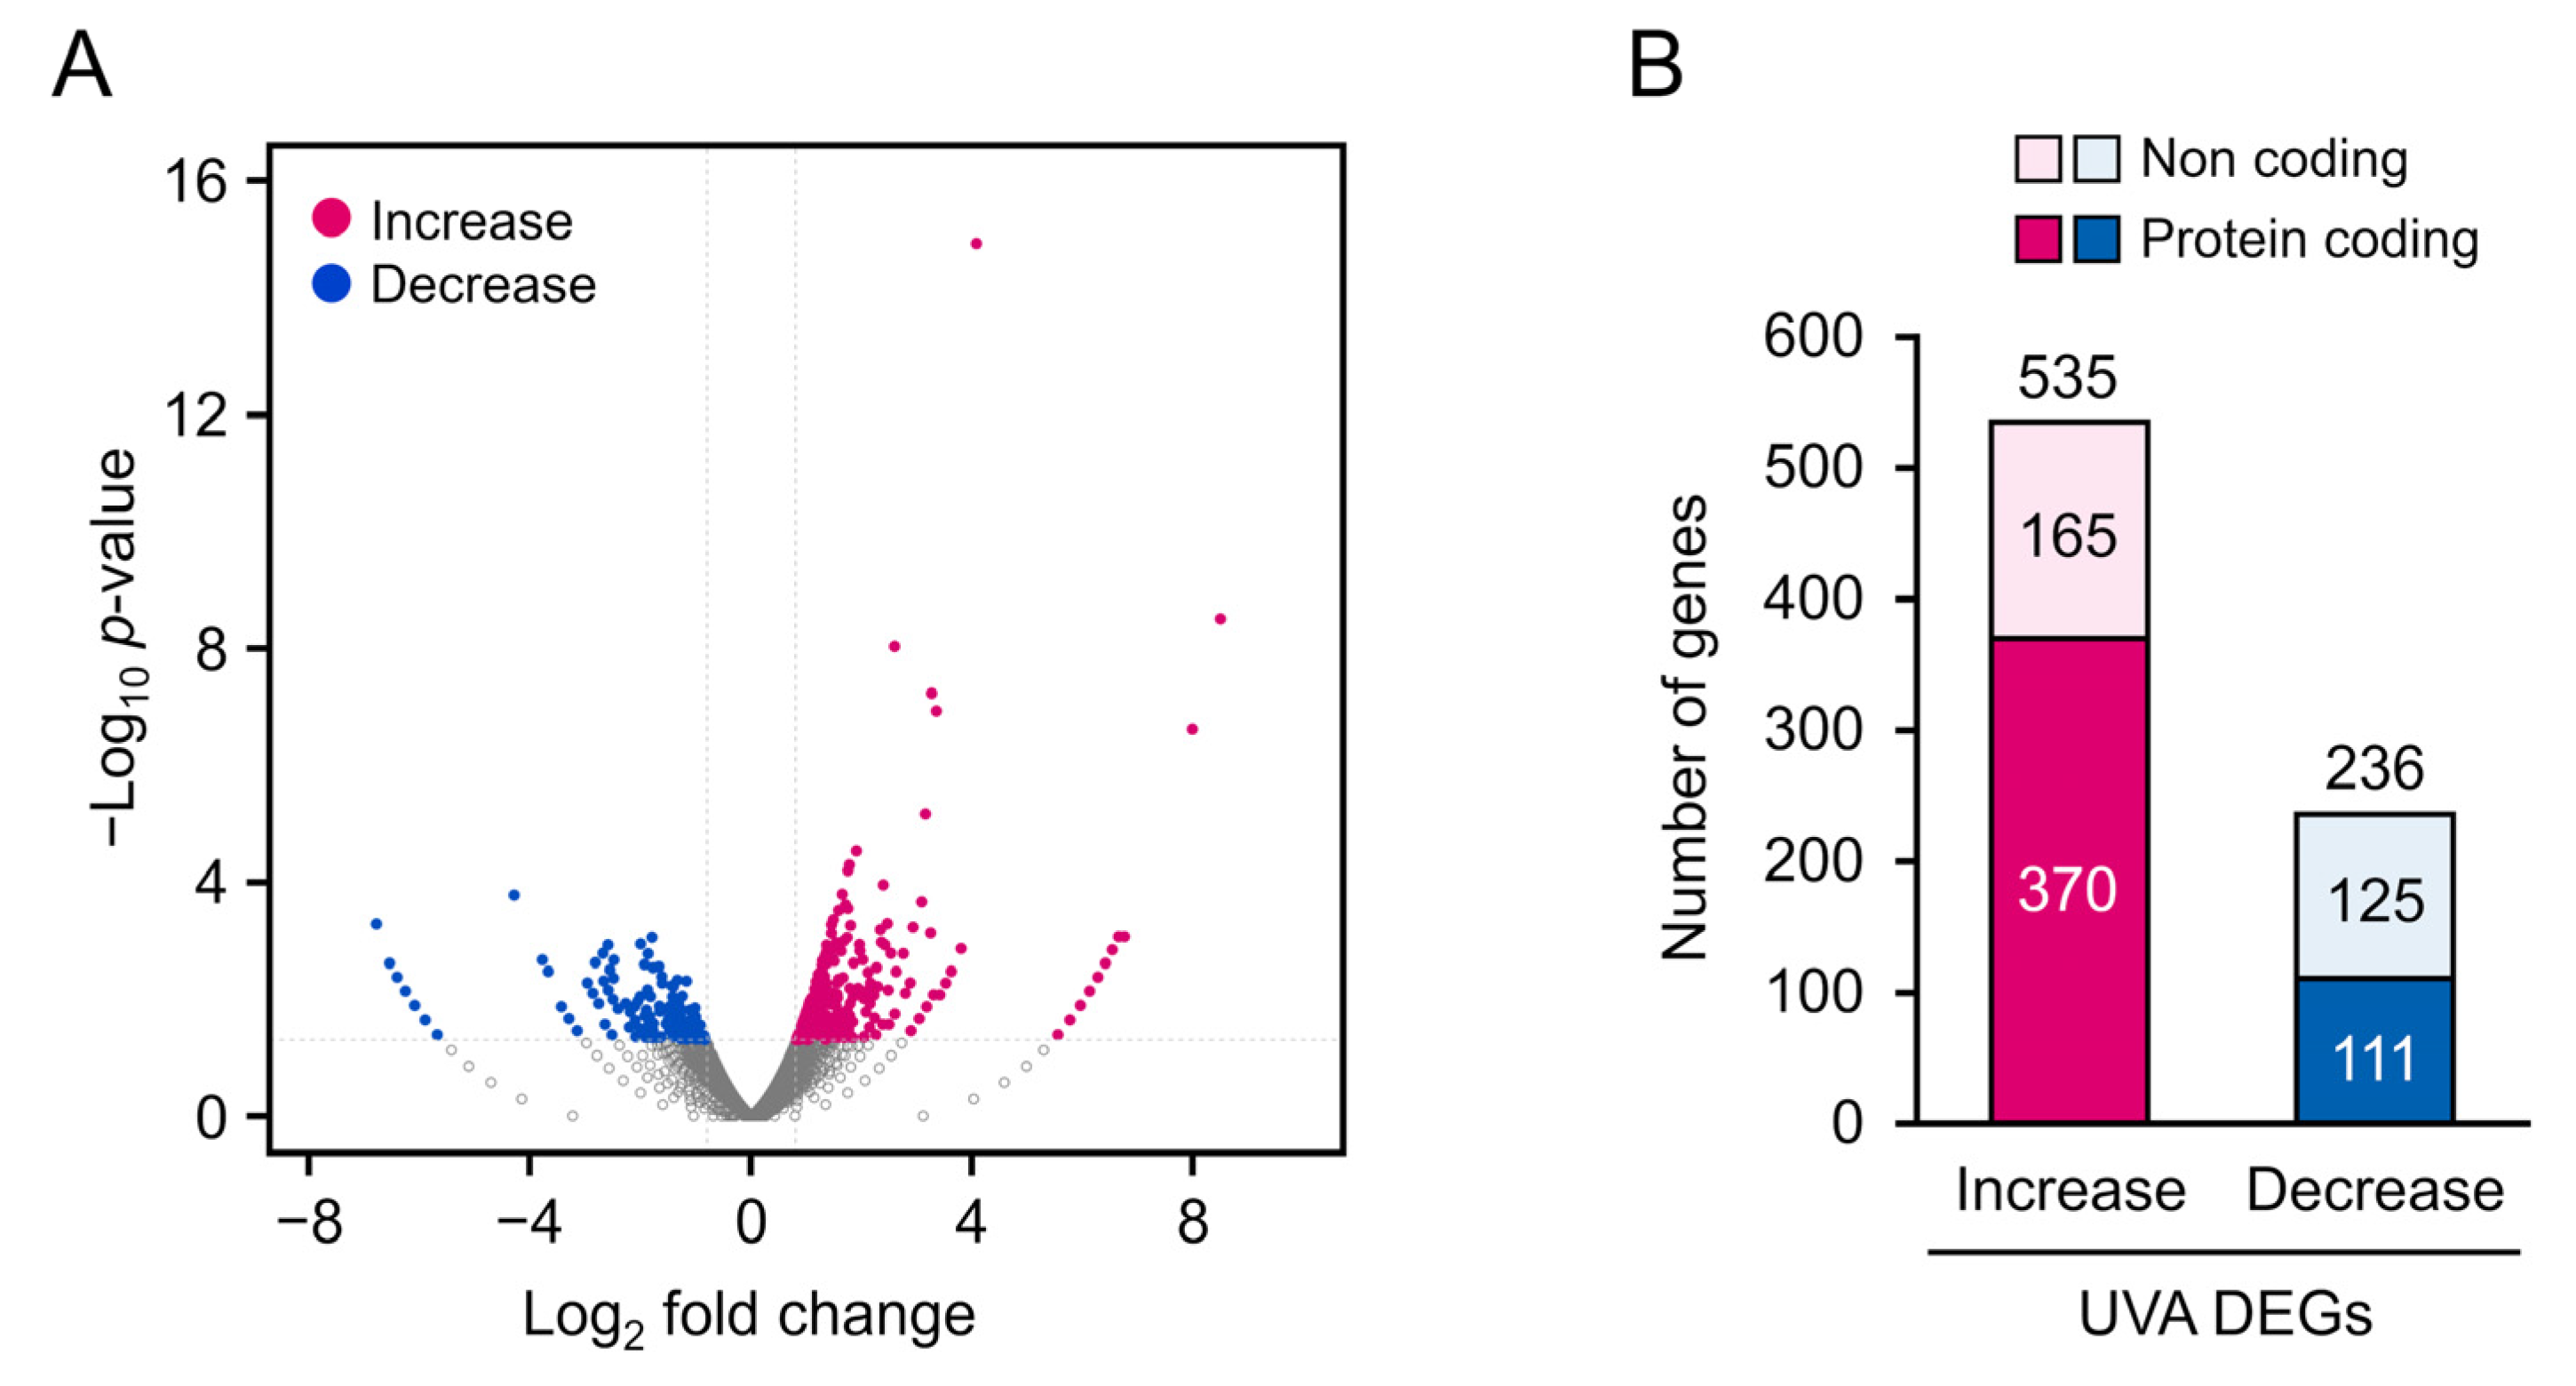
3.2. RNA-seq Analysis of DEGs
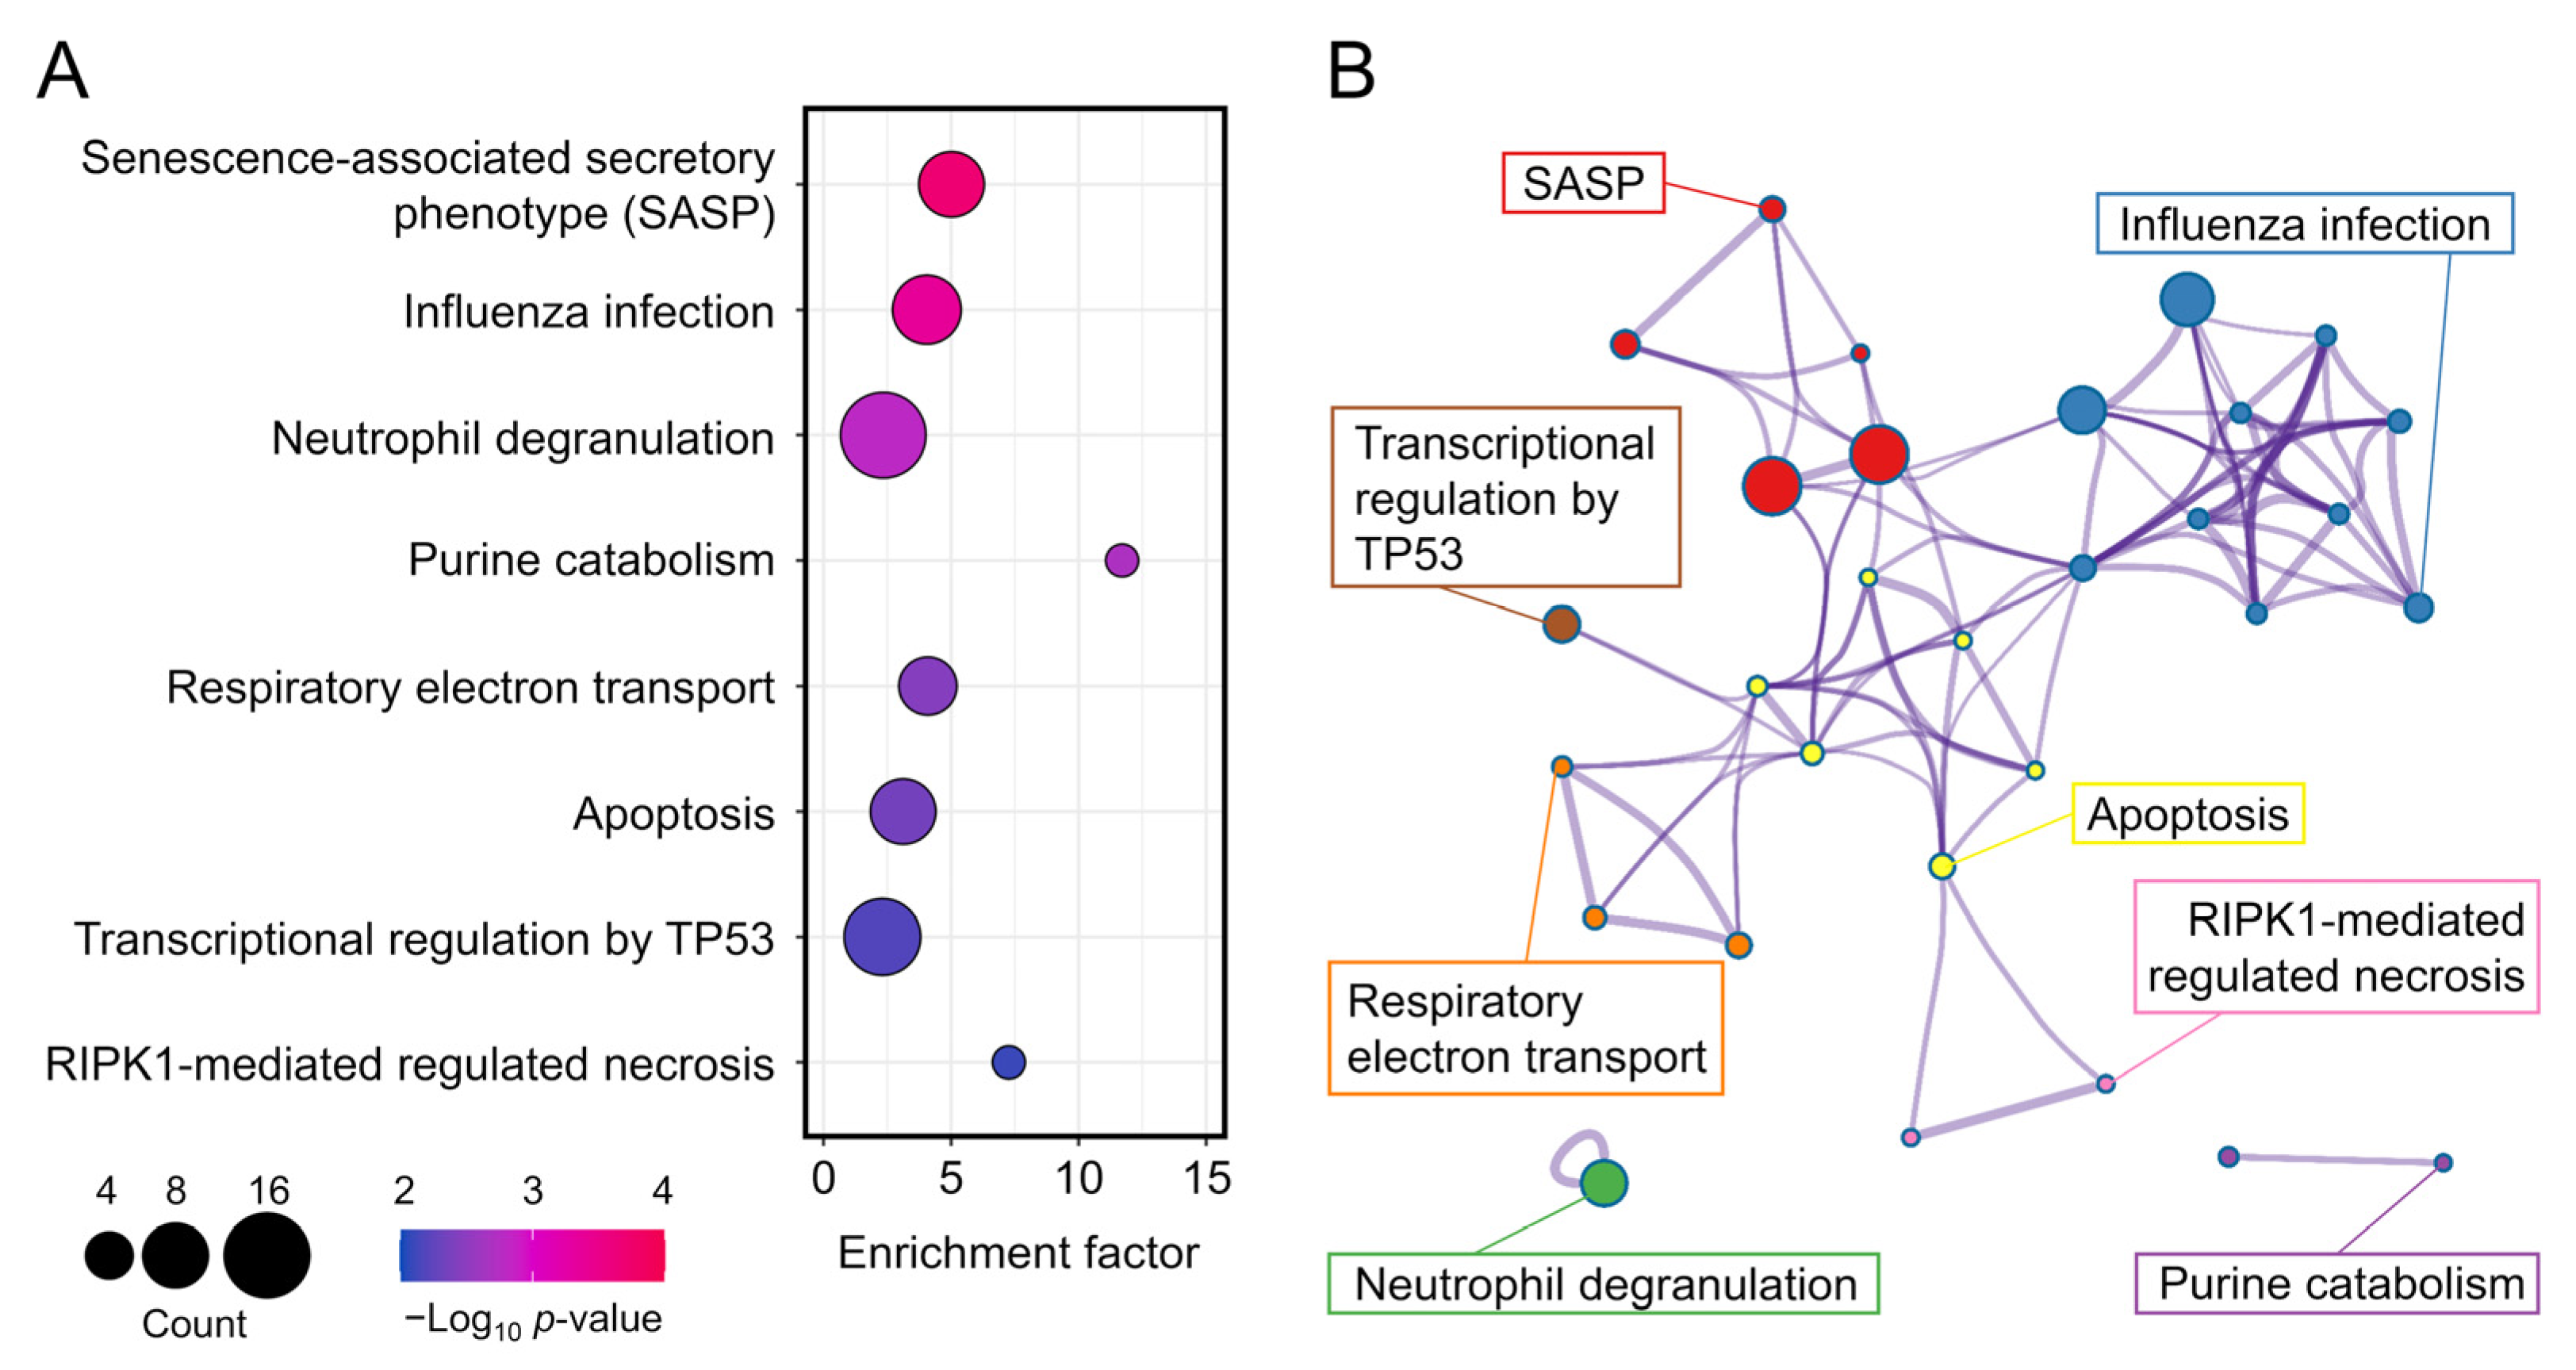
3.3. GO Enrichment and Reactome Pathway Analysis
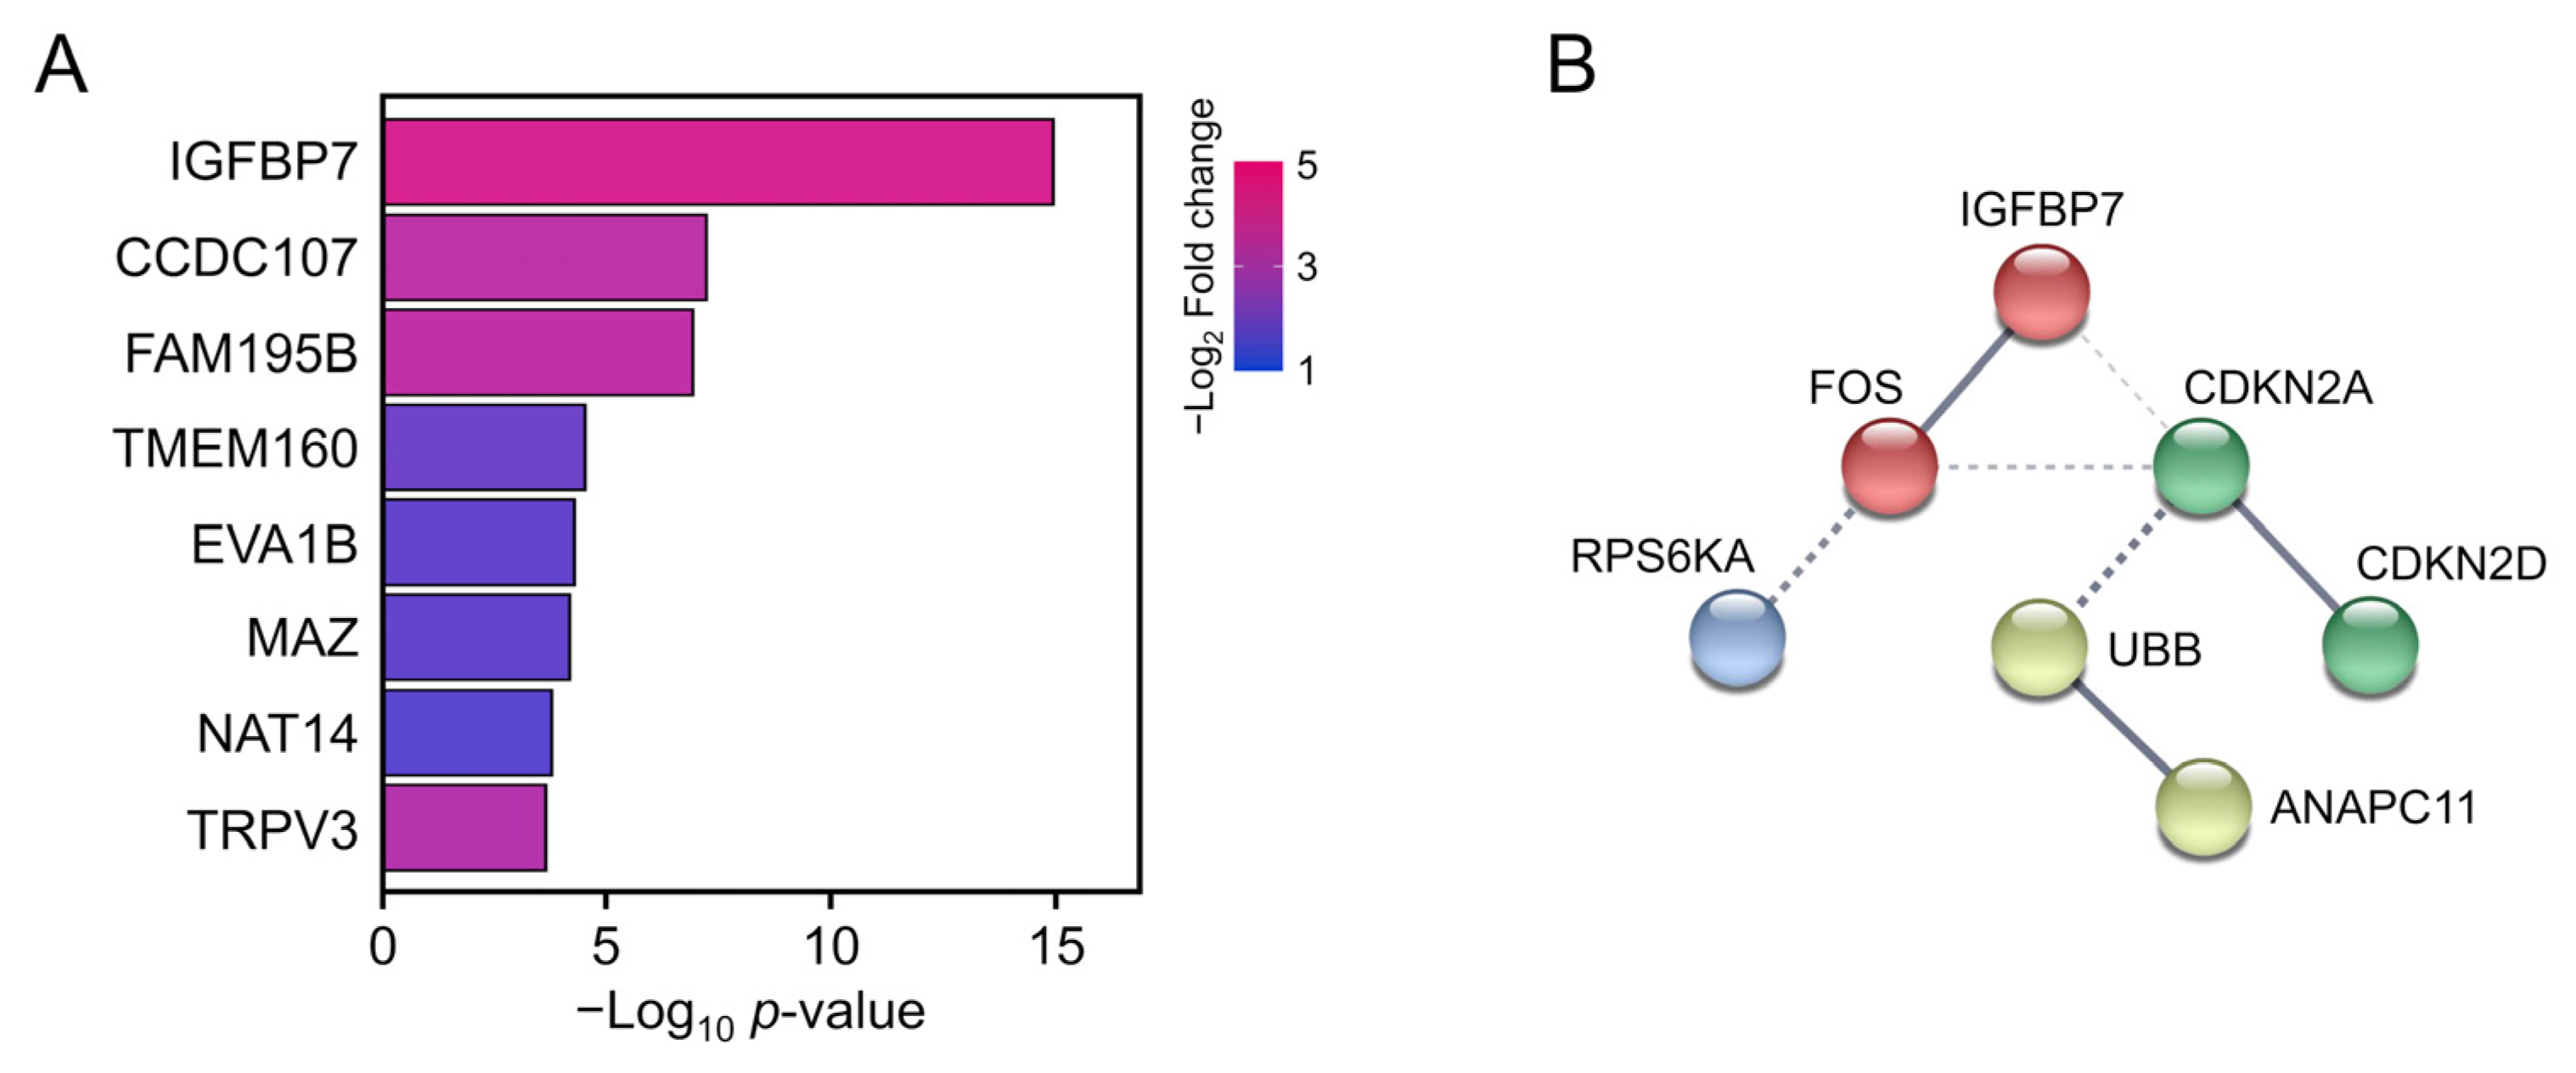
3.4. PPI Analysis of SASP-Related Genes
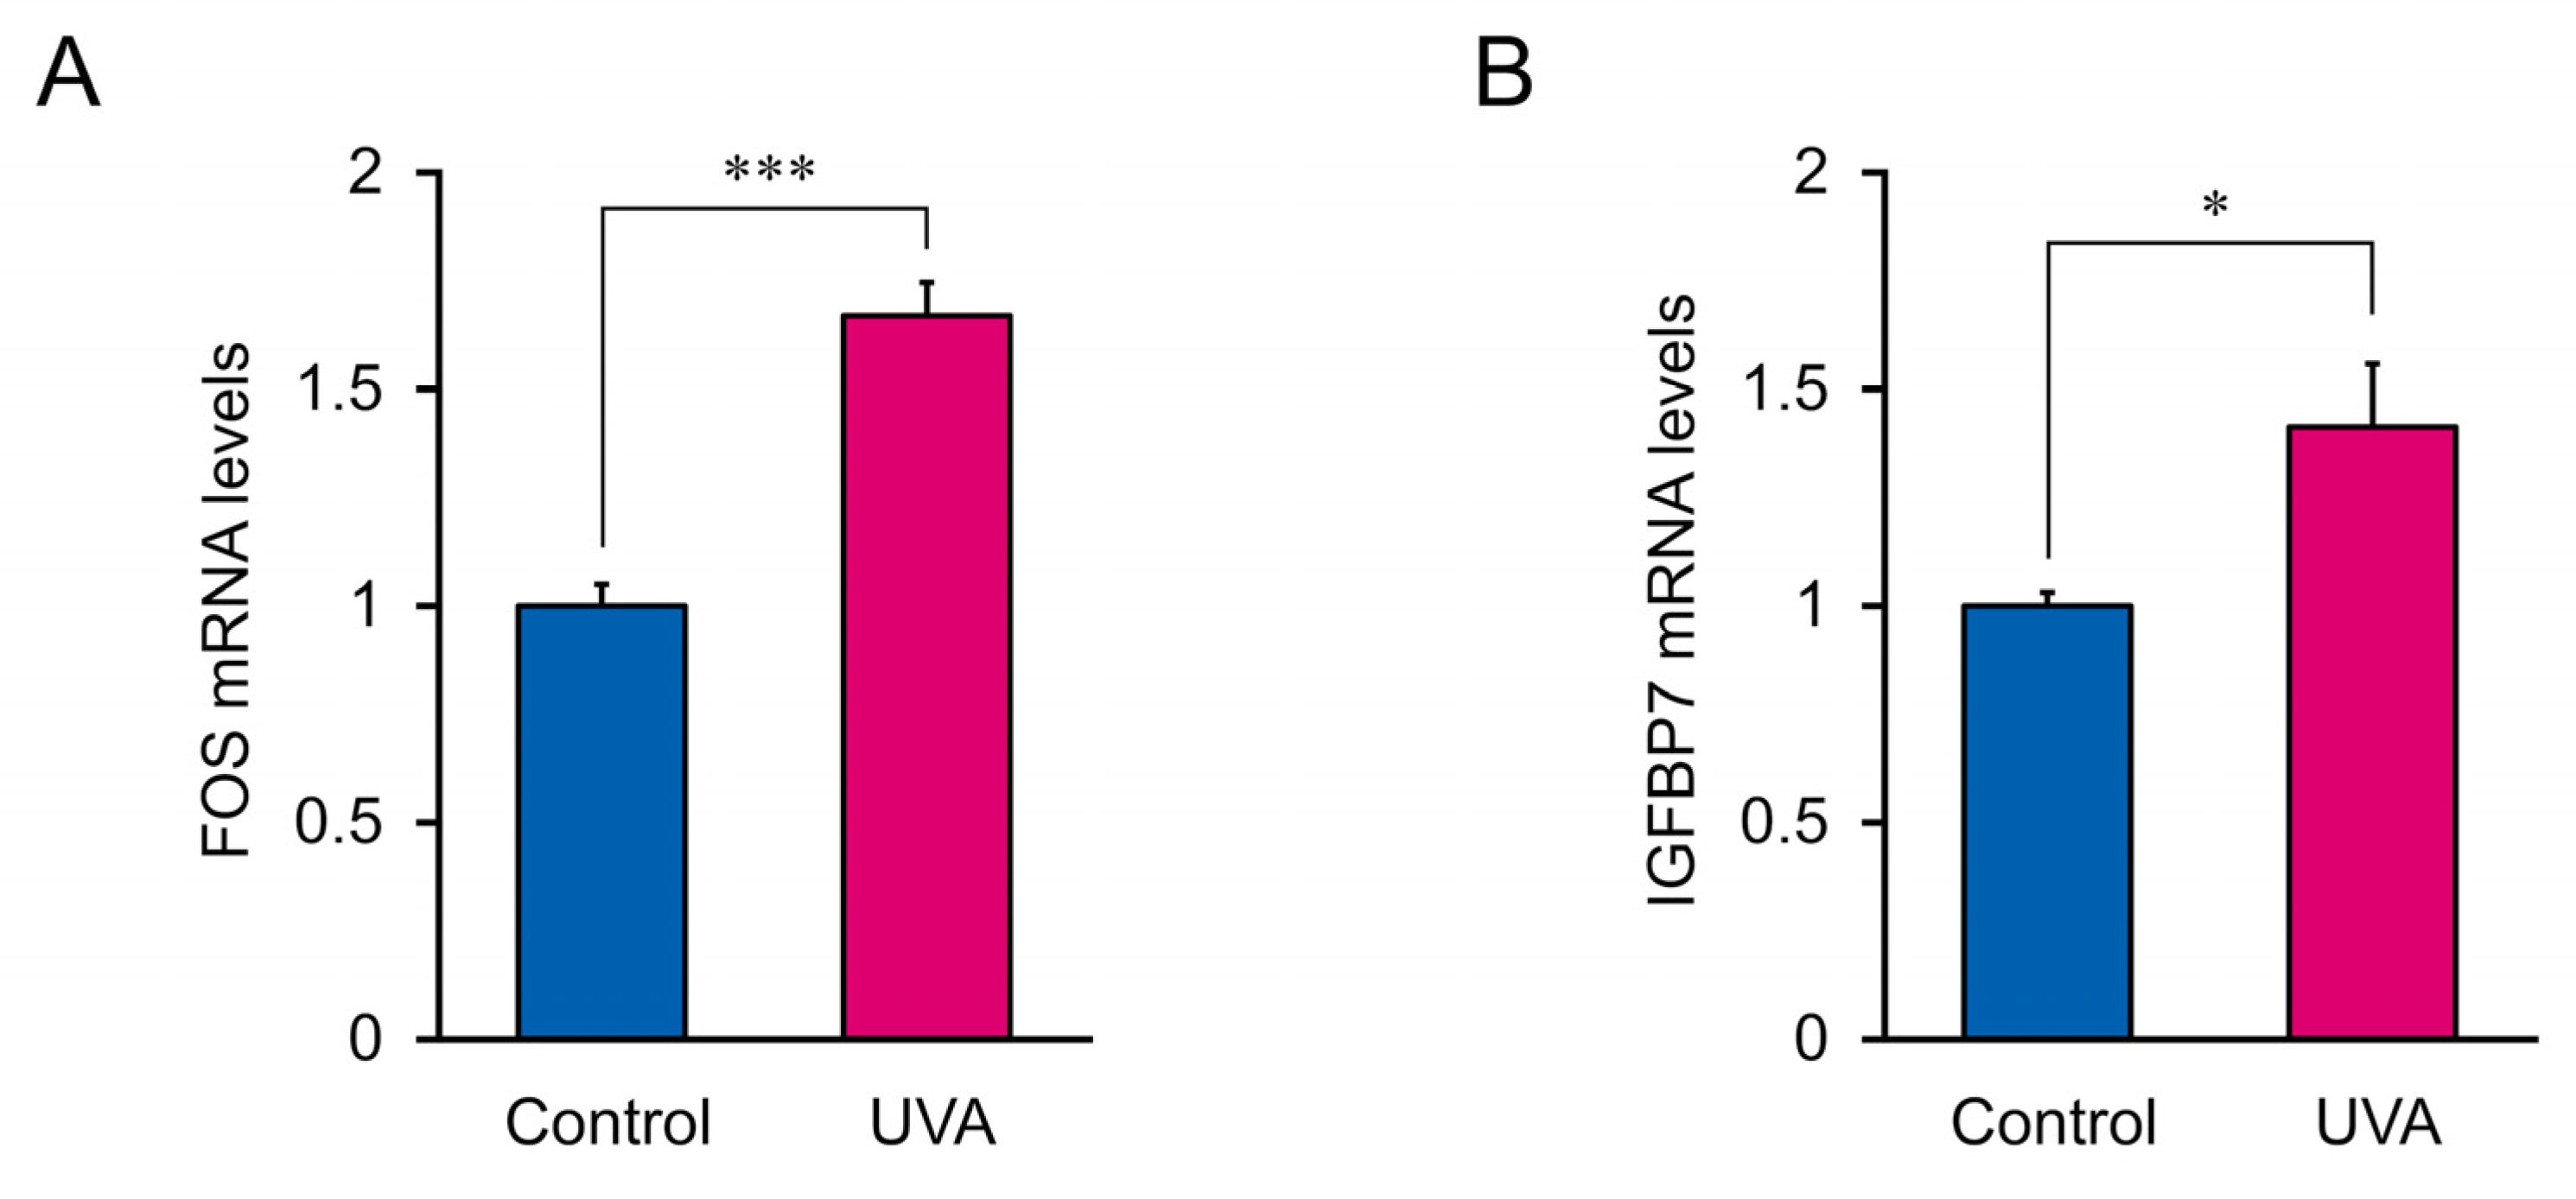
3.5. Biomarker Validation
4. Discussion
5. Conclusions
Author Contributions
Funding
Institutional Review Board Statement
Informed Consent Statement
Data Availability Statement
Acknowledgments
Conflicts of Interest
References
- Sliney, D.H. Radiometric quantities and units used in photobiology and photochemistry: Recommendations of the Commission Internationale de L’Eclairage (International Commission on Illumination). Photochem. Photobiol. 2007, 83, 425–432. [Google Scholar] [CrossRef] [PubMed] [Green Version]
- Schmalwieser, A.W.; Klotz, B.; Schwarzmann, M.; Baumgartner, D.J.; Schreder, J.; Schauberger, G.; Blumthaler, M. The Austrian UVA-Network. Photochem. Photobiol. 2019, 95, 1258–1266. [Google Scholar] [CrossRef] [PubMed]
- D’Orazio, J.; Jarrett, S.; Amaro-Ortiz, A.; Scott, T. UV radiation and the skin. Int. J. Mol. Sci. 2013, 14, 12222–12248. [Google Scholar] [CrossRef] [PubMed] [Green Version]
- Stunova, A.; Vistejnova, L. Dermal fibroblasts-A heterogeneous population with regulatory function in wound healing. Cytokine Growth Factor Rev. 2018, 39, 137–150. [Google Scholar] [CrossRef] [PubMed]
- D’Angelo, S.; Ingrosso, D.; Perfetto, B.; Baroni, A.; Zappia, M.; Lobianco, L.L.; Tufano, M.A.; Galletti, P. UVA irradiation induces L-isoaspartyl formation in melanoma cell proteins. Free Radic. Biol. Med. 2001, 31, 1–9. [Google Scholar] [CrossRef]
- Battie, C.; Jitsukawa, S.; Bernerd, F.; Del Bino, S.; Marionnet, C.; Verschoore, M. New insights in photoaging, UVA induced damage and skin types. Exp. Derm. 2014, 23 (Suppl. 1), 7–12. [Google Scholar] [CrossRef]
- Dissanayake, N.S.; Greenoak, G.E.; Mason, R.S. Effects of ultraviolet irradiation on human skin-derived epidermal cells in vitro. J. Cell. Physiol. 1993, 157, 119–127. [Google Scholar] [CrossRef]
- Shorrocks, J.; Paul, N.D.; McMillan, T.J. The Dose Rate of UVA Treatment Influences the Cellular Response of HaCaT Keratinocytes. J. Investig. Derm. 2008, 128, 685–693. [Google Scholar] [CrossRef]
- Welti, M.; Ramelyte, E.; Dummer, R.; Imhof, L. Evaluation of the minimal erythema dose for UVB and UVA in context of skin phototype and nature of photodermatosis. Photodermatol. Photoimmunol. Photomed. 2020, 36, 200–207. [Google Scholar] [CrossRef]
- Halliday, G.M.; Rana, S. Waveband and dose dependency of sunlight-induced immunomodulation and cellular changes. Photochem. Photobiol. 2008, 84, 35–46. [Google Scholar] [CrossRef]
- Brem, R.; Guven, M.; Karran, P. Oxidatively-generated damage to DNA and proteins mediated by photosensitized UVA. Free Radic. Biol. Med. 2017, 107, 101–109. [Google Scholar] [CrossRef] [PubMed] [Green Version]
- Traynor, N.J.; Beattie, P.E.; Ibbotson, S.H.; Moseley, H.; Ferguson, J.; Woods, J.A. Photogenotoxicity of hypericin in HaCaT keratinocytes: Implications for St. John’s Wort supplements and high dose UVA-1 therapy. Toxicol. Lett. 2005, 158, 220–224. [Google Scholar] [CrossRef] [PubMed]
- Robinson, K.S.; Traynor, N.J.; Moseley, H.; Ferguson, J.; Woods, J.A. Cyclobutane pyrimidine dimers are photosensitised by carprofen plus UVA in human HaCaT cells. Toxicol. Vitr. 2010, 24, 1126–1132. [Google Scholar] [CrossRef] [PubMed]
- Yin, J.J.; Liu, J.; Ehrenshaft, M.; Roberts, J.E.; Fu, P.P.; Mason, R.P.; Zhao, B. Phototoxicity of nano titanium dioxides in HaCaT keratinocytes--generation of reactive oxygen species and cell damage. Toxicol. Appl. Pharm. 2012, 263, 81–88. [Google Scholar] [CrossRef] [Green Version]
- Ou-Yang, H.; Stamatas, G.; Saliou, C.; Kollias, N. A chemiluminescence study of UVA-induced oxidative stress in human skin in vivo. J. Investig. Derm. 2004, 122, 1020–1029. [Google Scholar] [CrossRef] [Green Version]
- Meloni, M.; Farina, A.; de Servi, B. Molecular modifications of dermal and epidermal biomarkers following UVA exposures on reconstructed full-thickness human skin. Photochem. Photobiol. Sci. 2010, 9, 439–447. [Google Scholar] [CrossRef]
- Bose, B.; Soriani, M.; Tyrrell, R.M. Activation of expression of the c-fos oncogene by UVA irradiation in cultured human skin fibroblasts. Photochem. Photobiol. 1999, 69, 489–493. [Google Scholar] [CrossRef]
- Soriani, M.; Hejmadi, V.; Tyrrell, R.M. Modulation of c-jun and c-fos transcription by UVB and UVA radiations in human dermal fibroblasts and KB cells. Photochem. Photobiol. 2000, 71, 551–558. [Google Scholar] [CrossRef]
- Lan, C.-C.E.; Hung, Y.-T.; Fang, A.-H.; Ching-Shuang, W. Effects of irradiance on UVA-induced skin aging. J. Derm. Sci. 2019, 94, 220–228. [Google Scholar] [CrossRef] [Green Version]
- Kandan, P.V.; Balupillai, A.; Kanimozhi, G.; Khan, H.A.; Alhomida, A.S.; Prasad, N.R. Opuntiol Prevents Photoaging of Mouse Skin Blocking Inflammatory Responses and Collagen Degradation. Oxidative Med. Cell. Longev. 2020, 2020, 5275178. [Google Scholar] [CrossRef]
- Hong, M.; Tao, S.; Zhang, L.; Diao, L.T.; Huang, X.; Huang, S.; Xie, S.J.; Xiao, Z.D.; Zhang, H. RNA sequencing: New technologies and applications in cancer research. J. Hematol. Oncol. 2020, 13, 166. [Google Scholar] [CrossRef] [PubMed]
- Stark, R.; Grzelak, M.; Hadfield, J. RNA sequencing: The teenage years. Nat. Rev. Genet. 2019, 20, 631–656. [Google Scholar] [CrossRef] [PubMed]
- Livak, K.J.; Schmittgen, T.D. Analysis of relative gene expression data using real-time quantitative PCR and the 2(-Delta Delta C(T)) Method. Methods 2001, 25, 402–408. [Google Scholar] [CrossRef] [PubMed]
- Gilchrest, B.A. Photoaging. J. Investig. Derm. 2013, 133, E2–E6. [Google Scholar] [CrossRef] [Green Version]
- Kammeyer, A.; Luiten, R.M. Oxidation events and skin aging. Ageing Resh. Rev. 2015, 21, 16–29. [Google Scholar] [CrossRef]
- Wajapeyee, N.; Serra, R.W.; Zhu, X.; Mahalingam, M.; Green, M.R. Oncogenic BRAF induces senescence and apoptosis through pathways mediated by the secreted protein IGFBP7. Cell 2008, 132, 363–374. [Google Scholar] [CrossRef] [Green Version]
- Kerscher, M.; Volkenandt, M.; Gruss, C.; Reuther, T.; von Kobyletzki, G.; Freitag, M.; Dirschka, T.; Altmeyer, P. Low-dose UVA phototherapy for treatment of localized scleroderma. J. Am. Acad. Derm. 1998, 38, 21–26. [Google Scholar] [CrossRef]
- Phillipson, R.P.; Tobi, S.E.; Morris, J.A.; McMillan, T.J. UV-A induces persistent genomic instability in human keratinocytes through an oxidative stress mechanism. Free Radic. Biol. Med. 2002, 32, 474–480. [Google Scholar] [CrossRef]
- Pillai, S.; Oresajo, C.; Hayward, J. Ultraviolet radiation and skin aging: Roles of reactive oxygen species, inflammation and protease activation, and strategies for prevention of inflammation-induced matrix degradation–a review. Int. J. Cosmet. Sci. 2005, 27, 17–34. [Google Scholar] [CrossRef]
- Guidot, D.M.; McCord, J.M.; Wright, R.M.; Repine, J.E. Absence of electron transport (Rho 0 state) restores growth of a manganese-superoxide dismutase-deficient Saccharomyces cerevisiae in hyperoxia. Evidence for electron transport as a major source of superoxide generation in vivo. J. Biol. Chem. 1993, 268, 26699–26703. [Google Scholar] [CrossRef]
- Johmura, Y.; Nakanishi, M. Multiple facets of p53 in senescence induction and maintenance. Cancer Sci. 2016, 107, 1550–1555. [Google Scholar] [CrossRef] [PubMed] [Green Version]
- Beauséjour, C.M.; Krtolica, A.; Galimi, F.; Narita, M.; Lowe, S.W.; Yaswen, P.; Campisi, J. Reversal of human cellular senescence: Roles of the p53 and p16 pathways. EMBO J. 2003, 22, 4212–4222. [Google Scholar] [CrossRef] [PubMed]
- Narita, M.; Narita, M.; Krizhanovsky, V.; Nuñez, S.; Chicas, A.; Hearn, S.A.; Myers, M.P.; Lowe, S.W. A novel role for high-mobility group a proteins in cellular senescence and heterochromatin formation. Cell 2006, 126, 503–514. [Google Scholar] [CrossRef] [PubMed] [Green Version]
- He, Y.-Y.; Council, S.E.; Feng, L.; Chignell, C.F. UVA-induced cell cycle progression is mediated by a disintegrin and metalloprotease/epidermal growth factor receptor/AKT/Cyclin D1 pathways in keratinocytes. Cancer Res. 2008, 68, 3752–3758. [Google Scholar] [CrossRef] [Green Version]
- Acosta, J.C.; Banito, A.; Wuestefeld, T.; Georgilis, A.; Janich, P.; Morton, J.P.; Athineos, D.; Kang, T.W.; Lasitschka, F.; Andrulis, M.; et al. A complex secretory program orchestrated by the inflammasome controls paracrine senescence. Nat. Cell Biol. 2013, 15, 978–990. [Google Scholar] [CrossRef]
- Ritschka, B.; Storer, M.; Mas, A.; Heinzmann, F.; Ortells, M.C.; Morton, J.P.; Sansom, O.J.; Zender, L.; Keyes, W.M. The senescence-associated secretory phenotype induces cellular plasticity and tissue regeneration. Genes Dev. 2017, 31, 172–183. [Google Scholar] [CrossRef] [Green Version]
- Kuilman, T.; Michaloglou, C.; Vredeveld, L.C.; Douma, S.; van Doorn, R.; Desmet, C.J.; Aarden, L.A.; Mooi, W.J.; Peeper, D.S. Oncogene-induced senescence relayed by an interleukin-dependent inflammatory network. Cell 2008, 133, 1019–1031. [Google Scholar] [CrossRef] [Green Version]
- Orjalo, A.V.; Bhaumik, D.; Gengler, B.K.; Scott, G.K.; Campisi, J. Cell surface-bound IL-1alpha is an upstream regulator of the senescence-associated IL-6/IL-8 cytokine network. Proc. Natl. Acad. Sci. USA 2009, 106, 17031–17036. [Google Scholar] [CrossRef] [Green Version]
- Gorgoulis, V.; Adams, P.D.; Alimonti, A.; Bennett, D.C.; Bischof, O.; Bishop, C.; Campisi, J.; Collado, M.; Evangelou, K.; Ferbeyre, G.; et al. Cellular Senescence: Defining a Path Forward. Cell 2019, 179, 813–827. [Google Scholar] [CrossRef]
- Coppé, J.-P.; Desprez, P.-Y.; Krtolica, A.; Campisi, J. The senescence-associated secretory phenotype: The dark side of tumor suppression. Annu. Rev. Pathol. 2010, 5, 99–118. [Google Scholar] [CrossRef] [Green Version]
- Birch, J.; Gil, J. Senescence and the SASP: Many therapeutic avenues. Genes Dev. 2020, 34, 1565–1576. [Google Scholar] [CrossRef] [PubMed]
- Sha, J.; Arbesman, J.; Harter, M.L. Premature senescence in human melanocytes after exposure to solar UVR: An exosome and UV-miRNA connection. Pigment. Cell Melanoma. Res. 2020, 33, 671–684. [Google Scholar] [CrossRef] [PubMed]
- Cadet, J.; Douki, T.; Ravanat, J.L. Oxidatively generated damage to cellular DNA by UVB and UVA radiation. Photochem. Photobiol. 2015, 91, 140–155. [Google Scholar] [CrossRef] [PubMed]
- Davies, M.J. Singlet oxygen-mediated damage to proteins and its consequences. Biochem. Biophys. Res. Commun. 2003, 305, 761–770. [Google Scholar] [CrossRef]
- Krisko, A.; Radman, M. Phenotypic and genetic consequences of protein damage. PLoS Genet. 2013, 9, e1003810. [Google Scholar] [CrossRef] [Green Version]
- Ren, J.L.; Pan, J.S.; Lu, Y.P.; Sun, P.; Han, J. Inflammatory signaling and cellular senescence. Cell Signal. 2009, 21, 378–383. [Google Scholar] [CrossRef] [Green Version]
- Severino, V.; Alessio, N.; Farina, A.; Sandomenico, A.; Cipollaro, M.; Peluso, G.; Galderisi, U.; Chambery, A. Insulin-like growth factor binding proteins 4 and 7 released by senescent cells promote premature senescence in mesenchymal stem cells. Cell Death Dis. 2013, 4, e911. [Google Scholar] [CrossRef]
- Silvers, A.L.; Bachelor, M.A.; Bowden, G.T. The role of JNK and p38 MAPK activities in UVA-induced signaling pathways leading to AP-1 activation and c-Fos expression. Neoplasia 2003, 5, 319–329. [Google Scholar] [CrossRef] [Green Version]
- Salama, S.A.; Arab, H.H.; Omar, H.A.; Gad, H.S.; Abd-Allah, G.M.; Maghrabi, I.A.; Al Robaian, M.M. L-carnitine mitigates UVA-induced skin tissue injury in rats through downregulation of oxidative stress, p38/c-Fos signaling, and the proinflammatory cytokines. Chem. Biol. Interact. 2018, 285, 40–47. [Google Scholar] [CrossRef]
- Oh, J.H.; Joo, Y.H.; Karadeniz, F.; Ko, J.; Kong, C.S. Syringaresinol Inhibits UVA-Induced MMP-1 Expression by Suppression of MAPK/AP-1 Signaling in HaCaT Keratinocytes and Human Dermal Fibroblasts. Int. J. Mol. Sci. 2020, 21, 3981. [Google Scholar] [CrossRef]
- Stein, B.; Baldwin, A.S.; Ballard, D.W.; Greene, W.C.; Angel, P.; Herrlich, P. Cross-coupling of the NF-kappa B p65 and Fos/Jun transcription factors produces potentiated biological function. EMBO J. 1993, 12, 3879–3891. [Google Scholar] [CrossRef] [PubMed]
- Min, W.; Bin, Z.W.; Quan, Z.B.; Hui, Z.J.; Sheng, F.G. The signal transduction pathway of PKC/NF-kappa B/c-fos may be involved in the influence of high glucose on the cardiomyocytes of neonatal rats. Cardiovasc. Diabetol. 2009, 8, 8. [Google Scholar] [CrossRef] [PubMed] [Green Version]
- Irving, J.; Feng, J.; Wistrom, C.; Pikaart, M.; Villeponteau, B. An altered repertoire of fos/jun (AP-1) at the onset of replicative senescence. Exp. Cell Res. 1992, 202, 161–166. [Google Scholar] [CrossRef] [Green Version]


| Genes | Primer Sequence (5′-3′) | Size (bp) |
|---|---|---|
| GAPDH | Forward 5′-GAAGGTGAAGGTCGGAGTCA-3′ | 290 |
| Reverse 5′-TGGACTCCACGACGTACTCA-3′ | ||
| IGFBP7 | Forward 5′-TTGAGCTGTGAGGTCATCGG-3′ | 188 |
| Reverse 5′-TCCTTACTTAGAGGAGATACCAGCA-3′ | ||
| Fos | Forward 5′-TGTGAAGACCATGACAGGAGG-3′ | 181 |
| Reverse 5′-TTGGTCTGTCTCCGCTTGG-3′ |
| Go Number | Description | Log p Value | |
|---|---|---|---|
| Biological processes | GO: 0006119 | oxidative phosphorylation | −3.91 |
| GO: 1902600 | proton transmembrane transport | −3.53 | |
| GO: 0099151 | regulation of postsynaptic density assembly | −3.06 | |
| GO: 0099150 | regulation of postsynaptic specialization assembly | −2.95 | |
| GO: 0009060 | aerobic respiration | −2.90 | |
| GO: 0010975 | regulation of neuron projection development | −2.89 | |
| GO: 0042572 | retinol metabolic process | −2.86 | |
| GO: 0034330 | cell junction organization | −2.86 | |
| Cellular components | GO: 0005743 | mitochondrial inner membrane | −4.51 |
| GO: 0031966 | mitochondrial membrane | −3.95 | |
| GO: 0098984 | neuron to neuron synapse | −3.92 | |
| GO: 0005740 | mitochondrial envelope | −3.86 | |
| GO: 0019866 | organelle inner membrane | −3.79 | |
| Molecular functions | GO: 0015078 | proton transmembrane transporter activity | −3.50 |
| GO: 0031386 | protein tag | −2.95 | |
| GO: 0015453 | oxidoreduction-driven active transmembrane transporter activity | −2.91 | |
| GO: 0032813 | tumor necrosis factor receptor superfamily binding | −2.90 | |
| GO: 0016491 | oxidoreductase activity | −2.49 |
| Reactome ID | Description | Log p-Value | Enrichment | Gene Symbol |
|---|---|---|---|---|
| R-HSA-2559582 | Senescence-associated secretory phenotype | −3.69 | 5.02 | CDKN2A, CDKN2D, Fos, IGFBP7, RPS6KA1, UBB, H2BC4, ANAPC11 |
| R-HSA-168255 | Influenza infection | −3.38 | 4.05 | POLR2F, POLR2L, RPL8, RPL36AL, RPL41, RPS25, PABPN1, ISG15, RPL36 |
| R-HSA-6798695 | Neutrophil degranulation | −2.80 | 2.34 | APRT, ATP6V0C, CYBA, CFD, FTH1, PKP1, RAB3A, SLC2A5, KCNAB2, DPP7, RAB4B, RAB24, CD177, TXNDC5, GHDC, NAPRT |
| R-HSA-74259 | Purine catabolism | −2.70 | 11.70 | NUDT1, DNPH1, NT5C |
| R-HSA-611105 | Respiratory electron transport | −2.44 | 4.09 | COX6B1, COX8A, NDUFA1, NDUFA3, UQCRH, COX14 |
| R-HSA-109581 | Apoptosis | −2.36 | 3.12 | CDKN2A, PKP1, PSMB10, UBB, SEM1, TRADD, FADD, BBC3 |
| R-HSA-370098 | Transcriptional regulation by TP53 | −2.19 | 2.31 | CDKN2A, COX6B1, COX8A, Fos, PIN1, POLR2F, POLR2L, STK11, UBB, BBC3, PRELID1, COX14 |
| R-HSA-5213460 | RIPK1-mediated regulated necrosis | −2.10 | 7.27 | UBB, TRADD, FADD |
| Gene | Description | Log2 Fold-Change | p-Value |
|---|---|---|---|
| IGFBP7 | Regulation of cell growth, signal transduction | 4.1 | 1.2 × 10⁻¹⁵ |
| UBB | Modification-dependent protein catabolic process | 1.3 | 0.0022 |
| H2BC4 | Core component of nucleosome | 1.8 | 0.012 |
| Fos | RNA polymerase II binding | 1 | 0.024 |
| CDKN2A | Cyclin-dependent kinase inhibitor | 0.95 | 0.026 |
| RPS6KA1 | Ribosomal protein S6 kinase | 1.2 | 0.028 |
| ANAPC11 | Ubiquitin-dependent protein catabolic process | 0.89 | 0.034 |
| CDKN2D | Cyclin-dependent kinase 4 inhibitor | 0.86 | 0.05 |
Publisher’s Note: MDPI stays neutral with regard to jurisdictional claims in published maps and institutional affiliations. |
© 2022 by the authors. Licensee MDPI, Basel, Switzerland. This article is an open access article distributed under the terms and conditions of the Creative Commons Attribution (CC BY) license (https://creativecommons.org/licenses/by/4.0/).
Share and Cite
Wang, J.; Yano, S.; Xie, K.; Ohata, Y.; Hara, T. Genome-Wide RNA Sequencing Analysis in Human Dermal Fibroblasts Exposed to Low-Dose Ultraviolet A Radiation. Genes 2022, 13, 974. https://doi.org/10.3390/genes13060974
Wang J, Yano S, Xie K, Ohata Y, Hara T. Genome-Wide RNA Sequencing Analysis in Human Dermal Fibroblasts Exposed to Low-Dose Ultraviolet A Radiation. Genes. 2022; 13(6):974. https://doi.org/10.3390/genes13060974
Chicago/Turabian StyleWang, Jinyun, Satoshi Yano, Kun Xie, Yoshihisa Ohata, and Taichi Hara. 2022. "Genome-Wide RNA Sequencing Analysis in Human Dermal Fibroblasts Exposed to Low-Dose Ultraviolet A Radiation" Genes 13, no. 6: 974. https://doi.org/10.3390/genes13060974
APA StyleWang, J., Yano, S., Xie, K., Ohata, Y., & Hara, T. (2022). Genome-Wide RNA Sequencing Analysis in Human Dermal Fibroblasts Exposed to Low-Dose Ultraviolet A Radiation. Genes, 13(6), 974. https://doi.org/10.3390/genes13060974