Article

SSR-Based Molecular Identification and Population Structure Analysis for Forage Pea (Pisum sativum var. arvense L.) Landraces

1
Department of Field Crops, Faculty of Agriculture, Ataturk University, 25240 Erzurum, Turkey
2
Department of Biology, Faculty of Science, Cankiri Karatekin University, 18200 Çankırı, Turkey
3
Department of Field Crops, Faculty of Agriculture, Necmettin Erbakan University, 42310 Konya, Turkey
4
Havsa Vocational College Park and Garden Plants, Trakya University, 22030 Edirne, Turkey
5
Botany Unit, Finnish Museum of Natural History, University of Helsinki, P.O. Box 7, FI-00014 Helsinki, Finland
6
Institute of Advanced Studies Kőszeg (iASK), 9731 Kőszeg, Hungary
*
Authors to whom correspondence should be addressed.
Genes 2022, 13(6), 1086; https://doi.org/10.3390/genes13061086
Submission received: 19 May 2022 / Revised: 9 June 2022 / Accepted: 16 June 2022 / Published: 18 June 2022
(This article belongs to the Section Plant Genetics and Genomics)

Abstract

:
Plant genetic diversity has a significant role in providing traits that can help meet future challenges, such as the need to adapt crops to changing climatic conditions or outbreaks of disease. Our aim in this study was to evaluate the diversity of 61 forage pea specimens (P. sativum ssp. arvense L.) collected from the northeastern Anatolia region of Turkey using 28 simple sequence repeat (SSR) markers. These primers generated a total of 82 polymorphic bands. The number of observed alleles (Na) per primer varied from 2 to 4 with a mean of 2.89 alleles/locus. The mean value of expected heterozygosity (Exp-Het = 0.50) was higher than the mean value of observed heterozygosity (Obs-Het = 0.22). The mean of polymorphic information content (PIC) was 0.41 with a range of 0.03–0.70. The mean number of effective alleles (Ne) was found to be 2.15, Nei’s expected heterozygosity (H) 0.49, and Shannon’s information index (I) 0.81. Cluster analysis through the unweighted pair-group mean average (UPGMA) method revealed that 61 forage pea landraces were divided into three main clusters. Genetic dissimilarity between the genotypes, calculated with the use of NTSYS-pc software, varied between 0.10 (G30 and G34) and 0.66 (G1 and G32). Principal coordinate analysis (PCoA) revealed that three principal coordinates explained 51.54% of the total variation. Moreover, population structure analysis showed that all genotypes formed three sub-populations. Expected heterozygosity values varied between 0.2669 (the first sub-population) and 0.3223 (third sub-population), with an average value of 0.2924. Average population differentiation measurement (Fst) was identified as 0.2351 for the first sub-population, 0.3838 for the second sub-population, and 0.2506 for the third sub-population. In general, current results suggest that SSR markers could be constantly used to illuminate the genetic diversity of forage pea landraces and can potentially be incorporated into future studies that examine the diversity within a larger collection of forage pea genotypes from diverse regions.

1. Introduction

Forage pea (P. sativum ssp. arvense L.) is a significant legume crop for fresh and dry grass production as well as an alternative to barley and vetch in animal nutrition [1]. Field-pea (P. sativum ssp. arvense L.) containing 2n = 2x = 14 chromosomes is a self-pollinated winter legume belonging to the Fabaceae (Leguminosae) family and sub-family Papilionaceae [2]. Nutritionally, it is a rich source of protein (21–25%) with high concentrations of lysine and tryptophan amino acids [3] and low levels of cysteine and methionine amino acids [4].
Forage pea plays an important role in meeting global forage demand. The annual green herbage production of forage pea is about 21 million tones on 2.7 million ha area globally, and 452.776 tons on about 24 thousand ha area in Turkey [1]. Although Turkey is the genetic pool and center of origin of many cultivated and wild forage crops, the production of high-quality hay remains a key challenge in Turkey compared to the global production scale due to insufficient forage cultivation [5], while the average productivity of forage peas in Turkey is very low. A quantum increase in total pulse output is required to increase availability per animal and to meet the feed requirements of the growing animal population. Therefore, high-yielding forage pea varieties and quality seed production are essential to the continuity of production. In any crop breeding program, there is a need to focus on the selection of key characteristics and the creation of genetic variability to improve yield and the component characteristics. However, the genetic variation available among the forage pea germplasm, the nature of the component traits on which selection will be effective, and the impact of environmental factors on each trait must be understood before effective selection can be achieved [6]. In Turkey, as all over the world, studies on natural landraces have been employed so that forage crops can contribute to agriculture, and such problems can be overcome. Landraces are valuable sources of genetic traits that are of interest to plant breeders for inclusion in breeding programs [7]. Furthermore, landrace populations make up a significant portion of crop genetic variation and are often characterized by high stress tolerance and local adaptation. [8]. The genetic variability of landrace inclusion can provide crucial information to assist gene banks replicate and conserve these genetic resources correctly [9]. In addition, information regarding genotype genetic variability aids decision-making for conservation tasks such as collecting and managing genetic resources, finding genes to add value to genetic resources, and predicting the ability to mix breeding material or quickly validate it for breeding purposes. As a result, determining the genetic variability of germplasm is the first stage in improving and developing superior cultivars, which is referred to as pre-breeding. In landrace genotypes, genetic diversity is crucial for sustainability because these varieties offer high yield stability despite low yield capacity. The genetic heterogeneity of landraces contributes to the resilience of the production system in response to biotic and abiotic stresses, reducing the overall risk of crop failure [10]. Up to now little has been known about the landrace of forage peas. Therefore, knowledge of genetic variability parameters for quantitative traits will help us leverage landraces to develop a superior variety. Several studies have been published on the pea germplasm using morphological descriptors and agronomic features, and recently DNA markers. Since many morphological characters are affected by environmental factors, the analysis of genetic diversity among local pea populations in this study was performed on molecular markers [11]. Molecular markers are useful for complementing morphological traits as they are independent of environmental influences and allow variety identification in the early stages of the crop [12]. The study of genetic diversity has received much attention in the last two decades for an effective breeding program and germplasm management, especially after the development of the concept of seed collection [13]. Several different marker systems, such as restriction fragment length polymorphisms (RFLPs), amplified fragment length polymorphism (AFLPs), simple-sequence repeats (SSRs), and inter-primer binding site (iPBS) have been used for either mapping studies or diversity assessment in pea (Pisum sativum L.). However, few studies have used DNA markers in forage pea (Pisum sativum ssp. arvense L.). Among molecular markers based on PCR (Polymerase Chain Reaction) methods, SSR markers are an ideal approach for characterizing large numbers of landraces in a relatively short time and at low cost. SSR markers are suitable for whole genome characterization because of their uniform distribution throughout the genome, co-dominant inheritance, multiple allelic structure, ease of detection by PCR, and good reproducibility [14].
Recently, Demirkol and Yilmaz [15] studied the genetic diversity of 48 forage pea landraces collected from the East Black Sea Region in Turkey. Forage pea landraces were collected using the criteria of the International Union for the Protection of New Varieties of Plants (UPOV) and used 32 SSR markers. According to these studies, the Turkish forage pea landrace collection has a significant genetic variation. Despite the fact that the research area where the landraces were collected in the current study did not cover a large area, the results revealed that the diversity results were either similar or higher than those found in studies that collected landraces from larger areas. In other words, the landraces that have been evaluated so far represent only a small portion of the available resources; also, they are limited to a few geographic zones, making it impossible to investigate the genetic structure of forage pea landraces in Turkey. Furthermore, no comprehensive study has yet been undertaken to quantify the genetic diversity of forage pea germplasm in Turkey. Therefore, the aim of this study was to characterize and evaluate the genetic diversity of forage pea genotypes collected from various provinces in the northeastern Anatolia region of Turkey using SSR markers, and to develop strategies to protect the endangered genetic resources of this region.

2. Materials and Methods
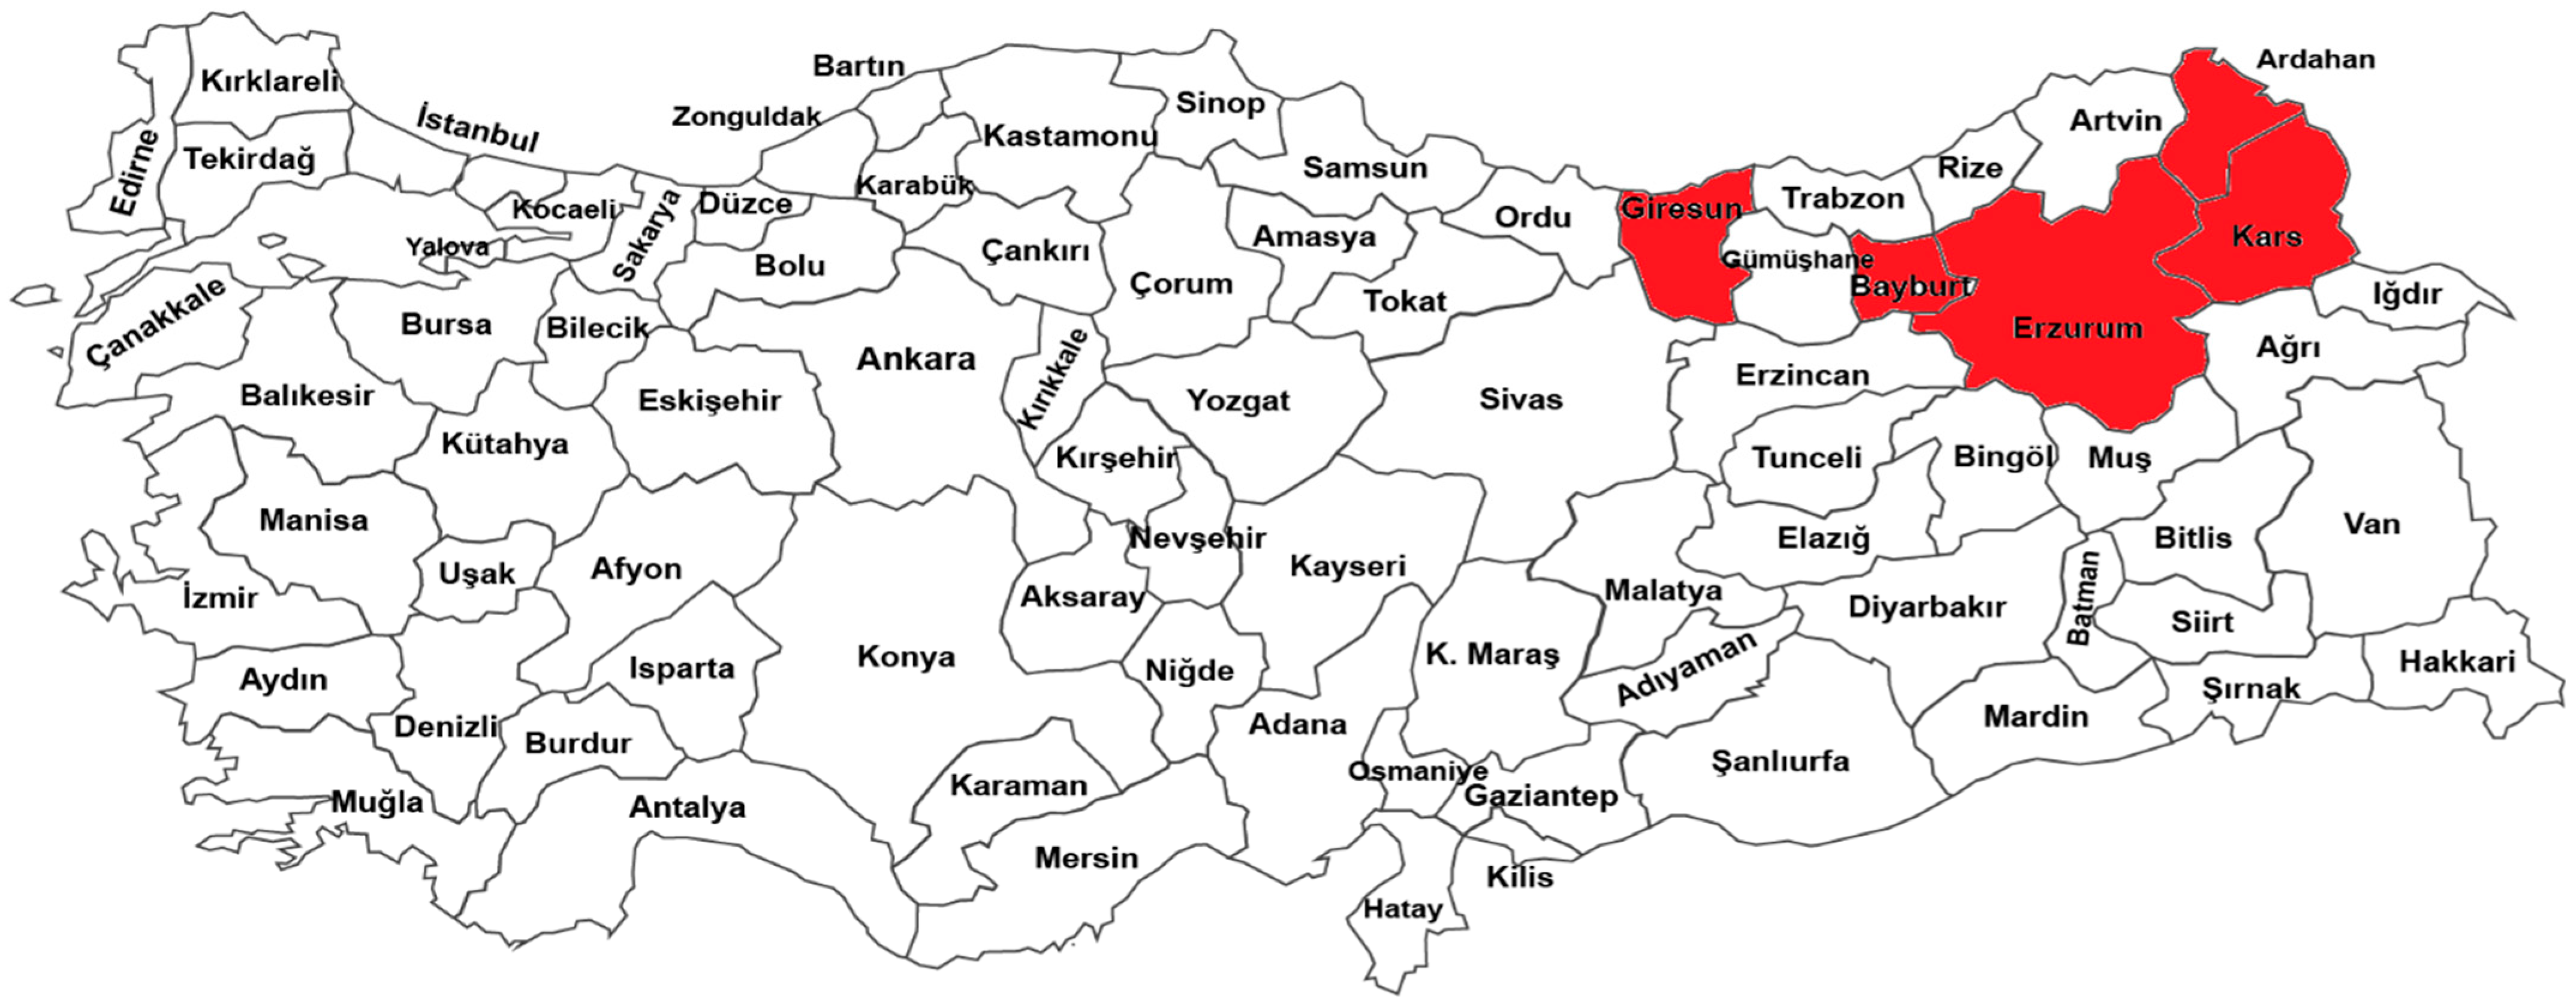
2.1. Plant Material

Sixty-one Turkish forage pea (P. sativum ssp. arvense L.) landraces were used as plant materials in the present study. The names of the landraces and their collection sites are shown in Table 1 and briefly displayed in Figure 1. The Turkish forage pea landraces were collected in cultivated fields from 5 different provinces (Erzurum, Bayburt, Ardahan, Kars, and Giresun) in the northeastern Anatolia region of Turkey.

2.2. Genomic DNA Extraction and Quality Assessment

Plants were grown in a greenhouse as part of the study. In the Laboratory of Molecular Biology and Genetics, Department of Field Crops, Agriculture Faculty, Ataturk University, bulk DNA of 61 individuals per accession was extracted from young leaves of 2-week-old plants. The procedure as described by Zeynalzadeh-Tabrizi et al. [16] was followed for extracting genomic DNA from three plants of each accession, which were then bulked for further analysis. Extracted DNA was electrophoresed in 0.8% agarose gel.

2.3. PCR Reaction and Genotyping

Initially, 28 primers developed by Xu-Xiao et al. [17], Smýkal et al. [18], Zong et al. [19], Zong et al. [20], and Cieslarová, et al. [21] were used to screen six forage pea genotypes in order to see which primers produced sharp and clear banding profiles. All tested primers with better PCR products were chosen to genotype the entire set of forage pea accessions. The names of the primers, their annealing temperatures and sequences are listed in Table 2. PCR Amplification was performed in a thermos cycler (SensoQuest Labcycler, Göttingen, Germany) and was conducted in 10 µL reaction mixture comprising 25 ng template DNA, 0.5 U Taq polymerase, 0.25 mM dNTP, 1 µM (20 pmol) primer, 10X buffer; 2 mM MgCl2. The PCR thermal cycling profile was as follows: initial denaturation for 3 min at 95 °C, 38 cycles of 95 °C for 60 s, 53–66 °C (annealing temperature depending on primers; for details see Table 2) for 60 s, 72 °C for 120 s, and final extension at 72 °C for 10 min [22]. At 200 V for 105 min, all PCR amplification products were separated by polyacrylamide Mega-Gel dual vertical electrophoresis (Model C-DASG-400-50). In 0.5X TBE buffer, 6% (w/v) acrylamide/bis-acrylamide (19:1), 0.07% (w/v) ammonium persulfate, and 0.08% (w/v) TEMED were used to prepare the gel solution. Finally, the gels were photographed using a digital camera (Model Nikon Coolpix500, Nikon, Japan) under UV light (Supplementary Figure S1).

2.4. Data Analysis

The SSR band patterns were analyzed with TotalLab TL120 software. Scoring was performed for SSR amplification products as present (1) or absent (0). Power Marker version 3.25 [23] was applied to obtain information on major allele frequency (MAF), gene diversity (GD), and polymorphic information content (PIC). Observed heterozygosity (Obs-Hom), Expected heterozygosity (Exp-Het), number of effective alleles (ne), Nei’s expected heterozygosity (h), and Shannon’s information index (I) values were determined with POPGEN1.32 software [24]. The Dice similarity index [25] was used to calculate genetic similarity between each pair of accessions. The similarity matrix was then used in NTSYS-pc V2.1 to create a dendrogram using the unweighted pair group method with the arithmetic mean (UPGMA) and SAHN clustering [26]. GenAlExV6.5 software was used for principal coordinate analysis (PCoA) and analysis of molecular variance (AMOVA) [27]. Genetic structure of the genotypes was assessed through model-based cluster analysis with Structure v. 2.2 software [28]. The number of population clusters (K) was estimated using Evanno’s ΔK method [29] and Structure Harvester [30]. MCMC (Markov Chain Monte Carlo) posterior probabilities were also estimated.

3. Results and Discussion

3.1. Genetic Variation in Forage Pea (P. sativum ssp. arvense L.) Landrace Accessions Using SSR Primers

The genetic variation for 28 SSR loci was calculated based on the number of alleles found (Na), major allele frequency (Maf), observed heterozygosity (Obs-Het), expected heterozygosity (Exp-Het), gene diversity (GD), Nei’s expected heterozygosity (h), effective number of alleles (ne), Shannon’s Information index (I), and polymorphic information content (PIC) among the 61-forage pea (P. sativum ssp. arvense L.) landrace accessions (Table 3).
In this study, all primers yielded good or excellent polymorphic band profiles. The 28 SSR loci were confirmed to have a total of 82 alleles in the 61-forage pea (P. sativum ssp. arvense L.) landrace accessions. The number of alleles per polymorphic locus varied between 2 (PB14, PSAB109, AD100, AA303, AA315, AA-67, AA-321, AD-186, AA-278 and A-9) and 5 (PSAA175 and PSAC58) and the average observed number of alleles per locus was 2.89 (Table 3). When compared to data from comparable studies on other species, these levels of polymorphism indicate that pea is a polymorphic autogamous species [31]. In other words, pea is a self-pollinating species. Smýkal et al. [32] reported that in 25 pea varieties discriminated with SSR markers, the number of alleles ranged from 3 to 6, detecting 38 alleles altogether. Nasiri et al. [33] examined putative duplicate accessions among 20 pea varieties with 57 accessions from wild pisum using 10 out of 20 microsatellite primer pairs to identify genetic relationships in the pisum genus. They discovered 59 alleles in total in the entire dataset, with the PEACPLHPP, AF004843, and AA43090 loci having the most (8 alleles). They also discovered that the wild accessions, PSGAPA 1, PEACPLHPPS, AF004843, and PSmpsaa278c loci all produced 7 alleles, with the number of alleles per locus ranging from 2 to 8, with a mean of 5.9 alleles per locus. Demirkol and Yilmaz [15] showed that 51 genotypes were successfully discriminated using 32 SSR markers, with 127 alleles detected and the number of alleles per primer ranging from 2 to 7 with an average of 3.97, which is higher than the value obtained in our study. All primers were determined to be polymorphic. Zhuang et al. [34] found 37 SSR markers in amplified PCR products, 11 of which produced polymorphism in 23 people, including the parents of recombinant inbred lines, with 2 to 4 alleles in 23 individuals. It is difficult to compare the levels of variety with research because the number of alleles discovered per marker and the genetic diversity of markers are both dependent on the number of genotypes examined [35]. Teshome et al. [14] exposed 37 alleles which were detected across the 12 EST-SSR loci of the 46 field pea accessions genotyped. However, in pea, the mean number of alleles per polymorphic marker was 2.3 [36], 4.5 [37], 3.6 [35], 5 [38], 4 [39], 5 [40], 3.8 [31], 4 [41,42], and 3.8 [32].
In our study, the average MAF was 0.60, with a range of 0.37 (PSAC58 and PSAD280) to 0.98 (AA-278 and A-9) (Table 3). Additionally, the average observed heterozygosity (Obs-He) among all the SSR markers used was 0.22, ranging from zero (AA303, AA315, AA-67, AA-321, AD-186, AA-278 and A-9) to 0.85 (PB14) (Table 3).
The average expected heterozygosity (Exp-He) was 0.50 with a minimum value of 0.03 (A-9) and a maximum of 0.76 (PSAC58) (Table 3), which indicated an excess of homozygosity within populations, which could be due to inbreeding. Differences in Obs-He could be due to a variety of factors, including the molecular markers utilized. The average Obs-He varied depending on a number of factors, including the number of selections and wild origins, as well as the sample locations’ geographic location (Erzurum, Kars, Bayburt, Bingol, and Gumushane). The broad geographical regions of the aggregation areas, the great number of local species analyzed, and the large number of landraces studied may have contributed to the high number of alleles per locus and identified in our study. Except for AB53 and PVSBE2, observed heterozygosity was lower than expected, according to Sarikamis et al. [43]. This is most likely owing to the pea’s inbreeding nature, rather than null alleles. Zhuang et al. revealed expected heterozygosity values ranging from 0 to 0.43 and 0.31 to 0.83, respectively [34].
The average GD was 0.49, with a range of 0.03 (AA-278 and A-9) to 0.74 (PSAC58). The means of number of effective alleles, which was 2.15, varied between 1.03 (A-9) and 4.07 (PSAC58) (Table 3). Nei’s expected heterozygosity with a mean of 0.49 was at the lowest (0.03) A-9 locus; the highest (0.75) was observed in the PSAC58 locus (Table 3). In this study, Shannon’s Information index, which ranged from 0.08 (A-9) to 1.47 (PSAC58), was found to be an average of 0.81 (Table 3). Teshome et al. [14] showed that the observed number of alleles (na) per locus ranged from two to six. The effective number of alleles (ne) at each locus ranged from 1.05 to 2.83. Observed heterozygosity (Ho) varied from zero to 0.05. The Shannon diversity index (I) per locus ranged from 0.11 to 1.13. The average Shannon diversity index for all loci was 0.53.
The PIC value indicates the discriminating power of the marker. The average PIC value was 0.41, with a range of 0.03 (AA-278 and A-9) to 0.70 (PSAC58). The PIC value provides a clear picture for diversity assessment as it takes into account the relative frequencies of each available band [44]. Smýkal et al. [18] reported that 25 pea varieties discriminated with SSR markers had PIC ranging from 0.10 to 0.75, on average 0.52, which is higher than the value obtained in our study. Nasiri et al. [33] showed that the polymorphism information content (PIC) in their entire collection varied from 0.556 to 0.839 and averaged 0.72. Demirkol and Yilmaz [15] showed that the average polymorphism information content (PIC) value was 0.63, ranging from 0.17 to 0.89. Loridon et al. [31] reported mean PIC of 0.62, Haghnazari et al. [40] 0.53, Smýkal et al. [32] 0.52, Smýkal et al. [18] 0.89, Cupic et al. [37] 0.51, and Gong et al. [36] 0.41. Furthermore, the average PIC and allele values found in this study were greater than those found in Handerson et al. [45] and Jain et al. [46] and were comparable to those found in refs. [13,37,47,48,49,50,51,52]. In this study, however, average PIC and allele values were found to be lower than those found by [18] and [53]. The PIC and MAF value indicate considerable genetic variation among all forage pea (P. sativum ssp. arvense L.) landraces used. Using a number of molecular markers, genetic variation between individuals in a population or between populations in a crop species, which is produced from genes, environmental impacts, or both, may be easily assessed. In general, the genetic diversity detectable by molecular markers in plants depends on the mode of reproduction, the history of domestication, and the size of the samples analyzed.

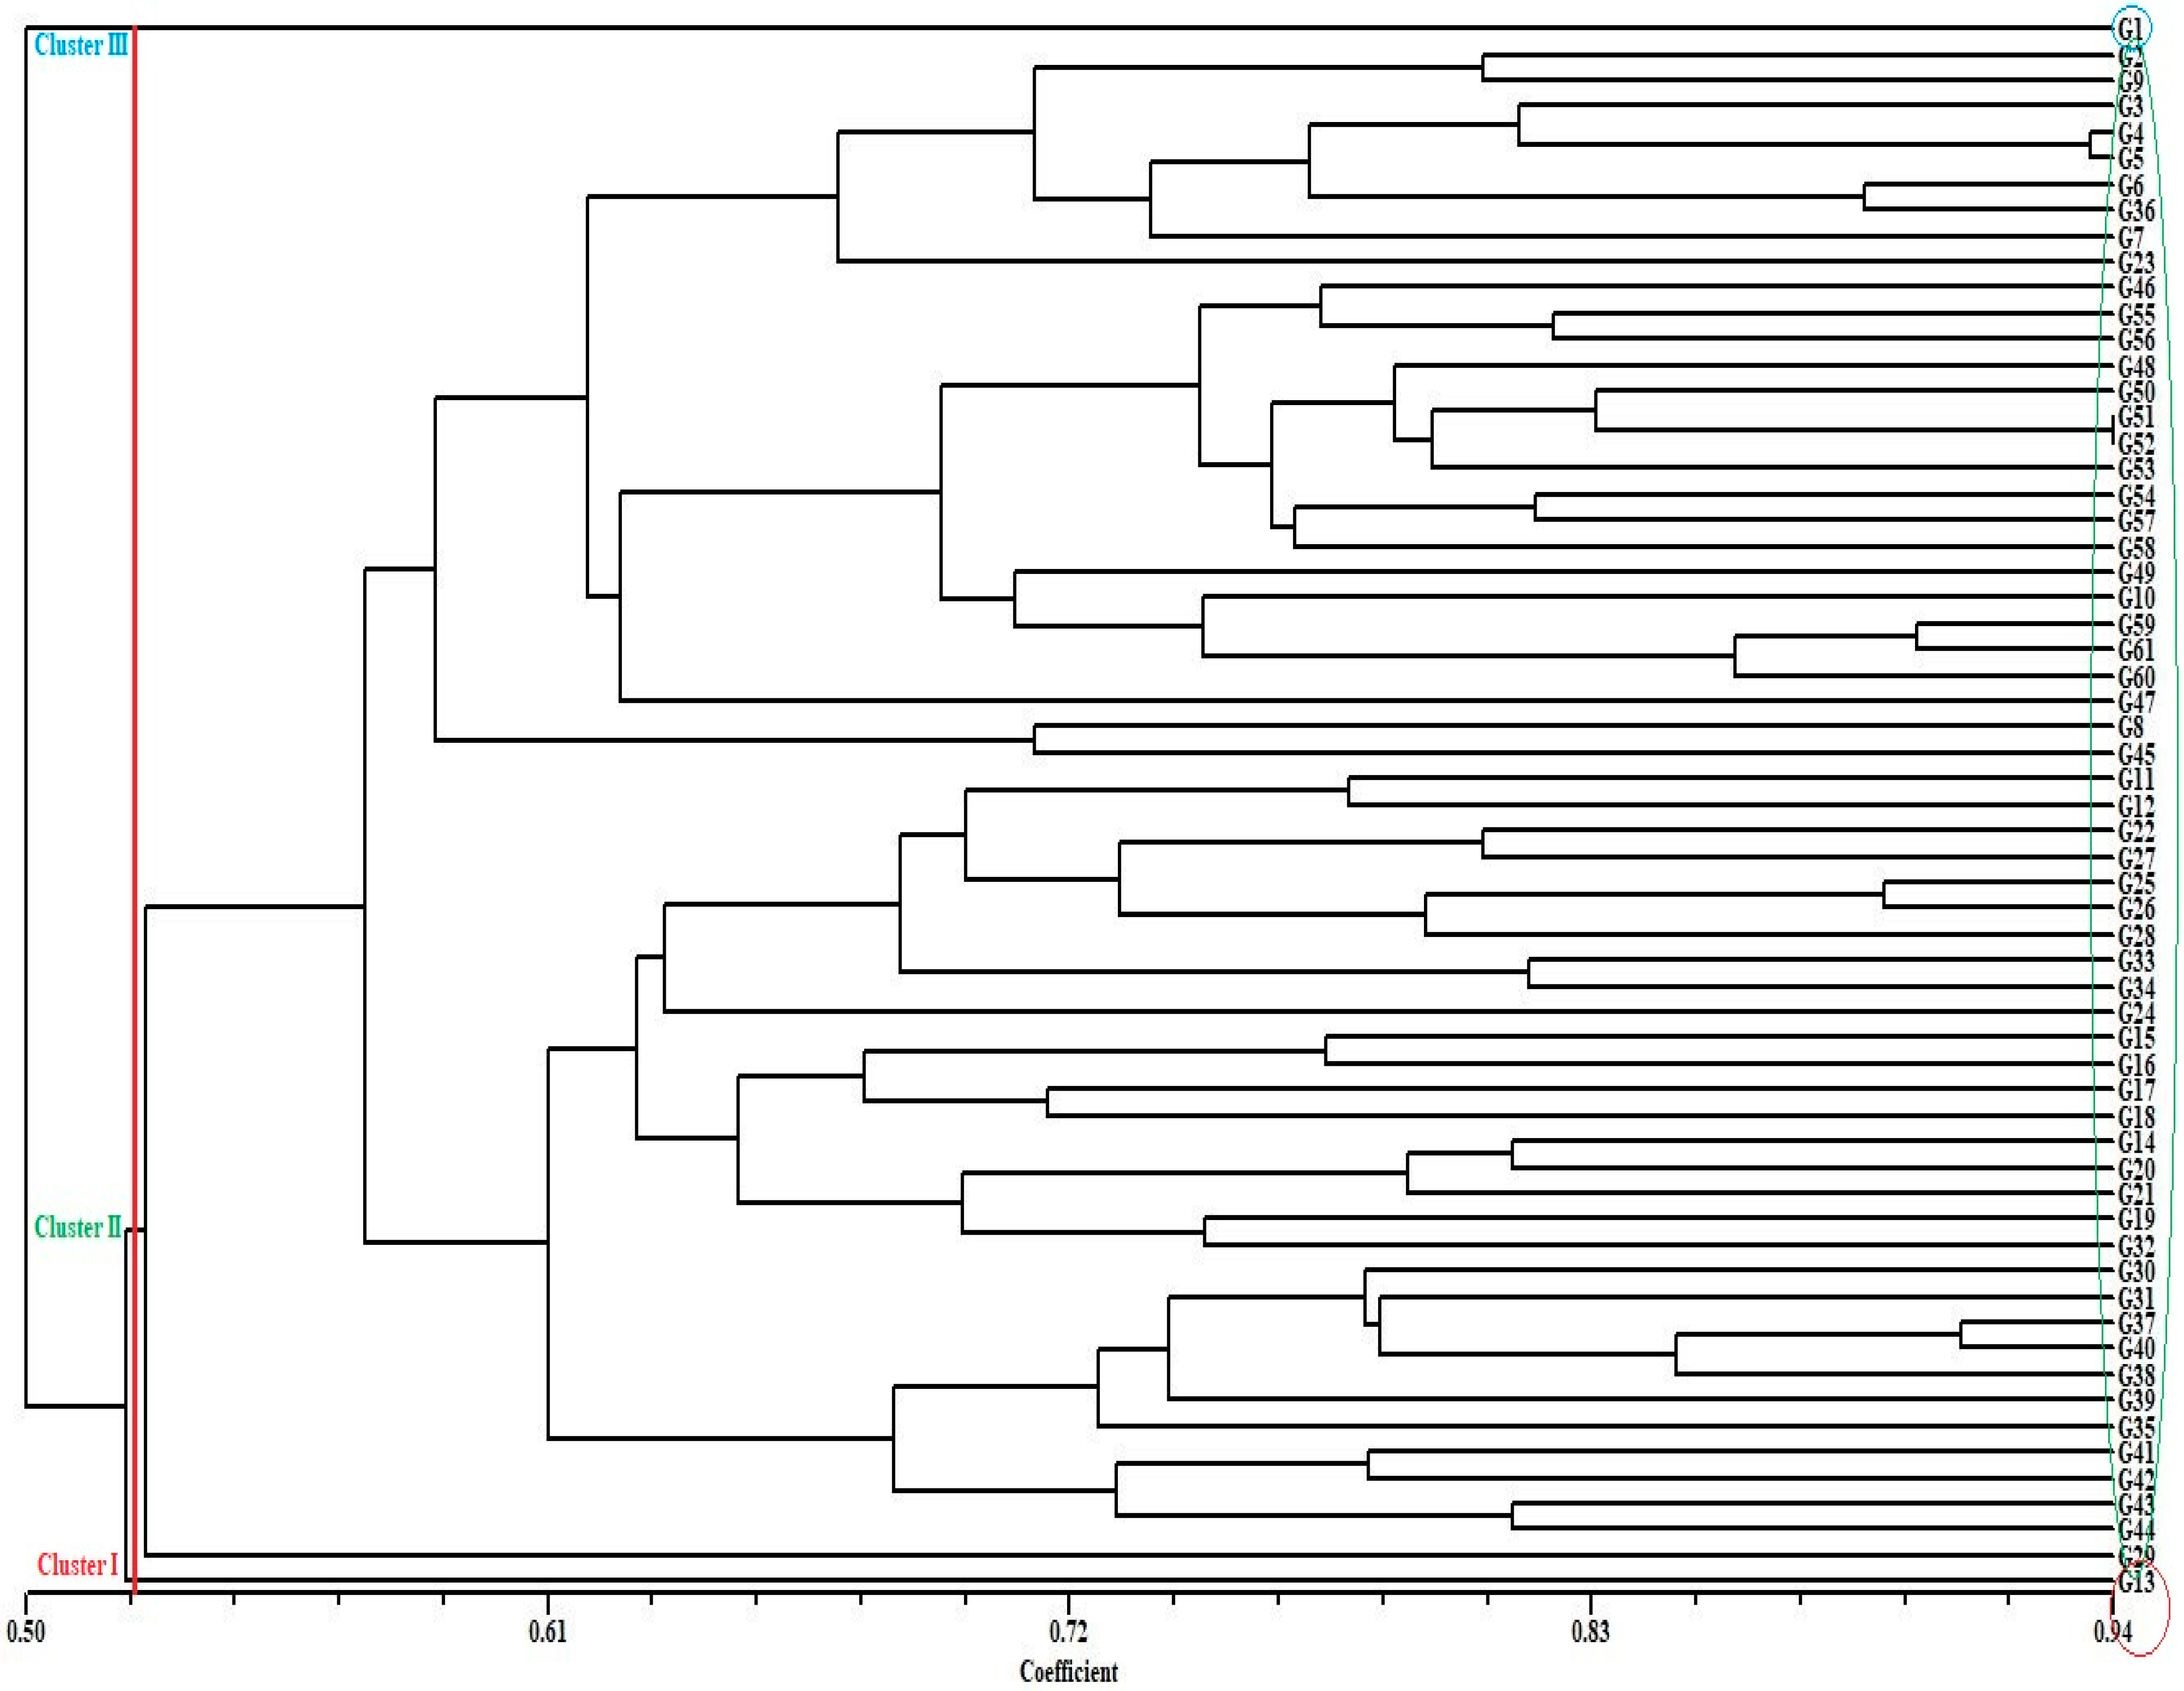
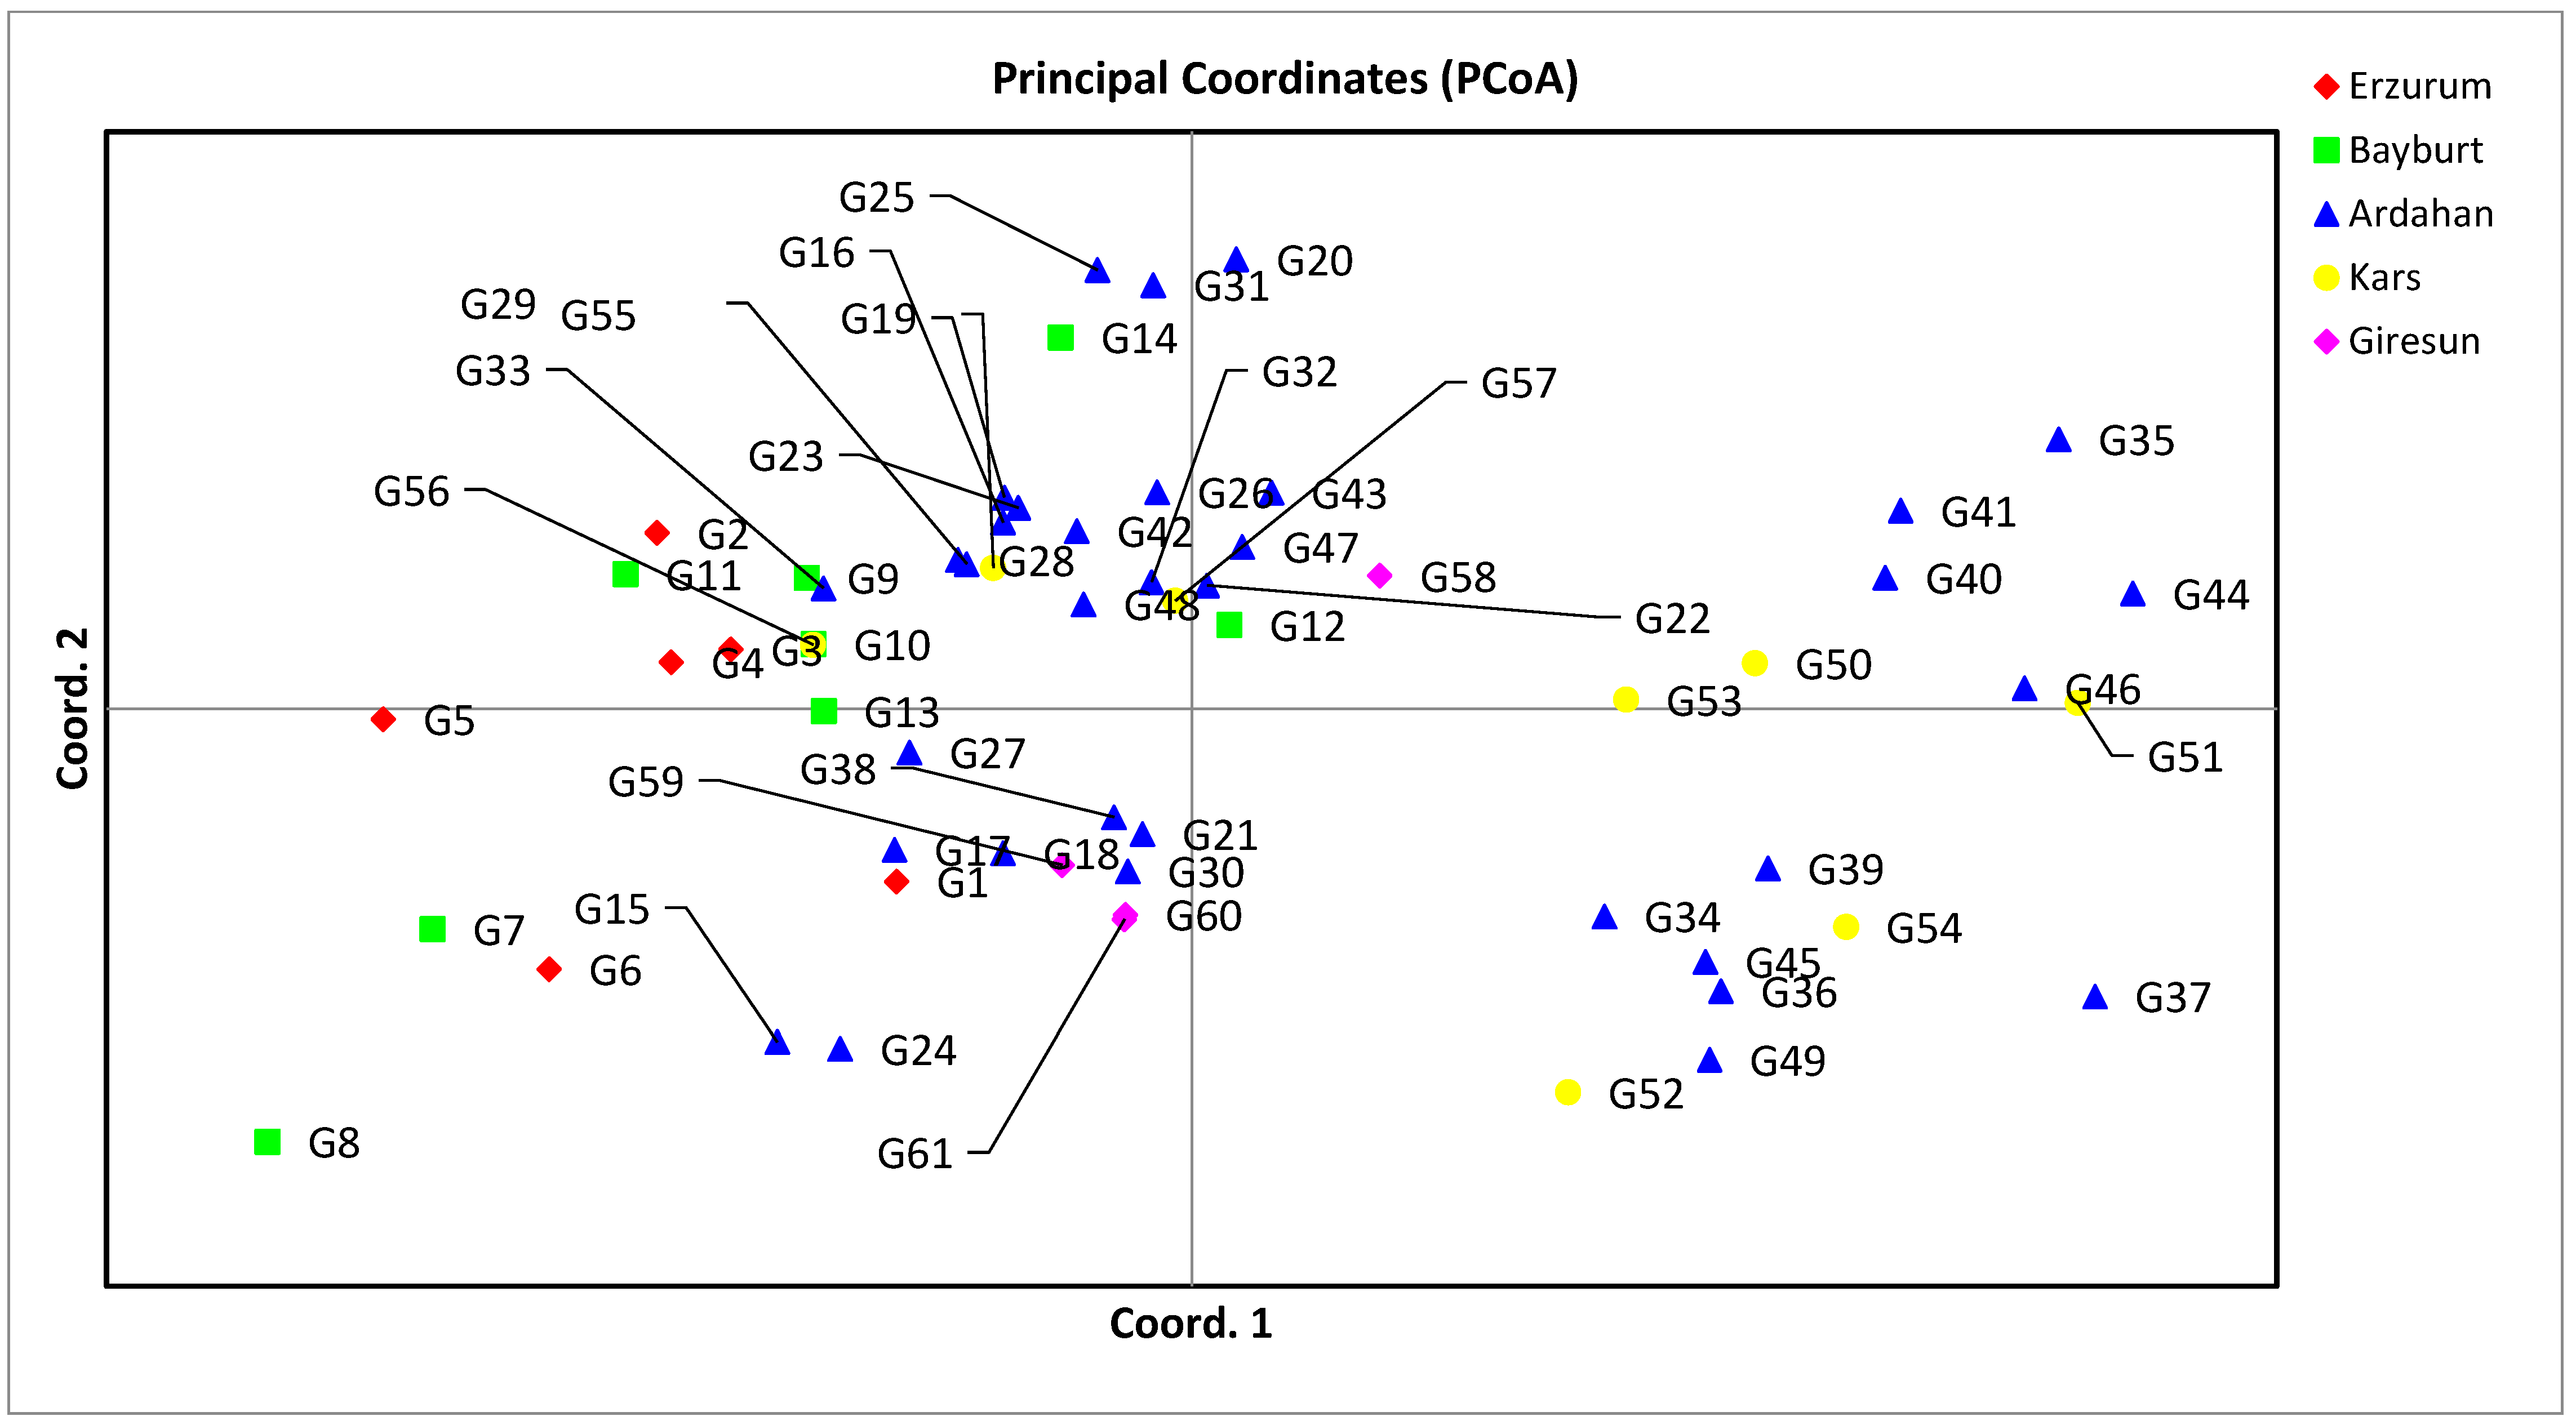
3.2. Genetic Distance, Cluster Analysis, Molecular Variance Analysis (AMOVA), and Principal Coordinate Analysis (PCoA) for SSR Markers

We analyzed phylogenetic relationships for the 61-forage pea (P. sativum ssp. arvense L.) accessions used in our study using the 28 SSR markers in order to better understand genetic variability and genetic relationships among accessions of the forage pea (P. sativum ssp. arvense L.) landraces used in our study. The forage pea (P. sativum ssp. arvense L.) landrace accessions aggregated into three primary groups with a genetic dissimilarity variation of 0.10 (G30 and G34) and 0.66 (G1 and G32), according to a phylogenetic tree generated using UPGMA and 28 SSR markers (Figure 2). Differences between accessions at the time of recognition could account for the increased calculated distance. Group I contained one accession of the forage pea (P. sativum ssp. arvense L.) landraces including G13. Group II contained 59 accessions of the forage pea (P. sativum ssp. arvense L.) landraces. In addition, Group II was divided into three subclusters. The first subcluster (G II-1) contained 31 accessions including G29, G44, G43, G42, G41, G35, G39, G38, G40, G37, G31, G30, G32, G19, G21, G20, G14, G18, G17, G16, G15, G24, G34, G33, G28, G26, G25, G27, G22, G12, and G11. The second subcluster (G II-2) contained two accessions including G45 and G8. The third subcluster (G II-3) contained 26 accessions including G47, G60, G61, G59, G10, G49, G58, G57, G54, G53, G52, G51, G50, G48, G56, G55, G46, G23, G7, G36, G6, G5, G4, G3, G9, and G2 (Figure 2). Briefly, out of G1 (cluster III) and G13 (Cluster I), the rest of the landraces were Cluster III. Thus, most of the accessions collected from various provinces were clustered in the same group; mixing and grouping was not clear according to geographic region. The non-relatedness of landraces from the same region could be due to climatic conditions. Cupic et al. [37] found that the average distance between two groups of accessions was 0.69 when they looked at the genetic diversity of 18 pea (Pisum sativum L.) genotypes using pedigree, morphological, and 26 SSR molecular data. In addition, they discovered that three main clusters (at value 0.61 of distance) as well as two sub-clusters within the sativum group (at value 0.49 of distance) were composed of dendrogram-confirmed groups of arvense and sativum accessions. Nasiri et al. [33], investigating the genetic diversity among 77 accessions of pea (Pisum sativum L.) based on 10 SSR markers, showed that cluster analysis and principal coordinate analysis located accessions in three groups: their result was similar to ours.
The UPGMA cluster analysis and PCOA using genetic markers revealed that all genotypes were not clearly differentiated from the 61-forage pea (P. sativum ssp. arvense L.) landrace accessions. According to our results, the clustering patterns could not clearly distinguish the forage pea (P. sativum ssp. arvense L.) landrace accessions by province of collection. This clustering of genotypes showed that there was no significant relationship between geographic origin and genetic similarity. This result indicates that there is a certain level of gene flow between genotypes. Cupic et al. [37] found that the genetic distance across pea accessions might range from 0.24 to 0.84 based on SSR markers. Differences between accessions at the time of recognition may have resulted in a larger calculated distance.
Molecular analysis of variance (AMOVA) results on forage pea (P. sativum ssp. arvense L.) landrace accessions to assess variation in populations showed that the within-populations (82.00%) were higher than the between-populations (18.00%) (Table 4). Analysis of molecular variance (AMOVA) demonstrated high variability within arvense groups, indicating that there is still sufficient variety for them to be used in breeding schemes. The variance among the population is low. However, the overall comparison showed significant variation between accessions due to differences in the frequency of multiple and unique and rare alleles between accessions. Because Ardahan Province is regarded as one of the primary forage peas growing locations, the grouping observed in our study can be justified by this assumption. Diffusion of seeds may also occur among provinces through farmers. Another possible reason is that a large portion of the studied material was collected from Ardahan Province, which led to the clustering of these landraces close to each other. This result indicates that there is gene flow between populations [54]. MW Blair, A Soler, and AJ Cortes [55], in their study with 36 SSR markers in 104 wild bean genotypes, determined that the variance within the populations was 98%. Dissimilarity to our findings was observed in Nasiri et al. [33] in wild species accessions of pea (Pisum sativum L.) using SSR markers studies—the intergroups component of variance (29%) being lower than the intragroup component of variance (71%). Furthermore, Teshome et al. [14] reported that the genetic differentiation among accessions was 41% while the variation within was 59%. The explanation for this could be that the region contains a variety of altitudes and climates, which tend to increase diversity. Analysis of molecular variance (AMOVA) demonstrated high variability among population groupings, indicating that there is still sufficient variety to be employed in breeding efforts.
Principal coordinate analysis (PCoA) is a multivariate dataset that provides the ability to find and archive key patterns in multiple loci and multiple samples. With this technique, the distances between the groups, which are formed thanks to the two-dimensional diagram formed by the similarity or distance matrix between the individuals, reflect the real distances [56]. PCoA is used to provide a spatial representation of the relative genetic distances between populations [57]. SSR-based clustering was found to be beneficial in distinguishing forage pea (P. sativum ssp. arvense L.) landraces depending on their origins. There was no correlation between PCoA grouping and cluster analysis in this study. (Figure 3). In our study, the PCoA was performed using the neutral genetic distance of Nei. The percentage of genetic diversity explained by each of the three main coordinates of the basic coordinate analysis was determined to be 21.59, 16.67, and 13.28, respectively, and these first three components explained 51.54% of the diversity (Table 5). Although the groups were not completely separated in the 2D diagram obtained over the first two components, the distribution of genotypes on the diagram indicated the presence of genetic diversity (Figure 3).

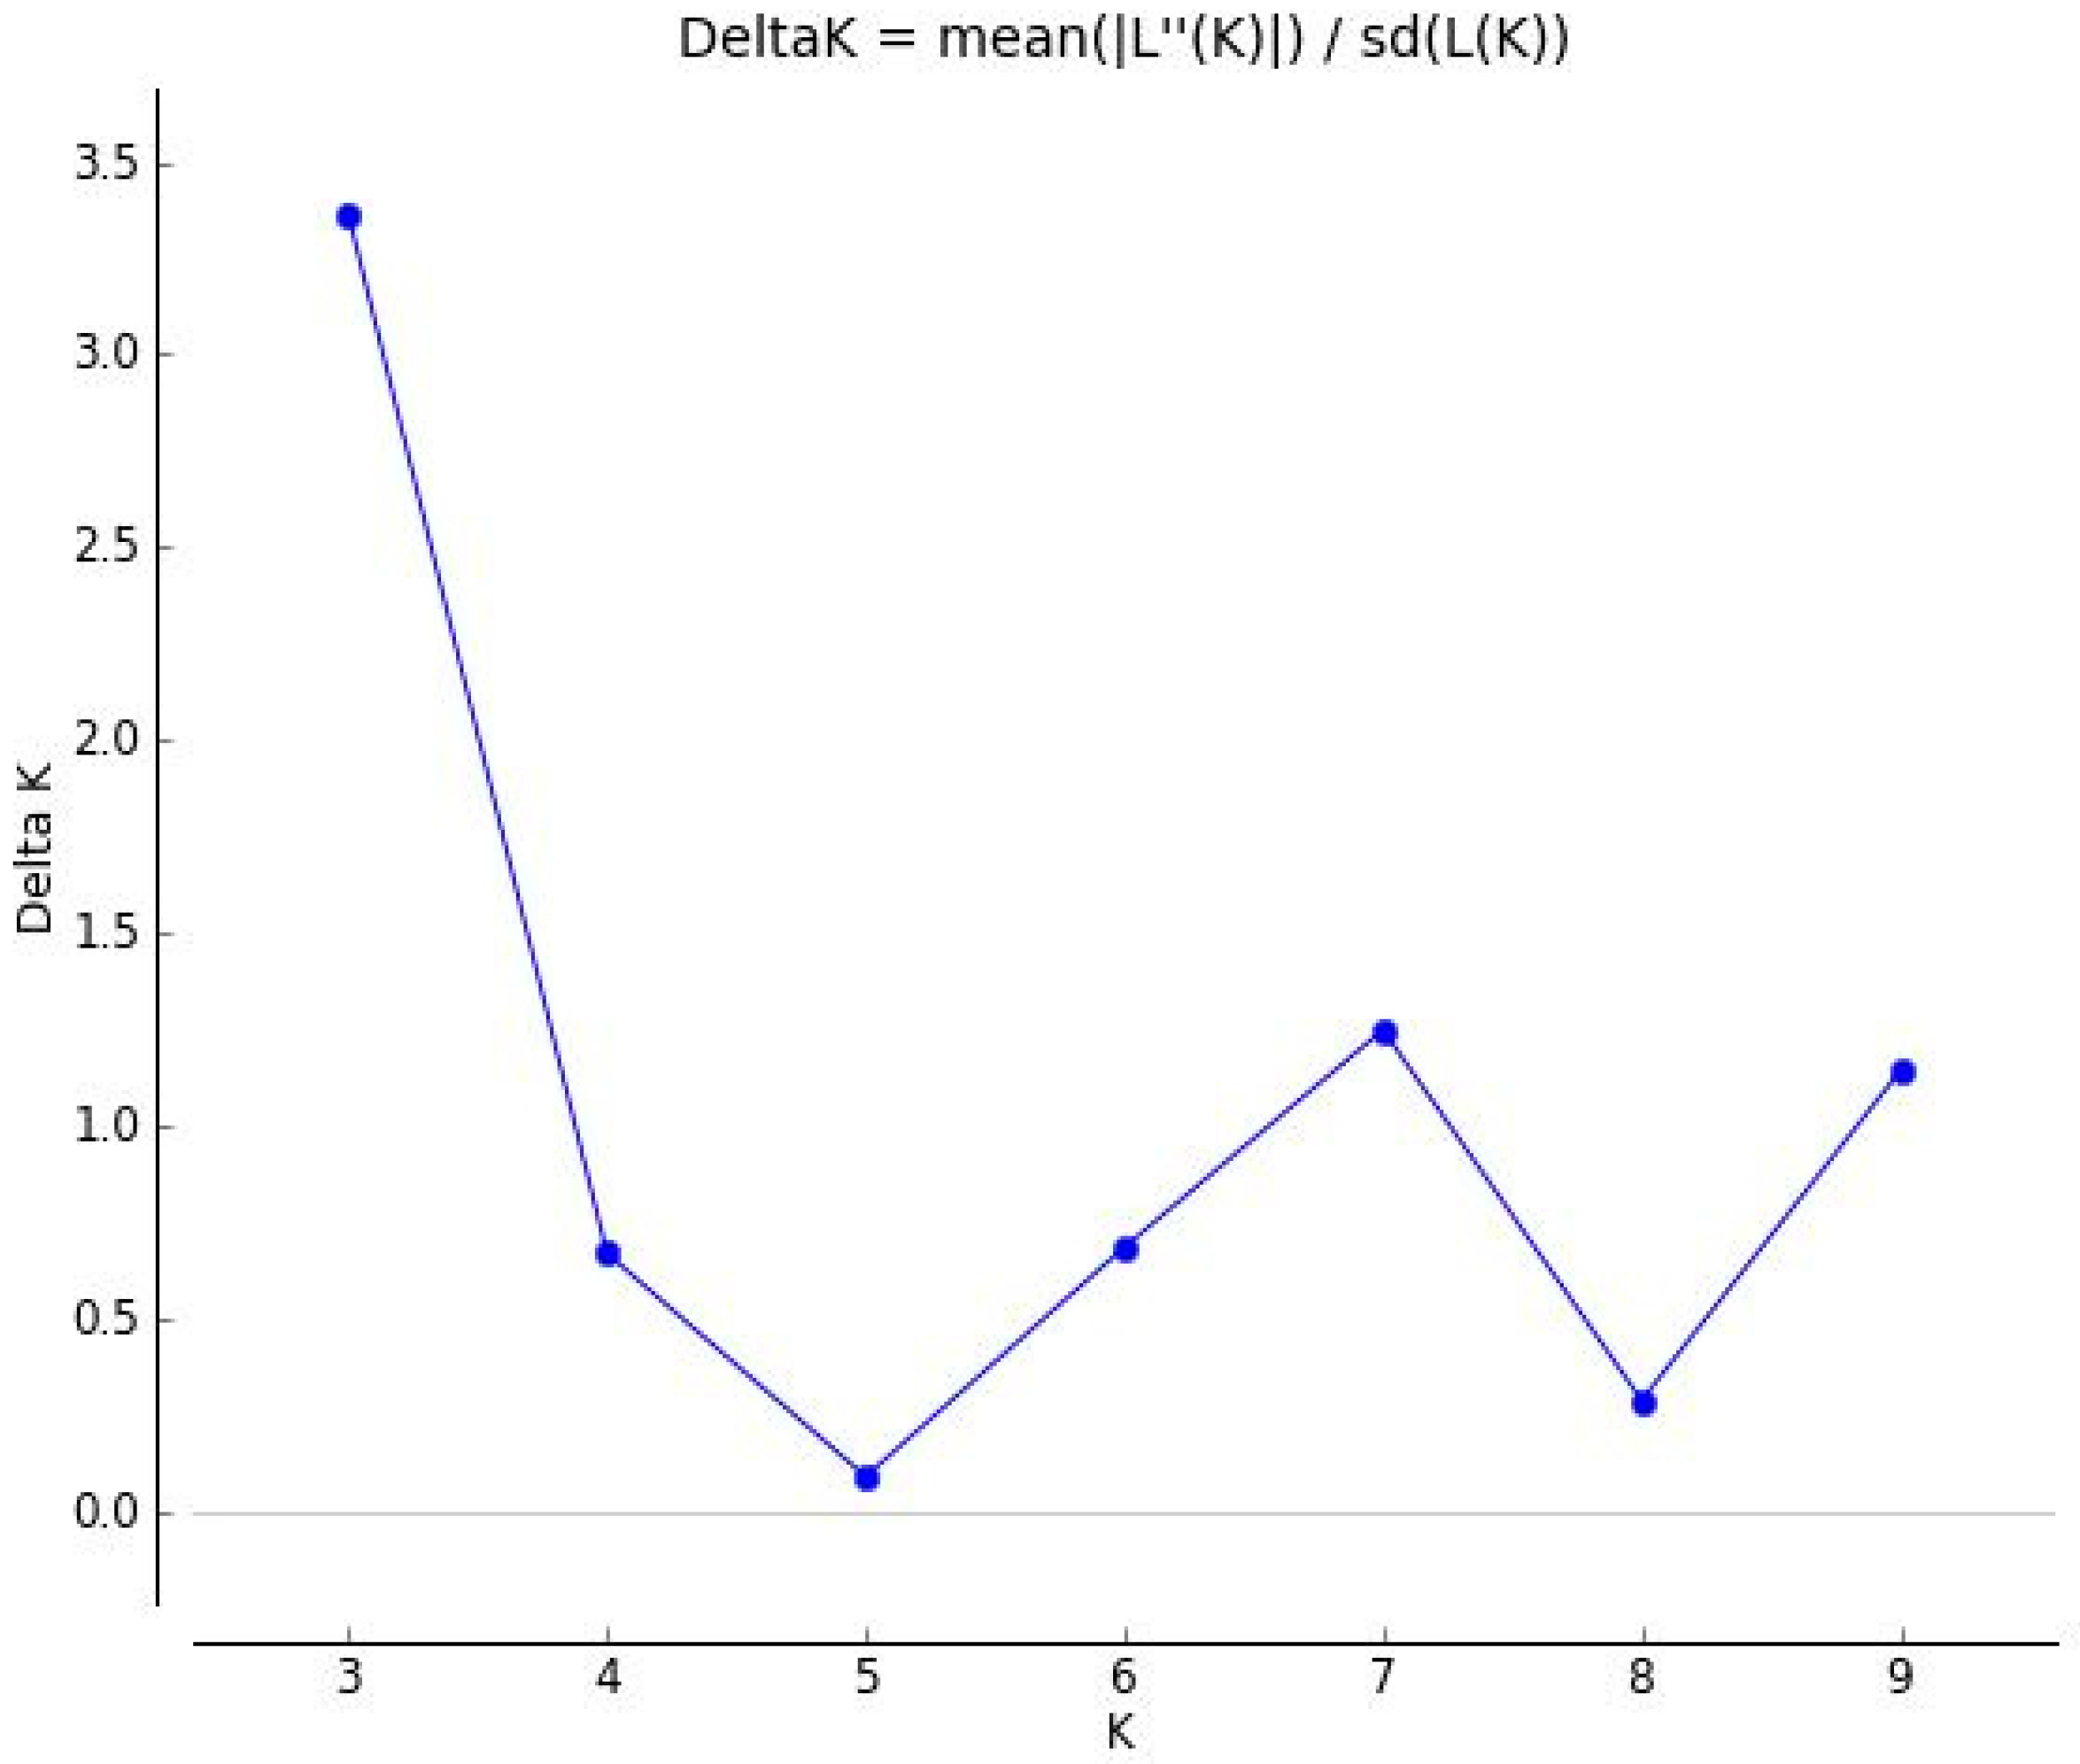
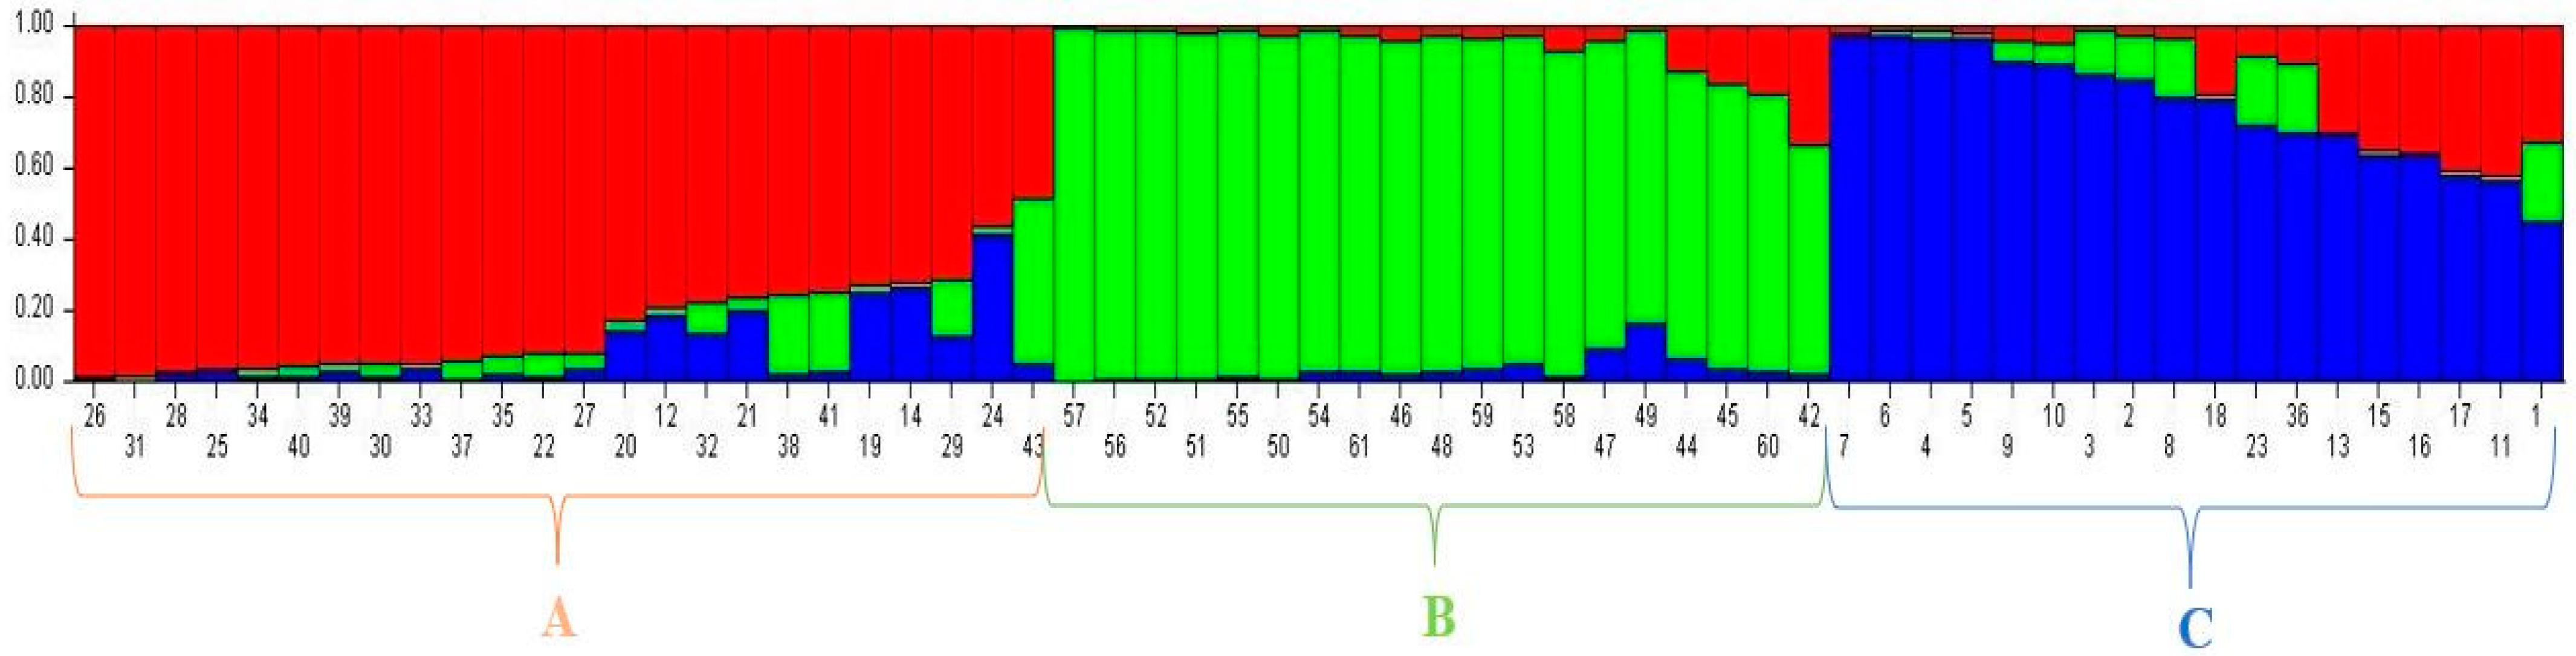
3.3. Population Structure among 61 Forage Peas (P. sativum ssp. arvense L.) Landrace Accessions Using SSR

To better understand the population structure of the 61-forage pea (P. sativum ssp. arvense L.) landraces, we used the model-based approach in STRUCTURE software to divide each accession into matching subgroups. For the 61 landraces of forage pea (P. sativum ssp. arvense L.), the highest value of DK was K = 3. (Figure 4). As a consequence, at K = 3 (membership probability 0.8), all accessions were sorted into three main groups and an admixed group (red [A], green [B], blue [C]) (Figure 5).
At K = 3, Group I included 14 accessions of the forage pea (P. sativum ssp. arvense L.) landraces including G26, G31, G28, G25, G34, G40, G39, G30, G33, G37, G35, G22, G27, and G20. The genotypes of this group include some of the Ardahan genotypes, and all of the Kars and Giresun genotypes. Group II included 18 accessions of the forage pea (P. sativum ssp. arvense L.) landraces counting G57, G56, G52, G51, G55, G50, G54, G61, G46, G48, G59, G53, G58, G47, G49, G44, G45, and G60. The genotypes of this group included only the rest of the Ardahan province genotypes. Group III included nine accessions of the forage pea (P. sativum ssp. arvense L.) landraces: G7, G6, G4, G5, G9, G10, G3, G2, and G8. Additionally, the genotypes of this group comprise the Erzurum province genotypes except G1, and half of the Bayburt province genotypes. The admixed group contained a total of 20 accessions of the forage pea (P. sativum ssp. arvense L.) landraces comprising G12, G32, G21, G38, G41, G19, G14, G29, G24, G43, G60, G42, G18, G23, G36, G13, G15, G16, G17, G11, and G1. The genotypes of this group cover all the provinces examined in the study. Our findings revealed that, despite being gathered from various geographical and topographic regions throughout Turkey, there was no evidence of a place of origin association between these inclusions. According to Baloch et al. [13], population structure analysis divided the genotypes into three sub-populations at K = 3 and additional division occurred at K = 5, indicating that all landraces are genetically descended from five subpopulations. Based on the 37 alleles dispersed among 12 EST-SSR loci, Teshome et al. [14] deduced that (K = 9) populations can include all individuals from the 46 accessions with the highest likelihood. Wang et al. [58] identified three subpopulations among 256 pea genotypes. Although it was primarily modeled to measure the quantity of allelic fixation due to genetic alteration, the forage pea (P. sativum ssp. arvense L.) landrace sub-populations varied for Fst (a measure of population differentiation due to genetic structure), which was determined to observe the relation within alleles drawn at varying scales of a hierarchically sub-divided population. Non-differentiation and perfect differentiation between an initial population and its sub-populations are shown by Fst values of 0 and 1, respectively. The Fst ranges from 0 to 0.05 show little genetic differentiation, while the ranges from 0.05 to 0.15, 0.15 to 0.25, and above 0.25, respectively, indicate moderate, large, and very substantial genetic differentiation [59]. According to these data, the FST (F-statistic) value was determined to be 0.2351, 0.3838, and 0.2506 in the first, second, and third sub-populations, respectively, and the mean Fst (F-statistic) value of 0.2898 confirmed the segregation of all subpopulations and the diversity in SSR alleles (Table 6). For genetic differentiation based on Fst values among three forage pea sub-populations, sub-populations B and C were found to be the most diverse populations with a value of 0.1087 (Table 6 and Table 7). However, genetic variation in subpopulations A, B, and C in our study was moderate, very large, and large respectively. Expected heterozygosity values varied between 0.2581 (sub-population B) and 0.3223 (sub-population C) with an average value of 0.2924 (Table 6).

4. Conclusions

In northeastern Anatolia, especially in Erzurum, Bayburt, Ardahan, Kars, and Giresun, fodder pea is a plant that has been grown for many years both for hay and for animal feed grains. The straw, grain, and straw of fodder peas are a source of food and energy for livestock and are an alternative to barley and vetch in animal nutrition. Due to the superior properties of fodder peas, many studies in Turkey have made great efforts in recent years to develop new high-yielding varieties using local or introduced fodder pea materials and emphasized the diversity of pea genotypes based on agro-morphological traits, micro and macro nutrients and morphological markers, and protein mineral content [60,61,62,63,64]. Although fodder pea genotypes collected from the eastern Black Sea region have previously been characterized, fodder pea ecotypes from the northeastern Anatolia region of Turkey have not been genetically characterized before. In addition, there have been few studies on forage pea germplasm native species in Turkey. Therefore, these are important first steps to a better understanding and maintenance of the forage pea germplasm of the region. Genomic SSRs, selected on the basis of high polymorphism information content, successfully assisted in the differentiation of genotypes in this study, resulting in successful amplifications of expected sizes. To the best of our knowledge, few studies have investigated genetic diversity and association among Turkish forage pea native species using SSR markers.
Consequently, this study focusing on local fodder pea varieties collected from the northeastern Anatolia region of Turkey was evaluated at the molecular level with the SSR marker system. Landraces act as sources of new genes and represent higher intra- and inter-variation that increase their importance in breeding programs. Recent efforts to sample plant genetic resources from farmers will result in greater diversity for use in breeding. The collection of crop biodiversity is often associated with native species grown in non-industrial agricultural areas. This study reveals the importance of taking inventory of local native varieties. In addition, through marker-assisted selective breeding programs, they can provide support for the effective selection and use of available accessions, allowing better participation selection in molecular breeding programs for the development of fodder pea. In addition, for the long-term breeding program of forage pea, there is a need to convert the identified genes into the Kompetitive Allele Specific PCR assay. The results of this study indicate genetic inbreeding among Turkish fodder pea germplasm grown in the northeastern Anatolia region of Turkey.

Supplementary Materials

The following supporting information can be downloaded at: https://www.mdpi.com/article/10.3390/genes13061086/s1. Figure S1: Gel images of SSR Marker within genotypes, band order from right to left: M (DNA Ladder), G1...and G61.

Author Contributions

K.H. and A.T. Concept; K.H. and A.T. Design; K.H., M.T. and P.P. Resources; K.H. Materials; A.T. and K.H. Data collection and/or processing; P.P. Data validation; A.T. Analysis and/or interpretation; A.T. and K.H. Literature search; A.T. Writing; K.H. and P.P. Critical reviews; P.P. Project administration and funding acquisition. All authors have read and agreed to the published version of the manuscript.

Funding

P.P. expresses his gratitude for the support of the iASK Research Grant. The authors thank the Helsinki University Library for supporting open-access publication.

Institutional Review Board Statement

Not applicable.

Informed Consent Statement

Not applicable.

Data Availability Statement

Data is contained within the article.

Acknowledgments

Open access funding provided by University of Helsinki.

Conflicts of Interest

The authors have no conflict of interest to declare.

References

  1. Acikbas, S.; Ozyazici, M.A.; Bektas, H. Root system architecture and seed weight relations in forage pea (Pisum sativum ssp. arvense L. Poir.). Cienc. Rural 2021, 52. [Google Scholar] [CrossRef]
  2. Bishnoi, R.; Marker, S.; Kumar, K.Y.; Taranum, S.A. Genetic Variability Parameters for Quantitative Traits in Farmers’ Pea (Pisum sativum var. arvense L.) Varieties. Biol. Forum Int. J. 2021, 13, 320–325. [Google Scholar]
  3. Gregory, E.; Shana, F.; Hans, K.; Julie, P.; Michael, W.; Janet, K.; Kenneth, H. Field Pea Production A1166 (Revised); N.D.S.U. Extension Service: Fargo, ND, USA, 2016; pp. 1–6. [Google Scholar]
  4. Ceyhan, E.; Avci, M.A. Combining ability and heterosis for grain yield and some yield components in pea (Pisum sativum L.). Pak. J. Biol. Sci. 2005, 8, 1447–1452. [Google Scholar]
  5. Acikgoz, E.; Ustun, A.; Gul, I.; Anlarsal, E.; Tekeli, A.; Nizam, I.; Avcioglu, R.; Geren, H.; Cakmakci, S.; Aydinoglu, B. Genotype x environment interaction and stability analysis for dry matter and seed yield in field pea (Pisum sativum L.). Span. J. Agric. Res. 2009, 7, 96–106. [Google Scholar] [CrossRef] [Green Version]
  6. Addisu, F.; Shumet, T. Variability, heritability and genetic advance for some yield and yield related traits in barley (Hordeum vulgare L.) landraces in Ethiopia. Int. J. Plant Breed. Genet. 2015, 9, 68–76. [Google Scholar] [CrossRef] [Green Version]
  7. Alzahib, R.H.; Migdadi, H.M.; Ghamdi, A.A.A.; Alwahibi, M.S.; Afzal, M.; Elharty, E.H.; Alghamdi, S.S. Exploring genetic variability among and within hail tomato landraces based on sequence-related amplified polymorphism markers. Diversity 2021, 13, 135. [Google Scholar] [CrossRef]
  8. Corrado, G.; Caramante, M.; Piffanelli, P.; Rao, R. Genetic diversity in Italian tomato landraces: Implications for the development of a core collection. Sci. Hortic. 2014, 168, 138–144. [Google Scholar] [CrossRef]
  9. Brondani, C.; Borba, T.C.O.; Rangel, P.H.N.; Brondani, R.P.V. Determination of genetic variability of traditional varieties of Brazilian rice using microsatellite markers. Genet. Mol. Biol. 2006, 29, 676–684. [Google Scholar] [CrossRef]
  10. Ceccarelli, S. Landraces: Importance and use in breeding and environmentally friendly agronomic systems. In Agrobiodiversity Conservation: Securing the Diversity of Crop Wild Relatives and Landraces; CAB International: Wallingford, UK, 2012; p. 103. [Google Scholar]
  11. Gixhari, B.; Pavelkova, M.; Ismaili, H.; Vrapi, H.; Jaupi, A.; Smýkal, P. Genetic diversity of Albanian pea (Pisum sativum L.) landraces assessed by morphological traits and molecular markers. Czech J. Genet. Plant Breed. 2014, 50, 177–184. [Google Scholar] [CrossRef] [Green Version]
  12. Singh, S.; Singh, B.; Sharma, V.R.; Kumar, M.; Sirohi, U. Assessment of Genetic Diversity and Population Structure in Pea (Pisum sativum L.) Germplasm based on Morphological Traits and SSR Markers. Legume Res. 2021, 4751, 1–7. [Google Scholar] [CrossRef]
  13. Baloch, F.S.; Alsaleh, A.; de Miera, L.E.S.; Hatipoğlu, R.; Çiftçi, V.; Karaköy, T.; Yıldız, M.; Özkan, H. DNA based iPBS-retrotransposon markers for investigating the population structure of pea (Pisum sativum) germplasm from Turkey. Biochem. Syst. Ecol. 2015, 61, 244–252. [Google Scholar] [CrossRef]
  14. Teshome, A.; Bryngelsson, T.; Dagne, K.; Geleta, M. Assessment of genetic diversity in Ethiopian field pea (Pisum sativum L.) accessions with newly developed EST-SSR markers. BMC Genet. 2015, 16, 102. [Google Scholar] [CrossRef] [PubMed] [Green Version]
  15. Demirkol, G.; Yilmaz, N. Forage pea (Pisum sativum var. arvense L.) landraces reveal morphological and genetic diversities. Turk. J. Bot. 2019, 43, 331–342. [Google Scholar] [CrossRef]
  16. Zeinalzadehtabrizi, H.; Hosseinpour, A.; Aydin, M.; Haliloglu, K. A modified genomic DNA extraction method from leaves of sunflower for PCR based analyzes. J. Biodivers. Environ. Sci. 2015, 7, 222–225. [Google Scholar]
  17. Zong, X.-X.; Guan, J.-P.; Wang, S.-M.; Liu, Q.-C.; Redden, R.R.; Ford, F. Genetic diversity and core collection of aliens Pisum sativum L. germplasm. Acta Agron. Sin. 2008, 34, 1518–1528. [Google Scholar]
  18. Smýkal, P.; Hýbl, M.; Corander, J.; Jarkovský, J.; Flavell, A.J.; Griga, M. Genetic diversity and population structure of pea (Pisum sativum L.) varieties derived from combined retrotransposon, microsatellite and morphological marker analysis. Theor. Appl. Genet. 2008, 117, 413–424. [Google Scholar] [CrossRef]
  19. Zong, X.; Redden, R.J.; Liu, Q.; Wang, S.; Guan, J.; Liu, J.; Xu, Y.; Liu, X.; Gu, J.; Yan, L. Analysis of a diverse global Pisum sp. collection and comparison to a Chinese local P. sativum collection with microsatellite markers. Theor. Appl. Genet. 2009, 118, 193–204. [Google Scholar] [CrossRef]
  20. Zong, X.X.; Ford, R.; Redden, R.R.; Guan, J.P.; Wang, S.M. Identification and analysis of genetic diversity structure within Pisum genus based on microsatellite markers. Agric. Sci. China 2009, 8, 257–267. [Google Scholar] [CrossRef]
  21. Cieslarová, J.; Smýkal, P.; Dočkalová, Z.; Hanáček, P.; Procházka, S.; Hýbl, M.; Griga, M. Molecular evidence of genetic diversity changes in pea (Pisum sativum L.) germplasm after long-term maintenance. Genet. Resour. Crop Evol. 2011, 58, 439–451. [Google Scholar] [CrossRef]
  22. Hosseinpour, A.; Karahan, F.; İlhan, E.; İlçim, A.; Haliloğlu, K. Genetic structure and diversity of Adonis L. (Ranunculaceae) populations collected from Turkey by inter-primer binding site (iPBS) retrotransposon markers. Turk. J. Bot. 2019, 43, 585–596. [Google Scholar] [CrossRef]
  23. Liu, K.; Muse, S.V. PowerMarker: An integrated analysis environment for genetic marker analysis. J. Bioinform. 2005, 21, 2128–2129. [Google Scholar] [CrossRef] [PubMed] [Green Version]
  24. Yeh, F.C.; Yang, R.; Boyle, T.B.; Ye, Z.; Mao, J.X. POPGENE, the user-friendly shareware for population genetic analysis. Mol. Biol. Biotechnol. Cent. Univ. Alta. Can. 1997, 10, 295–301. [Google Scholar]
  25. Dice, L.R. Measures of the amount of ecologic association between species. Ecology 1945, 26, 297–302. [Google Scholar] [CrossRef]
  26. Rohlf, F.J. An empirical comparison of three ordination techniques in numerical taxonomy. Syst. Zool. 1972, 21, 271–280. [Google Scholar] [CrossRef]
  27. Peakall, R.; Smouse, P.E. GENALEX 6: Genetic analysis in Excel. Population genetic software for teaching and research. Mol. Ecol. Notes 2006, 6, 288–295. [Google Scholar] [CrossRef]
  28. Pritchard, J.K.; Stephens, M.; Rosenberg, N.A.; Donnelly, P. Association mapping in structured populations. Am. J. Hum. Genet. 2000, 67, 170–181. [Google Scholar] [CrossRef] [Green Version]
  29. Evanno, G.; Regnaut, S.; Goudet, J. Detecting the number of clusters of individuals using the software STRUCTURE: A simulation study. Mol. Ecol. 2005, 14, 2611–2620. [Google Scholar] [CrossRef] [Green Version]
  30. Earl, D.A.; VonHoldt, B.M. STRUCTURE HARVESTER: A website and program for visualizing STRUCTURE output and implementing the Evanno method. Conserv. Genet. Resour. 2012, 4, 359–361. [Google Scholar] [CrossRef]
  31. Loridon, K.; McPhee, K.; Morin, J.; Dubreuil, P.; Pilet-Nayel, M.L.; Aubert, G.; Rameau, C.; Baranger, A.; Coyne, C.; Lejeune-Henaut, I. Microsatellite marker polymorphism and mapping in pea (Pisum sativum L.). Theor. Appl. Genet. 2005, 111, 1022–1031. [Google Scholar] [CrossRef]
  32. Smýkal, P.; Horáček, J.; Dostálová, R.; Hýbl, M. Variety discrimination in pea (Pisum sativum L.) by molecular, biochemical and morphological markers. J. Appl. Genet. 2008, 49, 155–166. [Google Scholar] [CrossRef]
  33. Nasiri, J.; Haghnazari, A.; Saba, J. Genetic diversity among varieties and wild species accessions of pea (Pisum sativum L.) based on SSR markers. Afr. J. Biotechnol. 2009, 8, 15. [Google Scholar]
  34. Zhuang, X.; McPhee, K.E.; Coram, T.E.; Peever, T.L.; Chilvers, M.I. Development and characterization of 37 novel EST-SSR markers in Pisum sativum (Fabaceae). Appl. Plant Sci. 2013, 1, 1200249. [Google Scholar] [CrossRef] [PubMed]
  35. Burstin, J.; Deniot, G.; Potier, J.; Weinachter, C.; Aubert, G.; Barranger, A. Microsatellite polymorphism in Pisum sativum. Plant Breed. 2001, 120, 311–317. [Google Scholar] [CrossRef]
  36. Gong, Y.-M.; Xu, S.-C.; Mao, W.-H.; Hu, Q.-Z.; Zhang, G.-W.; Ding, J.; Li, Y.-D. Developing new SSR markers from ESTs of pea (Pisum sativum L.). J. Zhejiang Univ. Sci. B 2010, 11, 702–707. [Google Scholar] [CrossRef] [PubMed] [Green Version]
  37. Cupic, T.; Tucak, M.; Popovic, S.; Bolaric, S.; Grljusic, S.; Kozumplik, V. Genetic diversity of pea (Pisum sativum L.) genotypes assessed by pedigree, morphological and molecular data. J. Food Agric. Environ. 2009, 7, 343–348. [Google Scholar]
  38. Ford, R.; Le Roux, K.; Itman, C.; Brouwer, J.B.; Taylor, P.W. Diversity analysis and genotyping in Pisum with sequence tagged microsatellite site (STMS) primers. Euphytica 2002, 124, 397–405. [Google Scholar] [CrossRef]
  39. Baranger, A.; Aubert, G.; Arnau, G.; Lainé, A.; Deniot, G.; Potier, J.; Weinachter, C.; Lejeune-Henaut, I.; Lallemand, J.; Burstin, J. Genetic diversity within Pisum sativum using protein-and PCR-based markers. Theor. Appl. Genet. 2004, 108, 1309–1321. [Google Scholar] [CrossRef]
  40. Haghnazari, A.; Samimifard, R.; Najafi, J.; Mardi, M. Genetic diversity in pea (Pisum sativum L.) accessions detected by sequence tagged microsatellite markers. J. Genet. Plant Breed. 2005, 59, 145. [Google Scholar]
  41. Tar’an, B.; Zhang, C.; Warkentin, T.; Tullu, A.; Vandenberg, A. Genetic diversity among varieties and wild species accessions of pea (Pisum sativum L.) based on molecular markers, and morphological and physiological characters. Genome 2005, 48, 257–272. [Google Scholar] [CrossRef]
  42. Choudhury, P.; Tanveer, H.; Dixit, G. Identification and detection of genetic relatedness among important varieties of pea (Pisum sativum L.) grown in India. Genetica 2007, 130, 183–191. [Google Scholar] [CrossRef]
  43. Sarikamis, G.; Yanmaz, R.; Ermis, S.; Bakir, M.; Yuksel, C. Genetic characterization of pea (Pisum sativum) germplasm from Turkey using morphological and SSR markers. Genet. Mol. Res. 2010, 9, 591–600. [Google Scholar] [CrossRef] [PubMed]
  44. Cömertpay, G.; Baloch, F.S.; Kilian, B.; Ülger, A.C.; Özkan, H. Diversity assessment of Turkish maize landraces based on fluorescent labelled SSR markers. Plant Mol. Biol. Rep. 2012, 30, 261–274. [Google Scholar] [CrossRef]
  45. Handerson, C.; Noren, S.; Wricha, T.; Meetei, N.; Khanna, V.; Pattanayak, A.; Datt, S.; Choudhury, P.R.; Kumar, M. Assessment of genetic diversity in pea (Pisum sativum L.) using morphological and molecular markers. Indian J. Genet. Plant Breed. 2014, 74, 205. [Google Scholar] [CrossRef]
  46. Jain, S.; Kumar, A.; Mamidi, S.; McPhee, K. Genetic diversity and population structure among pea (Pisum sativum L.) cultivars as revealed by simple sequence repeat and novel genic markers. Mol. Biotechnol. 2014, 56, 925–938. [Google Scholar] [CrossRef]
  47. Cieslarová, J.; Hýbl, M.; Griga, M.; Smýkal, P. Molecular analysis of temporal genetic structuring in pea (Pisum sativum L.) cultivars bred in the Czech Republic and in former Czechoslovakia since the mid-20th century. Czech J. Genet. Plant Breed. 2012, 48, 61–73. [Google Scholar] [CrossRef] [Green Version]
  48. Ahmad, S.; Kaur, S.; Lamb-Palmer, N.D.; Lefsrud, M.; Singh, J. Genetic diversity and population structure of Pisum sativum accessions for marker-trait association of lipid content. Crop J. 2015, 3, 238–245. [Google Scholar] [CrossRef] [Green Version]
  49. Prakash, N.; Kumar, R.; Choudhary, V.; Singh, C.M. Molecular assessment of genetic divergence in pea genotypes using microsatellite markers. Legume Res. Int. J. 2016, 39, 183–188. [Google Scholar] [CrossRef] [Green Version]
  50. Nisar, M.; Khan, A.; Wadood, S.F.; Shah, A.A.; Hanci, F. Molecular characterization of edible pea through EST-SSR markers. Turk. J. Bot. 2017, 41, 338–346. [Google Scholar] [CrossRef]
  51. Wu, X.; Li, N.; Hao, J.; Hu, J.; Zhang, X.; Blair, M.W. Genetic diversity of Chinese and global pea (Pisum sativum L.) collections. Crop Sci. 2017, 57, 1574–1584. [Google Scholar] [CrossRef]
  52. Uysal, H.; Acar, Z.; Ayan, I.; Kurt, O. Genetic diversity of Turkish Lathyrus L. landraces using ISSR markers. Genetika 2018, 50, 395–402. [Google Scholar] [CrossRef] [Green Version]
  53. Rana, J.C.; Rana, M.; Sharma, V.; Nag, A.; Chahota, R.K.; Sharma, T.R. Genetic diversity and structure of pea (Pisum sativum L.) germplasm based on morphological and SSR markers. Plant Mol. Biol. Rep. 2017, 35, 118–129. [Google Scholar] [CrossRef]
  54. Hegay, S.; Geleta, M.; Bryngelsson, T.; Gustavsson, L.; Persson-Hovmalm, H.; Ortiz, R. Comparing genetic diversity and population structure of common beans grown in Kyrgyzstan using microsatellites. Sci. J. Crop Sci. 2012, 1, 63–75. [Google Scholar]
  55. Blair, M.W.; Soler, A.; Cortes, A.J. Diversification and population structure in common beans (Phaseolus vulgaris L.). PLoS ONE 2012, 7, e49488. [Google Scholar] [CrossRef] [Green Version]
  56. Mohammadi, S.A.; Prasanna, B. Analysis of genetic diversity in crop plants—salient statistical tools and considerations. Crop Sci. 2003, 43, 1235–1248. [Google Scholar] [CrossRef] [Green Version]
  57. Klaedtke, S.; Jacques, M.A.; Raggi, L.; Préveaux, A.; Bonneau, S.; Negri, V.; Chable, V.; Barret, M. Terroir is a key driver of seed-associated microbial assemblages. Environ. Microbiol. 2016, 18, 1792–1804. [Google Scholar] [CrossRef] [Green Version]
  58. Wang, F.; Yang, T.; Burlyaeva, M.; Li, L.; Jiang, J.; Fang, L.; Redden, R.; Zong, X. Genetic diversity of grass pea and its relative species revealed by SSR markers. PLoS ONE 2015, 10, e0118542. [Google Scholar]
  59. Cho, G.T.; Lee, J.R.; Moon, J.K.; Yoon, M.S.; Baek, H.J.; Kang, J.H.; Kim, T.S.; Paek, N.C. Genetic diversity and population structure of Korean soybean landrace [Glycine max (L.) Merr.]. J. Crop. Sci. Biotechnol. 2008, 11, 83–90. [Google Scholar]
  60. Harmankaya, M.; Özcan, M.M.; Karadaş, S.; Ceyhan, E. Protein and mineral contents of pea (Pisum sativum L.) genotypes grown in Central Anatolian region of Turkey. South-West. J. Hortic. Biol. Environ. 2010, 1, 159–165. [Google Scholar]
  61. Hanci, F.; Cebeci, E. Determination of morphological variability of different pisum genotypes using principal component analysis. Legum. Res. 2019, 42, 162–167. [Google Scholar] [CrossRef] [Green Version]
  62. Hanci, F. Genetic variability in peas (Pisum sativum L.) from Turkey assessed with molecular and morphological markers. Folia Hortic. 2019, 31, 101–116. [Google Scholar] [CrossRef] [Green Version]
  63. Demirbas, A. Micro and macronutrients diversity in Turkish pea (Pisum sativum) germplasm. Int. J. Agric. Biol. 2018, 20, 701–710. [Google Scholar]
  64. Ton, A.; Mart, D.; Karaköy, T.; Türkeri, M.; Torun, A.A.; Anlarsal, A.E. Characterization of some local pea (Pisum sativum L.) genotypes for agro-morphological traits and mineral concentrations. Turk. J. Agric. For. 2022, 46, 245–256. [Google Scholar] [CrossRef]
Figure 1. Geographic distribution of forage pea landraces collected from various geographical provinces in the northeastern Anatolia region of Turkey.
Genes 13 01086 g001
Figure 2. UPGMA dendrogram of 61 forage peas (P. sativum ssp. arvense L.) landrace accessions based on 28 SSR markers.
Genes 13 01086 g002
Figure 3. PCoA of forage pea (P. sativum ssp. arvense L.) landrace accessions.
Genes 13 01086 g003
Figure 4. Delta K value proposing the presence of three populations of forage pea genotypes using iPBS-retrotransposons marker system.
Genes 13 01086 g004
Figure 5. The population structure pattern for the highest ΔK value, K = 3, of 61 forage pea (P. sativum ssp. arvense L.) landrace accessions based on 28 SSR markers.
Genes 13 01086 g005
Table 1. List of forage pea (P. sativum ssp. arvense L.) by collection and coordinates.
Code NumberAssociation NoLocationLatitudeLongitudeAltitude (m)
G1Ovaçevirme-1Erzurum39.19.57 N41.47.51 E1586
G2Ovaçevirme-2Erzurum39.19.57 N41.47.51 E1586
G3Ovaçevirme-3Erzurum39.19.57 N41.47.51 E1586
G4Ovaçevirme-4Erzurum39.19.57 N41.47.51 E1586
G5Ovaçevirme-5Erzurum39.19.57 N41.47.51 E1586
G6Şenkaya MerkezErzurum40.33.27 N42.20.37 E1826
G7İncili-1Bayburt40.23.24 N40.12.16 E1579
G8İncili-2Bayburt40.23.22 N40.12.14 E1578
G9İncili-3Bayburt40.23.22 N40.12.14 E1575
G10ÇiğdemtepeBayburt40.19.50 N40.08.16 E1564
G11ArpalıBayburt40.21.56 N40.06.17 E1538
G12AşağıkırzıBayburt40.23.23 N40.08.48 E1535
G13Değirmencik-1Bayburt40.21.29 N40.14.30 E1532
G14Değirmencik-2Bayburt40.21.29 N40.14.30 E1532
G15Ardahan Merkez-1Ardahan41.09.45 N42.56.15 E1905
G16Ardahan Merkez-2Ardahan41.09.45 N42.56.15 E1905
G17Ardahan Merkez-3Ardahan41.09.45 N42.56.15 E1905
G18Çamlıçatak-1Ardahan41.07.42 N42.49.59 E1798
G19Çamlıçatak-2Ardahan41.07.42 N42.49.59 E1798
G20SulakyurtArdahan41.09.50 N42.36.59 E1920
G21Döşeli-1Ardahan41.08.59 N42.44.45 E1815
G22Döşeli-2Ardahan41.08.59 N42.44.45 E1815
G23KartalpınarArdahan41.08.59 N42.44.45 E2063
G24TepelerArdahan41.03.51 N42.34.30 E2044
G25OburcakArdahan41.20.59 N42.52.10 E2100
G26SeyitörenArdahan41.23.18 N42.48.35 E2224
G27SerhatArdahan41.20.31 N42.85.11 E1950
G28CumhuriyetArdahan41.20.57 N42.52.16 E1922
G29BurmadereArdahan41.18.09 N42.47.05 E2044
G30TepeköyArdahan41.20.50 N42.48.26 E2076
G31SelamverdiArdahan41.14.06 N42.51.44 E1810
G32OrtakentArdahan41.13.45 N42.56.05 E1819
G33YamçılıArdahan42.20.29 N42.80.12 E2034
G34KoyunpınarıArdahan41.14.20 N42.46.40 E1860
G35ÇayağzıArdahan41.11.34 N42.51.02 E1813
G36AvcılarArdahan41.15.02 N42.49.33 E1801
G37ÖncülArdahan41.14.18 N43.09.59 E1793
G38AşağıcambazArdahan41.14.41 N43.24.10 E2044
G39EşmepınarArdahan41.06.50 N43.09.07 E1889
G40EskibeyrehatunArdahan41.07.42 N42.57.30 E2040
G41KaşlıkayaArdahan41.09.38 N43.04.12 E1857
G42SazlısuArdahan41.06.16 N43.06.58 E1913
G43KenarbelArdahan41.11.26 N43.09.53 E1788
G44TahtakıranArdahan40.30.32 N42.35.23 E2042
G45DedekılıçArdahan40.51.45 N42.33.31 E2040
G46YiğitkonağıArdahan40.57.16 N42.34.04 E2048
G47Çayırbaşı-1Ardahan40.52.24 N43.37.56 E2045
G48Çayırbaşı-2Ardahan40.52.24 N43.37.56 E2045
G49BalçeşmeArdahan40.49.54 N42.49.29 E2165
G50SubatanKars40.36.12 N43.26.07 E1788
G51DoğruyolKars41.03.00 N43.20.10 E2031
G52PaslıKars40.17.05 N42.57.32 E1838
G53YolgeçmezKars40.25.07 N42.45.11 E1898
G54IğdırKars40.21.12 N42.45.11 E1815
G55GölbaşıKars40.76.57 N42.98.47 E2015
G56Yukarışallıpınar-1Kars40.43.63 N42.61.42 E2081
G57Yukarışallıpınar-2Kars40.43.63 N42.61.42 E2081
G58SarvanGiresun40.53.03 N38.27.19 E266
G59Görele-1Giresun41.01.54 N39.00.04 E24
G60Görele-2Giresun41.01.54 N39.00.04 E24
G61Giresun MerkezGiresun40.52.07 N38.23.38 E18
Table 2. Twenty-eight SSR primers for genetic diversity analysis among forage pea (P. sativum ssp. arvense L.) landrace accessions.
Primer No.Marker NameForward (5′–3′)Backward (5′–3′)
1PB14GAGTGAGCTTTTTAGCTTGCAGCCTTGCTTGAGAACAGTGACTCGCA
2PSAA18CTGTAGACCAAGCCCAAAAGATTGAGACACTTTTGACAAGGAGG
3PSAA175TTGAAGGAACACAATCAGCGACTGCGCACCAAACTACCATAATC
4PSAC58TCCGCAATTTGGTAACACTGCGTCCATTTCTTTTATGCTGAG
5PSAC75CGCTCACCAAATGTAGATGATAATCATGCATCAATGAAAGTGATAAA
6PSAA219ATTTGTGCAATTGCAATTTCATTCGAAAACGCTTTGCATCCTA
7PSAD83CACATGAGCGTGTGTATGGTAAGGGATAAGAAGAGGGAGCAAAT
8PSAD270CTCATCTGATGCGTTGGATTAGAGGTTGGATTTGTTGTTTGTTG
9PSAA456TGTAGAAGCATAAGAGCGGGTGTGCAACGCTCTTGTTGATGATT
10PSAB23TCAGCCTTTATCCTCCGAACTAGAACCCTTGTGCAGAAGCATTA
11PSAB47TCCACAATACCATCTAAATGCCAAATTTGTTCAGTTGAAATTTCGTTTC
12PSAA497TTGTGACTGATTTAGAAGTTTCCCACTTGATGAGTTGCAATTTCGTTTC
13PSAD280TGGTGCTCGTGATTAATTTCACATAACTAAACAACCAACTGCCAAAACTG
14PSAB72ATCTCATGTTCAACTTGCAACCTTTATTCAAAACACGCAAGTTTTCTGA
15PSAB109GAACCCTTGTGTAGAAGCATTTGTGGAGCTACTGTGAGTCTGATGCCATTAT
16PSAB141ATCCCAATACTCCCACCAATGTTAGACTTAGGCTTCCCTTCTACGACTT
17PSAB161CTCAAGTGAAGACTTGGAATTTCGTTTTTGGTCTTCCTCAAGTGATAAGATG
18AD100TACACCCAAGACGACAAGCCTGGAGCTTCCGCTTGATTCTCT
19AD134TTTATTTTTCCATATATTACAGACCCGACACCTTTATCTCCCGAAGACTTAG
20AA303GGGTGAAGGAAAATCGTGAGCATCCCATAAAATTGGTTCT
21AA315AGTGGGAAGTAAAAGGTGTAGTTTCACTAGATGATATTTCGTT
22AA-67CCCATGTGAAATTCTCTTGAAGAGCATTTCACTTGATGAAATTTCG
23AA-321CTGCAGCCTGTACAAGTGGCCAGTTACAAGATTGATGTTTATGG
24AD-186TCAATGACGTGTTGATCGAGGACCATGCTTTGCACCGAAAGTAA
25AA-278CCAAGAAAGGCTTATCAACAGGTGCTTGTGTCAAGTGATCAGTG
26A-9GTGCAGAAGCATTTGTTCAGATCCCACATATATTTGGTTGGTCA
27AD-141AATTTGAAAGAGGCGGATGTGACTTCTCTCCAACATCCAACGA
28AD-237AGATCATTTGGTGTCATCAGTGTGTTTAATACAACGTGCTCCTC
Table 3. Genetic diversity indices of forage pea (P. sativum ssp. arvense L.) landrace accessions.
MarkerNaMafOb-HetEx-HetGDhneIPIC
PB142.000.570.850.490.490.491.960.680.37
PSAA184.000.430.410.620.620.622.601.070.54
PSAA1755.000.570.420.620.620.622.621.200.58
PSAC585.000.370.490.760.740.754.071.470.70
PSAC753.000.510.580.610.600.602.520.990.52
PSAA2194.000.600.040.560.540.542.190.970.48
PSAD833.000.440.130.630.620.622.661.030.55
PSAD2703.000.530.330.560.600.552.240.910.52
PSAA4563.000.590.130.520.510.512.050.810.42
PSAB233.000.450.530.650.640.642.781.060.57
PSAB473.000.530.440.600.600.602.480.990.52
PSAA4973.000.800.230.340.330.341.510.550.28
PSAD2803.000.370.080.670.660.662.971.090.59
PSAB723.000.480.220.620.610.622.601.010.53
PSAB1092.000.750.000.380.380.381.600.560.30
PSAB1413.000.520.090.540.540.542.160.840.43
PSAB1613.000.520.190.550.550.552.200.860.45
AD1002.000.540.000.510.500.502.000.690.37
AD1343.000.650.040.500.470.501.990.790.38
AA3032.000.670.000.440.440.441.790.630.34
AA3152.000.880.000.220.220.221.270.370.19
AA-672.000.560.000.500.490.491.970.690.37
AA-3212.000.890.000.220.200.211.270.370.18
AD-1862.000.530.000.500.500.501.990.690.37
AA-2782.000.980.000.150.030.151.180.290.03
A-92.000.980.000.030.030.031.030.080.03
AD-1413.000.670.060.470.460.461.860.730.38
AD-2374.000.570.770.610.600.602.511.110.55
Mean2.890.600.220.500.490.492.150.810.41
Na: Observed Number of alleles, Maf: major allele frequency, Obs-Het: observed heterozygosity, Exp-Het: Expected heterozygosity, GD: Gene diversity, h: Nei’s expected heterozygosity, ne: Effective number of alleles, I: Shannon’s Information index, PIC: Polymorphism information content.
Table 4. AMOVA of forage pea (P. sativum ssp. arvense L.) landrace accessions.
SourceDegree of Freedom (DF)Sum of Squares (SS)Variance Component% Of Total Variancep-Value
Among Population478.521.40180.18
Within Population56351.066.26820.001
Total60429.597.67100-
Table 5. PCoA analysis of forage pea (P. sativum ssp. arvense L.) landrace accessions.
Axis123
%21.5916.6713.28
Cum %21.5938.2651.54
Table 6. Heterozygosity and Fst values of forage pea (P. sativum ssp. arvense L.) landrace accession sub-populations.
Sub-Population (K)Expected HeterozygosityFst Value
A0.29690.2351
B0.25810.3838
C0.32230.2506
Mean0.29240.2898
Table 7. Genetic differentiation based on Fst values among forage pea (P. sativum ssp. arvense L.) landrace accession sub-populations identified by population structure analysis.
Sub-Populations (K)Sub-Population ASub-Population BSub-Population C
Sub-population A-0.10240.0690
Sub-population B0.1024-0.1087
Sub-population C0.06900.1087-
Publisher’s Note: MDPI stays neutral with regard to jurisdictional claims in published maps and institutional affiliations.

