
Microbial Richness of Marine Biofilms Revealed by Sequencing Full-Length 16S rRNA Genes


Abstract
:
1. Introduction
2. Methods
2.1. Biofilm and Seawater Sampling
2.2. DNA Extraction, PCR, and Sequencing
2.3. Data Correction and Filtration
2.4. Data Analysis
3. Results
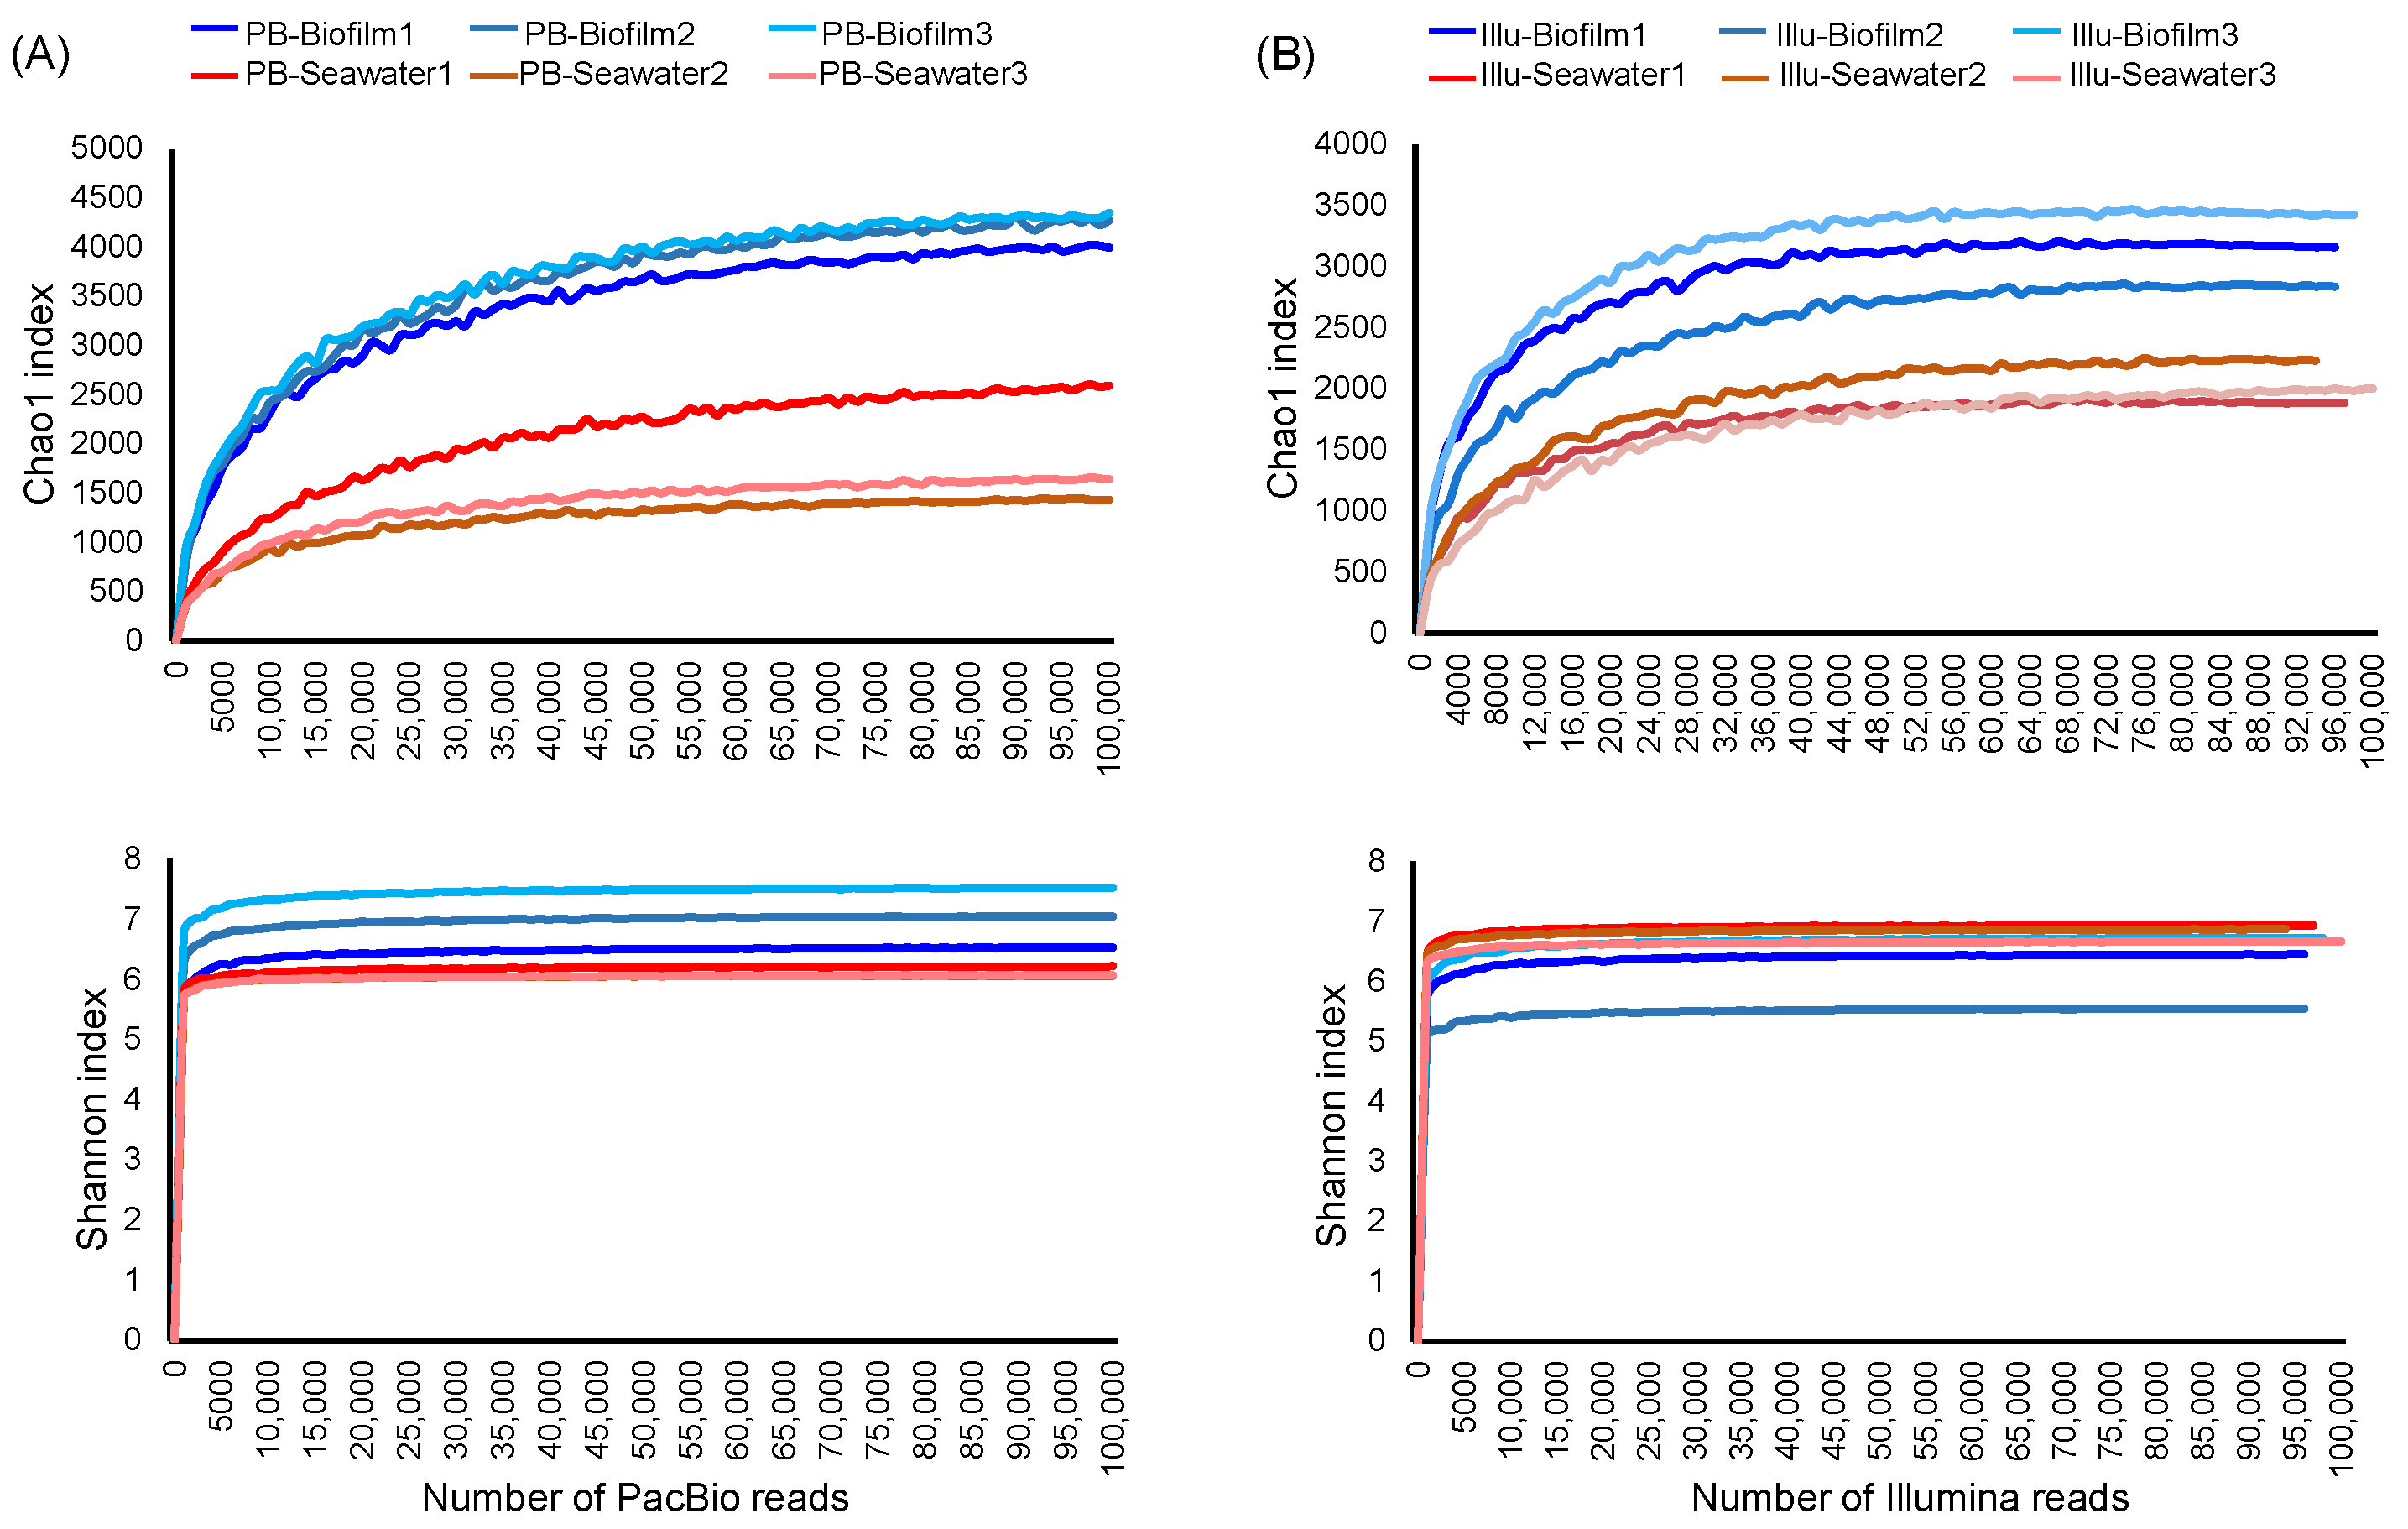
3.1. Richness, Diversity, and Rarefaction Curves
3.2. PCoA
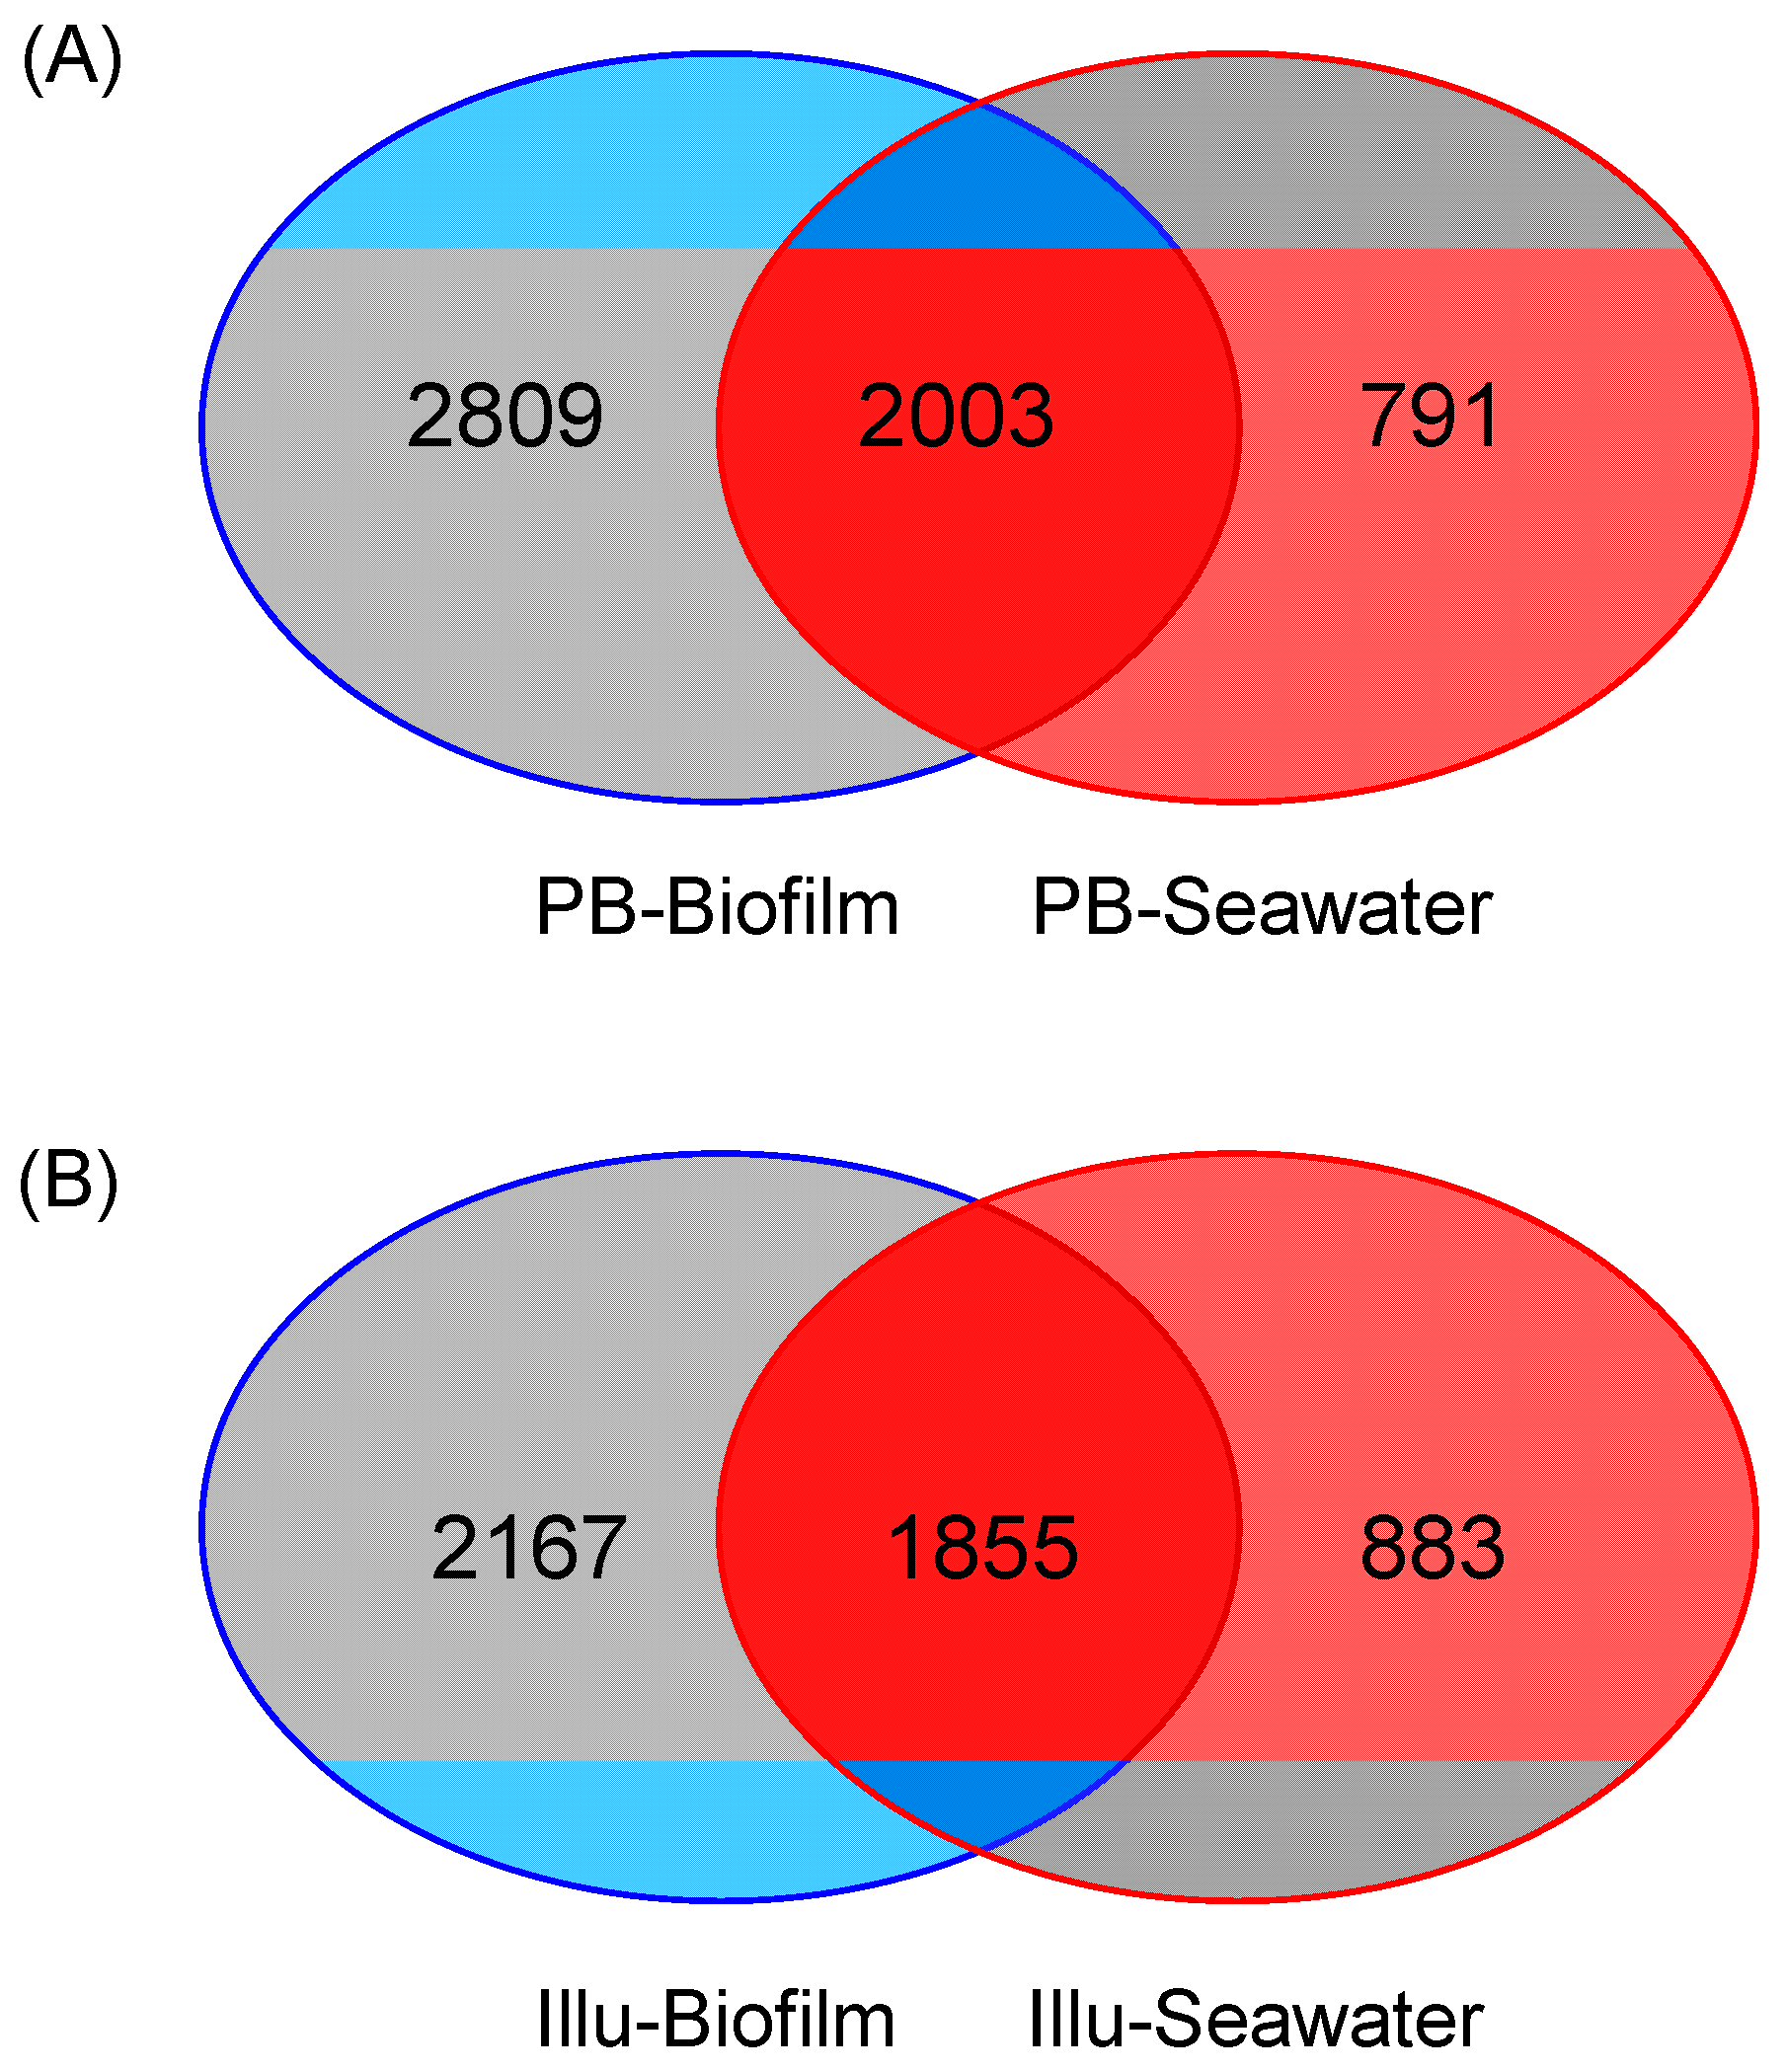
3.3. Venn Analysis
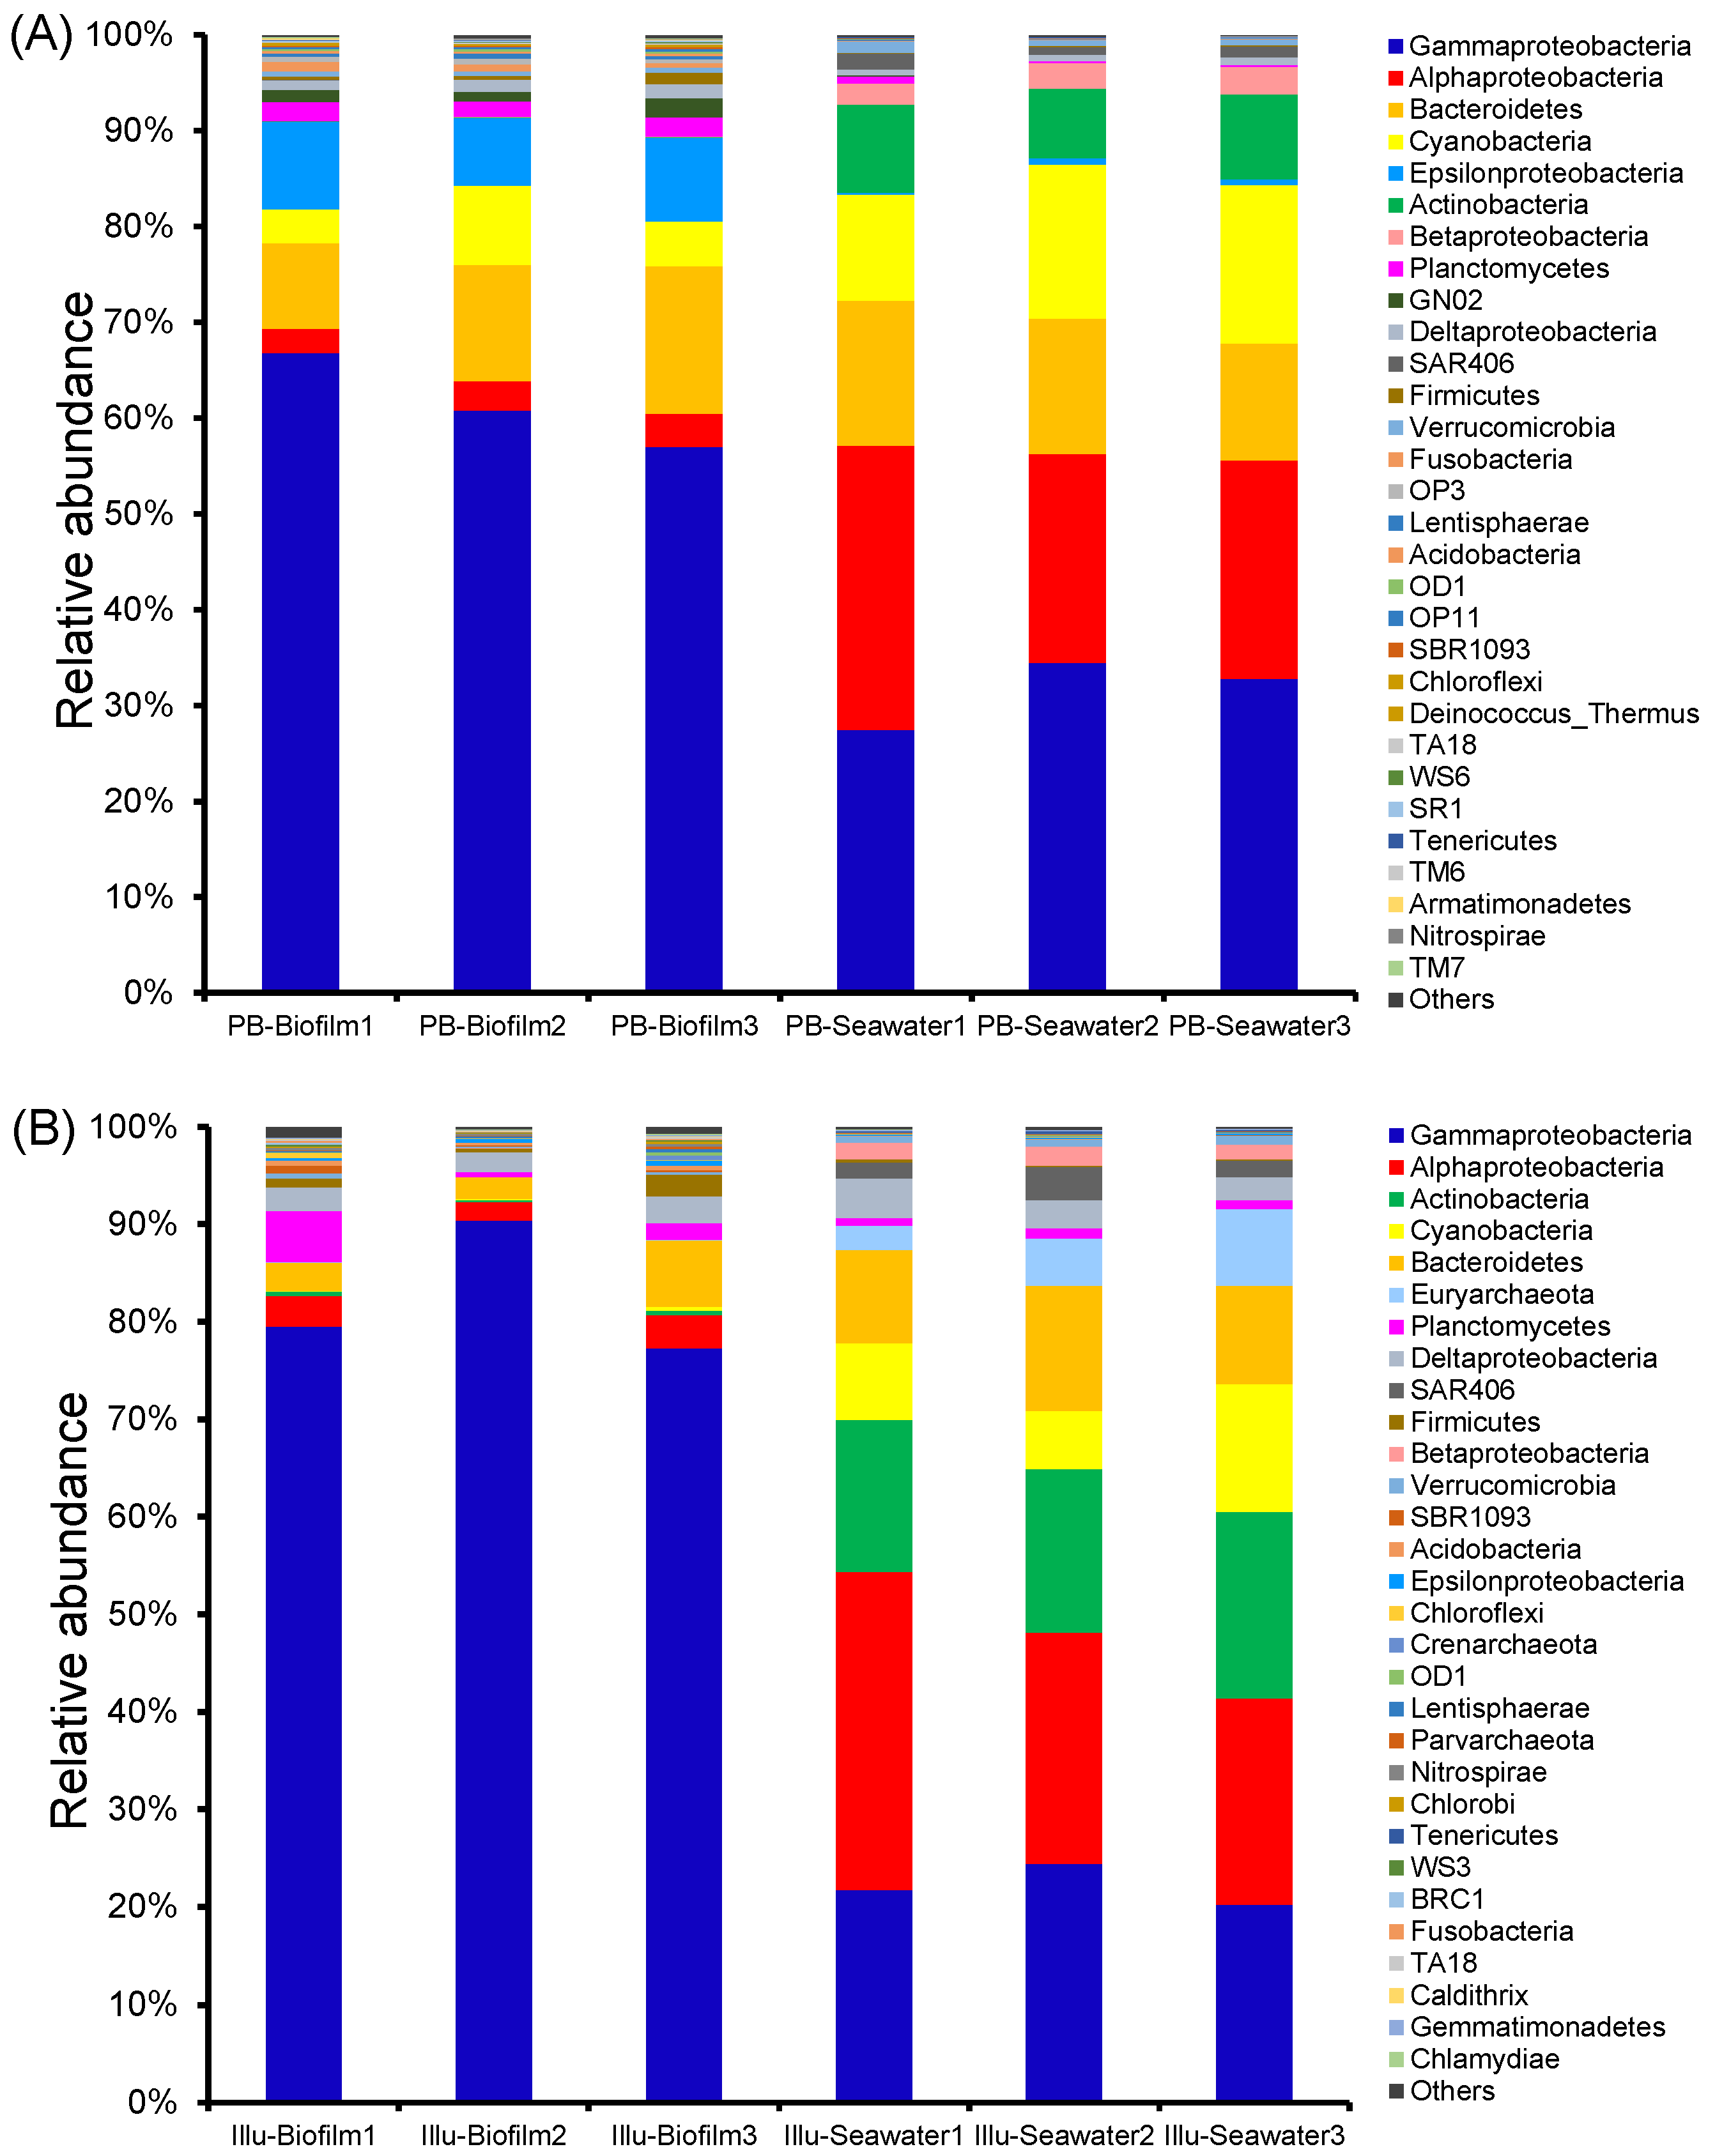
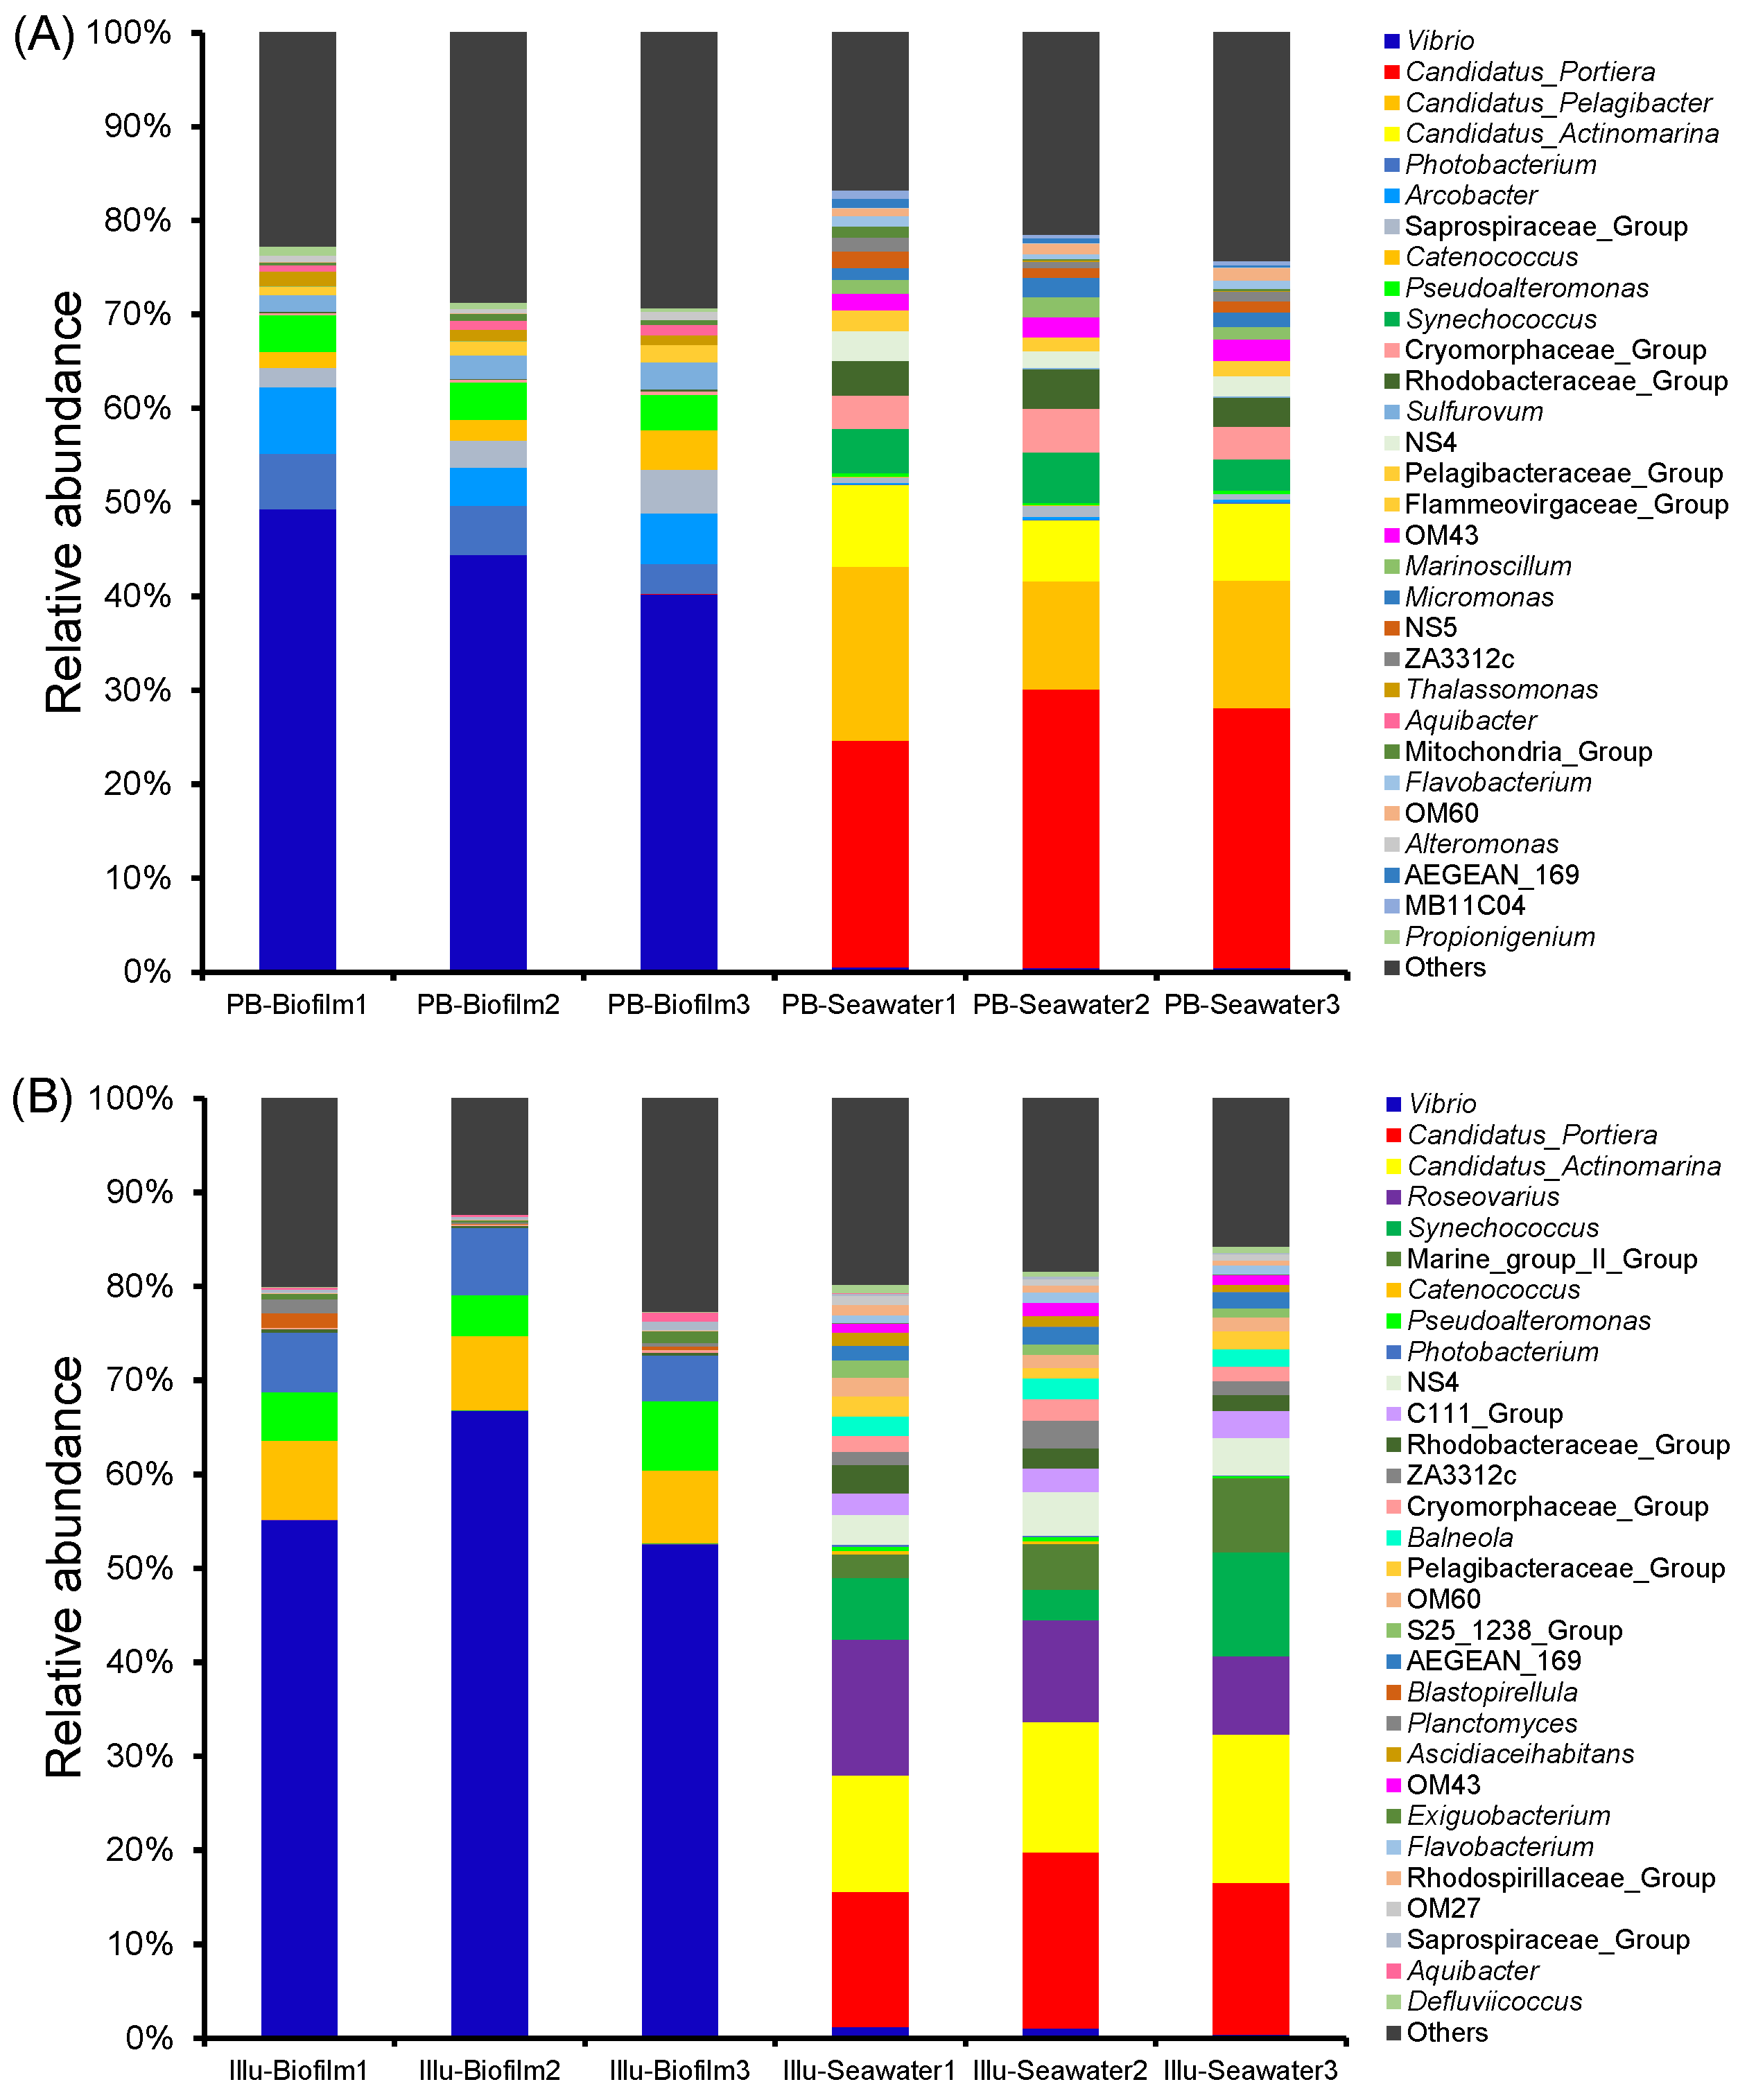
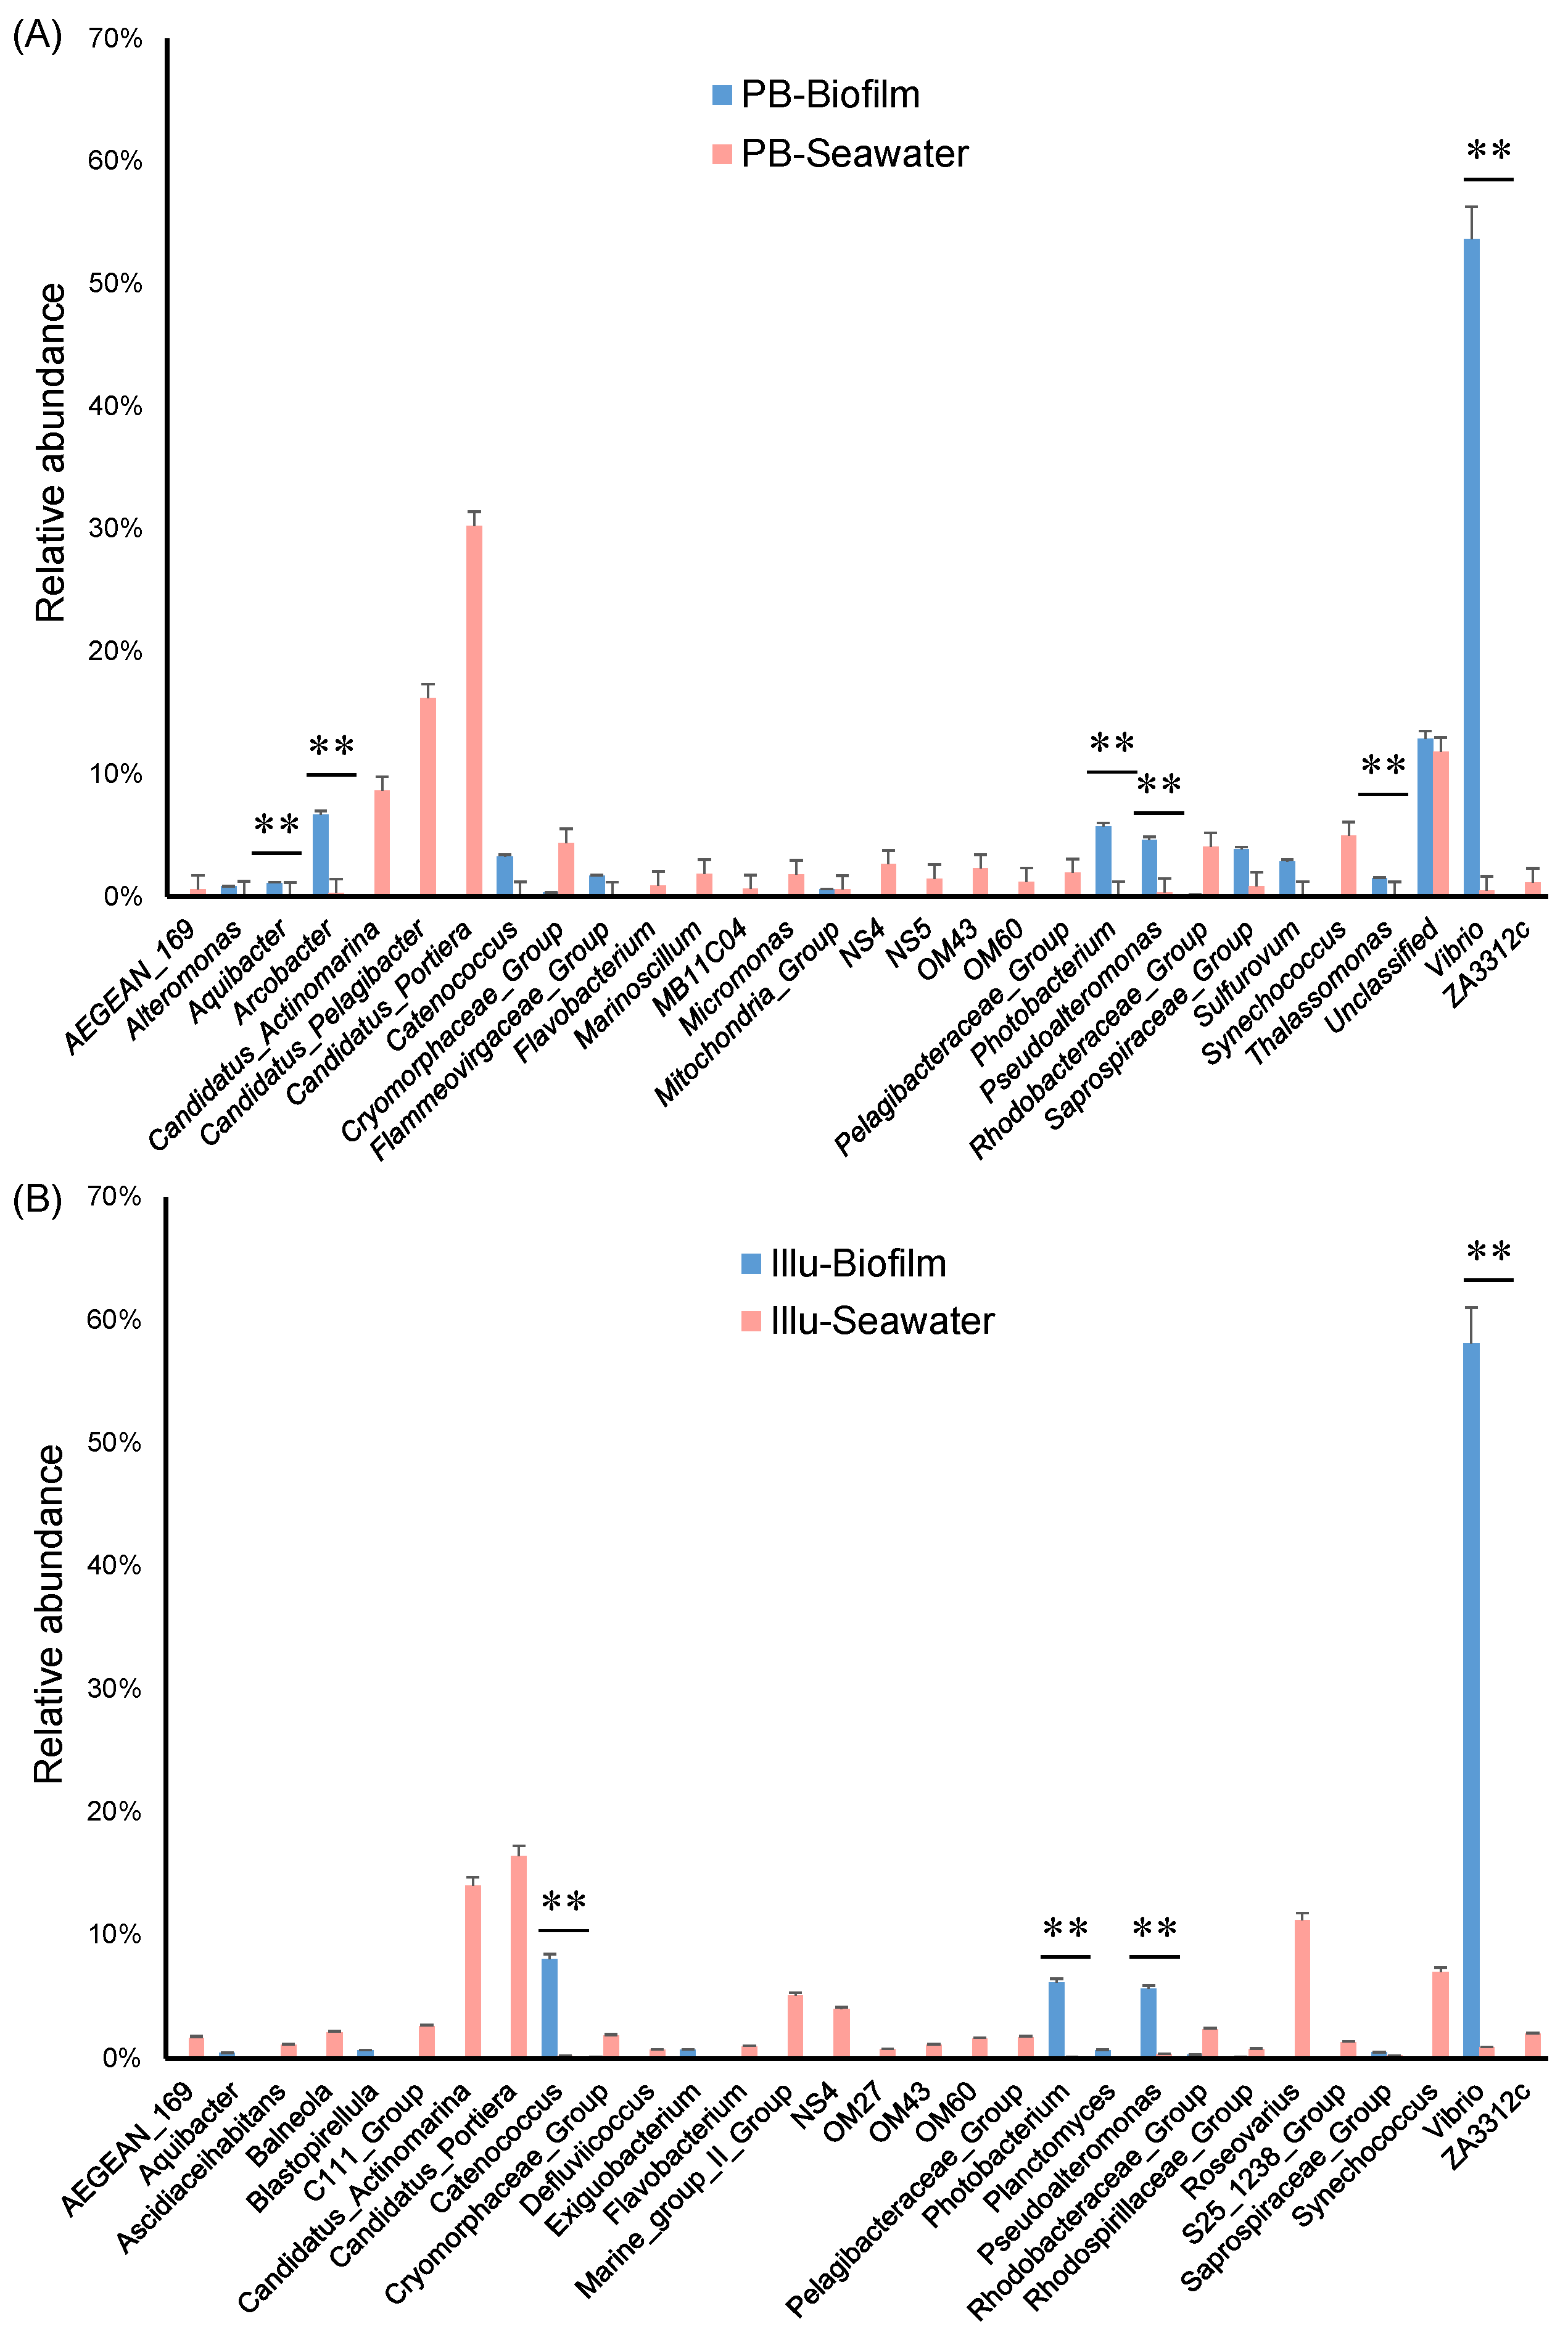
3.4. Taxonomic Composition
4. Discussion
5. Conclusions
Author Contributions
Funding
Institutional Review Board Statement
Informed Consent Statement
Data Availability Statement
Conflicts of Interest
References
- Azam, F.; Worden, A.Z. Microbes, molecules, and marine ecosystems. Science 2004, 303, 1622–1624. [Google Scholar] [CrossRef]
- Cavicchioli, R.; Ripple, W.J.; Timmis, K.N.; Azam, F.; Bakken, L.R.; Baylis, M.; Behrenfeld, M.J.; Boetius, A.; Boyd, P.W.; Classen, A.T.; et al. Scientists’ warning to humanity: Microorganisms and climate change. Nat. Rev. Microbiol. 2019, 17, 569–586. [Google Scholar] [CrossRef]
- Verde, C.; Giordano, D.; Bellas, C.M.; di Prisco, G.; Anesio, A.M. Polar marine microorganisms and climate change. Adv. Microb. Physiol. 2016, 69, 187–215. [Google Scholar] [CrossRef]
- Palit, K.; Rath, S.; Chatterjee, S.; Das, S. Microbial diversity and ecological interactions of microorganisms in the mangrove ecosystem: Threats, vulnerability, and adaptations. Environ. Sci. Pollut. Res. Int. 2022, 29, 32467–32512. [Google Scholar] [CrossRef]
- Hutchins, D.A.; Fu, F. Microorganisms and ocean global change. Nat. Microbiol. 2017, 2, 17058. [Google Scholar] [CrossRef]
- Salazar, G.; Sunagawa, S. Marine microbial diversity. Curr. Biol. 2017, 27, R489–R494. [Google Scholar] [CrossRef]
- Kaeberlein, T.; Lewis, K.; Epstein, S.S. Isolating “uncultivable” microorganisms in pure culture in a simulated natural environment. Science 2002, 296, 1127–1129. [Google Scholar] [CrossRef]
- Zhang, W.; Watanabe, H.K.; Ding, W.; Lan, Y.; Tian, R.-M.; Sun, J.; Chen, C.; Cai, L.; Li, Y.; Oguri, K.; et al. Gut microbial divergence between two populations of the hadal amphipod Hirondellea gigas. Appl. Environ. Microbiol. 2019, 85, e02032-18. [Google Scholar] [CrossRef]
- Hutchinson, N.; Nagarkar, S.; Aitchison, J.C.; Williams, G.A. Microspatial variation in marine biofilm abundance on intertidal rock surfaces. Aquat. Microb. Ecol. 2006, 42, 187–197. [Google Scholar] [CrossRef]
- Salta, M.; Wharton, J.A.; Blache, Y.; Stokes, K.R.; Briand, J.F. Marine biofilms on artificial surfaces: Structure and dynamics. Environ. Microbiol. 2013, 15, 2879–2893. [Google Scholar] [CrossRef]
- Zhang, W.; Ding, W.; Li, Y.X.; Tam, C.; Bougouffa, S.; Wang, R.; Pei, B.; Chiang, H.; Leung, P.; Lu, Y.; et al. Marine biofilms constitute a bank of hidden microbial diversity and functional potential. Nat. Commun. 2019, 10, 517. [Google Scholar] [CrossRef]
- Logares, R.; Sunagawa, S.; Salazar, G.; Cornejo-Castillo, F.M.; Ferrera, I.; Sarmento, H.; Hingamp, P.; Ogata, H.; de Vargas, C.; Lima-Mendez, G.; et al. Metagenomic 16S rDNA Illumina tags are a powerful alternative to amplicon sequencing to explore diversity and structure of microbial communities. Environ. Microbiol. 2014, 16, 2659–2671. [Google Scholar] [CrossRef]
- Fadeev, E.; Cardozo-Mino, M.G.; Rapp, J.Z.; Bienhold, C.; Salter, I.; Salman-Carvalho, V.; Molari, M.; Tegetmeyer, H.E.; Buttigieg, P.L.; Boetius, A. Comparison of two 16S rRNA primers (V3-V4 and V4-V5) for studies of Arctic microbial communities. Front. Microbiol. 2021, 12, 637526. [Google Scholar] [CrossRef]
- Hoshino, T.; Doi, H.; Uramoto, G.I.; Wormer, L.; Adhikari, R.R.; Xiao, N.; Morono, Y.; D’Hondt, S.; Hinrichs, K.U.; Inagaki, F. Global diversity of microbial communities in marine sediment. Proc. Natl. Acad. Sci. USA 2020, 117, 27587–27597. [Google Scholar] [CrossRef]
- Guo, K.; Wu, N.; Li, W.; Baattrup-Pedersen, A.; Riis, T. Microbial biofilm community dynamics in five lowland streams. Sci. Total Environ. 2021, 798, 149169. [Google Scholar] [CrossRef]
- Bukin, Y.S.; Galachyants, Y.P.; Morozov, I.V.; Bukin, S.V.; Zakharenko, A.S.; Zemskaya, T.I. The effect of 16S rRNA region choice on bacterial community metabarcoding results. Sci. Data 2019, 6, 190007. [Google Scholar] [CrossRef]
- Willis, C.; Desai, D.; LaRoche, J. Influence of 16S rRNA variable region on perceived diversity of marine microbial communities of the Northern North Atlantic. FEMS Microbiol. Lett. 2019, 366, fnz152. [Google Scholar] [CrossRef]
- Sun, Z.; Li, G.; Wang, C.; Jing, Y.; Zhu, Y.; Zhang, S.; Liu, Y. Community dynamics of prokaryotic and eukaryotic microbes in an estuary reservoir. Sci. Rep. 2014, 4, 6966. [Google Scholar] [CrossRef]
- Jordaan, K.; Bezuidenhout, C.C. Bacterial community composition of an urban river in the North West Province, South Africa, in relation to physico-chemical water quality. Environ. Sci. Pollut. Res. Int. 2016, 23, 5868–5880. [Google Scholar] [CrossRef]
- Cai, H.; Jiang, H.; Krumholz, L.R.; Yang, Z. Bacterial community composition of size-fractioned aggregates within the phycosphere of cyanobacterial blooms in a eutrophic freshwater lake. PLoS ONE 2014, 9, e102879. [Google Scholar] [CrossRef]
- Darwish, N.; Shao, J.; Schreier, L.L.; Proszkowiec-Weglarz, M. Choice of 16S ribosomal RNA primers affects the microbiome analysis in chicken ceca. Sci. Rep. 2021, 11, 11848. [Google Scholar] [CrossRef] [PubMed]
- Roesch, L.F.; Fulthorpe, R.R.; Riva, A.; Casella, G.; Hadwin, A.K.; Kent, A.D.; Daroub, S.H.; Camargo, F.A.; Farmerie, W.G.; Triplett, E.W. Pyrosequencing enumerates and contrasts soil microbial diversity. ISME J. 2007, 1, 283–290. [Google Scholar] [CrossRef]
- Hu, T.; Chitnis, N.; Monos, D.; Dinh, A. Next-generation sequencing technologies: An overview. Hum. Immunol. 2021, 82, 801–811. [Google Scholar] [CrossRef] [PubMed]
- Heather, J.M.; Chain, B. The sequence of sequencers: The history of sequencing DNA. Genomics 2016, 107, 1–8. [Google Scholar] [CrossRef] [PubMed]
- Zhang, J.; Su, L.; Wang, Y.; Deng, S. Improved high-throughput sequencing of the human oral microbiome: From Illumina to PacBio. Can. J. Infect. Dis. Med. Microbiol. 2020, 2020, 6678872. [Google Scholar] [CrossRef]
- Ji, B.; Zhang, X.; Zhang, S.; Song, H.; Kong, Z. Insights into the bacterial species and communities of a full-scale anaerobic/anoxic/oxic wastewater treatment plant by using third-generation sequencing. J. Biosci. Bioeng. 2019, 128, 744–750. [Google Scholar] [CrossRef]
- Marcel, M. Cutadapt removes adapter sequences from high-throughput sequencing reads. EMBnet. J. 2011, 17, 10–12. [Google Scholar] [CrossRef]
- Magoc, T.; Salzberg, S.L. FLASH: Fast length adjustment of short reads to improve genome assemblies. Bioinformatics 2011, 27, 2957–2963. [Google Scholar] [CrossRef]
- Bolyen, E.; Rideout, J.R.; Dillon, M.R.; Bokulich, N.A.; Abnet, C.C.; Al-Ghalith, G.A.; Alexander, H.; Alm, E.J.; Arumugam, M.; Asnicar, F.; et al. Reproducible, interactive, scalable and extensible microbiome data science using QIIME 2. Nat. Biotechnol. 2019, 37, 852–857. [Google Scholar] [CrossRef]
- Jing, G.; Sun, Z.; Wang, H.; Gong, Y.; Huang, S.; Ning, K.; Xu, J.; Su, X. Parallel-META 3: Comprehensive taxonomical and functional analysis platform for efficient comparison of microbial communities. Sci. Rep. 2017, 7, 40371. [Google Scholar] [CrossRef]
- Hammer, Ø.; Harper, D.A.T.; Ryan, P.D. PAST: Paleontological statistics software package for education and data analysis. Palaeontol. Electron. 2001, 4, 4–9. [Google Scholar]
- Tian, R.; Imanian, B. ASAP 2: A pipeline and web server to analyze marker gene amplicon sequencing data automatically and consistently. BMC Bioinform. 2022, 23, 27. [Google Scholar] [CrossRef]
- Ding, W.; Zhang, W.; Alikunhi, N.M.; Batang, Z.; Pei, B.; Wang, R.; Chen, L.; Al-Suwailem, A.; Qian, P.Y. Metagenomic analysis of zinc surface-associated marine biofilms. Microb. Ecol. 2019, 77, 406–416. [Google Scholar] [CrossRef] [PubMed]
- Wang, R.; Ding, W.; Long, L.; Lan, Y.; Tong, H.; Saha, S.; Wong, Y.H.; Sun, J.; Li, Y.; Zhang, W.; et al. Exploring the influence of signal molecules on marine biofilms development. Front. Microbiol. 2020, 11, 571400. [Google Scholar] [CrossRef] [PubMed]
- Wang, R.; Zhang, W.; Ding, W.; Liang, Z.; Long, L.; Wong, W.C.; Qian, P.Y. Profiling signal transduction in global marine biofilms. Front. Microbiol. 2021, 12, 768926. [Google Scholar] [CrossRef] [PubMed]
- Zhang, W.; Wang, Y.; Lee, O.O.; Tian, R.; Cao, H.; Gao, Z.; Li, Y.; Yu, L.; Xu, Y.; Qian, P.Y. Adaptation of intertidal biofilm communities is driven by metal ion and oxidative stresses. Sci. Rep. 2013, 3, 3180. [Google Scholar] [CrossRef] [PubMed]
- Stewart, P.S.; Franklin, M.J. Physiological heterogeneity in biofilms. Nat. Rev. Microbiol. 2008, 6, 199–210. [Google Scholar] [CrossRef]
- Zhou, Y.; Li, R.; Guo, B.; Zhang, L.; Zhang, H.; Xia, S.; Liu, Y. Three-dimension oxygen gradient induced low energy input for grey water treatment in an oxygen-based membrane biofilm reactor. Environ. Res. 2020, 191, 110124. [Google Scholar] [CrossRef]
- Zhang, W.; Ding, W.; Yang, B.; Tian, R.; Gu, S.; Luo, H.; Qian, P.Y. Genomic and transcriptomic evidence for carbohydrate consumption among microorganisms in a cold seep brine pool. Front. Microbiol. 2016, 7, 1825. [Google Scholar] [CrossRef]
- Zhang, W.; Wang, Y.; Bougouffa, S.; Tian, R.; Cao, H.; Li, Y.; Cai, L.; Wong, Y.H.; Zhang, G.; Zhou, G.; et al. Synchronized dynamics of bacterial niche-specific functions during biofilm development in a cold seep brine pool. Environ. Microbiol. 2015, 17, 4089–4104. [Google Scholar] [CrossRef]
- Matz, C.; McDougald, D.; Moreno, A.M.; Yung, P.Y.; Yildiz, F.H.; Kjelleberg, S. Biofilm formation and phenotypic variation enhance predation-driven persistence of Vibrio cholerae. Proc. Natl. Acad. Sci. USA 2005, 102, 16819–16824. [Google Scholar] [CrossRef] [PubMed]
- Silva, A.J.; Benitez, J.A. Vibrio cholerae biofilms and cholera pathogenesis. PLoS Negl. Trop. Dis. 2016, 10, e0004330. [Google Scholar] [CrossRef]
- Offret, C.; Desriac, F.; Le Chevalier, P.; Mounier, J.; Jegou, C.; Fleury, Y. Spotlight on antimicrobial metabolites from the marine bacteria Pseudoalteromonas: Chemodiversity and ecological significance. Mar. Drugs 2016, 14, 129. [Google Scholar] [CrossRef] [PubMed]
- Watts, G.S.; Youens-Clark, K.; Slepian, M.J.; Wolk, D.M.; Oshiro, M.M.; Metzger, G.S.; Dhingra, D.; Cranmer, L.D.; Hurwitz, B.L. 16S rRNA gene sequencing on a benchtop sequencer: Accuracy for identification of clinically important bacteria. J. Appl. Microbiol. 2017, 123, 1584–1596. [Google Scholar] [CrossRef]
- Sune, D.; Rydberg, H.; Augustinsson, A.N.; Serrander, L.; Jungestrom, M.B. Optimization of 16S rRNA gene analysis for use in the diagnostic clinical microbiology service. J. Microbiol. Methods 2020, 170, 105854. [Google Scholar] [CrossRef] [PubMed]
- O’Dea, C.; Huerlimann, R.; Masters, N.; Kuballa, A.; Veal, C.; Fisher, P.; Stratton, H.; Katouli, M. Microbial diversity profiling of gut microbiota of Macropus giganteus using three hypervariable regions of the bacterial 16S rRNA. Microorganisms 2021, 9, 1721. [Google Scholar] [CrossRef]
- Vlasceanu, L.; Sarbu, S.M.; Engel, A.S.; Kinkle, B.K. Acidic cave-wall biofilms located in the Frasassi Gorge, Italy. Geomicrobiol. J. 2000, 17, 125–139. [Google Scholar] [CrossRef]
- Baker, B.J.; Comolli, L.R.; Dick, G.J.; Hauser, L.J.; Hyatt, D.; Dill, B.D.; Land, M.L.; Verberkmoes, N.C.; Hettich, R.L.; Banfield, J.F. Enigmatic, ultrasmall, uncultivated Archaea. Proc. Natl. Acad. Sci. USA 2010, 107, 8806–8811. [Google Scholar] [CrossRef]
- Cao, S.; Zhang, W.; Ding, W.; Wang, M.; Fan, S.; Yang, B.; McMinn, A.; Wang, M.; Xie, B.B.; Qin, Q.L.; et al. Structure and function of the Arctic and Antarctic marine microbiota as revealed by metagenomics. Microbiome 2020, 8, 47. [Google Scholar] [CrossRef]
- Sunagawa, S.; Coelho, L.P.; Chaffron, S.; Kultima, J.R.; Labadie, K.; Salazar, G.; Djahanschiri, B.; Zeller, G.; Mende, D.R.; Alberti, A.; et al. Structure and function of the global ocean microbiome. Science 2015, 348, 1261359. [Google Scholar] [CrossRef]


| Sample | Clean Reads | OTU Number | Average OTU Number |
|---|---|---|---|
| PB-Biofilm1 | 140,859 | 3742 | 3851 |
| PB-Biofilm2 | 191,358 | 3874 | |
| PB-Biofilm3 | 178,835 | 3937 | |
| PB-Seawater1 | 154,650 | 1690 | 1399 |
| PB-Seawater2 | 130,362 | 1203 | |
| PB-Seawater3 | 126,329 | 1305 | |
| Illu-Biofilm1 | 97,651 | 2953 | 2867 |
| Illu-Biofilm2 | 97,487 | 2462 | |
| Illu-Biofilm3 | 99,715 | 3187 | |
| Illu-Seawater1 | 97,732 | 1692 | 1711 |
| Illu-Seawater2 | 96,248 | 1837 | |
| Illu-Seawater3 | 104,682 | 1606 |
Publisher’s Note: MDPI stays neutral with regard to jurisdictional claims in published maps and institutional affiliations. |
© 2022 by the authors. Licensee MDPI, Basel, Switzerland. This article is an open access article distributed under the terms and conditions of the Creative Commons Attribution (CC BY) license (https://creativecommons.org/licenses/by/4.0/).
Share and Cite
Wang, S.; Su, X.; Cui, H.; Wang, M.; Hu, X.; Ding, W.; Zhang, W. Microbial Richness of Marine Biofilms Revealed by Sequencing Full-Length 16S rRNA Genes. Genes 2022, 13, 1050. https://doi.org/10.3390/genes13061050
Wang S, Su X, Cui H, Wang M, Hu X, Ding W, Zhang W. Microbial Richness of Marine Biofilms Revealed by Sequencing Full-Length 16S rRNA Genes. Genes. 2022; 13(6):1050. https://doi.org/10.3390/genes13061050
Chicago/Turabian StyleWang, Shougang, Xiaoyan Su, Han Cui, Meng Wang, Xiaoli Hu, Wei Ding, and Weipeng Zhang. 2022. "Microbial Richness of Marine Biofilms Revealed by Sequencing Full-Length 16S rRNA Genes" Genes 13, no. 6: 1050. https://doi.org/10.3390/genes13061050
APA StyleWang, S., Su, X., Cui, H., Wang, M., Hu, X., Ding, W., & Zhang, W. (2022). Microbial Richness of Marine Biofilms Revealed by Sequencing Full-Length 16S rRNA Genes. Genes, 13(6), 1050. https://doi.org/10.3390/genes13061050