Abstract
There is a paradox in the plant mitochondrial genome, that is, the genic region evolves slowly while the intergenic region evolves rapidly. Thus, the intergenic regions of the plant mitochondrial genome are difficult to align across different species, even in closely related species. Here, to character the mechanism of this paradox, we identified interspecific variations in the Ginkgo biloba, Oryza sativa, and Arabidopsis thaliana mitochondrial and plastid genome at a genome-wide level. The substitution rate of synonymous sites in genic regions was similar to the substitution rate of intergenic regions, while the substitution rate of nonsynonymous sites in genic regions was lower than that in intergenic regions, suggesting the mutation inputs were the same among different categories within the organelle genome, but the selection pressure varied. The substitution rate of single-copy regions was higher than that of IR (inverted repeats) in the plastid genome at an intraspecific level. The substitution rate of single-copy regions was higher than that of repeats in the G. biloba and A. thaliana mitochondrial genomes, but lower in that of O. sativa. This difference may be related to the length and distribution of repeats. Copy number variations that existed in the G. biloba and O. sativa mitochondrial genomes were confirmed. This study reveals the intraspecific variation pattern of organelle genomes at a genome-wide level, and that copy number variations were common in plant mitochondrial genomes.
1. Introduction
The typical plant cell contains three relatively independent pieces of genetic information, including the nuclear genome, mitochondrial genome (mitogenome), and plastid genome. Compared with the intricated nuclear genome, the organelle genome is smaller and more suitable for investigating mutation mechanisms. Although the plastid and mitogenomes of seed plants are uniparentally inherited, in the high-energy environment, their synonymous substitution rates are far below than that of the nuclear genome and they differ significantly among different lineages []. The synonymous substitution rate of the plastid genome was three times higher than that of the mitogenome in angiosperms, while the synonymous substitution rate of the plastid genome was two times higher than that of the mitogenome in gymnosperms []. Exceptionally, the synonymous substitution rate of the mitogenome in some lineages (e.g., Silene, Plantago, Pelargonium, and Ajuga) have experienced highly accelerated substitution rates, even 100-fold higher than that in closely related species, as well as the synonymous substitution rate of the plastid genome in those lineages being coincidentally accelerated [,,,,,,,,]. However, the potential mechanism for the mutation of the organelle genome is still poorly understood.
In contrast to the slow synonymous substitution rate in the coding region, the plant mitogenome is notorious for its rapid variation in the noncoding region [,]. Plant mitogenomes range from 66 Kb to 12.4 Mb in size, and contain a large number of repeat sequences and unknown derived sequences [,]. Due to recombination and rearrangement, the mitogenome exhibits linear, branched, and circular structures or subgenomes in vivo [,]. Several different hypotheses have been proposed for this phenomenon of the plant mitogenome. Christensen [] compared the complete mitogenome of two ecotypes of Arabidopsis thaliana, and proposed that the repair mechanism accounts for the differences between the coding region and noncoding regions. However, Sloan, et al. [] revealed that the old version of the A. thaliana mitogenome contains many sequencing errors that may lead to inaccurate analysis. Subsequently, by comparing the transcribed region and non-transcribed region of a small part of the mitogenome among some legumes, Christensen [] examined that selection is the main factor responsible for the differences between the coding region and intergenic region. To reconcile the paradox of the plant mitogenome at a complete genome-wide level, Wu, et al. [] analyzed intraspecific variation of A. thaliana from the Arabidopsis 1001 Genome Project, and supported that selection is the main factor. However, those conclusions are mainly based on the investigation of A. thaliana or a small part of the mitogenome, and may not be general for many other species. Additionally, although previous studies have suggested that the size and structure of the plastid genome is less variable than that of the mitochondria, the size and structure of the plastid genome also varies among different taxa, and IR (inverted repeats) region expansion, contraction, or loss frequently occurs, even in close relatives [,,]. Therefore, more distant taxa need to be studied, and the variation mechanism of the plastid genome also needs to be paid attention to.
The rate of neutral substitutions is expected to equal the mutation rate, which is the fundamental premise of the neutral evolution theory []. Although synonymous substitutions may be selected by mRNA stability, translation efficiency, etc., and intergenic regions always contain mutational hotspots, they are always considered to be nearly neutral []. Thus, the substitution rates of synonymous sites and intergenic regions reflected the mutation input, whereas the nonsynonymous substitution rate always mirrored the degree of selective pressure. There were many methods for estimating the organelle substitution rate including phylogenetic methods, mutation accumulation lines, and population genetics [,]. Previous studies have chosen the phylogenetic method to estimate the substitution rate according to the DNA sequence among extant species, but substitution saturation may potentially affect the estimated substitution rate [,,,]. Due to the large variation in intergenic regions of plant organelle genomes, the intergenic regions of plant mitogenomes are especially characterized by a large amount of unknown origin sequences and repeats, which makes it difficult to compare it to the intergenic regions among species, even in closely related species []. Therefore, the phylogenetic methods only estimate the substitution rate of a small part of the plant mitogenome. By contrast, whole genome resequencing of mutation accumulation lines provides a chance to identify genome-wide variations in a defined number of generations in the laboratory. This method has been applied to estimate the substitution rate of yeast, Drosophila, and Caenorhabditis [,]. When Wu, et al. [] applied this method to estimating the variations of the mitogenome in mutation accumulation lines of A. thaliana after propagating 10 generations, there were no true variations under manual inspection. Compared with yeast and Drosophila, plants have both long generation times and a low substitution rate of the organelle genome. Thus, the mutation accumulation lines method does not seem to be applicable in plant organelles. Barnard-Kubow, et al. [] successfully employed the population genetics method to assess the intraspecific polymorphism in the plastid genome of Campanulastrum americanum. In addition, Wu, et al. [] estimated the variation of the mitogenome in A. thaliana at an intraspecific level. Therefore, population genetics may be the most compatible method to assess an intraspecific polymorphism of the plant organelle genome.
In this study, we analyzed the intraspecific variation of the organelle genomes of Ginkgo biloba, Oryza sativa, and A. thaliana, representing gymnosperms, monocots, and dicots, respectively. Furthermore, the driving factors of the differences in substitution rates between genic and intergenic regions were studied. Moreover, copy number variations within the mitogenomes were investigated.
2. Materials and Methods
2.1. Data Resource
To investigate the intraspecific variation of organelle genomes in different clades of seed plants, we selected G. biloba, O. sativa, and A. thaliana, of which population genomic data have been released, as representatives of gymnosperms, monocots, and dicots, respectively. The total genomic DNA sequencing data of 312 G. biloba individuals (PRJNA478810), 40 O. sativa individuals (PRJEB19404), and 1135 A. thaliana (PRJNA273563) individuals were downloaded from the NCBI (National Center for Biotechnology Information, https://www.ncbi.nlm.nih.gov/, accessed on 1 November 2020) (Table S1) [,,]. The sequence and its annotation files of mitochondrial and plastid genomes of G. biloba (NC_027976.1 and NC_016986.1), O. sativa (NC_011033.1 and NC_001320.1), and A. thaliana (NC_037304.1 and NC_000932.1) were also downloaded from the NCBI.
2.2. Identification of Intraspecific Variation in Organelle Genomes
The pipeline of the identification of intraspecific variation in organelle genomes followed Wu, et al. []. In order to reduce the impact of sequencing errors on the results, homologous sequences between the plastid and mitogenome, and homologous sequences between organelles and the nuclear genome, were underwent a series of strict quality control measures. The specific analysis process is as follows: First, Fastp v0.20.0 was used to perform quality control on the raw data of each accession, including removal of adapter sequences and low-quality bases []. Second, the MEM algorithm of BWA v0.7.17-r1188 was used to map the clean reads of each accession back to the mitochondrial and plastid reference genomes, and the primary SAM files were obtained []. Then, the SortSam tool included in GATK v4.0.12 was used to sort the primary SAM files by coordinate and convert them to BAM files. This was followed by indexing under the SAMtools v1.9 index command [,]. Third, the MarkDuplicates tool was used to locate and tag duplicate reads originating from a single DNA fragment, HaplotypeCaller, GenotypeGVCFs and SelectVariants tools were used to call SNPs and indels simultaneously from each accession. Subsequently, the VariantFiltration tool was used to hard-filter variant calls based on our strict criteria (QUAL < 60, QD < 20.0, FS > 10.0, MQ < 30.0) []. The filtered vcf file of each accession was merged into a total file using bcftools v1.9, and then a hard filter was performed again using the VariantFiltration tool to obtain the final results [,]. Finally, the ‘-TsTv-summary’ command of vcftools v0.1.16 was used to calculate a simple summary of all transition and transversion sites, and the ‘--freq2’ command was used to calculate the allele frequencies of each SNP and indel site [].
2.3. Annotation of Intraspecific Variation in Organelle Genomes
Based on the annotation files of the mitochondrial and plastid reference genomes, we extracted the site information of functional classifications, such as coding and noncoding regions of protein-coding genes, rRNA genes, tRNA genes, pseudogenes, repeats, etc. For the coding region of protein-coding genes, PAML v4.9 was used to classify them into non-synonymous substitution sites and synonymous substitution sites, according to the degeneracy of the codons [].
According to the above functional partitions, we annotated the intraspecific variation sites (SNPs and indels) of the mitochondrial and plastid genomes obtained in Section 2.2.
2.4. Estimation of Copy Number Variations within the Mitogenome
The copy number variation within the mitogenomes of G. biloba and O. sativa were estimated by calculating the mean coverage depth of non-overlapping windows of 1000 bp []. The analysis process is as follows: The ‘depth’ command of SAMtools v1.9 was used to process the sorted and indexed bam files in Section 2.2, obtain the sequencing depth of each site, and calculate the mean sequencing depth of each 1000 bp window []. Then, the maps of the mean sequencing depth of G. biloba and O. sativa were plotted by using the R v3.6.3 software.
3. Results
3.1. Intraspecific Variations in Mitochondrial Sequence
The intraspecific variations in mitochondrial sequence among 312 accessions of G. biloba, 40 accessions of O. sativa, and 1135 accessions of A. thaliana were identified at the genome-wide level. Although the number of accessions of the three species differed greatly, especially in O. sativa where there were only 40 accessions, but in order to cover the genetic diversity, samples from different populations were selected for analysis. Even though the size and representativeness affect the number of variations, the pattern among the different functional classifications within the organelle genome does not change.
A total of 303 high confidence SNPs (single nucleotide polymorphisms) and 139 indels (insertions and deletions) were identified across the mitogenome of G. biloba (Table 1). According to the function of the encoding products, the mitogenome of G. biloba was divided into coding regions of protein-coding genes, rRNA genes, tRNA genes, introns, and intergenic regions, and the lengths were 34,407 bp, 5006 bp, 1746 bp, 39,183 bp, and 266,202 bp, respectively. The coding regions of the protein-coding genes were also divided into nonsynonymous sites (25,519 bp) and synonymous sites (8888 bp). The number of SNPs in the above classifications were 28, 6, 2, 25, and 242. There were 20 and eight SNPs in nonsynonymous sites and synonymous sites of the coding regions of the protein-coding genes, respectively. Due to the different length of each classification, the SNP abundance of each functional region was calculated, from high to low, as follows: rRNA genes (0.0012 SNPs per site), tRNA genes (0.0011), intergenic and synonymous sites (0.0009), nonsynonymous sites (0.0008), and introns (0.0006). The SNP abundance of synonymous substitution sites was consistent with intergenic regions and may represent neutral evolution (Table 1, Figure 1a). In addition, these results suggested that rRNA and tRNA genes were under slightly positive selection, while nonsynonymous sites and introns were under slightly purified selection, or nearly neutral evolution as well. A total of 293 SNPs were in the G. biloba mitogenome after excluding the SNPs with more than two alleles, of which 204 SNPs were transitions and 89 SNPs were transversions, and the rate between transition and transversion was 2.29 (Table S2, Figure 2). Compared with the SNP content within the mitogenome, indels were only distributed in rRNA genes, introns, and intergenic regions, and their abundance was 0.0002 indels per site (one indel), 0.0003 (13 indels), and 0.0005 (125 indels), respectively. Additionally, as land plant mitogenomes usually contains a large number of repeats, we also calculated SNP and indel abundance of the single-copy sequence (318,455 bp) and repeats (28,089 bp), where SNP abundance was 0.0008 SNPs per site and 0.0015 SNPs per site, respectively, and indel abundance was 0.0004 indels per site, for both (Table 1). Compared with the SNP abundance of the intergenic region, single-copy sequence was more likely in neutral selection, while repeat sequences were under positive selection.

Table 1.
Intraspecific variations in mitogenomes s. SNPs: single nucleotide polymorphisms; MAF: minor allele frequency.
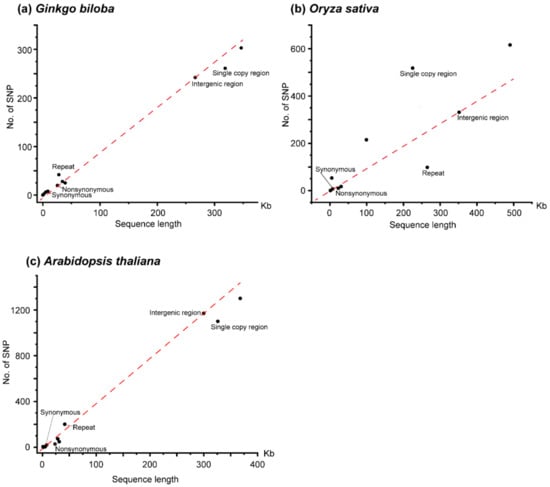
Figure 1.
Scatter plot of length and number of SNPs for different categories within mitogenome. (a) Ginkgo biloba, (b) Oryza sativa, (c) Arabidopsis thaliana. The red dotted line indicates the relationship between length and the number of SNPs in intergenic region. Nonsynonymous and synonymous indicates nonsynonymous sites and synonymous sites of the coding regions of protein-coding genes, respectively.
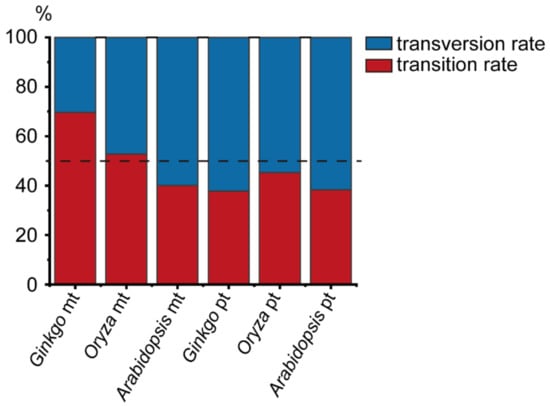
Figure 2.
Percentage of transition and transversion rates within the genome of organelles in three species. The mt indicates mitogenome; pt indicates plastid genome.
Compared to G. biloba, the introns and intergenic regions of the O. sativa mitogenome have expanded significantly, and two genes (rps11 and rps14) became pseudogenes []. The length of nonsynonymous sites in the coding region of protein-coding genes, synonymous sites in the coding region of protein-coding genes, rRNA genes, tRNA genes, pseudogenes, introns, and intergenic regions in the O. sativa mitogenome were 23,009 bp, 7738 bp, 5324 bp, 1471 bp, 1561 bp, 99,594 bp, and 351,823 bp, and the number of SNPs in each classification was 10, 7, 53, 0, 0, 215, and 331, respectively (Table 1). The SNP abundance of each category in the O. sativa mitogenome was rRNA genes 0.0100 SNPs per site, introns 0.0022, intergenic regions and synonymous sites 0.0009, nonsynonymous sites 0.0004, and there were no SNPs in tRNA genes and pseudogenes. These results indicated that each category in the O. sativa mitogenome was under a different selection pressure; for example, the synonymous sites were under neutral selection, while the nonsynonymous sites were under purified selection (Table 1, Figure 1b). Among the confident SNPs, there were 597 SNPs with two alleles, including 315 transitions and 282 transversions, and the rate between transition and transversion was 1.12 (Table S2, Figure 2). In contrast to single base variations, indels mainly occurred in rRNA genes, introns and intergenic regions, suggesting that the non-coding regions were subject to a lower selection pressure. In the O. sativa mitogenome, the amount of single-copy sequence (225,262 bp) and repeats (265,258 bp) accounts for nearly half. However, there were far more SNPs in single-copy region (518 SNPs, 0.0023 SNPs per sites) than in repeats (98 SNPs, 0.0004 SNPs per sites) (Table 1). This suggested that the evolution rate of repeats was significantly slower than that of the single-copy region.
We also re-analyzed the intraspecific variations of the A. thaliana mitogenome by our analysis pipeline. As we did not exclude accessions with the length of clean reads shorter than 50 bp, we obtained slightly more variations than that in Wu, et al. [] Compared with the G. biloba and O. sativa mitogenomes, the mitogenome of A. thaliana was similar to G. biloba in size, the length of intron, and the content of repeat sequence. The mitogenome of A. thaliana also encodes pseudogenes (matR). We also divided the mitogenome of A. thaliana into seven categories, and the length of nonsynonymous sites, synonymous sites, rRNA genes, tRNA genes, pseudogenes, introns, and intergenic regions were 23,381 bp, 7891 bp, 5222 bp, 1689 bp, 1256 bp, 28,422 bp, and 299,947 bp, respectively. We obtained 1,301 high confident SNPs from the mitogenome of A. thaliana, and there were 28, 20, 4, 0, 5, 74, and 1,170 SNPs in the above categories, respectively (Table 1). According to the SNP abundance, the order from the largest to smallest was pseudogenes (0.0040 SNPs per site), intergenic regions (0.0039), introns (0.0026), synonymous sites (0.0025), nonsynonymous sites (0.0012), rRNA genes (0.0008), and tRNA genes (0.0000). This suggested that the pseudogene was from nearly neutral evolution, while nonsynonymous sites, rRNA genes, and tRNA genes were under strong positive selection, and intron and synonymous sites were under slightly positive selection (Table 1, Figure 2). There were 519 transitions and 775 transversions in A. thaliana, and the rate between transition and transversion was much lower than that in G. biloba and O. sativa (Table S2, Figure 2). Compared with SNPs, there were only 220 indels, and they were mainly distributed in introns and intergenic regions, suggesting that indels were under a stronger purifying selection in the coding regions (Table 1). The total length of repeat sequences in the A. thaliana mitogenome was only 41,605 bp, accounting for 11.31%, while the total length of single-copy sequences was 326,203 bp, accounting for (88.69%). A total of 201 SNPs were identified from repeats with an abundance of 0.0048 SNPs per site, while 1,100 SNPs were obtained from the single-copy sequence with an abundance of 0.0034. The SNP abundance of single-copy sequence was similar to the intergenic regions, but the SNP abundance of repeats was larger than that of the intergenic region.
3.2. Intraspecific Variation in the Plastid Sequence
To compare the mutation pattern between the mitochondrial and plastid genomes, the intraspecific genetic diversity of the G. biloba, O. sativa, and A. thaliana plastid genomes were also analyzed at a genome-wide level. Since the typical structure of seed plants plastid genomes were tetrad-structures, including LSC (large single-copy region), SSC (small single-copy region), and IR (inverted repeat regions), and previous studies have shown that the evolution rate of IR regions is slower than that of single-copy regions (LSC and SSC) at an interspecific level [], not only the nucleotide polymorphisms of the entire plastid genome was analyzed, but those of LSC, SSC, and IR were also analyzed, respectively. Similar to the analysis of the mitogenome, the entire plastid genome, LSC, SSC, and IR were also divided into seven functional categories: nonsynonymous sites in the coding region of protein-coding genes, synonymous sites in the coding region of protein-coding genes, rRNA genes, tRNA genes, pseudogenes, introns, and intergenic regions.
In the G. biloba plastid genome, the length of nonsynonymous sites, synonymous sites, rRNA genes, tRNA genes, introns, and intergenic regions were 50,043 bp, 16,305 bp, 8925 bp, 10,778 bp, 6523 bp, and 64,414 bp, respectively. Some 31, 11, 4, 5, 3, and 98 high confident SNPs were identified in the above categories, respectively (Table 2). According to the SNP abundance of each category from high to low, the order was as follows: intergenic regions (0.0015 SNPs per site), synonymous sites (0.0007), nonsynonymous sites (0.0006), tRNA genes and introns (0.0005), and rRNA genes (0.0004). The SNP abundance of synonymous sites was similar to nonsynonymous sites, and both were much lower than that of the intergenic regions, suggesting that both synonymous sites and nonsynonymous sites were under a strong purifying selection. The SNP abundance in the intergenic regions of IR was 0.0005, which was much lower than that of LSC (0.0023) and SSC (0.0022). In the LSC region, the SNP abundance of nonsynonymous sites (0.0005) was equal to that of synonymous sites, and both were lower than that of the intergenic regions, suggesting the nonsynonymous and synonymous sites were both under strong selection. However, in the SSC region, the SNP abundance of synonymous sites (0.0020) was similar to that of the intergenic regions (0.0022), but larger than that of nonsynonymous sites (0.0013). This indicated that the nonsynonymous sites and synonymous sites in the protein-coding region were under a different selective pressure. As there were only 723 synonymous sites in the IR region, there was no polymorphism site. Interestingly, the SNP abundance of nonsynonymous sites of the inverted repeats was higher than that of the intergenic regions, so nonsynonymous sites may experience positive selection. Furthermore, there were 56 transitions and 92 transversions, with a rate between transition and transversion of 0.61 (Table S2, Figure 2). Additionally, there were 5, 3, and 49 indels in the protein-coding regions, tRNA genes and intergenic regions, respectively (Table 2). These indicated that the protein-coding regions were under a stronger selection pressure than that of intergenic regions.
Table 2.
Intraspecific variations in plastid genomes. SNPs: single nucleotide polymorphisms.
Compared with the G. biloba plastid genome, the size of the O. sativa plastid genome was much smaller, and the LSC and SSC regions were contracted, while the IR regions were expanded. Overall, the length of the nonsynonymous sites, synonymous sites, rRNA genes, tRNA genes, pseudogenes, introns, and intergenic regions were 44,295 bp, 14,524 bp, 9182 bp, 9346 bp, 883 bp, 10,615 bp, and 45,681 bp, respectively (Table 2). We identified 36, 24, 0, 1, 1, 5, and 64 high confident SNPs in the above categories. The SNP abundance of synonymous sites was 0.0017 SNPs per site, which was the highest across the plastid genome of O. sativa, slightly higher than that of intergenic region (0.0014), which means that it may experience nearly neural or mild selection. In contrast to the SNP abundance of introns (0.0005), that of pseudogenes (0.0011) were more closed to that of intergenic regions, suggesting introns may be under a stronger selection than pseudogenes. The SNP abundance of nonsynonymous sites (0.0008) was lower than that of synonymous sites and intergenic regions, indicating that the nonsynonymous sites were under a strong purifying selection. Besides, there were little polymorphism sites in the rRNA and tRNA genes. Surprisingly, there were no single base substitution sites in the IR region, either in the coding regions (i.e., nonsynonymous sites, synonymous sites) or intergenic regions. This suggested that the IR region may be in a very low evolution rate. Whether in LSC or SSC, the SNP abundance of the intergenic regions was greater than that of synonymous sites and much greater than that of nonsynonymous sites, indicating that synonymous sites and nonsynonymous sites were under a different purifying selective pressure. In the O. sativa plastid genome, there were 58 transition sites and 70 transversion sites, and the rate between transition and transversion was 0.83, which is higher than that of the G. biloba plastid genome (Table S2, Figure 2). In total, 110 indels were obtained, consistent with the pattern of G. biloba, with indels predominantly occurring in introns and intergenic regions (Table 2).
The size of the A. thaliana plastid genome is larger than that of O. sativa, and close to that of G. biloba. Compared with the G. biloba plastid genome, the IR regions were expanded and the single-copy regions (LSC and SSC) were contracted in the A. thaliana plastid genome. The complete plastid genome of A. thaliana was divided into nonsynonymous sites, synonymous sites, rRNA genes, tRNA genes, introns and intergenic regions, and the length of each category was 60,108 bp, 19,119 bp, 8929 bp, 10,233 bp, 12,711 bp, and 43,378 bp, respectively (Table 2). A total of 2330 high confident SNPs were identified, of which 376, 463, 1, 70, 217, and 1203 SNPs were in the above categories, respectively. The SNP abundance of each functional category from high to low was intergenic regions (0.0277 SNPs per site), synonymous sites (0.0242), introns (0.0171), tRNA genes (0.0068), nonsynonymous sites (0.0063), and rRNA genes (0.0001). As intergenic regions were in neutral evolution, the nonsynonymous sites may be under a strong purifying selection. The SNP abundance in the intergenic regions of LSC, SSC, and IR were 0.0581, 0.0471, and 0.0001. In LSC and SSC, the SNP abundance of synonymous sites was lower than that of the intergenic regions, and much higher than those of nonsynonymous sites. These indicated that the synonymous sites were under a mild purifying selection, while the nonsynonymous sites were under a much intensive selection. In the plastid genome of A. thaliana, there were 519 transition sites and 775 transversion sites, and the rate between transition and transversion is 0.62, which is lower than that of the O. sativa plastid genome (Table S2, Figure 2). In contrast to a single base nucleotide substitution, we obtained 695 indels in the A. thaliana plastid genome, and found that, similar to G. biloba and O. sativa, indels were mainly distributed in introns and the intergenic regions (Table 2).
3.3. Copy Number Variation within the Mitogenome
To verify the copy number variations within the mitogenome, three samples of G. biloba and O. sativa were randomly selected to calculate their sequencing depth, respectively. Compared with the copy number variations, based on three purified mtDNA (mitochondrial DNA) samples of A. thaliana and validated by ddPCR (Droplet Digital PCR) [], the sequencing depth variations within the G. biloba and O. sativa mitogenomes were also observed, suggesting copy number variations still existed in the G. biloba (Figure 3a–c) and O. sativa mitogenomes (Figure 3d–f).
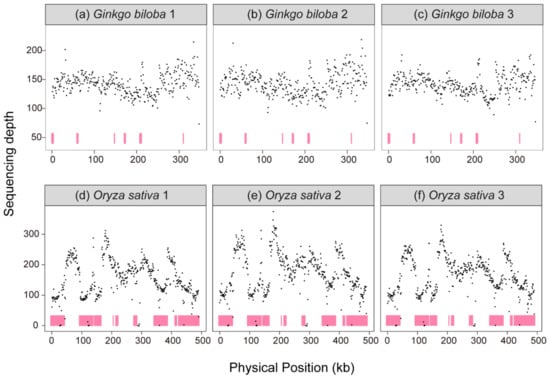
Figure 3.
Sequencing depth of mitogenome. (a) Ginkgo biloba individual 1, (b) G. biloba individual 2, (c) G. biloba individual 3, (d) Oryza sativa individual 1, (e) O. sativa individual 2, (f) O. sativa individual 3. Pink color indicates the repeat sequences in mitogenomes.
4. Discussion
4.1. Evolution Rates in Genic and Intergenic Regions of Plant Organelle Genomes
We quantitatively compared the difference of intraspecific variations among different categories within organelle genomes by sampling multiple individuals of three species (gymnosperms, G. biloba; monocots, O. sativa; and dicots, A. thaliana) from different plant lineages. Because the effective population size, generation time, and life history of the three species are different, we cannot directly compare the number of variations among them. Therefore, the differences in the evolutionary rates between genic and intergenic regions of organelle genomes in G. biloba, O. sativa, and A. thaliana were compared at the intraspecific level. Except for the plastid genome of G. biloba, the mitogenomes of G. biloba, O. sativa, and A. thaliana, as well as the plastid genomes of O. sativa and A. thaliana, have the same or a similar substitution level between synonymous sites and intergenic regions, suggesting that the mutation rate of different functional categories within the organelle genomes were the same [,,,,]. Meanwhile, the substitution rate of nonsynonymous sites was lower than that of intergenic regions in both mitochondrial and plastid genomes. These results are consistent with the traditional perspective that the mutation rates were the same both in genic and intergenic regions, but the selective pressure varied in genic and intergenic regions [].
Although the substitution level of synonymous sites was close to that of the intergenic regions in A. thaliana mitochondrial and plastid genomes, it was still slightly lower than that of the intergenic regions. Moreover, the substitution level of synonymous sites was significantly lower than that of the intergenic regions in the G. biloba plastid genome, but close to that of nonsynonymous sites. These results indicated that the synonymous sites were also under different degrees of purifying selection in different species. Two explanations have been proposed for this observed phenomenon. First, synonymous substitution does not change the amino acid sequence, but its change will affect GC content, mRNA structure and stability, translation efficiency, and protein folding and solubility [,,,,]. Second, synonymous site substitution may be repaired, along with the repair of their adjacent nonsynonymous sites, by gene conversion [,,]. Unexpectedly, the substitution rate of synonymous sites was slightly higher than that of the intergenic regions in the O. sativa plastid genome, and was 2.1 times higher than that of nonsynonymous sites, implying that the synonymous sites were under positive selection, and were not coupled to the evolution of genes. This phenomenon had also been reported in mammalian and bacterial nuclear genomes [,]. The synonymous sites of about 12% of genes were under positive selection in mammals. Although the substitutions of synonymous sites fixed under positive selection would affect mRNA stability, they may increase mRNA expression and translation to maintain physiological activity [,].
4.2. Evolution Rates in Repeats and Single-Copy Regions of Plant Organelle Genomes
The substitution rate of the intergenic regions of IR in the G. biloba, O. sativa, and A. thaliana plastid genomes were lower than that of the single-copy regions (LSC and SCC), which was consistent with a large number of previous studies in land plants [,,,]. The two IR regions in the plastid genome were identical in sequence, but in opposite directions, which provided a more homologous sequence than the single-copy regions for gene conversion to maintain their sequence identity, and they exhibited a lower mutation rate [,]. This explanation had been proven by direct experimental evidence []. However, there was more complexity when compared to the substitution rate of repeat sequences with that of single-copy sequences in the G. biloba, O. sativa, and A. thaliana mitogenomes. The substitution rate of repeats in O. sativa was lower than that of single-copy sequences, while the substitution rate of repeats in G. biloba and A. thaliana was higher than that of the single-copy sequence. Since the O. sativa mitogenome contains a large number of repeats, and the total length of repeats accounts for 54.1% [], the mechanism that maintained the substitution rate of the repeats was lower than that of the single-copy regions, which may be consistent with the plastid genome. On the contrary, the repeats were less than 10% in both the G. biloba and A. thaliana mitogenomes and dispersed [,]. Additionally, the activity of repeats is related to their length [,], while the long repeats in the G. biloba and A. thaliana mitogenomes were rare, resulting in the frequency of homologous repair at a low level. Moreover, the repeat sequences were always in noncoding regions. Therefore, the pattern of variation between the repeats and single-copy regions in the G. biloba and A. thaliana mitogenomes are different from that of O. sativa.
The substitution rate of the intergenic regions and nonsynonymous sites in the O. sativa and A. thaliana plastid genomes were higher than that in the mitogenomes, which was consistent with the previous findings that the evolution rate of the plastid was faster than that of the mitochondria in land plants [,,,]. However, in G. biloba, the substitution rate of the intergenic regions of the plastid genome was higher than that of the mitogenome, while the nonsynonymous substitution rate of the plastid genome was slightly lower than that of the mitogenome; this suggested that the mutation rate of the plastid genome was higher than for the mitogenome, but the selection was stronger than that of the mitogenome. This result may be consistent with the previous study detailing that the G. biloba and cycad plastid genomes were in evolutionary stasis, but the mechanism remains unknown [].
4.3. Copy Number Variations within Plant Mitogenomes and Implications for Genome Structure
We mapped the genomic sequencing short reads to the mitochondrial reference genomes of G. biloba and O. sativa, and the copy number variations across the mitogenome still found in them, which was consistent with the results of that in A. thaliana []. Illumina sequencing can rapidly quantify sequencing depth variations across the entire genome, but the sequencing depth is always affected by GC content and the complex structures of the sequence. In contrast, ddPCR is not affected by amplification efficiency and bias caused by GC content and the structure of sequences. Wu, et al. [] mapped Illumina sequencing reads to the reference genome and validated by ddPCR. They found that the observed heterogeneity of the sequencing depth among three replicates was consistent, and six marks with high sequencing depth and six marks with low sequencing depth were validated by ddPCR, indicating that the copy number variation, based on Illumina sequencing data, was reliable. Frequency recombination or rearrangement of the mitogenome produced alternative conformations, and different stoichiometry among different conformations, manifesting as copy number variations in the master circle. For the most extreme example, the Silene noctiflora BRP mitogenome contains 63 chromosomes with a different sequencing depth []. The most common example is the Mimulus guttatus mitogenome, which contained many alternative subgenome-mediated recombination []. Additionally, there is increasing evidence that the structure of the mitogenome is much more complex than the simple master circle molecule, such as the multiple circular mitogenome in Cucumis sativus and Lophophytum mirabile, and the complex structure in Picea sitchensis and Larix sibirica [,,,]. Moreover, the physical structure of mtDNA molecules in Lactuca sativa were in branched, linear, and circular forms in fluorescence microscopy []. The structure of mtDNA molecules in Vigna radiata transformed from rosette-like to linear in vivo under different cold treatments []. All those evidence suggested that the copy number variation fluctuated within the mitogenome in different plants.
5. Conclusions
In this study, we analyzed the intraspecific variations of the organelle genomes of G. biloba, O. sativa, and A. thaliana, representing the gymnosperms, monocots, and dicots, respectively. We found that: (1) The mutation input in different functional categories (especially coding regions and intergenic regions) within organelle genomes were the same or similar, suggesting that selection contributed to the varied evolution rate among different functional categories. (2) Since the repeat sequences provided more material for the homology repair mechanism (gene conversion), the evolution rate of the IR region in plastid genomes was slower than that of the single-copy region. Because the O. sativa mitogenome also contains a large number of repeats, the evolution rate of repeats was lower than that of the single-copy regions. (3) The copy number variation within the mitogenome was common. This study sampled representative species from different clades of seed plants (i.e., gymnosperms, monocots, and dicots) and revealed the intraspecific variations pattern of the organelle genomes at a genome-wide level.
Supplementary Materials
The following supporting information can be downloaded at: https://www.mdpi.com/article/10.3390/genes13061036/s1, Table S1. Accession number of samples used in this study; Table S2. Transition and transversion rate in the organelle genomes of each species.
Author Contributions
Conceptualization, Z.W. and S.K.; methodology, X.L., S.K. and Z.W.; software, X.L.; validation, X.L., S.K. and Z.W.; formal analysis, X.L.; investigation, X.L.; resources, Z.W.; data curation, Z.W.; writing—original draft preparation, S.K. and X.L.; writing—review and editing, Z.W., S.K. and X.L.; visualization, S.K. and X.L.; supervision, Z.W.; project administration, Z.W.; funding acquisition, Z.W. All authors have read and agreed to the published version of the manuscript.
Funding
This research was funded by the National Natural Science Foundation of China (32170238 and 31970244), and the Science, Technology and Innovation Commission of Shenzhen Municipality (RCYX20200714114538196).
Institutional Review Board Statement
Not applicable.
Informed Consent Statement
Not applicable.
Data Availability Statement
Not applicable.
Conflicts of Interest
The authors declare no conflict of interest.
References
- Smith, D.R. Mutation rates in plastid genomes: They are lower than you might think. Genome Biol. Evol. 2015, 7, 1227–1234. [Google Scholar] [CrossRef] [PubMed] [Green Version]
- Drouin, G.; Daoud, H.; Xia, J. Relative rates of synonymous substitutions in the mitochondrial, chloroplast and nuclear genomes of seed plants. Mol. Phylogenet. Evol. 2008, 49, 827–831. [Google Scholar] [CrossRef] [PubMed]
- Zhu, A.; Guo, W.; Jain, K.; Mower, J.P. Unprecedented heterogeneity in the synonymous substitution rate within a plant genome. Mol. Biol. Evol. 2014, 31, 1228–1236. [Google Scholar] [CrossRef] [PubMed] [Green Version]
- Mower, J.P.; Touzet, P.; Gummow, J.S.; Delph, L.F.; Palmer, J.D. Extensive variation in synonymous substitution rates in mitochondrial genes of seed plants. BMC Evol. Biol. 2007, 7, 135. [Google Scholar] [CrossRef] [PubMed] [Green Version]
- Bakker, F.T.; Breman, F.; Merckx, V. DNA sequence evolution in fast evolving mitochondrial DNA nad1 exons in Geraniaceae and Plantaginaceae. Taxon 2006, 55, 887–896. [Google Scholar] [CrossRef] [Green Version]
- Sloan, D.B.; Oxelman, B.; Rautenberg, A.; Taylor, D.R. Phylogenetic analysis of mitochondrial substitution rate variation in the angiosperm tribe Sileneae. BMC Evol. Biol. 2009, 9, 260. [Google Scholar] [CrossRef] [Green Version]
- Choi, K.; Weng, M.L.; Ruhlman, T.A.; Jansen, R.K. Extensive variation in nucleotide substitution rate and gene/intron loss in mitochondrial genomes of Pelargonium. Mol. Phylogenet. Evol. 2021, 155, 106986. [Google Scholar] [CrossRef]
- Parkinson, C.L.; Mower, J.P.; Qiu, Y.L.; Shirk, A.J.; Song, K.; Young, N.D.; DePamphilis, C.W.; Palmer, J.D. Multiple major increases and decreases in mitochondrial substitution rates in the plant family Geraniaceae. BMC Evol. Biol. 2005, 5, 73. [Google Scholar] [CrossRef] [Green Version]
- Sloan, D.B.; Alverson, A.J.; Wu, M.; Palmer, J.D.; Taylor, D.R. Recent acceleration of plastid sequence and structural evolution coincides with extreme mitochondrial divergence in the angiosperm genus Silene. Genome Biol. Evol. 2012, 4, 294–306. [Google Scholar] [CrossRef] [Green Version]
- Kan, S.L.; Shen, T.T.; Ran, J.H.; Wang, X.Q. Both Conifer II and Gnetales are characterized by a high frequency of ancient mitochondrial gene transfer to the nuclear genome. BMC Biol. 2021, 19, 146. [Google Scholar] [CrossRef]
- Kan, S.L.; Shen, T.T.; Gong, P.; Ran, J.H.; Wang, X.Q. The complete mitochondrial genome of Taxus cuspidata (Taxaceae): Eight protein-coding genes have transferred to the nuclear genome. BMC Evol. Biol. 2020, 20, 10. [Google Scholar] [CrossRef] [PubMed] [Green Version]
- Wu, Z.Q.; Liao, X.Z.; Zhang, X.N.; Tembrock, L.R.; Broz, A. Genomic architectural variation of plant mitochondria—A review of multichromosomal structuring. J. Syst. Evol. 2020, 60, 160–168. [Google Scholar] [CrossRef]
- Knoop, V. The mitochondrial DNA of land plants: Peculiarities in phylogenetic perspective. Curr. Genet. 2004, 46, 123–139. [Google Scholar] [CrossRef] [PubMed]
- Skippington, E.; Barkman, T.J.; Rice, D.W.; Palmer, J.D. Miniaturized mitogenome of the parasitic plant Viscum scurruloideum is extremely divergent and dynamic and has lost all nad genes. Proc. Natl. Acad. Sci. USA 2015, 112, E3515–E3524. [Google Scholar] [CrossRef] [PubMed] [Green Version]
- Putintseva, Y.A.; Bondar, E.I.; Simonov, E.P.; Sharov, V.V.; Oreshkova, N.V.; Kuzmin, D.A.; Konstantinov, Y.M.; Shmakov, V.N.; Belkov, V.I.; Sadovsky, M.G.; et al. Siberian larch (Larix sibirica Ledeb.) mitochondrial genome assembled using both short and long nucleotide sequence reads is currently the largest known mitogenome. BMC Genom. 2020, 21, 654. [Google Scholar] [CrossRef] [PubMed]
- Cheng, N.; Lo, Y.S.; Ansari, M.I.; Ho, K.C.; Jeng, S.T.; Lin, N.S.; Dai, H. Correlation between mtDNA complexity and mtDNA replication mode in developing cotyledon mitochondria during mung bean seed germination. New Phytol. 2017, 213, 751–763. [Google Scholar] [CrossRef] [Green Version]
- Kozik, A.; Rowan, B.A.; Lavelle, D.; Berke, L.; Schranz, M.E.; Michelmore, R.W.; Christensen, A.C. The alternative reality of plant mitochondrial DNA: One ring does not rule them all. PLoS Genet. 2019, 15, e1008373. [Google Scholar] [CrossRef] [Green Version]
- Christensen, A.C. Plant mitochondrial genome evolution can be explained by DNA repair mechanisms. Genome Biol. Evol. 2013, 5, 1079–1086. [Google Scholar] [CrossRef]
- Sloan, D.B.; Wu, Z.; Sharbrough, J. Correction of persistent errors in Arabidopsis reference mitochondrial genomes. Plant Cell 2018, 30, 525–527. [Google Scholar] [CrossRef] [Green Version]
- Christensen, A.C. Genes and junk in plant mitochondria-repair mechanisms and selection. Genome Biol. Evol. 2014, 6, 1448–1453. [Google Scholar] [CrossRef] [Green Version]
- Wu, Z.; Waneka, G.; Sloan, D.B. The tempo and mode of angiosperm mitochondrial genome divergence inferred from intraspecific variation in Arabidopsis thaliana. G3 Genes Genomes Genet. 2020, 10, 1077–1086. [Google Scholar] [CrossRef] [PubMed] [Green Version]
- Tonti-Filippini, J.; Nevill, P.G.; Dixon, K.; Small, I. What can we do with 1000 plastid genomes? Plant J. 2017, 90, 808–818. [Google Scholar] [CrossRef] [PubMed] [Green Version]
- Zhu, A.; Guo, W.; Gupta, S.; Fan, W.; Mower, J.P. Evolutionary dynamics of the plastid inverted repeat: The effects of expansion, contraction, and loss on substitution rates. New Phytol. 2016, 209, 1747–1756. [Google Scholar] [CrossRef] [PubMed] [Green Version]
- Wang, J.; Fu, G.F.; Tembrock, L.R.; Liao, X.Z.; Ge, S.; Wu, Z.Q. Mutational meltdown or controlled chain reaction: The dynamics of rapid plastome evolution in the hyperdiversity of Poaceae. J. Syst. Evol. 2022. accepted article. [Google Scholar] [CrossRef]
- Nei, M. Selectionism and neutralism in molecular evolution. Mol. Biol. Evol. 2005, 22, 2318–2342. [Google Scholar] [CrossRef] [Green Version]
- Sloan, D.B.; Taylor, D.R. Evolutionary rate variation in organelle genomes: The role of mutational processes. In Organelle Genetics; Bullerwell, C.E., Ed.; Springer: Berlin/Heidelberg, Germany, 2012; pp. 123–146. [Google Scholar]
- Barnard-Kubow, K.B.; Sloan, D.B.; Galloway, L.F. Correlation between sequence divergence and polymorphism reveals similar evolutionary mechanisms acting across multiple timescales in a rapidly evolving plastid genome. BMC Evol. Biol. 2014, 14, 268. [Google Scholar] [CrossRef] [Green Version]
- Cho, Y.; Mower, J.P.; Qiu, Y.L.; Palmer, J.D. Mitochondrial substitution rates are extraordinarily elevated and variable in a genus of flowering plants. Proc. Natl. Acad. Sci. USA 2004, 101, 17741–17746. [Google Scholar] [CrossRef] [Green Version]
- Sloan, D.B.; Alverson, A.J.; Chuckalovcak, J.P.; Wu, M.; McCauley, D.E.; Palmer, J.D.; Taylor, D.R. Rapid evolution of enormous, multichromosomal genomes in flowering plant mitochondria with exceptionally high mutation rates. PLoS Biol. 2012, 10, e1001241. [Google Scholar] [CrossRef] [Green Version]
- Denver, D.R.; Morris, K.; Lynch, M.; Vassilieva, L.L.; Thomas, W.K. High direct estimate of the mutation rate in the mitochondrial genome of Caenorhabditis elegans. Science 2000, 289, 2342–2344. [Google Scholar] [CrossRef]
- Lynch, M.; Sung, W.; Morris, K.; Coffey, N.; Landry, C.R.; Dopman, E.B.; Dickinson, W.J.; Okamoto, K.; Kulkarni, S.; Hartl, D.L.; et al. A genome-wide view of the spectrum of spontaneous mutations in yeast. Proc. Natl. Acad. Sci. USA 2008, 105, 9272–9277. [Google Scholar] [CrossRef] [Green Version]
- Zhao, Q.; Feng, Q.; Lu, H.; Li, Y.; Wang, A.; Tian, Q.; Zhan, Q.; Lu, Y.; Zhang, L.; Huang, T.; et al. Pan-genome analysis highlights the extent of genomic variation in cultivated and wild rice. Nat. Genet. 2018, 50, 278–284. [Google Scholar] [CrossRef] [PubMed] [Green Version]
- Zhao, Y.P.; Fan, G.; Yin, P.P.; Sun, S.; Li, N.; Hong, X.; Hu, G.; Zhang, H.; Zhang, F.M.; Han, J.D.; et al. Resequencing 545 ginkgo genomes across the world reveals the evolutionary history of the living fossil. Nat. Commun. 2019, 10, 4201. [Google Scholar] [CrossRef] [PubMed] [Green Version]
- Alonso-Blanco, C.; Andrade, J.; Becker, C.; Bemm, F.; Bergelson, J.; Borgwardt, K.M.; Cao, J.; Chae, E.; Dezwaan, T.M.; Ding, W.; et al. 1,135 genomes reveal the global pattern of polymorphism in Arabidopsis thaliana. Cell 2016, 166, 481–491. [Google Scholar] [CrossRef] [PubMed] [Green Version]
- Chen, S.; Zhou, Y.; Chen, Y.; Gu, J. fastp: An ultra-fast all-in-one FASTQ preprocessor. Bioinformatics 2018, 34, i884–i890. [Google Scholar] [CrossRef] [PubMed]
- Li, H.; Durbin, R. Fast and accurate short read alignment with Burrows-Wheeler transform. Bioinformatics 2009, 25, 1754–1760. [Google Scholar] [CrossRef] [PubMed] [Green Version]
- McKenna, A.; Hanna, M.; Banks, E.; Sivachenko, A.; Cibulskis, K.; Kernytsky, A.; Garimella, K.; Altshuler, D.; Gabriel, S.; Daly, M.; et al. The Genome Analysis Toolkit: A MapReduce framework for analyzing next-generation DNA sequencing data. Genome Res. 2010, 20, 1297–1303. [Google Scholar] [CrossRef] [Green Version]
- Wysoker, A.; Fennell, T.; Ruan, J.; Homer, N.; Marth, G.; Abecasis, G.; Durbin, R.J.B. The Sequence alignment/map (SAM) format and SAMtools. Bioinformatics 2009, 25, 2078–2079. [Google Scholar]
- Li, H. A statistical framework for SNP calling, mutation discovery, association mapping and population genetical parameter estimation from sequencing data. Bioinformatics 2011, 27, 2987–2993. [Google Scholar] [CrossRef] [Green Version]
- Danecek, P.; Auton, A.; Abecasis, G.; Albers, C.A.; Banks, E.; DePristo, M.A.; Handsaker, R.E.; Lunter, G.; Marth, G.T.; Sherry, S.T.; et al. The variant call format and VCFtools. Bioinformatics 2011, 27, 2156–2158. [Google Scholar] [CrossRef]
- Yang, Z. PAML 4: Phylogenetic analysis by maximum likelihood. Mol. Biol. Evol. 2007, 24, 1586–1591. [Google Scholar] [CrossRef] [Green Version]
- Notsu, Y.; Masood, S.; Nishikawa, T.; Kubo, N.; Akiduki, G.; Nakazono, M.; Hirai, A.; Kadowaki, K. The complete sequence of the rice (Oryza sativa L.) mitochondrial genome: Frequent DNA sequence acquisition and loss during the evolution of flowering plants. Mol. Genet. Genom. 2002, 268, 434–445. [Google Scholar] [CrossRef] [PubMed]
- Perry, A.S.; Wolfe, K.H. Nucleotide substitution rates in legume chloroplast DNA depend on the presence of the inverted repeat. J. Mol. Evol. 2002, 55, 501–508. [Google Scholar] [CrossRef] [PubMed]
- Wynn, E.L.; Christensen, A.C. Are synonymous substitutions in flowering plant mitochondria neutral? J. Mol. Evol. 2015, 81, 131–135. [Google Scholar] [CrossRef] [PubMed]
- Resch, A.M.; Carmel, L.; Marino-Ramirez, L.; Ogurtsov, A.Y.; Shabalina, S.A.; Rogozin, I.B.; Koonin, E.V. Widespread positive selection in synonymous sites of mammalian genes. Mol. Biol. Evol. 2007, 24, 1821–1831. [Google Scholar] [CrossRef] [PubMed]
- Sloan, D.B.; Taylor, D.R. Testing for selection on synonymous sites in plant mitochondrial DNA: The role of codon bias and RNA editing. J. Mol. Evol. 2010, 70, 479–491. [Google Scholar] [CrossRef]
- Chamary, J.V.; Hurst, L.D. Evidence for selection on synonymous mutations affecting stability of mRNA secondary structure in mammals. Genome Biol. 2005, 6, R75. [Google Scholar] [CrossRef] [Green Version]
- Rosano, G.L.; Ceccarelli, E.A. Rare codon content affects the solubility of recombinant proteins in a codon bias-adjusted Escherichia coli strain. Microb. Cell. Fact. 2009, 8, 41. [Google Scholar] [CrossRef] [Green Version]
- Zhang, G.; Hubalewska, M.; Ignatova, Z. Transient ribosomal attenuation coordinates protein synthesis and co-translational folding. Nat. Struct. Mol. Biol. 2009, 16, 274–280. [Google Scholar] [CrossRef]
- Davila, J.I.; Arrieta-Montiel, M.P.; Wamboldt, Y.; Cao, J.; Hagmann, J.; Shedge, V.; Xu, Y.Z.; Weigel, D.; Mackenzie, S.A. Double-strand break repair processes drive evolution of the mitochondrial genome in Arabidopsis. BMC Biol. 2011, 9, 64. [Google Scholar] [CrossRef] [Green Version]
- Gualberto, J.M.; Newton, K.J. Plant mitochondrial genomes: Dynamics and mechanisms of mutation. Annu. Rev. Plant Biol. 2017, 68, 225–252. [Google Scholar] [CrossRef]
- Chevigny, N.; Schatz-Daas, D.; Lotfi, F.; Gualberto, J.M. DNA repair and the stability of the plant mitochondrial genome. Int. J. Mol. Sci. 2020, 21, 328. [Google Scholar] [CrossRef] [PubMed] [Green Version]
- Agashe, D.; Sane, M.; Phalnikar, K.; Diwan, G.D.; Habibullah, A.; Martinez-Gomez, N.C.; Sahasrabuddhe, V.; Polachek, W.; Wang, J.; Chubiz, L.M.; et al. Large-effect beneficial synonymous mutations mediate rapid and parallel adaptation in a bacterium. Mol. Biol. Evol. 2016, 33, 1542–1553. [Google Scholar] [CrossRef] [PubMed] [Green Version]
- Li, F.W.; Kuo, L.Y.; Pryer, K.M.; Rothfels, C.J. Genes translocated into the plastid inverted repeat show decelerated substitution rates and elevated GC content. Genome Biol. Evol. 2016, 8, 2452–2458. [Google Scholar] [CrossRef] [PubMed] [Green Version]
- Wu, C.S.; Chaw, S.M. Evolutionary stasis in Cycad plastomes and the first case of plastome GC-biased gene conversion. Genome Biol. Evol. 2015, 7, 2000–2009. [Google Scholar] [CrossRef] [Green Version]
- Wolfe, K.H.; Li, W.H.; Sharp, P.M. Rates of nucleotide substitution vary greatly among plant mitochondrial, chloroplast, and nuclear DNAs. Proc. Natl. Acad. Sci. USA 1987, 84, 9054–9058. [Google Scholar] [CrossRef] [Green Version]
- Birky, C.W.; Walsh, J.B. Biased gene conversion, copy number, and apparent mutation rate differences within chloroplast and bacterial genomes. Genetics 1992, 130, 677–683. [Google Scholar] [CrossRef]
- Khakhlova, O.; Bock, R. Elimination of deleterious mutations in plastid genomes by gene conversion. Plant J. 2006, 46, 85–94. [Google Scholar] [CrossRef]
- Guo, W.; Grewe, F.; Fan, W.; Young, G.J.; Knoop, V.; Palmer, J.D.; Mower, J.P. Ginkgo and Welwitschia mitogenomes reveal extreme contrasts in gymnosperm mitochondrial evolution. Mol. Biol. Evol. 2016, 33, 1448–1460. [Google Scholar] [CrossRef] [Green Version]
- Marechal, A.; Brisson, N. Recombination and the maintenance of plant organelle genome stability. New Phytol. 2010, 186, 299–317. [Google Scholar] [CrossRef]
- Schuster, W.; Brennicke, A. Plastid, nuclear and reverse transcriptase sequences in the mitochondrial genome of Oenothera: Is genetic information transferred between organelles via RNA? Embo J. 1987, 6, 2857–2863. [Google Scholar] [CrossRef]
- Smith, D.R.; Keeling, P.J. Mitochondrial and plastid genome architecture: Reoccurring themes, but significant differences at the extremes. Proc. Natl. Acad. Sci. USA 2015, 112, 10177–10184. [Google Scholar] [CrossRef] [PubMed] [Green Version]
- Wu, Z.; Sloan, D.B. Recombination and intraspecific polymorphism for the presence and absence of entire chromosomes in mitochondrial genomes. Heredity 2019, 122, 647–659. [Google Scholar] [CrossRef] [PubMed]
- Mower, J.P.; Case, A.L.; Floro, E.R.; Willis, J.H. Evidence against equimolarity of large repeat arrangements and a predominant master circle structure of the mitochondrial genome from a monkeyflower (Mimulus guttatus) lineage with cryptic CMS. Genome Biol. Evol. 2012, 4, 670–686. [Google Scholar] [CrossRef] [PubMed] [Green Version]
- Sanchez-Puerta, M.V.; Garcia, L.E.; Wohlfeiler, J.; Ceriotti, L.F. Unparalleled replacement of native mitochondrial genes by foreign homologs in a holoparasitic plant. New Phytol. 2017, 214, 376–387. [Google Scholar] [CrossRef] [PubMed] [Green Version]
- Alverson, A.J.; Rice, D.W.; Dickinson, S.; Barry, K.; Palmer, J.D. Origins and recombination of the bacterial-sized multichromosomal mitochondrial genome of cucumber. Plant Cell 2011, 23, 2499–2513. [Google Scholar] [CrossRef] [PubMed] [Green Version]
- Jackman, S.D.; Coombe, L.; Warren, R.L.; Kirk, H.; Trinh, E.; MacLeod, T.; Pleasance, S.; Pandoh, P.; Zhao, Y.; Coope, R.J.; et al. Complete mitochondrial genome of a gymnosperm, Sitka spruce (Picea sitchensis), indicates a complex physical structure. Genome Biol. Evol. 2020, 12, 1174–1179. [Google Scholar] [CrossRef]
Publisher’s Note: MDPI stays neutral with regard to jurisdictional claims in published maps and institutional affiliations. |
© 2022 by the authors. Licensee MDPI, Basel, Switzerland. This article is an open access article distributed under the terms and conditions of the Creative Commons Attribution (CC BY) license (https://creativecommons.org/licenses/by/4.0/).