
Nuclear and Mitochondrial Phylogenomics of the Sifakas Reveal Cryptic Variation in the Diademed Sifaka

 , , , , , ,
Abstract

1. Introduction
2. Materials and Methods
2.1. Samples
2.2. Data Generation and Sequencing
2.3. Data Processing: UCEs and CMGs
2.4. Data Partitioning and Phylogenomic Inference
2.5. Species Tree Generation and Divergence Dating
2.6. Bayesian Skyline Plot Reconstructions
2.7. Ecological Differentiation
3. Results
3.1. Ultraconserved Elements
3.2. Data Partitioning and Phylogenetic Inference
3.3. Species Trees and Divergence Dating
3.4. Mitochondrial Genomes
3.5. Extended Bayesian Skyline Plot
3.6. Ecological Niche Modeling
4. Discussion
4.1. Phylogenomics of Sifakas
4.2. Species Trees
4.3. Mitochondrial Signatures
4.4. Evolutionary Dynamics
4.5. Biogeographic Patterns in P. diadema
5. Conclusions
Supplementary Materials
Author Contributions
Funding
Institutional Review Board Statement
Informed Consent Statement
Data Availability Statement
Acknowledgments
Conflicts of Interest
References
- Mittermeier, R.; Louis, E., Jr.; Richardson, M.; Schwitzer, C.; Langrand, O.; Rylands, A.; Hawkins, F.; Rajaobelina, S.; Ratsimbazafy, J.; Rasoloarison, R.; et al. Lemurs of Madagascar, 3rd ed.; Conservation International: Crystal City, VA, USA, 2010. [Google Scholar]
- The IUCN Red List of Threatened Species. Available online: https://www.iucnredlist.org/en (accessed on 1 June 2022).
- Mayor, M.I.; Sommer, J.A. Specific Status of Propithecus spp. Int. J. Primatol. 2004, 25, 875–990. [Google Scholar] [CrossRef]
- Pastorini, J.; Forstner, M.R.J.; Martin, R.D. Phylogenetic History of Sifakas (Propithecus: Lemuriformes) Derived from MtDNA Sequences. Am. J. Primatol. 2001, 53, 1–17. [Google Scholar] [CrossRef]
- Curtis, D.J.; Velo, A.; Raheliarisoa, E.-O.; Zaramody, A.; Müller, P. Surveys on Propithecus Verreauxi Deckeni, a Melanistic Variant, and P. v. Coronatus in North-West Madagascar. Oryx 1998, 32, 157–164. [Google Scholar] [CrossRef]
- Groves, C.P.; Helgen, K.M. Craniodental Characters in the Taxonomy of Propithecus. Int. J. Primatol. 2007, 28, 1363–1383. [Google Scholar] [CrossRef]
- Petter, J.J.; Peyrieras, A. Melanization in the Genus Propithecus Malagasey Lemur. J. Hum. Evol. 1972, 1, 379–388. [Google Scholar] [CrossRef]
- Rakotonirina, L.H.F.; Randriantsara, F.; Rakotoarisoa, A.H.; Rakotondrabe, R.; Razafindramanana, J.; Ratsimbazafy, J.; King, T. A Preliminary Assessment of Sifaka (Propithecus) Distribution, Chromatic Variation and Conservation in Western Central Madagascar. Primate Conserv. 2014, 2014, 43–53. [Google Scholar] [CrossRef]
- Tapanes, E.; Jacobs, R.L.; Harryman, I.; Louis, E.E.; Irwin, M.T.; Kamilar, J.M.; Bradley, B.J. Hair Phenotype Diversity across Indriidae Lemurs. bioRxiv 2021. [Google Scholar] [CrossRef]
- Tattersall, I. Notes on the Distribution and Taxonomic Status of Some Subspecies of Propithecus in Madagascar. Folia Primatol. 1986, 46, 51–63. [Google Scholar] [CrossRef]
- Brockman, D.K. Reproduction and Mating System of Verreaux’s Sifaka, Propithecus vereauxi, at Beza Mahafaly, Madagascar. Ph.D. Thesis, Yale University, New Haven, CT, USA, 1994. [Google Scholar]
- Kappeler, P.M.; Schäffler, L. The Lemur Syndrome Unresolved: Extreme Male Reproductive Skew in Sifakas (Propithecus Verreauxi), a Sexually Monomorphic Primate with Female Dominance. Behav. Ecol. Sociobiol. 2008, 62, 1007–1015. [Google Scholar] [CrossRef]
- Kraus, C.; Heistermann, M.; Kappeler, P.M. Physiological Suppression of Sexual Function of Subordinate Males: A Subtle Form of Intrasexual Competition among Male Sifakas (Propithecus Verreauxi)? Physiol. Behav. 1999, 66, 855–861. [Google Scholar] [CrossRef]
- Lawler, R.R.; Richard, A.F.; Riley, M.A. Intrasexual Selection in Verreaux’s Sifaka (Propithecus Verreauxi Verreauxi). J. Hum. Evol. 2005, 48, 259–277. [Google Scholar] [CrossRef]
- Pochron, S.T.; Tucker, W.T.; Wright, P.C. Demography, Life History, and Social Structure in Propithecus Diadema Edwardsi from 1986–2000 in Ranomafana National Park, Madagascar. Am. J. Phys. Anthr. 2004, 125, 61–72. [Google Scholar] [CrossRef]
- Richard, A.F. Aggressive Competition between Males, Female-Controlled Polygyny and Sexual Monomorphism in a Malagasy Primate, Propithecus Verreauxi. J. Hum. Evol. 1992, 22, 395–406. [Google Scholar] [CrossRef]
- Bastian, M.L.; Brockman, D.K. Paternal Care in Propithecus Verreauxi Coquereli. Int. J. Primatol. 2007, 28, 305–313. [Google Scholar] [CrossRef]
- Lewis, R.J.; Kappeler, P.M. Seasonality, Body Condition, and Timing of Reproduction in Propithecus Verreauxi Verreauxi in the Kirindy Forest. Am. J. Primatol. 2005, 67, 347–364. [Google Scholar] [CrossRef]
- Norscia, I.; Carrai, V.; Borgognini-Tarli, S.M. Influence of Dry Season and Food Quality and Quantity on Behavior and Feeding Strategy of Propithecus Verreauxi in Kirindy, Madagascar. Int. J. Primatol. 2006, 27, 1001–1022. [Google Scholar] [CrossRef]
- Richard, A.F.; Dewar, R.E.; Schwartz, M.; Ratsirarson, J. Mass Change, Environmental Variability and Female Fertility in Wild Propithecus Verreauxi. J. Hum. Evol. 2000, 39, 381–391. [Google Scholar] [CrossRef] [PubMed]
- Fichtel, C. Acoustic Differences in Loud Calls of Decken’s and Crowned Sifakas (Propithecus Deckenii and P. Coronatus) at Two Sites in Madagascar. Primate Conserv. 2014, 2014, 85–91. [Google Scholar] [CrossRef]
- King, T.; Rakotonirina, L.H.F.; Rakotoarisoa, A.H.; Razafindramanana, J.; Ratsimbazafy, J. Distributional Limits and Melanism in the South-West of the Range of the Crowned Sifaka (Propithecus Coronatus), Madagascar. Primate Conserv. 2014, 2014, 55–64. [Google Scholar] [CrossRef]
- Tattersall, I. Madagascar’s Lemurs: Cryptic Diversity or Taxonomic Inflation? Evol. Anthr. Issues News Rev. 2007, 16, 12–23. [Google Scholar] [CrossRef]
- Rumpler, Y.; Hauwy, M.; Fausser, J.-L.; Roos, C.; Zaramody, A.; Andriaholinirina, N.; Zinner, D. Comparing Chromosomal and Mitochondrial Phylogenies of the Indriidae (Primates, Lemuriformes). Chromosom. Res. 2011, 19, 209–224. [Google Scholar] [CrossRef] [PubMed][Green Version]
- Groves, C. Primate Taxonomy, 1st ed.; Smithsonian Books: Washington, DC, USA, 2001; ISBN 978-1-56098-872-4. [Google Scholar]
- Pearson, R.G.; Raxworthy, C.J. The Evolution of Local Endemism in Madagascar: Watershed versus Climatic Gradient Hypotheses Evaluated by Null Biogeographic Models. Evolution 2009, 63, 959–967. [Google Scholar] [CrossRef] [PubMed]
- Wilmé, L.; Goodman, S.M.; Ganzhorn, J.U. Biogeographic Evolution of Madagascar’s Microendemic Biota. Science 2006, 312, 1063–1065. [Google Scholar] [CrossRef]
- Groves, C.P. Primate Taxonomy: Inflation or Real? Annu. Rev. Anthr. 2014, 43, 27–36. [Google Scholar] [CrossRef]
- Barrett, M.A.; Brown, J.L.; Junge, R.E.; Yoder, A.D. Climate Change, Predictive Modeling and Lemur Health: Assessing Impacts of Changing Climate on Health and Conservation in Madagascar. Biol. Conserv. 2013, 157, 409–422. [Google Scholar] [CrossRef]
- Hannah, L.; Dave, R.; Lowry, P.P.; Andelman, S.; Andrianarisata, M.; Andriamaro, L.; Cameron, A.; Hijmans, R.; Kremen, C.; MacKinnon, J. Climate Change Adaptation for Conservation in Madagascar. Biol. Lett. 2008, 4, 590–594. [Google Scholar] [CrossRef]
- Harvey, C.A.; Rakotobe, Z.L.; Rao, N.S.; Dave, R.; Razafimahatratra, H.; Rabarijohn, R.H.; Rajaofara, H.; MacKinnon, J.L. Extreme Vulnerability of Smallholder Farmers to Agricultural Risks and Climate Change in Madagascar. Philos. Trans. R. Soc. B Biol. Sci. 2014, 369. [Google Scholar] [CrossRef] [PubMed]
- Ingram, J.C.; Dawson, T.P. Climate Change Impacts and Vegetation Response on the Island of Madagascar. Philos. Trans. R. Soc. B Biol. Sci. 2005, 363, 55–59. [Google Scholar] [CrossRef]
- Day, S.R.; Ramarokoto, R.; Sitzmann, B.D.; Randriamboahanginjatovo, R.; Ramanankirija, H.; Rence, V.; Randrianindrina, A.; Ravololonarivo, G.; Louis, E.E., Jr. Re-Introduction of Diademed Sifaka (Propithecus Diadema) and Black and White Ruffed Lemurs (Varecia Variegata Editorum) at Analamazaotra Special Reserve, Eastern Madagascar. Lemur News 2009, 14, 32–37. [Google Scholar]
- Salmona, J.; Heller, R.; Quéméré, E.; Chikhi, L. Climate Change and Human Colonization Triggered Habitat Loss and Fragmentation in Madagascar. Mol. Ecol. 2017, 26, 5203–5222. [Google Scholar] [CrossRef]
- Guevara, E.E.; Webster, T.H.; Lawler, R.R.; Bradley, B.J.; Greene, L.K.; Ranaivonasy, J.; Ratsirarson, J.; Harris, R.A.; Liu, Y.; Murali, S. Comparative Genomic Analysis of Sifakas (Propithecus) Reveals Selection for Folivory and High Heterozygosity despite Endangered Status. Sci. Adv. 2021, 7, eabd2274. [Google Scholar] [CrossRef]
- Bailey, C.A.; McLain, A.T.; Paquette, S.R.; McGuire, S.M.; Shore, G.D. Evaluating the Genetic Diversity of Three Endangered Lemur Species (Genus: Propithecus) from Northern Madagascar. J. Primatol. 2016, 5, 312. [Google Scholar] [CrossRef]
- Salmona, J.; Teixeira, H.; Rasolondraibe, E.; Aleixo-Pais, I.; Kun-Rodrigues, C.; Rakotonanahary, A.N.; Jan, F.; Rabarivola, C.J.; Zaonarivelo, J.R.; Andriaholinirina, N.V.; et al. Genetic Diversity, Population Size, and Conservation of the Critically Endangered Perrier’s Sifaka (Propithecus Perrieri). Int. J. Primatol. 2015, 36, 1132–1153. [Google Scholar] [CrossRef]
- McCormack, J.E.; Faircloth, B.C.; Crawford, N.G.; Gowaty, P.A.; Brumfield, R.T.; Glenn, T.C. Ultraconserved Elements Are Novel Phylogenomic Markers That Resolve Placental Mammal Phylogeny When Combined with Species-Tree Analysis. Genome Res. 2012, 22, 746–754. [Google Scholar] [CrossRef]
- Seutin, G.; White, B.N.; Boag, P.T. Preservation of Avian Blood and Tissue Samples for DNA Analyses. Can. J. Zool. 1991, 69, 82–90. [Google Scholar] [CrossRef]
- Sikes, R.S.; Gannon, W.L.; Care, A.; The Animal Care and Use Committee of the American Society of Mammalogists. Guidelines of the American Society of Mammalogists for the Use of Wild Mammals in Research. J. Mammal. 2011, 91, 235–253. [Google Scholar] [CrossRef]
- Sambrook, J.; Fritsch, E.F.; Maniatis, T. Molecular Cloning: A Laboratory Manual; Sambrook, J., Fritsch, E.F., Maniatis, T., Eds.; Cold Spring Harbor Laboratory Press: New York, NY, USA, 1989. [Google Scholar]
- Bailey, C.A.; McLain, A.T.; Paquette, S.R.; McGuire, S.M.; Shore, G.D.; Lei, R. Evaluating the Genetic Diversity of Three Endangered Lemur Species (Genus: Propithecus) from Northern Madagascar. J. Primatol. 2015, 5, 132. [Google Scholar] [CrossRef]
- Rohland, N.; Reich, D. Cost-Effective, High-Throughput DNA Sequencing Libraries for Multiplexed Target Capture. Genome Res. 2012, 22, 939–946. [Google Scholar] [CrossRef]
- Glenn, T.C.; Nilsen, R.; Kieran, T.J.; Finger, J.W.; Pierson, T.W.; Bentley, K.E.; Hoffberg, S.; Louha, S.; Garcia-De-Leon, F.J.; Angel del Rio Portilla, M.; et al. Adapterama I: Universal stubs and primers for thousands of dual-indexed Illumina libraries (iTru & iNext). bioRxiv 2016. [Google Scholar] [CrossRef]
- Hawkins, M.T.R.; Leonard, J.A.; Helgen, K.M.; McDonough, M.M.; Rockwood, L.L.; Maldonado, J.E. Evolutionary History of Endemic Sulawesi Squirrels Constructed from UCEs and Mitogenomes Sequenced from Museum Specimens. BMC Evol. Biol. 2016, 16, 1–16. [Google Scholar] [CrossRef]
- Faircloth, B.C.; McCormack, J.E.; Crawford, N.G.; Harvey, M.G.; Brumfield, R.T.; Glenn, T.C. Ultraconserved Elements Anchor Thousands of Genetic Markers Spanning Multiple Evolutionary Timescales. Syst. Biol. 2012, 61, 717–726. [Google Scholar] [CrossRef]
- Baira, E.; Greshock, J.; Coukos, G.; Zhang, L. Ultraconserved Elements: Genomics, Function and Disease. RNA Biol. 2008, 5, 132–134. [Google Scholar] [CrossRef] [PubMed]
- Parker, L.D.; Hawkins, M.T.; Camacho-Sanchez, M.; Campana, M.G.; West-Roberts, J.A.; Wilbert, T.R.; Lim, H.C.; Rockwood, L.L.; Leonard, J.A.; Maldonado, J.E. Little Genetic Structure in a Bornean Endemic Small Mammal across a Steep Ecological Gradient. Mol. Ecol. 2020, 29, 4074–4090. [Google Scholar] [CrossRef]
- Faircloth, B.C. PHYLUCE Is a Software Package for the Analysis of Conserved Genomic Loci. Bioinformatics 2016, 32, 786–788. [Google Scholar] [CrossRef]
- Brockman, A.M.; Lohse, M.; Usadel, B. Trimmomatic: A flexible trimmer for Illumina sequence data. Bioinformatics 2014, 30, 2114–2120. [Google Scholar] [CrossRef]
- Trinity RNA-Seq Assembler Performance Optimization|Proceedings of the 1st Conference of the Extreme Science and Engineering Discovery Environment: Bridging from the EXtreme to the Campus and Beyond. Available online: https://dl.acm.org/doi/abs/10.1145/2335755.2335842 (accessed on 1 June 2022).
- Biomatters. Available online: https://www.research.ucreative.ac.uk/4215/1/Workbook_HH.pdf (accessed on 1 June 2022).
- Katoh, K.; Standley, D.M. MAFFT Multiple Sequence Alignment Software Version 7: Improvements in Performance and Usability. Mol. Biol. Evol. 2013, 30, 772–780. [Google Scholar] [CrossRef]
- Crawford, N.G.; Faircloth, B.C.; McCormack, J.E.; Brumfield, R.T.; Winker, K.; Glenn, T.C. More than 1000 Ultraconserved Elements Provide Evidence That Turtles Are the Sister Group of Archosaurs. Biol. Lett. 2012, 8, 783–786. [Google Scholar] [CrossRef]
- Tagliacollo, V.A.; Lanfear, R. Estimating Improved Partitioning Schemes for Ultraconserved Elements. Mol. Biol. Evol. 2018, 35, 1798–1811. [Google Scholar] [CrossRef] [PubMed]
- Hagenson, R.A. Swsc: A Sitewise UCE Partitioner. J. Open Source Softw. 2019, 4, 1146. [Google Scholar] [CrossRef]
- Lanfear, R.; Calcott, B.; Ho, S.Y.W.; Guindon, S. Partitionfinder: Combined Selection of Partitioning Schemes and Substitution Models for Phylogenetic Analyses. Mol. Biol. Evol. 2012, 29, 1695–1701. [Google Scholar] [CrossRef] [PubMed]
- Ronquist, F.; Huelsenbeck, J.P. MrBayes 3: Bayesian Phylogenetic Inference under Mixed Models. Bioinformatics 2003, 19, 1572–1574. [Google Scholar] [CrossRef]
- Stamatakis, A. RAxML Version 8: A Tool for Phylogenetic Analysis and Post-Analysis of Large Phylogenies. Bioinformatics 2014, 30, 1312–1313. [Google Scholar] [CrossRef] [PubMed]
- Nguyen, L.-T.; Schmidt, H.A.; von Haeseler, A.; Minh, B.Q. IQ-TREE: A Fast and Effective Stochastic Algorithm for Estimating Maximum-Likelihood Phylogenies. Mol. Biol. Evol. 2015, 32, 268–274. [Google Scholar] [CrossRef]
- Trifinopoulos, J.; Nguyen, L.-T.; von Haeseler, A.; Minh, B.Q. W-IQ-TREE: A Fast Online Phylogenetic Tool for Maximum Likelihood Analysis. Nucleic Acids Res. 2016, 44, W232–W235. [Google Scholar] [CrossRef]
- Baca, S.M.; Toussaint, E.F.A.; Miller, K.B.; Short, A.E.Z. Molecular Phylogeny of the Aquatic Beetle Family Noteridae (Coleoptera: Adephaga) with an Emphasis on Data Partitioning Strategies. Mol. Phylogenetics Evol. 2017, 107, 282–292. [Google Scholar] [CrossRef]
- Liu, L.; Yu, L. Estimating Species Trees from Unrooted Gene Trees. Syst. Biol. 2011, 60, 661–667. [Google Scholar] [CrossRef]
- Shaw, T.I.; Ruan, Z.; Glenn, T.C.; Liu, L. STRAW: Species TRee Analysis Web Server. Nucleic Acids Res. 2013, 41, W238–W241. [Google Scholar] [CrossRef]
- Drummond, A.J.; Suchard, M.A.; Xie, D.; Rambaut, A. Bayesian Phylogenetics with BEAUti and the BEAST 1.7. Mol. Biol. Evol. 2012, 29, 1969–1973. [Google Scholar] [CrossRef]
- Arnold, C.; Matthews, L.J.; Nunn, C.L. The 10kTrees Website: A New Online Resource for Primate Phylogeny. Evol. Anthr. Issues News Rev. 2010, 19, 114–118. [Google Scholar] [CrossRef]
- Herrera, J.P.; Dávalos, L.M. Phylogeny and Divergence Times of Lemurs Inferred with Recent and Ancient Fossils in the Tree. Syst. Biol. 2016, 65, 772–791. [Google Scholar] [CrossRef]
- Kistler, L.; Ratan, A.; Godfrey, L.R.; Crowley, B.E.; Hughes, C.E.; Lei, R.; Cui, Y.; Wood, M.L.; Muldoon, K.M.; Andriamialison, H. Comparative and Population Mitogenomic Analyses of Madagascar’s Extinct, Giant ‘Subfossil’ Lemurs. J. Hum. Evol. 2015, 79, 45–54. [Google Scholar] [CrossRef]
- Miller, M.A.; Pfeiffer, W.; Schwartz, T. Creating the CIPRES Science Gateway for inference of large phylogenetic trees. In Proceedings of the 2010 Gateway Computing Environments Workshop (GCE), IEEE, New Orleans, LA, USA, 14 November 2010; pp. 1–8. [Google Scholar] [CrossRef]
- Rambaut, A. Fig Tree: Tree Figure Drawing Tool Version 1.4. a Program for Producing Publication-Ready Figures; tree.bio.ed.ac.uk: Edinburgh, UK, 2012. [Google Scholar]
- Bouckaert, R.; Heled, J.; Kühnert, D.; Vaughan, T.; Wu, C.-H.; Xie, D.; Suchard, M.A.; Rambaut, A.; Drummond, A.J. BEAST 2: A Software Platform for Bayesian Evolutionary Analysis. PLoS Comput. Bio. 2014, 10, e1003537. [Google Scholar] [CrossRef]
- Drummond, A.J.; Rambaut, A. BEAST: Bayesian Evolutionary Analysis by Sampling Trees. BMC Evol. Bio. 2007, 7, 214. [Google Scholar] [CrossRef] [PubMed]
- Ripley, B.D. The R Project in Statistical Computing. MSOR Connect. Newsl. LTSN Maths Stats OR Netw. 2001, 1, 23–25. [Google Scholar] [CrossRef]
- Vieilledent, G.; Gardi, O.; Grinand, C.; Burren, C.; Andriamanjato, M.; Camara, C.; Gardner, C.J.; Glass, L.; Rasolohery, A.; Rakoto Ratsimba, H.; et al. Bioclimatic Envelope Models Predict a Decrease in Tropical Forest Carbon Stocks with Climate Change in Madagascar. J. Ecol. 2016, 104, 703–715. [Google Scholar] [CrossRef]
- Fick, S.E.; Hijmans, R.J. WorldClim 2: New 1-Km Spatial Resolution Climate Surfaces for Global Land Areas. Int. J. Cli. 2017, 37, 4302–4315. [Google Scholar] [CrossRef]
- Muscarella, R.; Galante, P.J.; Soley-Guardia, M.; Boria, R.A.; Kass, J.M.; Uriarte, M.; Anderson, R.P. ENMeval: An R Package for Conducting Spatially Independent Evaluations and Estimating Optimal Model Complexity for Maxent Ecological Niche Models. Methods Ecol. Evol. 2014, 5, 1198–1205. [Google Scholar] [CrossRef]
- Brown, J.L.; Yoder, A.D. Shifting Ranges and Conservation Challenges for Lemurs in the Face of Climate Change. Ecol. Evol. 2015, 5, 1131–1142. [Google Scholar] [CrossRef]
- Kramer-Schadt, S.; Niedballa, J.; Pilgrim, J.D.; Schröder, B.; Lindenborn, J.; Reinfelder, V.; Stillfried, M.; Heckmann, I.; Scharf, A.K.; Augeri, D.M.; et al. The Importance of Correcting for Sampling Bias in MaxEnt Species Distribution Models. Divers. Distrib. 2013, 19, 1366–1379. [Google Scholar] [CrossRef]
- Kass, J.M.; Muscarella, R.; Galante, P.J.; Bohl, C.L.; Pinilla-Buitrago, G.E.; Boria, R.A.; Soley-Guardia, M.; Anderson, R.P. ENMeval 2.0: Redesigned for Customizable and Reproducible Modeling of Species’ Niches and Distributions. Methods Ecol. Evol. 2021, 12, 1602–1608. [Google Scholar] [CrossRef]
- Phillips, S.J.; Anderson, R.P.; Dudík, M.; Schapire, R.E.; Blair, M.E. Opening the Black Box: An Open-Source Release of Maxent. Ecography 2017, 40, 887–893. [Google Scholar] [CrossRef]
- Chambers, J.M. Software for Data Analysis: Programming with R, 3rd ed.; Springer: New York, NY, USA, 2008. [Google Scholar]
- Kass, J.M.; Anderson, R.P.; Espinosa-Lucas, A.; Juárez-Jaimes, V.; Martínez-Salas, E.; Botello, F.; Tavera, G.; Flores-Martínez, J.J.; Sánchez-Cordero, V. Biotic Predictors with Phenological Information Improve Range Estimates for Migrating Monarch Butterflies in Mexico. Ecography 2020, 43, 341–352. [Google Scholar] [CrossRef]
- Radosavljevic, A.; Anderson, R.P. Making Better Maxent Models of Species Distributions: Complexity, Overfitting and Evaluation. J. Biogeogr. 2014, 41, 629–643. [Google Scholar] [CrossRef]
- Warren, D.L.; Glor, R.E.; Turelli, M. Environmental Niche Equivalency Versus Conservatism: Quantitative Approaches to Niche Evolution. Evolution 2008, 62, 2868–2883. [Google Scholar] [CrossRef]
- Warren, D.L.; Matzke, N.J.; Cardillo, M.; Baumgartner, J.B.; Beaumont, L.J.; Turelli, M.; Glor, R.E.; Huron, N.A.; Simões, M.; Iglesias, T.L.; et al. ENMTools 1.0: An R Package for Comparative Ecological Biogeography. Ecography 2021, 44, 504–511. [Google Scholar] [CrossRef]
- Salmona, J.; Rasolondraibe, E.; Jan, F.; Besolo, A.; Rakotoarisoa, H.; Meyler, S.V.; Wohlhauser, S.; Rabarivola, C.; Chikhi, L. Conservation Status and Abundance of the Crowned Sifaka (Propithecus Coronatus). Primate Conserv. 2014, 2014, 73–83. [Google Scholar] [CrossRef]
- Godfrey, L.R.; Samonds, K.E.; Baldwin, J.W.; Sutherland, M.R.; Kamilar, J.M.; Allfisher, K.L. Mid-Cenozoic Climate Change, Extinction, and Faunal Turnover in Madagascar, and Their Bearing on the Evolution of Lemurs. BMC Evol. Biol. 2020, 20, 1–18. [Google Scholar] [CrossRef] [PubMed]
- Lei, R.; Frasier, C.L.; Hawkins, M.T.R.; Engberg, S.E.; Bailey, C.A.; Johnson, S.E.; McLain, A.T.; Groves, C.P.; Perry, G.H.; Nash, S.D.; et al. Phylogenomic Reconstruction of Sportive Lemurs (Genus Lepilemur) Recovered from Mitogenomes with Inferences for Madagascar Biogeography. J. Hered. 2016, 108, 107–119. [Google Scholar]
- Blair, C.; Heckman, K.L.; Russell, A.L.; Yoder, A.D. Multilocus Coalescent Analyses Reveal the Demographic History and Speciation Patterns of Mouse Lemur Sister Species. BMC Evol. Biol. 2014, 14, 57. [Google Scholar] [CrossRef] [PubMed]
- Frasier, C.L.; Lei, R.; McLain, A.T.; Taylor, J.M.; Bailey, C.A.; Ginter, A.L.; Nash, S.D.; Randriamampionona, R.; Groves, C.P.; Mittermeier, R.A. A New Species of Dwarf Lemur (Cheirogaleidae: Cheirogaleus Medius Group) from the Ankarana and Andrafiamena–Andavakoera Massifs, Madagascar. Primate Conserv. 2016, 30, 59–72. [Google Scholar]
- Groeneveld, L.F.; Blanco, M.B.; Raharison, J.-L.; Rahalinarivo, V.; Rasoloarison, R.M.; Kappeler, P.M.; Godfrey, L.R.; Irwin, M.T. MtDNA and NDNA Corroborate Existence of Sympatric Dwarf Lemur Species at Tsinjoarivo, Eastern Madagascar. Mol. Phylogenetics Evol. 2010, 55, 833–845. [Google Scholar] [CrossRef]
- Markolf, M.; Kappeler, P.M. Phylogeographic Analysis of the True Lemurs (Genus Eulemur) Underlines the Role of River Catchments for the Evolution of Micro-Endemism in Madagascar. Front. Zool. 2013, 10, 1–17. [Google Scholar] [CrossRef]
- Williams, R.C.; Blanco, M.B.; Poelstra, J.W.; Hunnicutt, K.E.; Comeault, A.A.; Yoder, A.D. Conservation Genomic Analysis Reveals Ancient Introgression and Declining Levels of Genetic Diversity in Madagascar’s Hibernating Dwarf Lemurs. Heredity 2020, 124, 236–251. [Google Scholar] [CrossRef]
- Wilmet, L.; Schwitzer, C.; Devillers, P.; Beudels-Jamar, R.C.; Vermeulen, C. Speciation in Malagasy Lemurs: A Review of the Cryptic Diversity in Genus Lepilemur. Biotechnol. Agron. Société Environ. 2014, 18, 577–588. [Google Scholar]
- Yoder, A.D.; Rasoloarison, R.M.; Goodman, S.M.; Irwin, J.A.; Atsalis, S.; Ravosa, M.J.; Ganzhorn, J.U. Remarkable Species Diversity in Malagasy Mouse Lemurs (Primates Microcebus). Proc. Natl. Acad. Sci. USA 2000, 97, 11325–11330. [Google Scholar] [CrossRef] [PubMed]
- Zimmermann, E.; Cepok, S.; Rakotoarison, N.; Zietemann, V.; Radespiel, U. Sympatric Mouse Lemurs in North-West Madagascar: A New Rufous Mouse Lemur Species (Microcebus Ravelobensis). Folia Primatol. 1998, 69, 106–114. [Google Scholar] [CrossRef]
- Poelstra, J.W.; Salmona, J.; Tiley, G.P.; Schüßler, D.; Blanco, M.B.; Andriambeloson, J.B.; Bouchez, O.; Campbell, C.R.; Etter, P.D.; Hohenlohe, P.A.; et al. Cryptic Patterns of Speciation in Cryptic Primates: Microendemic Mouse Lemurs and the Multispecies Coalescent. Syst. Biol. 2021, 70, 203–218. [Google Scholar] [CrossRef]
- Banks, M.A.; Ellis, E.R.; Wright, P.C. Global Population Size of a Critically Endangered Lemur, Perrier’s Sifaka. Anim. Conserv. 2007, 10, 254–262. [Google Scholar] [CrossRef]


| n | Species | Specific Locations |
|---|---|---|
| 8 | P. candidus | Anjanaharibe-Sud Special Reserve, Marojejy National Park |
| 15 | P. coquereli | Anjiamangirana Forest, Ankarafantsika National Park, Bora Forest, Mariarano Forest |
| 6 | P. coronatus | Anjahamena Forest |
| 8 | P. deckenii | Tsingy de Bemaraha National Park, Tsiombikibo Forest |
| 48 | P. diadema | Mantadia National Park, Anjozorobe-Angavo Protected Area, Anosibe An’Ala Forest, Mangerivola Special Reserve, Maromizaha Natural Resource Reserve, Marotandrano Special Reserve, Sahanody Forest, Tsinjoarivo Forest, Zahamena National Park |
| 25 | P. edwardsi | Andringitra National Park, Fandriana Forest, Marolambo National Park, Ranomafana National Park, Tolongoina Forest |
| 17 | P. perrieri | Analamerana Special Reserve, Andrafiamena Andavakoera Protected Area |
| 22 | P. tattersalli | Andranotsimaty Forest, Antobinitsimihety Forest, Binara Forest, Bobankora Forest, Daraina (Matamena Forest), Mahabenofy Forest |
| 59 | P. verreauxi | Analalava Forest, Andohahela National Park, Ankaboa Forest, Ankilelignisa Forest, Menabe Antimena Protected Area, Bezà-Mahafaly Special Reserve, Ifotaka Forest, Isalo National Park, Kirindy Mité National Park, Lavavolo Forest, Manakaralahy Forest, Matsandry Atsimo Forest, Tsimanampetsotsa National Park, Zombitse-Vohibasia National Park |
| outgroups | ||
| 2 | Lemur catta | Anakaboa Forest |
| 1 | Indri indri | Zahamena National Park |
| 1 | Avahi peyrierasi | Ranomafana National Park |
| Total: | 212 | Including outgroups |
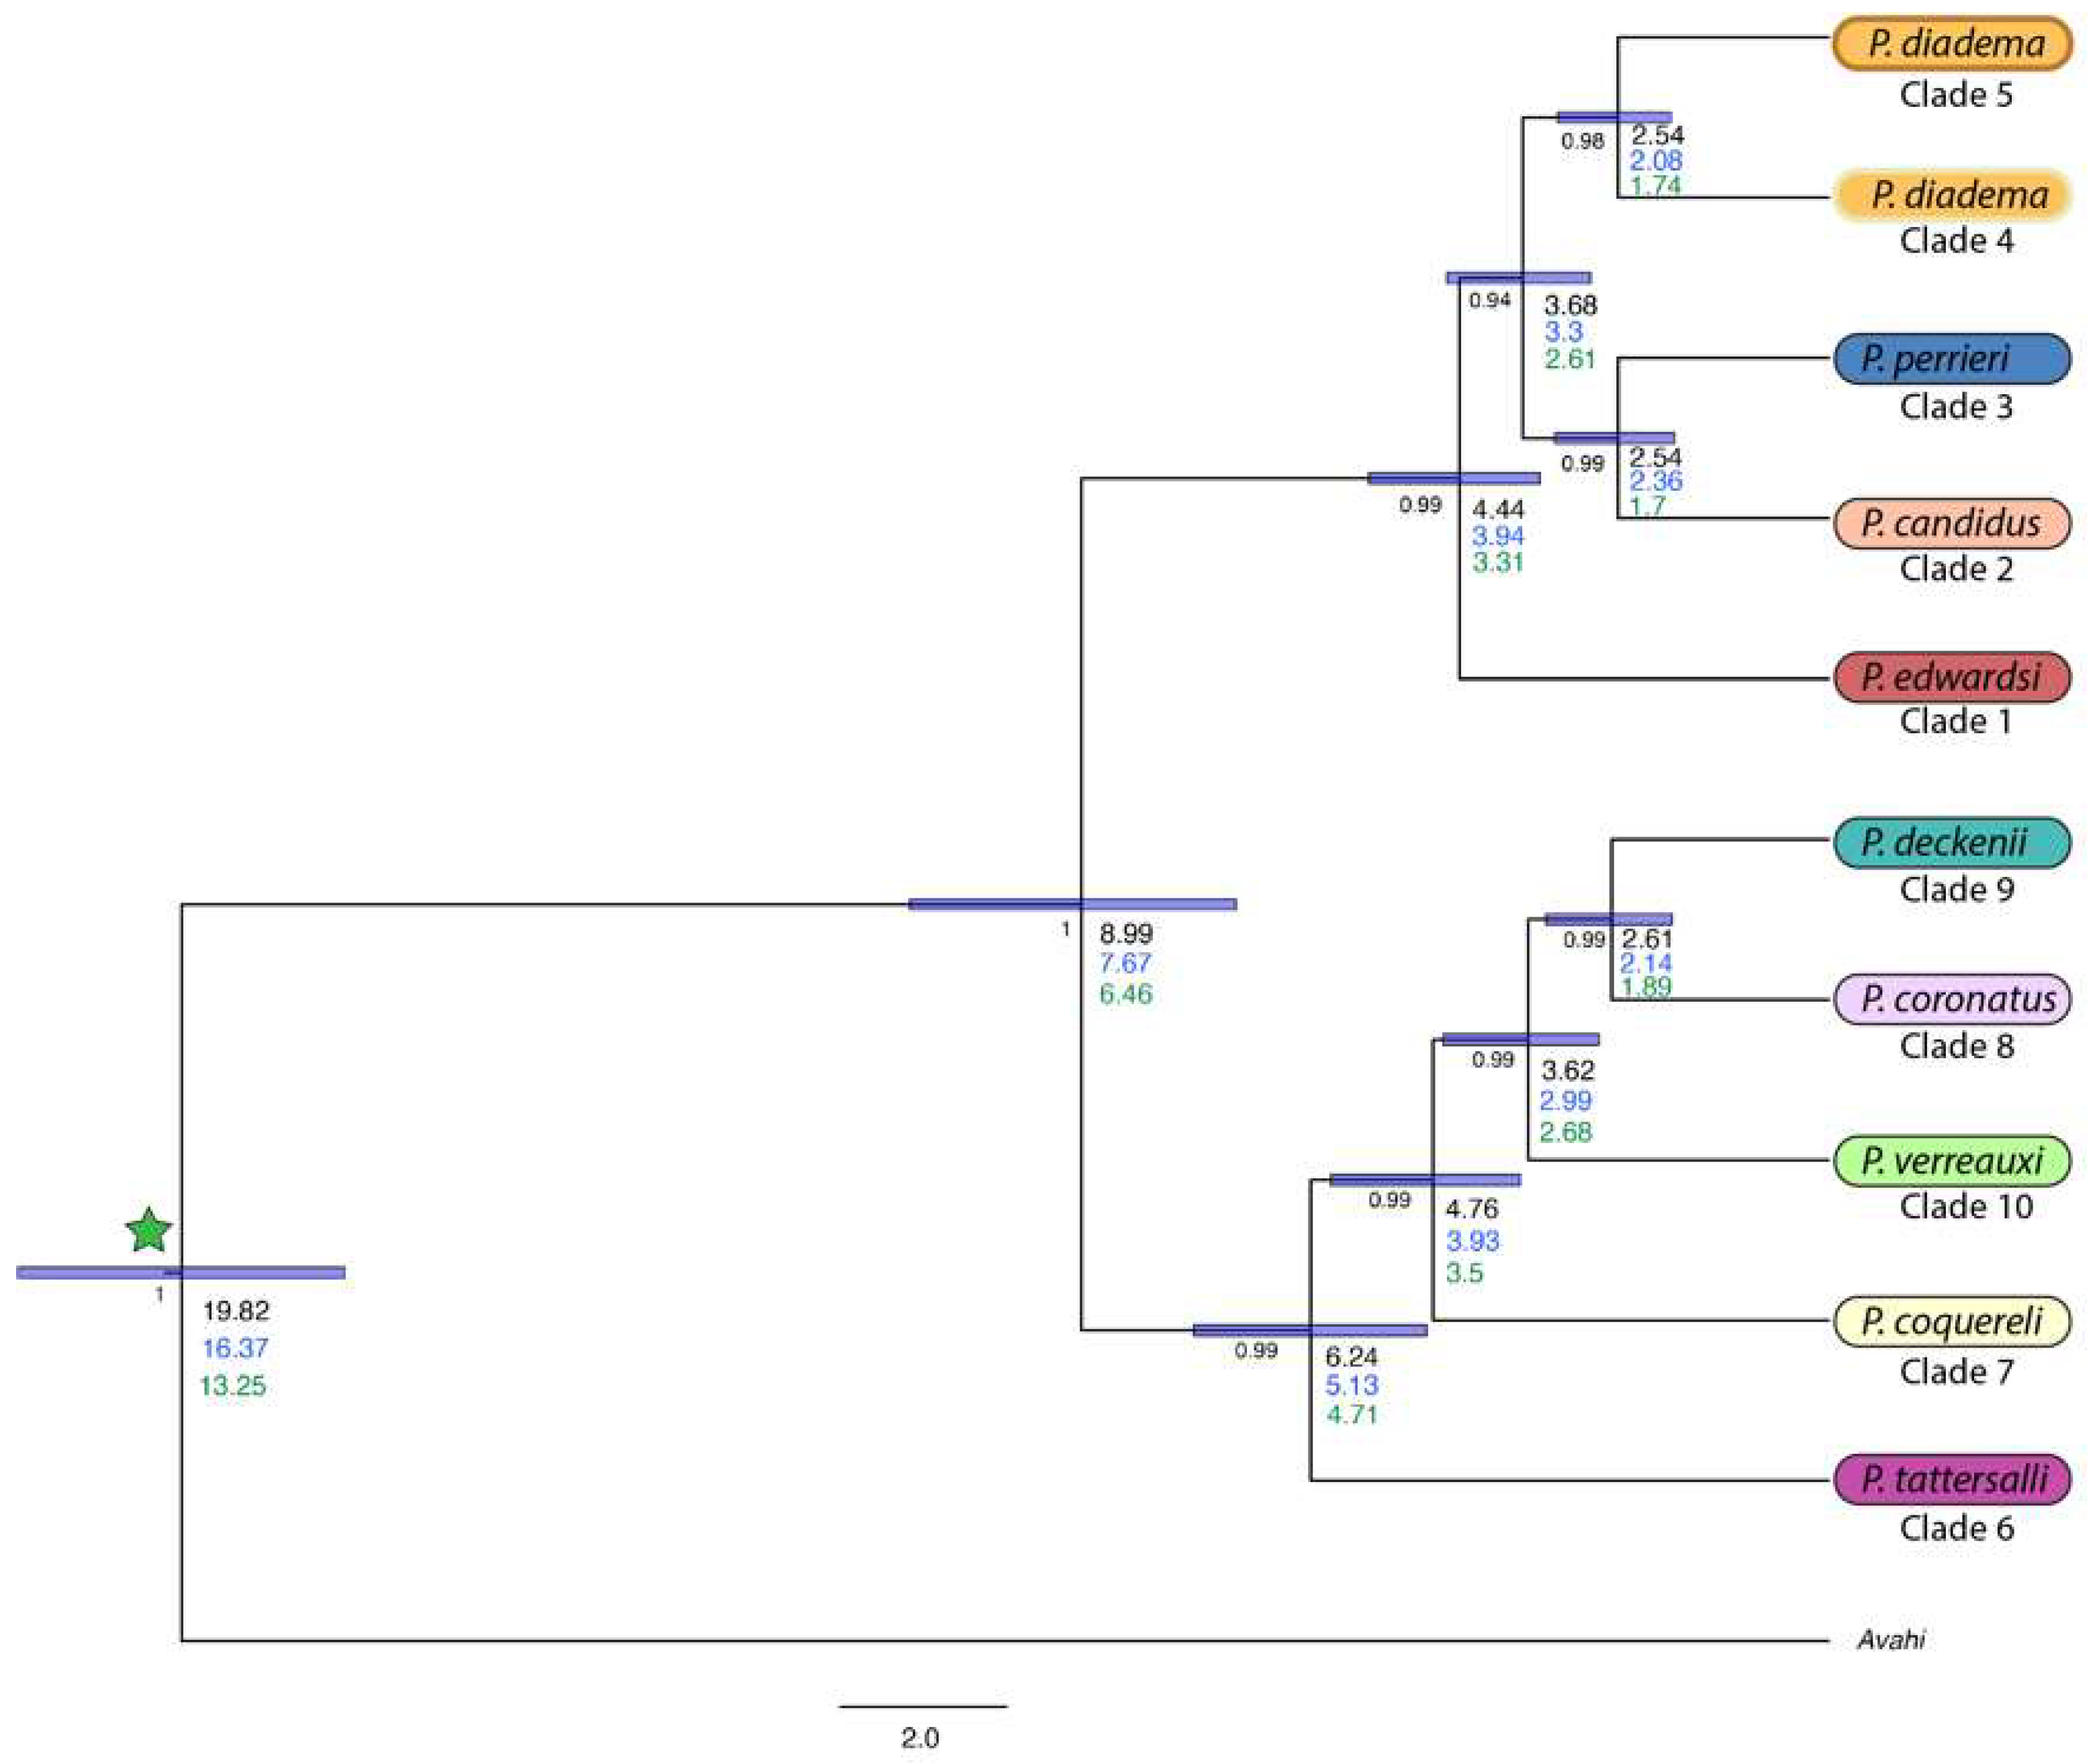
| 10KTrees [66] | Herrera & Davalos [67] | Kistler et al. [68] | |
|---|---|---|---|
| Avahi-Propithecus calibration | 16.5 | 19.99 | 13.4 |
| recovered date: | 16.38 (14.38–18.32) | 19.82 (17.86–21.79) | 13.25 (11.24–15.17) |
| East-West divergence | 7.6 (5.71–9.53) | 8.99 (7.14–11.06) | 6.46 (4.53–7.58) |
| Western Sifakas | |||
| P. tattersalli | 5.27 (3.92–6.59) | 6.24 (4.84–7.64) | 4.71 (3.03–5.46) |
| P. coquereli | 4.12 (2.97–5.12) | 4.76 (3.71–5.99) | 3.5 (2.12–4.97) |
| P. verreauxi | 3.14 (2.23–3.9) | 3.62 (2.76–4.64) | 2.68 (1.49–3.64) |
| P. coronatus/P. deckenii | 2.26 (1.55–2.86) | 2.61 (1.88–3.4) | 1.89 (1.11–2.61) |
| Eastern Sifakas | |||
| P. edwardsi | 3.72 (2.77–4.74) | 4.44 (3.78–5.54) | 3.31 (1.88–5.36) |
| P. diadema- P. candidus/P. perrieri | 3.06 (2.27–3.91) | 3.68 (2.87–4.59) | 2.61 (1.64–3.54) |
| P. candidus- P. perrieri | 2.11 (1.49–2.77) | 2.54 (1.86–3.3) | 1.7 (1.15–2.38) |
| P. diadema clade 5 | P. diadema clade 4 | P. edwardsi | |
|---|---|---|---|
| P. diadema clade 5 | 1 | 0.23 * | 0.10 * |
| P. diadema clade 4 | 0.49 * | 1 | 0.24 * |
| P. edwardsi | 0.26 * | 0.51 * | 1 |
Publisher’s Note: MDPI stays neutral with regard to jurisdictional claims in published maps and institutional affiliations. |
© 2022 by the authors. Licensee MDPI, Basel, Switzerland. This article is an open access article distributed under the terms and conditions of the Creative Commons Attribution (CC BY) license (https://creativecommons.org/licenses/by/4.0/).
Share and Cite
Hawkins, M.T.R.; Bailey, C.A.; Brown, A.M.; Tinsman, J.; Hagenson, R.A.; Culligan, R.R.; Barela, A.G.; Randriamanana, J.C.; Ranaivoarisoa, J.F.; Zaonarivelo, J.R.; et al. Nuclear and Mitochondrial Phylogenomics of the Sifakas Reveal Cryptic Variation in the Diademed Sifaka. Genes 2022, 13, 1026. https://doi.org/10.3390/genes13061026
Hawkins MTR, Bailey CA, Brown AM, Tinsman J, Hagenson RA, Culligan RR, Barela AG, Randriamanana JC, Ranaivoarisoa JF, Zaonarivelo JR, et al. Nuclear and Mitochondrial Phylogenomics of the Sifakas Reveal Cryptic Variation in the Diademed Sifaka. Genes. 2022; 13(6):1026. https://doi.org/10.3390/genes13061026
Chicago/Turabian StyleHawkins, Melissa T. R., Carolyn A. Bailey, Allyshia M. Brown, Jen Tinsman, Ryan A. Hagenson, Ryan R. Culligan, Adena G. Barela, Jean C. Randriamanana, Jean F. Ranaivoarisoa, John R. Zaonarivelo, and et al. 2022. "Nuclear and Mitochondrial Phylogenomics of the Sifakas Reveal Cryptic Variation in the Diademed Sifaka" Genes 13, no. 6: 1026. https://doi.org/10.3390/genes13061026
APA StyleHawkins, M. T. R., Bailey, C. A., Brown, A. M., Tinsman, J., Hagenson, R. A., Culligan, R. R., Barela, A. G., Randriamanana, J. C., Ranaivoarisoa, J. F., Zaonarivelo, J. R., & Louis, E. E., Jr. (2022). Nuclear and Mitochondrial Phylogenomics of the Sifakas Reveal Cryptic Variation in the Diademed Sifaka. Genes, 13(6), 1026. https://doi.org/10.3390/genes13061026