Article

DLK2 Acts as a Potential Prognostic Biomarker for Clear Cell Renal Cell Carcinoma Based on Bioinformatics Analysis

1
Department of Surgery, Division of Urology, Kaohsiung Armed Forces General Hospital, Kaohsiung 80284, Taiwan
2
Department of Surgery, Division of Urology, Zuoying Branch of Kaohsiung Armed Forces General Hospital, Kaohsiung 81342, Taiwan
3
Medical Laboratory, Medical Education and Research Center, Kaohsiung Armed Forces General Hospital, Kaohsiung 80284, Taiwan
4
Department of Internal Medicine, Division of Cardiology, Kaohsiung Armed Forces General Hospital, Kaohsiung 80284, Taiwan
5
Department of Internal Medicine, Division of Cardiology, Tri-Service General Hospital, National Defense Medical Center, Taipei 11490, Taiwan
6
Institute of Medical Science and Technology, National Sun Yat-sen University, Kaohsiung 80424, Taiwan
7
Department of Psychiatry, Kaohsiung Armed Forces General Hospital, Kaohsiung 80284, Taiwan
8
Department of Internal Medicine, Division of Gastroenterology and Hepatology, Kaohsiung Armed Forces General Hospital, Kaohsiung 80284, Taiwan
9
Department of Internal Medicine, Division of Gastroenterology and Hepatology, Tri-Service General Hospital, National Defense Medical Center, Taipei 11490, Taiwan
10
Department of Internal Medicine, Division of Nephrology, Kaohsiung Chang Gung Memorial Hospital and Chang Gung University College of Medicine, Kaohsiung 83301, Taiwan
11
Department of Surgery, Division of Colorectal Surgery, Kaohsiung Armed Forces General Hospital, Kaohsiung 80284, Taiwan
12
Department of Nursing, Kaohsiung Armed Forces General Hospital, Kaohsiung 80284, Taiwan
13
Institute of Biomedical Sciences, National Sun Yat-sen University, Kaohsiung 80424, Taiwan
14
Department of Pathology, Kaohsiung Armed Forces General Hospital, Kaohsiung 80284, Taiwan
15
Center for Neuroscience, National Sun Yat-sen University, Kaohsiung 80424, Taiwan
16
Department of Radiation Oncology, Kaohsiung Veterans General Hospital, Kaohsiung 813414, Taiwan
17
Department of Medical Education and Research, Kaohsiung Veterans General Hospital, Kaohsiung 813414, Taiwan
18
Department of Internal Medicine, Division of Hepato-Gastroenterology, Kaohsiung Chang Gung Memorial Hospital, Chang Gung University College of Medicine, Kaohsiung 83301, Taiwan
19
Section of Cardiology, Department of Internal Medicine, Kaohsiung Chang Gung Memorial Hospital, Kaohsiung 83301, Taiwan
20
Doctoral Degree Program in Marine Biotechnology, National Sun Yat-sen University and Academia Sinica, Kaohsiung 80424, Taiwan
21
Department of Marine Biotechnology and Resources, Asia-Pacific Ocean Research Center, National Sun Yat-sen University, Kaohsiung 80424, Taiwan
22
Department of Pathology, Kaohsiung Chang Gung Memorial Hospital and Chang Gung University College of Medicine, Kaohsiung 83301, Taiwan
23
Biobank and Tissue Bank, Kaohsiung Chang Gung Memorial Hospital, Kaohsiung 83301, Taiwan
*
Authors to whom correspondence should be addressed.
These authors contributed equally to this work.
Genes 2022, 13(4), 629; https://doi.org/10.3390/genes13040629
Submission received: 10 March 2022 / Revised: 26 March 2022 / Accepted: 28 March 2022 / Published: 1 April 2022
(This article belongs to the Special Issue Application of Bioinformatics in Human Cancers)

Abstract

:
Clear cell renal cell carcinoma (ccRCC) is the most common RCC subtype with a high mortality. It has been reported that delta-like 1 homologue (DLK1) participates in the tumor microenvironmental remodeling of ccRCC, but the relationship between delta-like 2 homologue (DLK2, a DLK1 homologue) and ccRCC is still unclear. Thus, this study aims to investigate the role of DLK2 in the biological function and disease prognosis of ccRCC using bioinformatics analysis. The TNMplot database showed that DLK2 was upregulated in ccRCC tissues. From the UALCAN analysis, the overexpression of DLK2 was associated with advanced stage and high grade in ccRCC. Moreover, the Kaplan-Meier plotter (KM Plotter) database showed that DLK2 upregulation was associated with poor survival outcome in ccRCC. By the LinkedOmics analysis, DLK2 signaling may participated in the modulation of ccRCC extracellular matrix (ECM), cell metabolism, ribosome biogenesis, TGF-β signaling and Notch pathway. Besides, Tumor Immune Estimation Resource (TIMER) analysis showed that the macrophage and CD8+ T cell infiltrations were associated with good prognosis in ccRCC patients. Finally, DLK2 overexpression was associated with the reduced macrophage recruitments and the M1–M2 polarization of macrophage in ccRCC tissues. Together, DLK2 may acts as a novel biomarker, even therapeutic target in ccRCC. However, this study lacks experimental validation, and further studies are required to support this viewpoint.

1. Introduction

As one of the most common cancers, renal cell carcinoma (RCC) accounts for around 2–3% of all malignancies [1]. Clear cell renal cell carcinoma (ccRCC) is the most prevalent subtype of kidney cancers, accounting for ~85% of all renal cell carcinomas [2]. Metastases are observed in ~25–30% of ccRCC patients uon first diagnosis; moreover, 20–30% of patients with localized ccRCC have metastases after standard therapy [3]. Both inherited and sporadic ccRCCs are usually associated with structural changes in the chromosome p3 [4], and other potential risk factors include age, gender, lifestyle, complications, drugs, and environmental contaminants [5]. Furthermore, the development of ccRCC is related to multiple gene dysregulations, such as polybromo-1 (PBRM1), BRCA1-associated protein 1 (BAP1), SET domain-containing 2 (SETD2), transcription elongation factor B (SIII), polypeptide 1 (15kDa, elongin C) (TCEB1), lysine (K)-specific demethylase 5C (KDM5C), and Von Hippel–Lindau Tumor Suppressor (VHL) [6]. Furthermore, inactivating the VHL mutation is considered a prevalent risk factor to ccRCC [7], and the dysfunction of VHL promotes neovascularization, which mediated the activation of the HIF/VEGF axis [8]. Although our knowledge of the ccRCC biology has updated, nephrectomy is still the primary option for ccRCC control [9]. For ccRCC patients with late stage or tumor recurrence, some targeted-therapy agents as the first-line drugs, including sorafenib, sunitinib, and aldesleukin, have been used [10]. However, due to different sensitivities to drugs and the genetic background between patients, the survival outcome in ccRCC patients remains poor [11]. Therefore, more potential diagnostic and prognostic biomarkers need to be identified for ccRCC patients in order to guide personalized medicine.
Although Fuhrman nuclear grading and TNM systems are useful prognostic parameters [1], they are still not perfect. Recently, it has been reported that ECM- [12,13], metabolism- [14,15,16], ribosome- [17], and immune-related genes [18,19,20,21] can serve as novel prognostic biomarkers for RCC. Moreover, the immune cell infiltration including T cells and macrophage also impacts disease prognosis in ccRCC [22,23,24,25,26]. These studied indicate that the genetic change in the tumor microenvironment can impact the survival outcome and disease prognosis in ccRCC patients. However, the further validations by more clinical and basic studies were necessary to demonstrate the accuracy of above observations. In recent years, high-throughput genomic analyses, including RNA sequencing and microarray chips, have provided us with big data sets. Computational and bioinformatics techniques have been well applied in the research of various cancers, and have been confirmed to be reliable and powerful for identifying novel biomarkers for cancer diagnosis/prognosis and personalized medicine [27,28,29].
DLK1 (Delta-like 2 Homologue 1) and DLK2 (Delta-like 2 Homologue 2) belong to the EGF-like repeat-containing protein family. Transmembrane DLK1 can also be released to the circulating system after cleavage by tumor necrosis factor α converting enzyme (TACE), but DLK2 lacks the TACE protease cleavage site [30]. DLK1 as an oncoprotein is usually upregulated in many common malignancies (liver, breast, brain, pancreas, colon, and lung). More recently, it has been reported that the overexpression of DLK1 is shown in endocrine-related cancers such as ovarian and adrenocortical carcinoma [31]. Reportedly, DLK1 and DLK2 are two homologous transmembrane proteins, with six extracellular EGF-like repeats that bind with the NOTCH1 receptor and function as endogenous NOTCH inhibitors [32,33,34]. Interestingly, some studies also indicate that DLK1 participates in the tumor progression of neuroblastoma, ovarian high-grade serous carcinoma, and lung cancer mediated the activation of NOTCH1 [35,36,37]. In the DLK2 biology, DLK2 can promote the oncogenic processes of melanoma cells through the inhibition of NOTCH signaling [38]. In kidney disease, DLK2 is upregulated in the injured kidneys after unilateral ureteral obstruction [39], but its biological role in renal inflammation remains unclear. In the RCC study, the DLK1 vaccine in murine models results in the inhibition of RCC growth, but also in the compensatory expression of DLK2 by tumor-associated pericytes [40]. Vaccines targeting both DLK1 and DLK2 show superior antitumor benefits by promoting CD8+ T cells infiltrations and tumor vascular normalization. Together, DLK2 may act as a therapeutic target for RCC control. However, the role of DLK2 expression in the prognosis of ccRCC patients remains unclear. To better study the impact on the cancer genetic network of clinical outcomes, genome-wide gene expression databases, such as The Cancer Genome Atlas (TCGA), have been set up to explore and discover large cohorts around the world [41]. TNMplot is a database for the comparison of the gene expression among normal, tumor, and metastatic tissues [42], and as a survival biomarker for multiple cancer types that can be discovered and validated using the Kaplan–Meier plotter (KMplotter) [43]. For the comprehensive analysis of cancer OMICS data, UALCAN and LinkedOmics are widely used for cancer research [44,45]. Systematical analysis of immunocytes recruitments across multiple cancer types can be analyzed by Tumor Immune Estimation Resource (TIMER) [46,47]. Based on bioinformatics analyses by the above-mentioned databases, DLK2 was identified as a potential prognostic biomarker for ccRCC.

2. Materials and Methods

2.1. Pan-Cancer Analysis

The expression range for the DLK2 gene across all tissues in all available normal and tumor RNA-Seq data was investigated using the Tumor Immune Estimation Resource (TIMER) analysis (https://cistrome.shinyapps.io/timer/) (accessed on 11 December 2021) [46,47].

2.2. TNMplot Analysis

The DLK2 expression between paired non-tumor and tumor tissues of ccRCC patients was compared using TNMplot tool (https://tnmplot.com/analysis/) (accessed between 15 August 2021 and 11 December 2021). Moreover, the renal DLK2 levels in the non-ccRCC donor and ccRCC patients were also investigated using TNMplot analysis [42].

2.3. UALCAN Analysis

The DLK2 levels in ccRCC tissues with different stages, grades, metastatic status, tumor sub-type, ages, patient races, and genders were analyzed with the UALCAN tool (http://ualcan.path.uab.edu) (accessed on 11 December 2021) [44].

2.4. Kaplan–Meier Plotter (KM Plotter) Analysis

The effect of the DLK2 expression on the overall survival and disease recurrence of ccRCC patients was studied using the KMplotter database (https://kmplot.com/analysis/) (accessed on 11 December 2021) [43].

2.5. LinkedOmics Database Analysis

The LinkedOmics database (http://www.linkedomics.org/admin.php) (accessed on 11 December 2021) is a web-based platform for analyzing 32 TCGA cancer-associated multi-dimensional datasets [45]. The DLK2-related genes were analyzed statistically using Pearson’s correlation coefficient, presenting in volcano plots, heat maps, or scatter plots. The effect of DLK2 expression on Gene Ontology (GO), including cellular component and molecular function, Kyoto Encyclopedia of Genes and Genomes (KEGG) pathways, Panther pathway, miRNA targets, and transcription factor target in ccRCC were also analyzed with the gene set enrichment analysis (GSEA) using the LinkedOmics database (accessed on 11 December 2021).

2.6. TIMER Database Analysis

TIMER is a comprehensive database for systematically analyzing immune cell recruitments across different tumor types from TCGA (https://cistrome.shinyapps.io/timer/) (accessed on 11 December 2021), which includes 10,897 samples across 32 cancer types [46,47]. TIMER uses a deconvolution strategy to deduce the composition of tumor-infiltrating immune cells from the gene expression profiles. The effect of immune cells infiltrations (macrophages, neutrophils, dendritic cells, CD4+ T cells, CD8+ T cells, and B cells) on the survival outcomes of ccRCC patients was analyzed using the TIMER tool. The correlation of the DLK2 expression and immune cell recruitments in ccRCC was further studied using the TIMER database, and the effect of the DLK2 copy number variation (CNV) on immunocytes recruitments in ccRCC was also investigated. Moreover, the correlation of the DLK2 gene expression and the levels of tumor-associated macrophage (TAMs) markers (M1/M2 markers) was studied in ccRCC patients using the TIMER tool.

2.7. Statistical Analysis

Differences between the groups were statistically evaluated using the unpaired Student’s t test. The results are showen as mean ± SD, and p < 0.05 was considered statistically significant. Moreover, the overall survival outcome and disease recurrence in DLK2High and DLK2Low ccRCC patients was analyzed using the KMplotter tool, and the log-rank test p < 0.05 was used to indicate the significance of the survival or recurrence time differences. Pearson’s correlation test was used to analyze the correlation between the DLK2 expression and related gene networks or immune cells infiltrations in ccRCC, and p < 0.05 was considered statistically significant

3. Results

3.1. DLK2 Was Upregulated in the Tumor Tissues of ccRCC Compared with Normal Kidney Tissues

In this study, we used multiple gene databases to investigate whether DLK2 can serve as a potential prognostic biomarker in ccRCC (Figure 1). Firstly, the DLK2 expression in Pan-cancer was analyzed using the TIMER tool, and TNMplot was used to analyze the DLK2 level in ccRCC tissues and normal renal tissues. For the prognositc analyses, the UALCAN database was used to study the tumoral DLK2 expression profiles in variable ccRCC patients with different disease stages, tumor grades, metastatic status, cancer subtypes, ages, patient races, and genders. The survival outcome and recurrence rate were analyzed in the DLK2High and DLK2Low ccRCC patients using KMplotter. For the molecular functional analyses, the DLK2-related gene networks in ccRCC were identified using the LinkedOmics database, and the effect of the DLK2 level on the immune cell infiltrations of ccRCC was further studied with the TIMER tool. From the Pan-cancer analysis using the TIMER tool, DLK2 was significantly upregulated in the tumor tissues compared with the non-tumor tissues in many cancer types, including ccRCC (Figure 2A) (*** p < 0.001). Using the TNMplot analysis, DLK2 was upregulated in paired ccRCC tissues compared with paired non-tumor tissues (Figure 2B) (*** p < 0.001), and the expression of DLK2 in the ccRCC tumor was significantly higher than in the kidney from the non-ccRCC donor (Figure 2C) (*** p < 0.001). Together, the DLK2 overexpression may participate in the development of ccRCC.

3.2. The DLK2 Expression Was Associated with Advanced Tumor Stages/Grades and Worse Overall Survival in ccRCC Patients

From the UALCAN analysis, DLK2 was significantly upregulated in the advanced ccRCC stage compared with the early stage (** p < 0.01) (Figure 3A). Moreover, DLK2 upregulation was observed in ccRCC tissues with high grades (* p < 0.05) (Figure 3B), and an elevated DLK2 level was also shown in the ccRCC tissues of older patients (* p < 0.05) (Figure 3C). Furthermore, the cancer subtype, metastatic status, patient race, and gender did not significantly affect the expression of DLK2 in ccRCC tissues (Figure 3D–G). To study the effect of the DLK2 expression on the overall survival and disease-free survival in ccRCC patients, the KMplotter tool was used in this study. From the Kaplan–Meier analysis, ccRCC patients with a higher DLK2 level had a significantly shorter overall survival (*** p < 0.001) (Figure 4A), but the DLK2 level in ccRCC tissues did not significantly affect disease-free survival (Figure 4B). Together, DLK2 may serve as a potential prognostic biomarker for ccRCC.

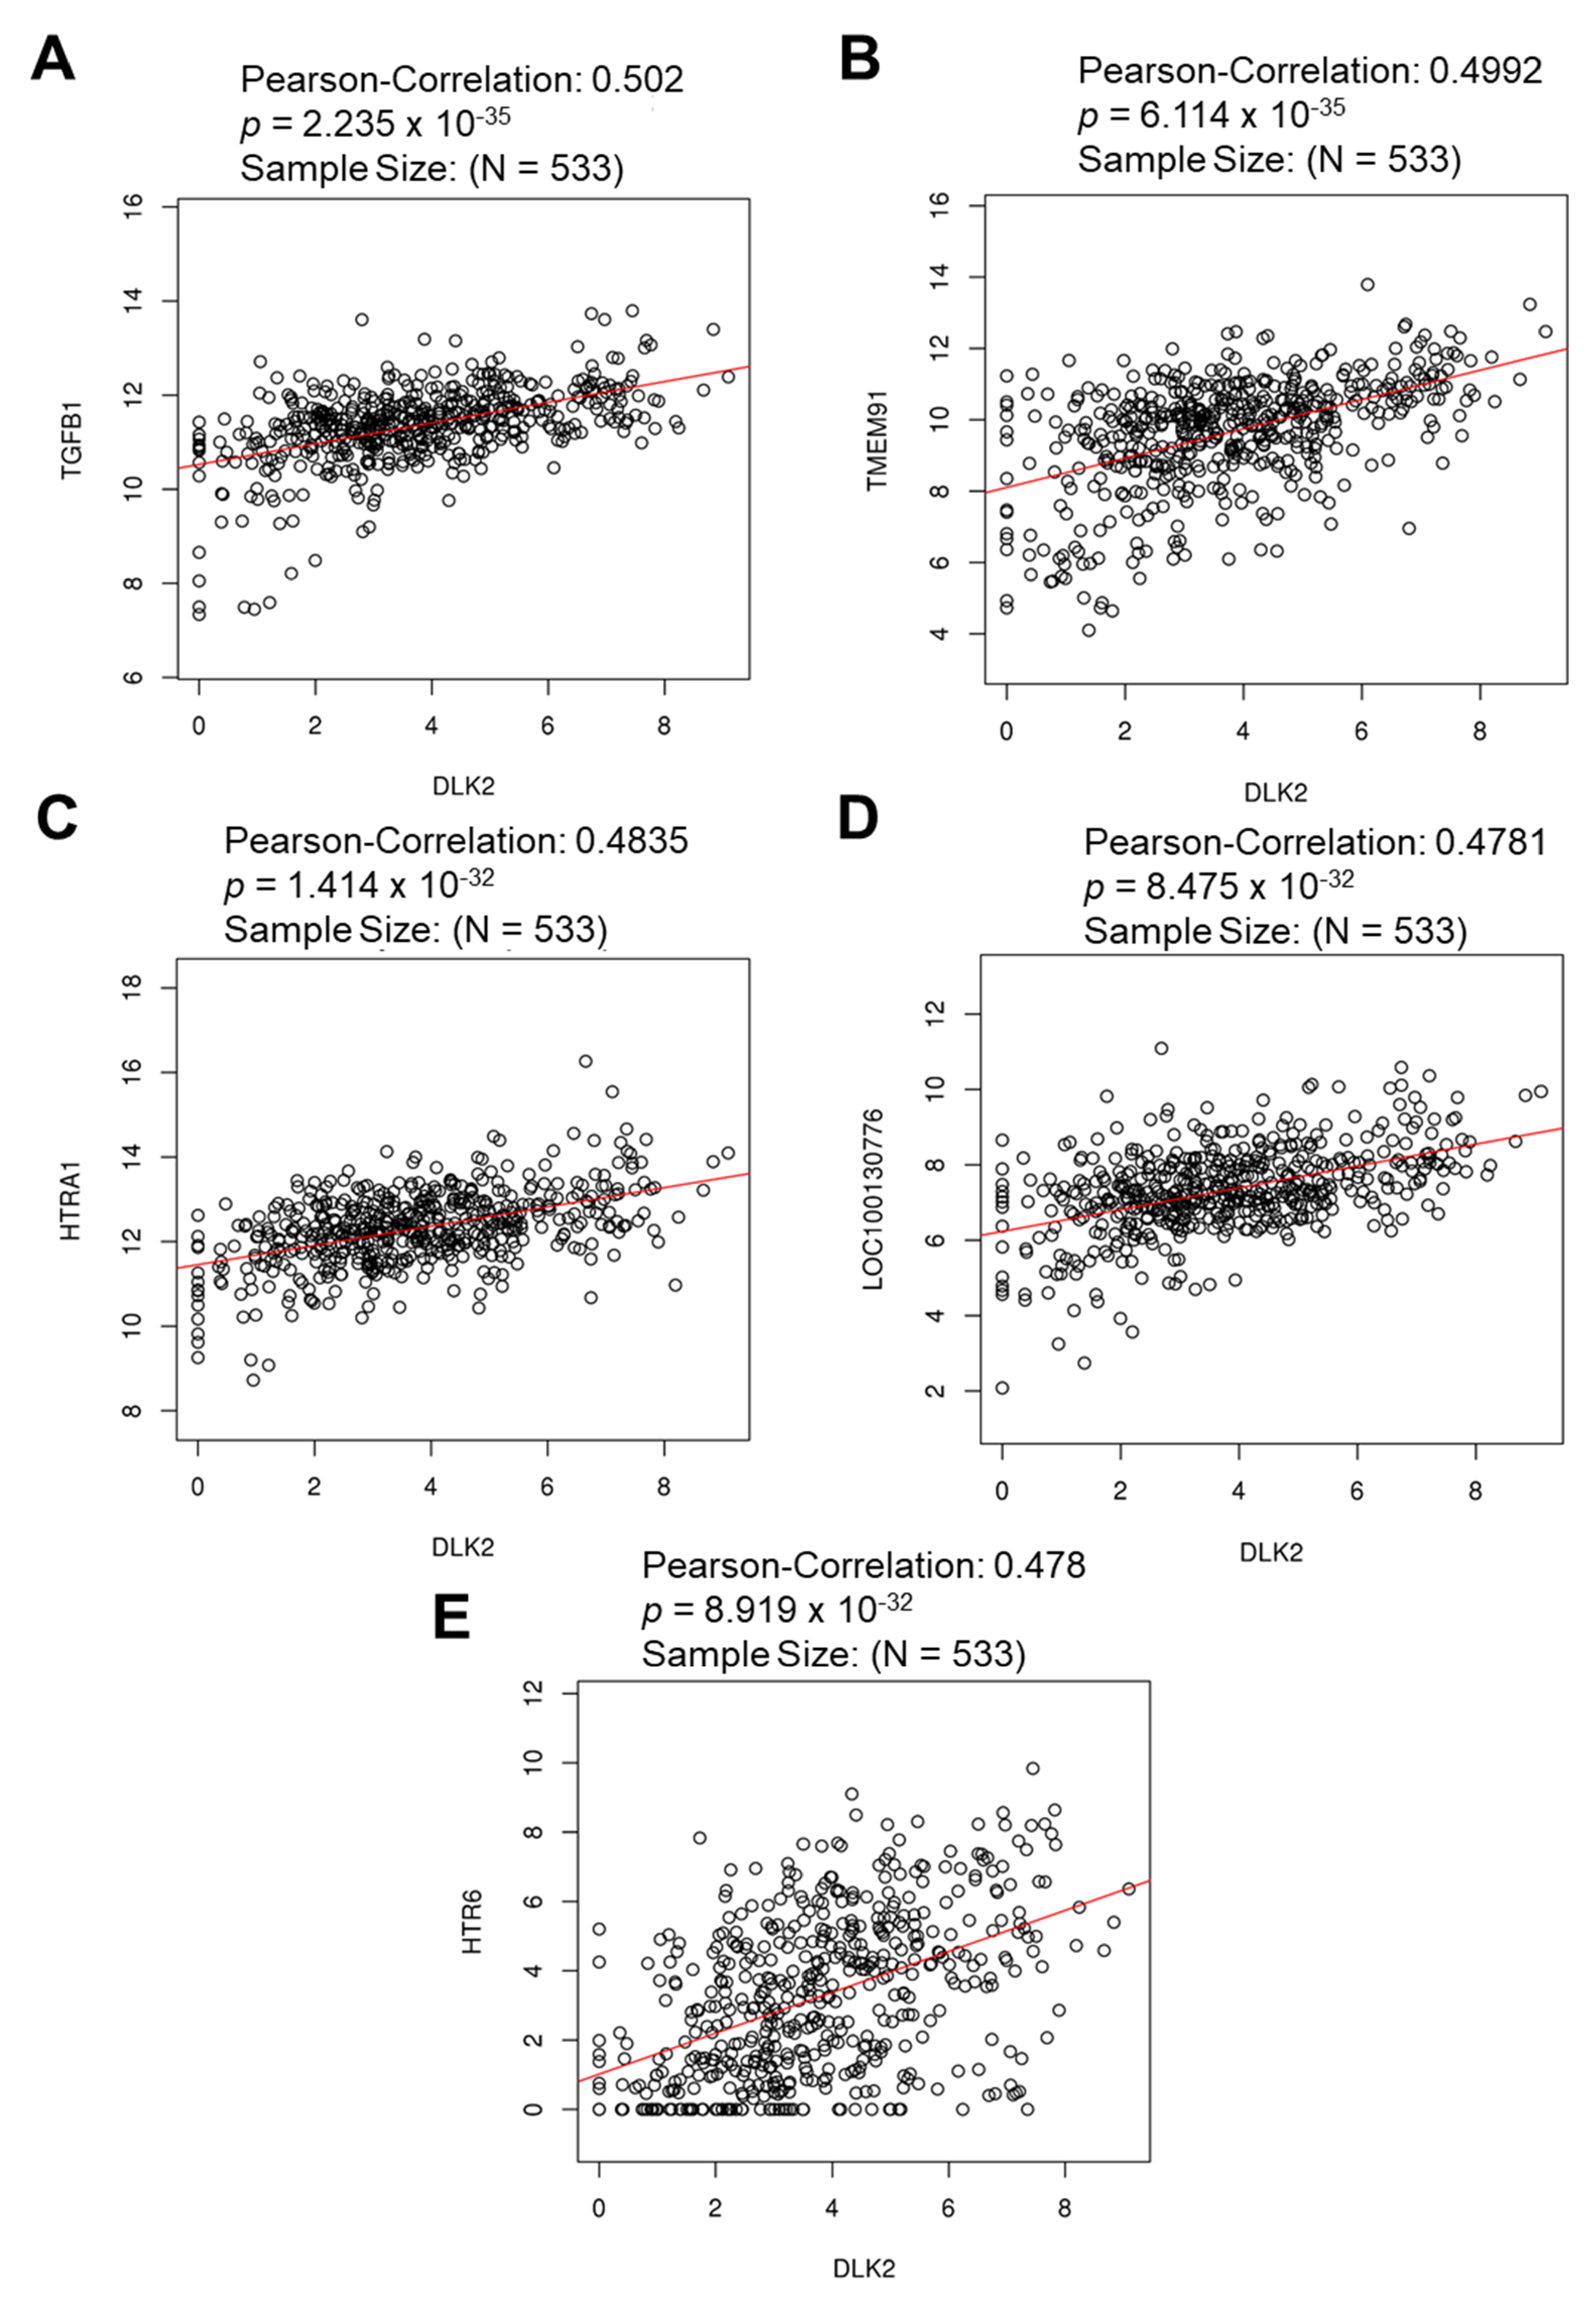
3.3. The Gene Clusters Positively and Negatively Correlated with DLK2 Expression Were Identified in ccRCC

From the LinkedOmics database analysis, the Volcano Plot showed the genes highly associated with the DLK2 level in ccRCC (Figure 5A). The top 50 significant genes positively and negatively correlated with the DLK2 level are shown in the heat map in Figure 5B,C. Using Pearson’s correlation analysis, the DLK2 expression showed a strong positive correlation with the transforming growth factor β 1 (TGFβ1) (r = 0.502, p = 2.235 × 10⁻³⁵), transmembrane protein 91 (TMEM91) (r = 0.4992, p = 6.114 × 10⁻³⁵), HtrA serine peptidase 1 (HTRA1) (r = 0.4992, p = 6.114 × 10⁻³⁵), AGAP2 antisense RNA 1 (AGAP2-AS1) (LOC100130776) (r = 0.4781, p = 8.475 × 10⁻³²), and 5-Hydroxytryptamine receptor 6 (HTR6) (r = 0.478, p = 8.919 × 10⁻³²) levels in human ccRCC tissues (Figure 6). In addition, the expressions of branched chain keto acid dehydrogenase E1 subunit β (BCKDHB) (r = −0.4698, p = 1.293 × 10⁻³⁰), pleckstrin homology domain containing B2 (PLEKHB2) (r = −0.4499, p = 6.472 × 10⁻²⁸), GTP binding elongation factor GUF1 (GUF1) (r = −0.447, p = 1.51 × 10⁻²⁷), adenosine deaminase like (ADAL) (r = −0.4282, p = 3.533 × 10⁻²⁵), and ELMO domain containing 2 (ELMOD2) (r = −0.4245, p = 9.855 × 10⁻²⁵) were highly and negatively correlated to the DLK2 levels in the ccRCC tumors (Figure 7).
To further identify the molecular targets of DLK2 in ccRCC, we analyzed the potent miRNA and transcription factor targets using the LinkedOmics tool. The most correlated microRNA-targets of DLK2 in ccRCC were GGGGCCC, miR-296 (p = 0), CCAGGGG, miR-331 (p = 0), AGCTCCT, miR-28 (p = 0.002294), CATGTAA, miR-496 (p = 0.032258), and TTTTGAG, miR-373 (p = 0.045455) (Table 1). Furthermore, the most correlated transcript factor-targets of DLK2 in ccRCC were V$LFA1_Q6 (genes with 3’UTR containing motif GGGSTCWR, which matches annotation for ITGAL) (p = 0), V$MAZR_01 (genes with 3’UTR containing motif NSGGGGGGGGMCN, which matches annotation for ZNF278) (p = 0), V$VDR_Q3 (genes with 3’UTR containing motif GGGKNARNRRGGWSA, which matches annotation for VDR) (p = 0), V$ZIC3_01 (genes with 3’UTR containing motif NGGGKGGTC, which matches annotation for ZIC3) (p = 0), and GGGNNTTTCC_V$NFKB_Q6_01 (genes with 3′UTR containing motif GGGNNTTTCC, which matches annotation for NFκB) (p = 0).

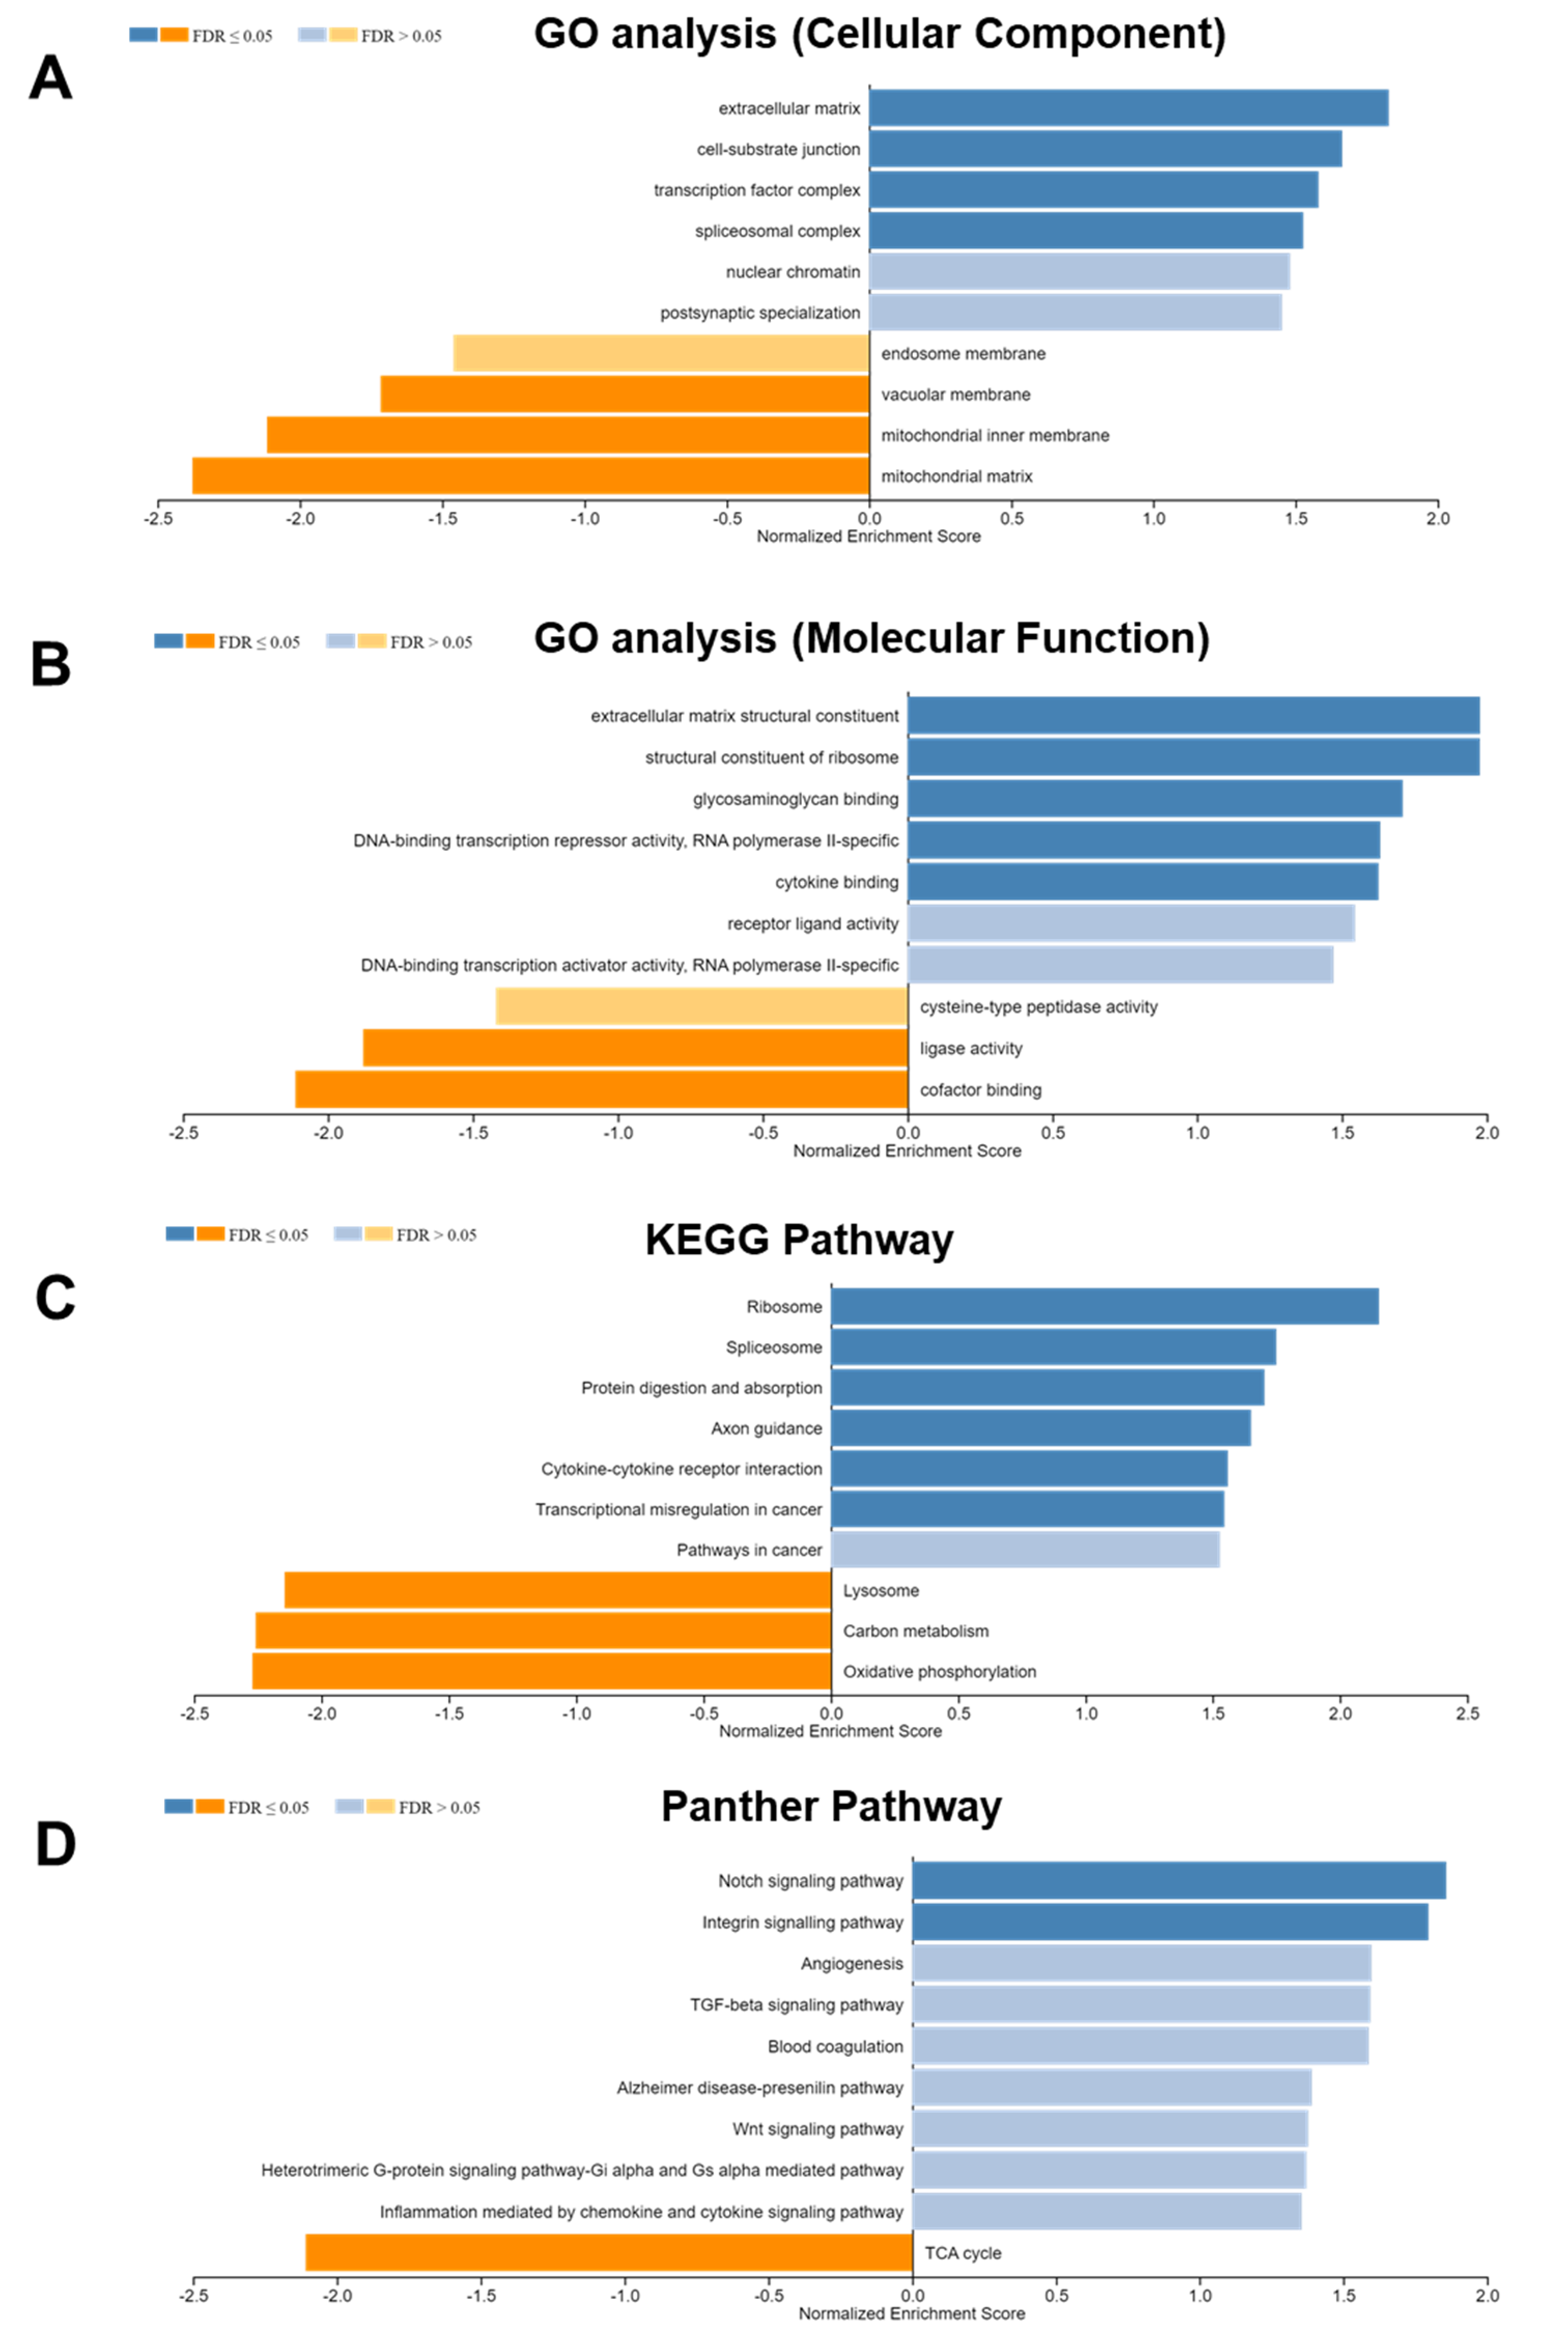
3.4. DLK2-Associated Functional Enrichment Items in ccRCC Were Identified Using the LinkedOmics Tool

In order to examine the DLK2-related functions in ccRCC, we performed an enrichment analysis using the LinkedOmics tool. The Gene Ontology (GO) analysis for cellular components showed that DLK2 was mainly involved in the positive regulation of the extracellular matrix-, cell-substrate junction-, transcription factor complex-, spliceosomal complex-, nuclear chromatin-, and postsynaptic specialization-associated gene clusters (Figure 8A), and endosome membrane-/vacuolar membrane-/mitochondria inner membrane-/mitochondria matrix-related gene expressions were negatively correlated with the DLK2 level in ccRCC. In the GO analysis for molecular function, DLK2 may positively regulate the genes participating in the extracellular matrix structural constituent, structural constituent of ribosome, glycosaminoglycan binding, DNA-binding transcription repressor activity (RNA polymerase II-specific), cytokine binding, receptor ligand activity, and DNA-binding transcription activator activity (RNA polymerase II-specific) (Figure 8B), and the cell molecular functions for cysteine-type peptidase activity/ligase activiy/cofactor binding may be negatively modulated by DLK2 in ccRCC. Moreover, the Kyoto Encyclopedia of Genes and Genomes (KEGG) pathway analysis showed that DLK2 were positively modulated in the gene networks that participated in ribosome biogenesis, splicesome formation, protein digestion/absorption, axon guidance, cytokine–cytokine receptor interaction, transcriptional misregulation of cancer, and pathways in cancer (Figure 8C), and lysosome-/carbon metabolism-/oxidative phosphorylation-related gene networks was negatively regulated by DLK2 in ccRCC. By the Panther pathway analysis, DLK2 may positively modulate the Notch signaling pathway, integrin signaling pathway, angiogenesis, TGF-β signaling pathway, blood coagulation, Alzheimer disease-presenilin pathway, Wnt signaling pathway, heterotrimeric G-protein signaling pathway/Gs α mediated pathway, and inflammation mediated by chemokine/cytokine signaling pathway (Figure 8D), and the tricarboxylic acid (TCA) cycle was negatively modulated by DLK2 in ccRCC. Together, the extracellular matrix (ECM), cell metabolism, ribosome biogenesis, TGF-β signaling, and Notch pathway may have participated in the DLK2-promoted oncogenic processes in ccRCC.

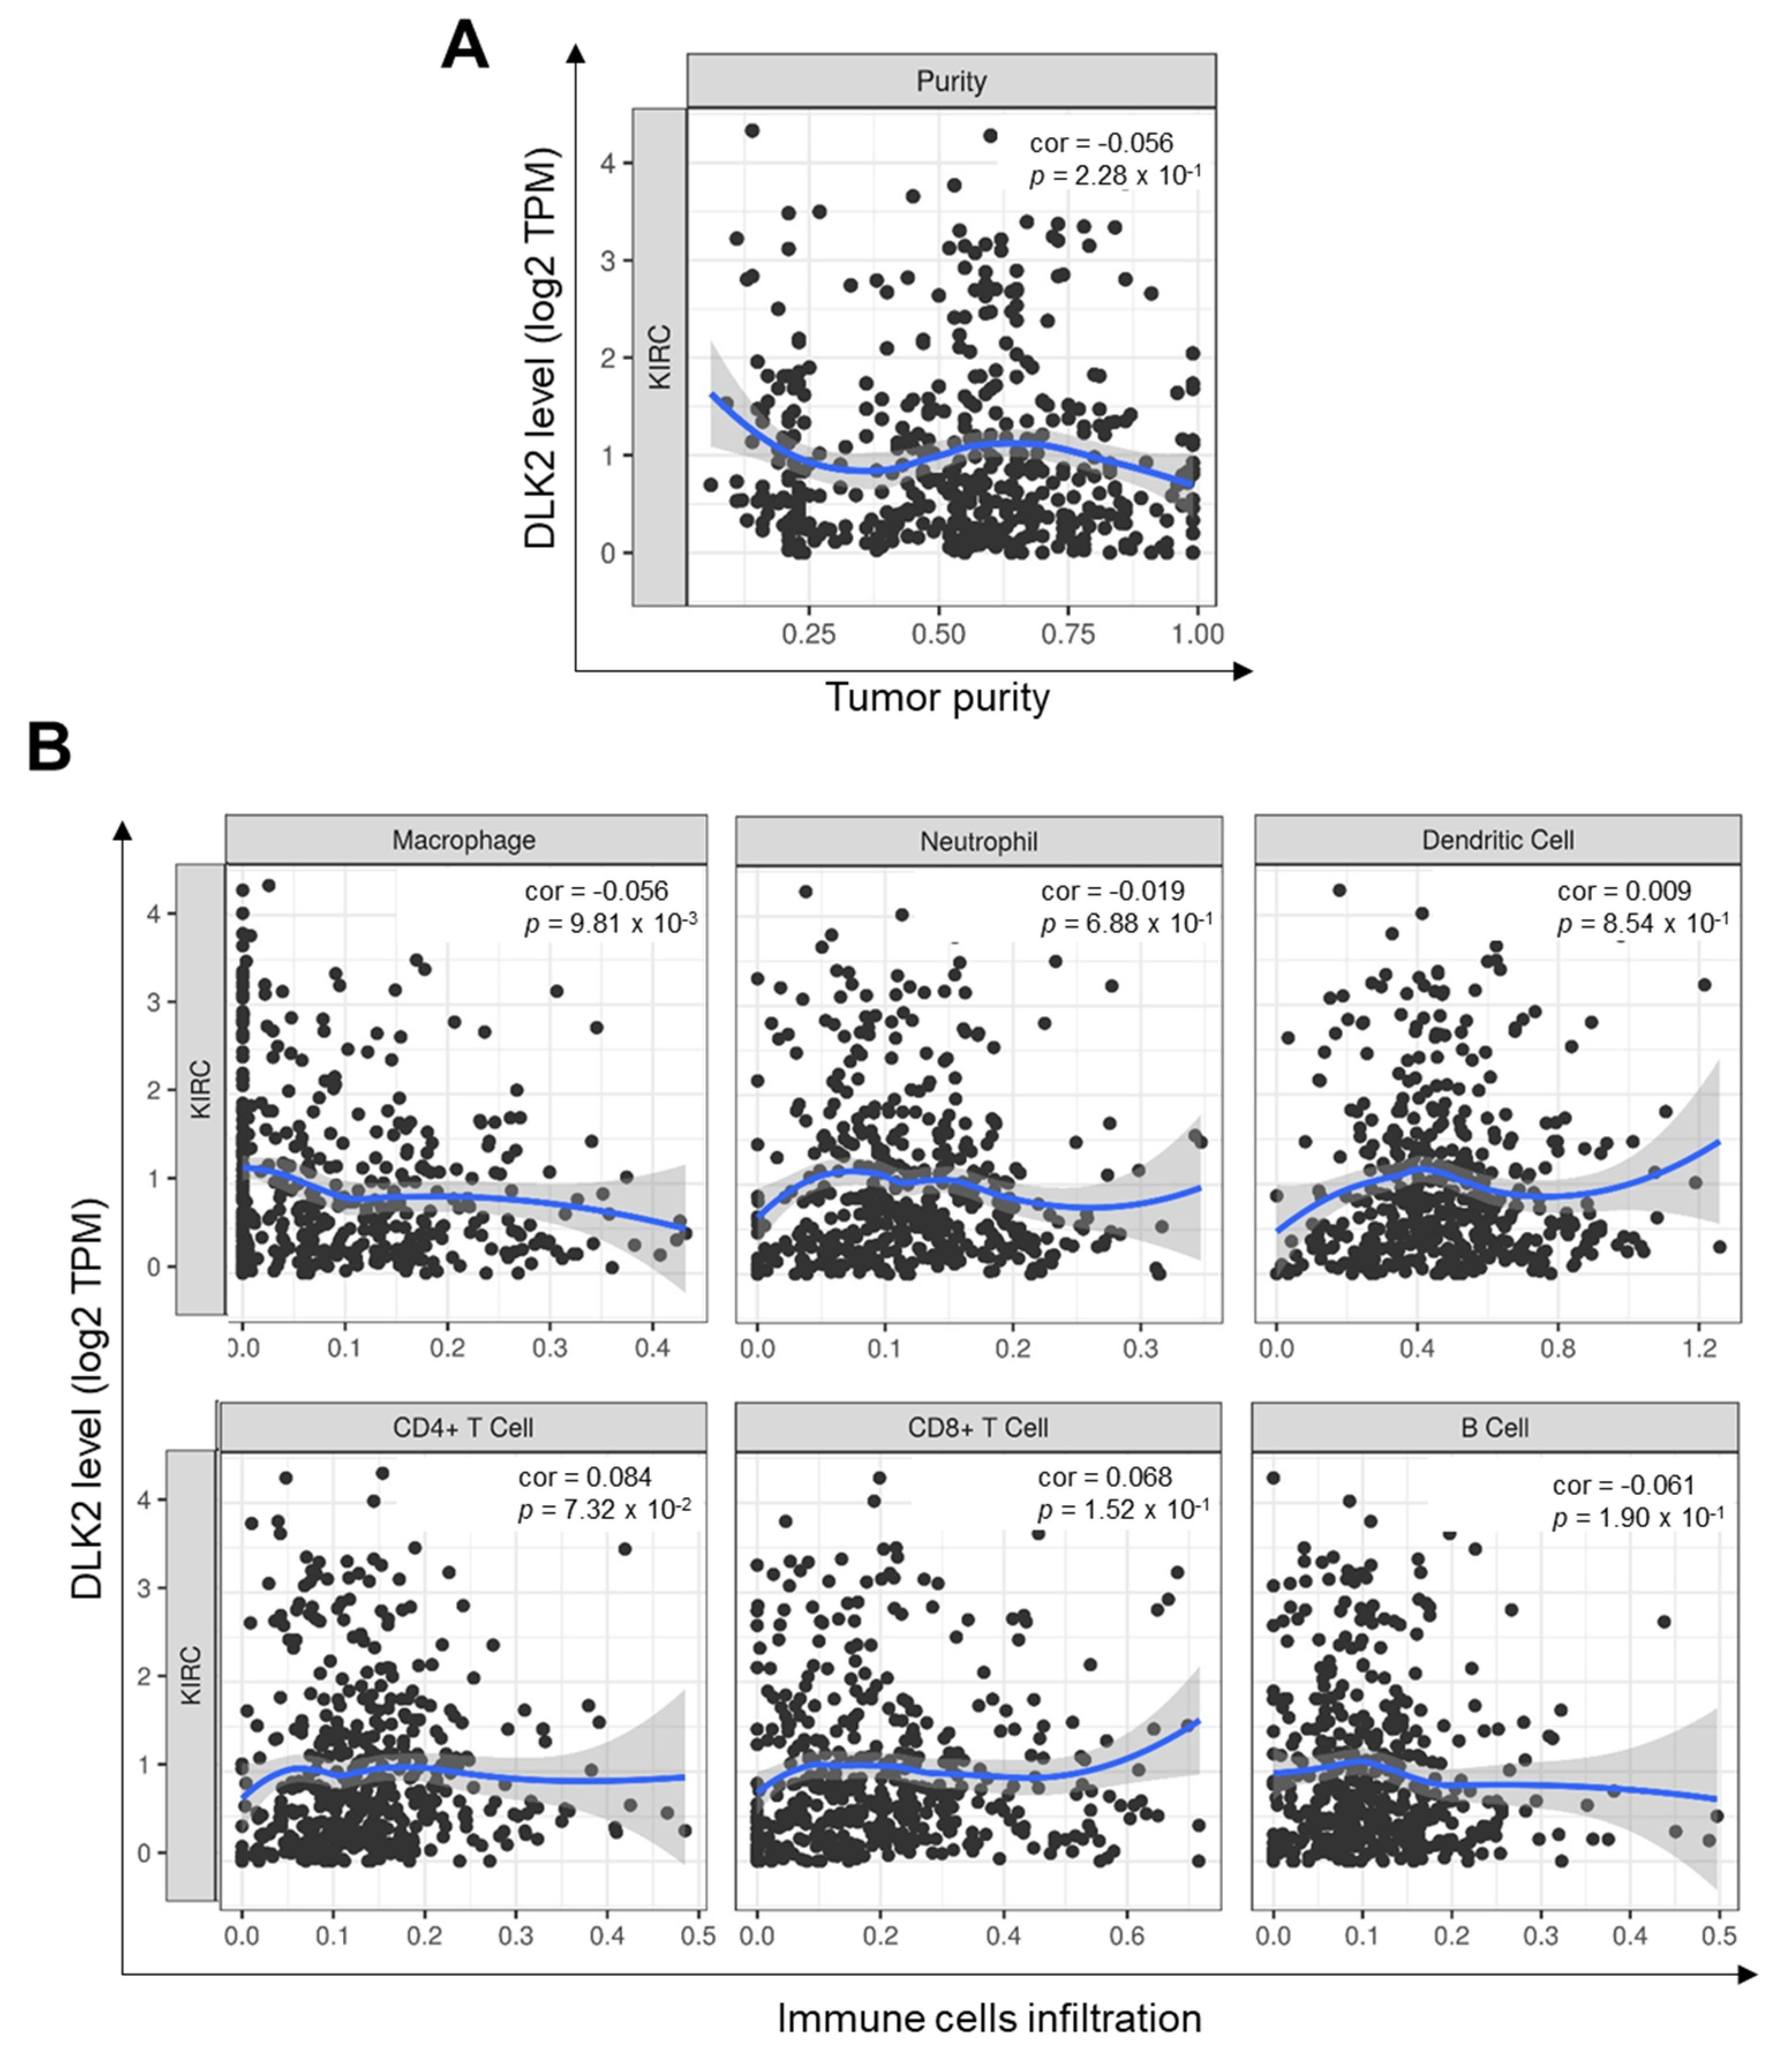
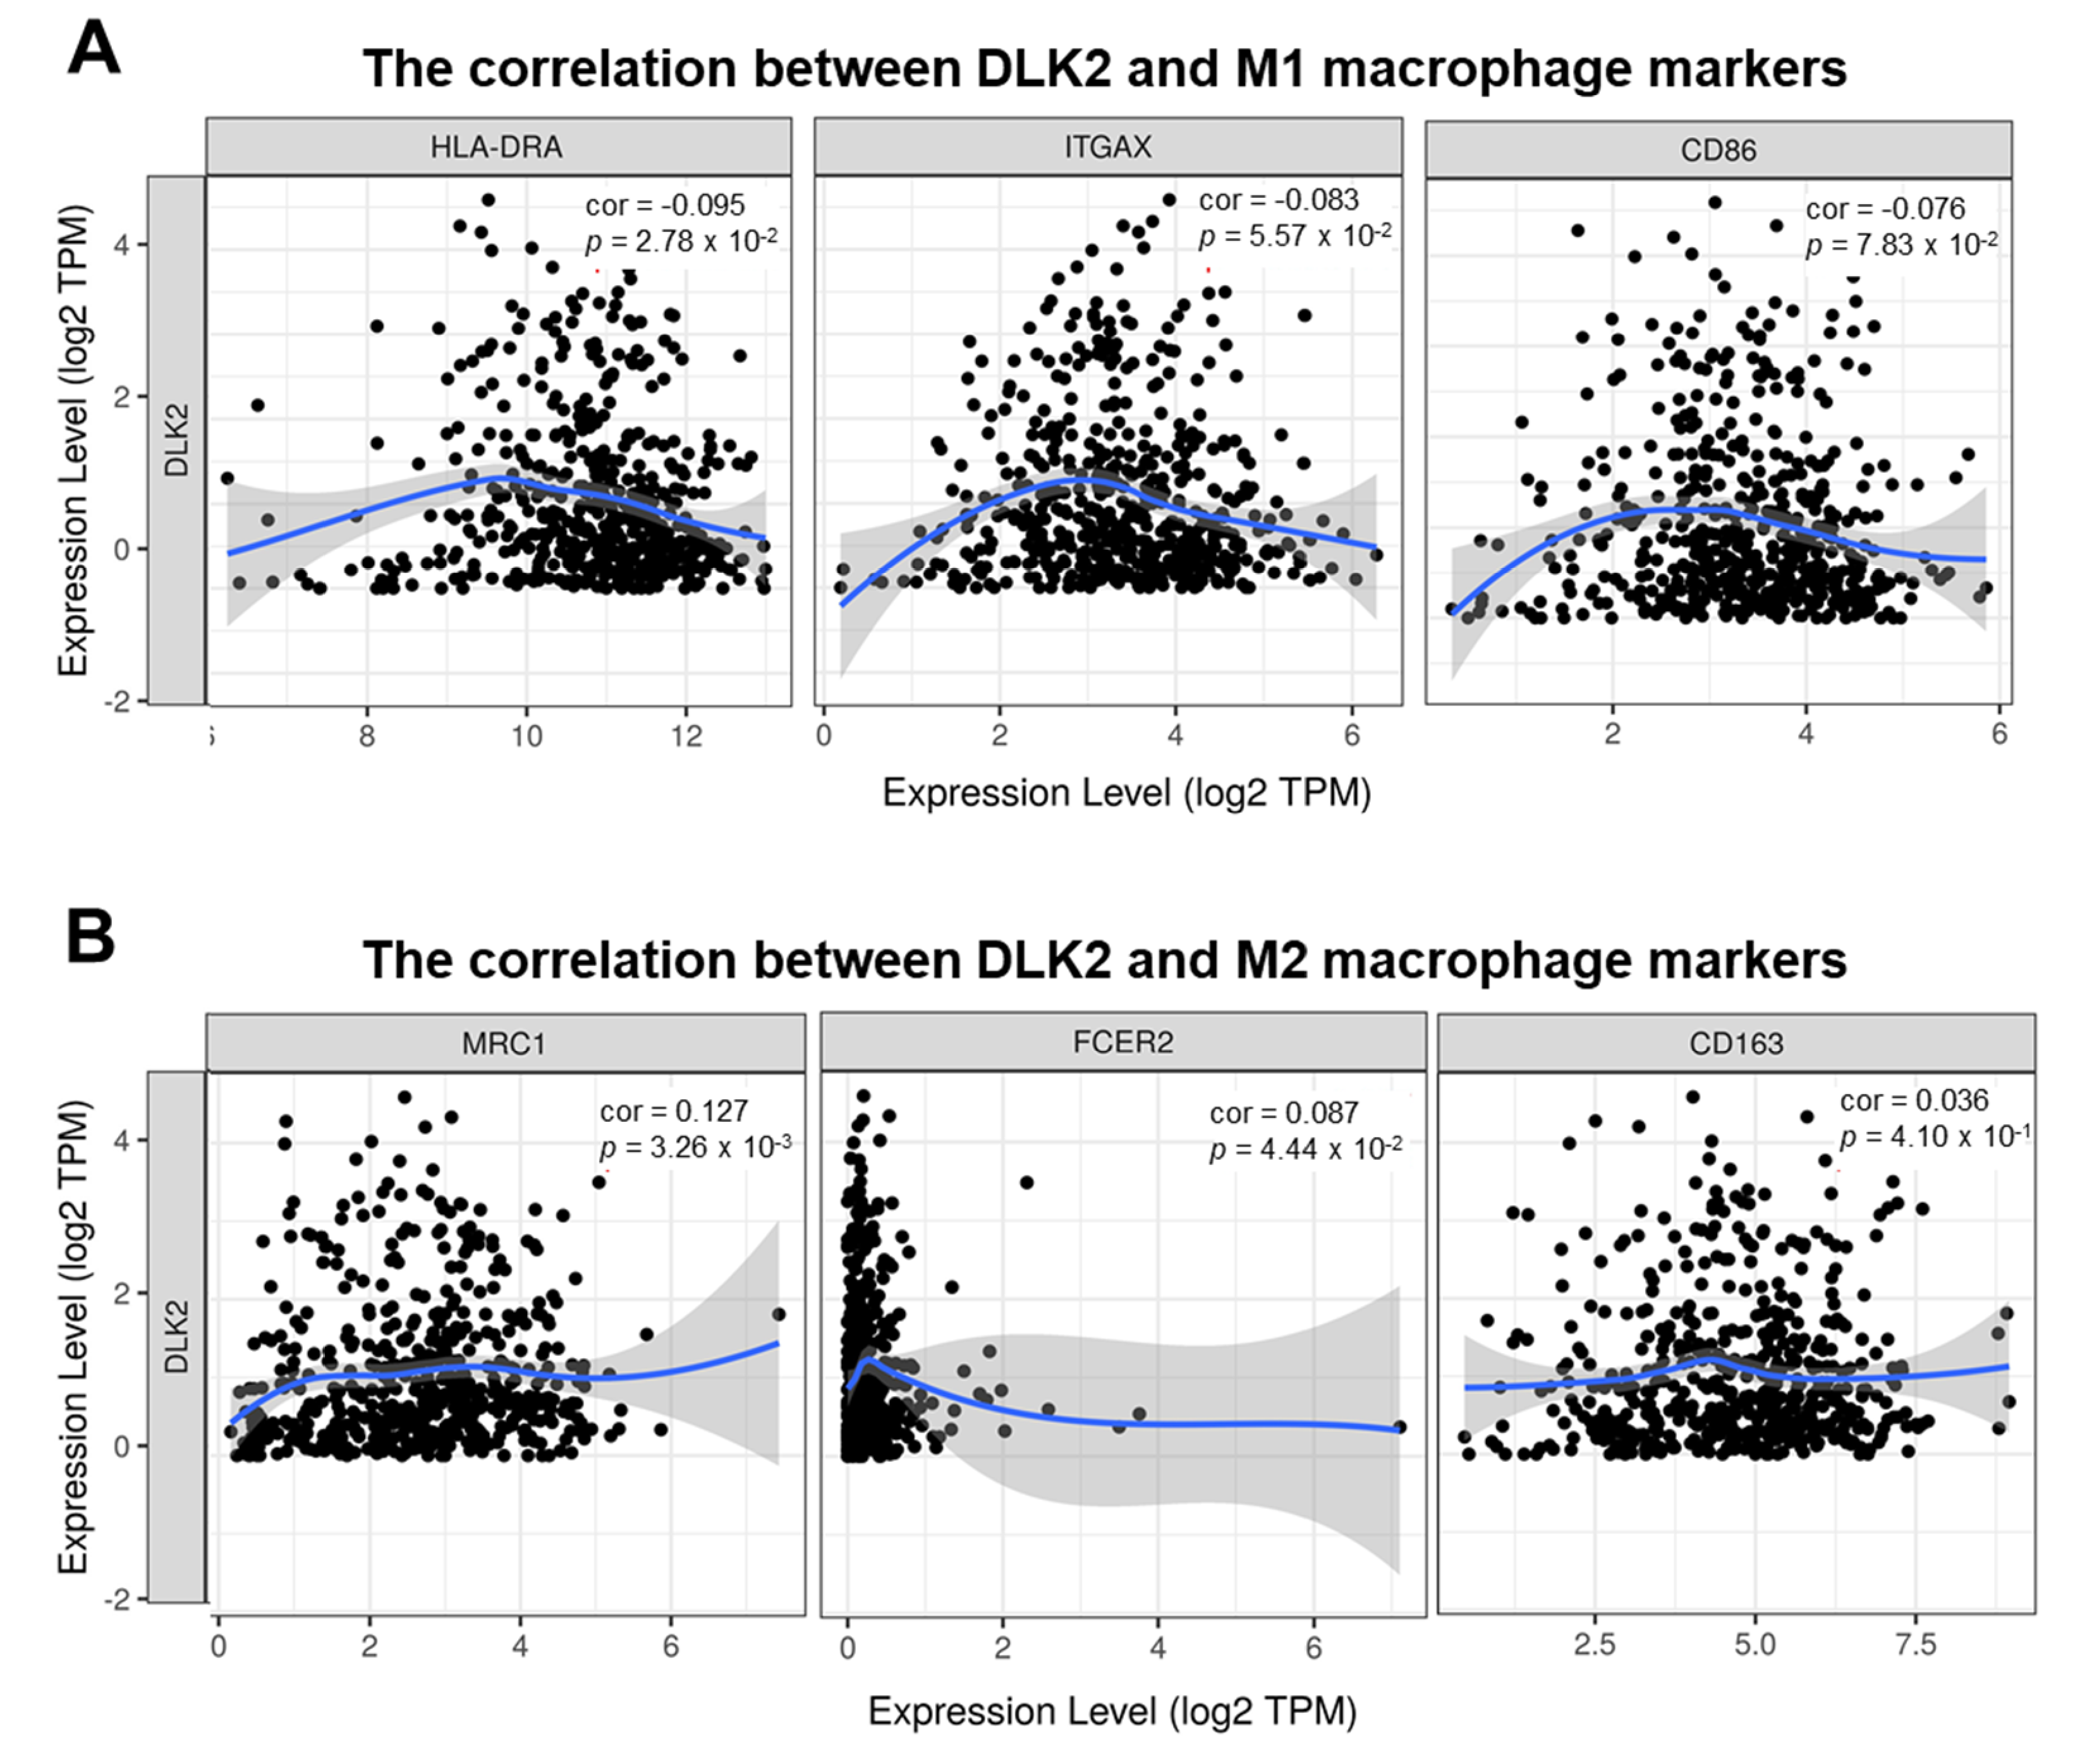
3.5. DLK2 Expression Was Negatively Correlated with the Macrophages Infiltrations and Positively Correated with the M1 to M2 Polarization of Macrophages in ccRCC

Previous studies have reported that immune cells infiltrations impact the disease prognosis in ccRCC patients [22,48]. The TIMER database was used to comprehensively study the effect of tumor immune cells recruitment on the survival outcome in ccRCC patients (Table 2). The Cox proportional hazard model showed that the tumor infiltrations of macrophages and CD8+ T cells were significantly associated with a reduced mortality rate in ccRCC patients (* p < 0.05). Furthermore, the tumor infiltrations of neutrophils, dendritic cells, CD4+ T cells, and B cells did not significantly impact the survival outcome of ccRCC patients. From the Pearson’s correlation test, the DLK2 level was not significantly associated with tumor purity, which indicates that the tumor microenvironment is also a source of DLK2 expression (Figure 9A). Moreover, the DLK2 level was significantly associated with reduced macrophage infiltrations (** p < 0.01), and the recruitments of neutrophils, dendritic cells, CD4+ T cells, CD8+ T cells, and B cells were not significantly correlated with DLK2 expression in ccRCC (Figure 9B). From the SCNA module of the TIMER tool, arm-level deletion of the DLK2 gene caused the reduction of B cell (** p < 0.01), CD8+ T cells (** p < 0.01), CD4+ T cells (** p < 0.01), neutrophil (** p < 0.01), and dendritic cell infiltrations (** p < 0.01) in ccRCC (Figure 10). Second, arm-level gain of DLK2 gene reduced CD8+ T cells (*** p < 0.001), CD4+ T cells (** p < 0.01), macrophage (** p < 0.01), neutrophil (*** p < 0.001), and dendritic cell infiltrations (** p < 0.01) in tumor tissue. In the macrophage recruitment, the results from the Pearson’s correlation analysis and SCNA module were consistent in this study.
Reportedly, M1 macrophages (anti-tumor phenotype) are associated with a favorable outcome, while M2 macrophages (pro-tumor phenotype) indicate a worse outcome in RCC [22]. Thus, the correlation between the DLK2 level and the expressions of M1/M2 macrophage markers in ccRCC was investigated using the TIMER tool. According to the Pearson’s correlation analysis, the tumor DLK2 level was negatively correlated with the expressions of M1 macrophage markers such as HLA class II histocompatibility antigen, DR α chain (HLA-DRA) (* p = 0.0278), CD11c (integrin α X, ITGAX) (p = 0.0557), and CD86 (p = 0.0783) [49,50] (Figure 11A). Moreover, the expressions of M2 macrophage markers such as CD206 (mannose receptor C-type 1, MRC1) (** p = 0.00326) and CD23 (Fc epsilon receptor II, FCER2) (* p = 0.0444) were positively associated with the DLK2 level in ccRCC (Figure 11B). Thus, the DLK2 expression may impact not only macrophage infiltrations, but also M1 to M2 polarization in ccRCC.

4. Discussion

Based on this meta-analysis by multiple gene expression databases, DLK2 was upregulated in ccRCC tumors compared with normal renal tissues. In addition, DLK2 overexpression was associated with an advanced stage and a poorly differentiated grade, and was correlated with a worse survival outcome in ccRCC patients, indicating that DLK2 may play an oncogenic role and serve as a promising and novel prognostic factor for ccRCC. Through the molecular and functional analysis of the bioinformatics, we herewith proposed a mechanistic model for the oncogenic processes of DLK2 in ccRCC (Figure 12). DLK2 may participate in ECM remodeling, ribosome biogenesis, the activation of TGF-β/Notch oncogenic signaling, gene transcriptional regulation, M1 to M2 polarization of macrophage, and the increment of tumor suppressor miRNAs targets (possible oncogenes). Moreover, aerobic metabolism in the mitochondria and the transcription of oncogenic miRNAs targets (possible tumor suppressor genes) may be shut down by DLK2 signaling. Together, DLK2 may act as a potent therapeutic target for ccRCC control by modulating the oncogenic processes of tumor cell and the tumor microenvironment.
From the Panther pathway and Pearson’s correlation analyses based on the LinkedOmics database, DLK2 signaling may positively regulate the TGF-β1 and Notch signaling pathways, and it has been reported that an extensive cross-talk between the TGF-β1 and Notch signaling cascades is associated with the aggressiveness of ccRCC [51]. It has been reported that Notch activation can inhibit the TCA cycle in Drosophila wing discs and human microvascular cells [52]. Importantly, the TGF-β/HDAC7 signaling pathway can repress oxidative phosphorylation in RCC [53], and the administration of TGF-β inhibitor restores the expression of TCA cycle enzymes and inhibits tumor progression in the orthotopic RCC model. In ECM biology, both TGF-β1 and Notch signaling play a critical role in ECM remodeling [54,55], and TGF-β1-promoted ECM remodeling impacts the survival outcome in ccRCC patients [56]. Importantly, it has been reported that DLK1 signaling promotes the upregulation of matrix metalloproteinase-9 (MMP9) through the activation of Notch1 signaling [37]. In ribosome biogenesis, many ribosome-related proteins can serve as prognostic biomarkers and therapeutic targets in RCC [17,57,58], and some studies indicate that TGF-β1 and Notch are involved in the modulation of ribosome-related pathways [59,60]. Thus, TGF-β1 and Notch signaling may participate in DLK2-promoted ribosome biogenesis in ccRCC. Reportedly, M2 macrophage infiltration is a risk factor for poor prognosis in ccRCC patients, and M2 macrophage can serve as a potential biomarker for prognosis and novel targets for immunotherapy in ccRCC [26]. Moreover, both TGF-β1-induced Snail signaling and the Jagged1-mediated Notch pathway can also promote the M2 polarization of the macrophage in the tumor microenvironment [61,62], and this means that DLK2-activated TGF-β1 and Notch signaling may participate in the M2 polarization of the macrophage in the ccRCC tumor microenvironment.
In addition to the TGF-β1 level, the expressions of HTRA1 and AGAP2-AS1 were highly and positively correlated with the DLK2 level in ccRCC tissues. Previous studies indicate that HTRA1 participates in the neovascularization mediated activation of Notch1 signaling [63]. Moreover, AGAP2-AS1 (LOC100130776) can promote the radioresistance of lung cancer cells [64] and act as an independent predictor of poor survival in ccRCC patients [65]. Thus, HTRA1 and AGAP2-AS1 signaling pathways may be involved in the DLK2-promoted oncogenic processes of ccRCC cells. Furthermore, the expressions of GUF1 and ELMOD2 were significantly and negatively correlated with the DLK2 level in ccRCC. It has been reported that GUF1 and ELMOD2 promote mitochondria protein synthesis and fusion, respectively [66,67], and these genes may participate in the DLK2-modulated mitochondria metabolism. Another gene, PLEKHB2 (also called evectin-2), negatively correlated with the DLK2 level, plays a critical role in the YAP oncogenic pathway of proliferating cells [68], and it is also downregulated in colon cancer [69]. In the miRNA analysis, the expressions of miR-296, miR-331, and miR-28 targets (possible oncogenes) were positively correlated with the DLK2 level, and previous studies indicate that miR-296, miR-331, and miR-28 sever as tumor suppressors [70,71,72]. Furthermore, the DLK2 level was negatively correlated with the expressions of miR-496 and miR-373 targets (possible tumor suppressor genes). In addition, it has been reported that miR-496 and miR-373 also play an oncogenic role in cancer progression [73,74]. From the LinkedOmics database analysis for transcription factor targets positively associated with the DLK2 level, the expressions of CD11A (also called LFA1 or ITGAL)-, Zinc finger protein 278 (ZNF278, also called MAZR)-, vitamin D receptor (VDR)-, Zic Family Member 3 (ZIC3)-, and NFκB-related transcription targets were highly associated with the DLK2 level in ccRCC. Moreover, CD11A, ZNF278, VDR, ZIC3, and NFκB also play critical roles in the modulation of oncogenic processes in many type cancers [75,76,77,78,79]. Together, DLK2-modulated miRNA targets and transcription factor targets may play a crucial role in the carcinogenesis of ccRCC. In addition to surgery and radiotherapy, first-line systemic treatments including tyrosine kinase inhibitors (TKIs) and immunotherapy are also used for ccRCC control [80]. However, the therapeutic efficacy of TKIs and immune checkpoint inhibitors for ccRCC remains unsatisfactory due to drug resistance [81]. Thus, DLK2 targeting may serve as a novel therapeutic strategy for ccRCC management. In the future, more clinical, animal, and cell studies are required for further validation of DLK2’s role in ccRCC.

5. Conclusions

In conclusion, this systematic review and meta-analysis illustrated that DLK2 may constitute a novel prognostic biomarker in ccRCC based on multiple gene expression databases. The upregulation of DLK2 in tumor tissues was associated with advanced stage, high tumor grade, and poor survival outcome in ccRCC patients. At the same time, we also found that DLK2 may serve as a potent oncogene in ccRCC by regulating ECM remodeling, mitochondria metabolism, ribosome biogenesis, TGF-β signaling, and Notch pathway. However, this study lacks experimental evidence, and the actual effect of DLK2 on the oncogenic processes and disease prognosis of ccRCC should be further investigated using a series of in vitro, in vivo, and clinical studies. If DLK2 is a poor prognostic factor and oncogene in ccRCC, and it may act as a novel biomarker or therapeutic target for ccRCC management in the future.

Author Contributions

Conceptualization: C.-C.H. and T.-H.C.; investigation: M.-G.L., Y.-K.L., S.-C.H., C.-L.C., C.-Y.K., W.-C.L., T.-Y.C. and S.-J.T.; visualization: C.-Y.H., M.-H.T., Y.-W.L., M.-L.K., M.-C.T., Y.-L.C., Y.-C.C. and Z.-H.W.; data curation: M.-G.L. and Y.-K.L.; project administration: C.-C.H. and T.-H.C.; writing—original draft preparation: M.-G.L. and Y.-K.L.; writing—review and editing: M.-G.L. and Y.-K.L.; supervision: C.-C.H. and T.-H.C. All authors have read and agreed to the published version of the manuscript.

Funding

This work was supported by grants from Kaohsiung Armed Forces General Hospital (KAFGH-D-11150) and Chang Gung Medical Foundation (CMRPG8I0281 and CORPG8K0011).

Institutional Review Board Statement

Not applicable.

Informed Consent Statement

Not applicable.

Data Availability Statement

The data presented in this study are available upon request from the corresponding author. The data sets used in this study can be accessed at https://cistrome.shinyapps.io/timer/ (TIMER), https://tnmplot.com/analysis/ (TNMplot), http://ualcan.path.uab.edu (UALCAN), and https://kmplot.com/analysis/ (KMplotter), http://www.linkedomics.org/admin.php (LinkedOmics). These gene expression databases were accessed on 11 December 2021.

Acknowledgments

We are grateful for the support from Kaohsiung Armed Forces General Hospital. We would like to acknowledge Pei-Hsuan Wu, Yi-Ting Wu, and Yueh-Yuan Shieh for their excellent technical support at the Laboratory of Research and Medical Education and Research Center, Kaohsiung Armed Forces General Hospital.

Conflicts of Interest

The authors declare no conflict of interest.

References

  1. Chen, S.H.; Xu, L.Y.; Wu, Y.P.; Ke, Z.B.; Huang, P.; Lin, F.; Li, X.D.; Xue, X.Y.; Wei, Y.; Zheng, Q.S.; et al. Tumor volume: A new prognostic factor of oncological outcome of localized clear cell renal cell carcinoma. BMC Cancer 2021, 21, 79. [Google Scholar] [CrossRef] [PubMed]
  2. Jemal, A.; Siegel, R.; Ward, E.; Murray, T.; Xu, J.; Thun, M.J. Cancer statistics, 2007. CA Cancer J. Clin. 2007, 57, 43–66. [Google Scholar] [CrossRef] [PubMed]
  3. Crispen, P.L.; Breau, R.H.; Allmer, C.; Lohse, C.M.; Cheville, J.C.; Leibovich, B.C.; Blute, M.L. Lymph node dissection at the time of radical nephrectomy for high-risk clear cell renal cell carcinoma: Indications and recommendations for surgical templates. Eur. Urol. 2011, 59, 18–23. [Google Scholar] [CrossRef] [PubMed]
  4. Srinivasan, R.; Ricketts, C.J.; Sourbier, C.; Linehan, W.M. New strategies in renal cell carcinoma: Targeting the genetic and metabolic basis of disease. Clin. Cancer Res. 2015, 21, 10–17. [Google Scholar] [CrossRef] [PubMed] [Green Version]
  5. Capitanio, U.; Bensalah, K.; Bex, A.; Boorjian, S.A.; Bray, F.; Coleman, J.; Gore, J.L.; Sun, M.; Wood, C.; Russo, P. Epidemiology of Renal Cell Carcinoma. Eur. Urol. 2019, 75, 74–84. [Google Scholar] [CrossRef] [PubMed]
  6. Capitanio, U.; Montorsi, F. Renal cancer. Lancet 2016, 387, 894–906. [Google Scholar] [CrossRef]
  7. Turajlic, S.; Xu, H.; Litchfield, K.; Rowan, A.; Horswell, S.; Chambers, T.; O’Brien, T.; Lopez, J.I.; Watkins, T.B.K.; Nicol, D.; et al. Deterministic Evolutionary Trajectories Influence Primary Tumor Growth: TRACERx Renal. Cell 2018, 173, 595–610.e511. [Google Scholar] [CrossRef] [Green Version]
  8. Casuscelli, J.; Vano, Y.A.; Fridman, W.H.; Hsieh, J.J. Molecular Classification of Renal Cell Carcinoma and Its Implication in Future Clinical Practice. Kidney Cancer 2017, 1, 3–13. [Google Scholar] [CrossRef] [Green Version]
  9. Singh, P.; Agarwal, N.; Pal, S.K. Sequencing systemic therapies for metastatic kidney cancer. Curr. Treat. Options Oncol. 2015, 16, 316. [Google Scholar] [CrossRef]
  10. Niinivirta, M.; Enblad, G.; Lindskog, C.; Ponten, F.; Dragomir, A.; Ullenhag, G.J. Tumoral Pyruvate Kinase L/R as a Predictive Marker for the Treatment of Renal Cancer Patients with Sunitinib and Sorafenib. J. Cancer 2019, 10, 3224–3231. [Google Scholar] [CrossRef] [Green Version]
  11. Cheng, G.; Li, M.; Ma, X.; Nan, F.; Zhang, L.; Yan, Z.; Li, H.; Zhang, G.; Han, Y.; Xie, L.; et al. Systematic Analysis of microRNA Biomarkers for Diagnosis, Prognosis, and Therapy in Patients with Clear Cell Renal Cell Carcinoma. Front. Oncol. 2020, 10, 543817. [Google Scholar] [CrossRef]
  12. Petersen, E.V.; Chudakova, D.A.; Skorova, E.Y.; Anikin, V.; Reshetov, I.V.; Mynbaev, O.A. The Extracellular Matrix-Derived Biomarkers for Diagnosis, Prognosis, and Personalized Therapy of Malignant Tumors. Front. Oncol. 2020, 10, 575569. [Google Scholar] [CrossRef]
  13. Ahluwalia, P.; Ahluwalia, M.; Mondal, A.K.; Sahajpal, N.; Kota, V.; Rojiani, M.V.; Rojiani, A.M.; Kolhe, R. Prognostic and therapeutic implications of extracellular matrix associated gene signature in renal clear cell carcinoma. Sci. Rep. 2021, 11, 7561. [Google Scholar] [CrossRef]
  14. Zhang, Y.; Chen, M.; Liu, M.; Xu, Y.; Wu, G. Glycolysis-Related Genes Serve as Potential Prognostic Biomarkers in Clear Cell Renal Cell Carcinoma. Oxid. Med. Cell Longev. 2021, 2021, 6699808. [Google Scholar] [CrossRef]
  15. Xing, Q.; Zeng, T.; Liu, S.; Cheng, H.; Ma, L.; Wang, Y. A novel 10 glycolysis-related genes signature could predict overall survival for clear cell renal cell carcinoma. BMC Cancer 2021, 21, 381. [Google Scholar] [CrossRef]
  16. Ellinger, J.; Gromes, A.; Poss, M.; Bruggemann, M.; Schmidt, D.; Ellinger, N.; Tolkach, Y.; Dietrich, D.; Kristiansen, G.; Muller, S.C. Systematic expression analysis of the mitochondrial complex III subunits identifies UQCRC1 as biomarker in clear cell renal cell carcinoma. Oncotarget 2016, 7, 86490–86499. [Google Scholar] [CrossRef] [Green Version]
  17. Knoll, M.; Macher-Goeppinger, S.; Kopitz, J.; Duensing, S.; Pahernik, S.; Hohenfellner, M.; Schirmacher, P.; Roth, W. The ribosomal protein S6 in renal cell carcinoma: Functional relevance and potential as biomarker. Oncotarget 2016, 7, 418–432. [Google Scholar] [CrossRef] [Green Version]
  18. Chen, S.; Yu, M.; Ju, L.; Wang, G.; Qian, K.; Xiao, Y.; Wang, X. The immune-related biomarker TEK inhibits the development of clear cell renal cell carcinoma (ccRCC) by regulating AKT phosphorylation. Cancer Cell Int. 2021, 21, 119. [Google Scholar] [CrossRef]
  19. Reese, B.; Silwal, A.; Daugherity, E.; Daugherity, M.; Arabi, M.; Daly, P.; Paterson, Y.; Woolford, L.; Christie, A.; Elias, R.; et al. Complement as Prognostic Biomarker and Potential Therapeutic Target in Renal Cell Carcinoma. J. Immunol. 2020, 205, 3218–3229. [Google Scholar] [CrossRef]
  20. Yu, B.; Zhang, J.; Sun, Z.; Cao, P.; Zheng, X.; Gao, Z.; Cao, H.; Zhang, F.; Wang, W. Interferon-inducible protein 16 may be a biomarker and prognostic factor in renal cell carcinoma by bioinformatics analysis. Medicine 2021, 100, e24257. [Google Scholar] [CrossRef]
  21. Quan, J.; Bai, Y.; Yang, Y.; Han, E.L.; Bai, H.; Zhang, Q.; Zhang, D. Bioinformatics analysis of C3 and CXCR4 demonstrates their potential as prognostic biomarkers in clear cell renal cell carcinoma (ccRCC). BMC Cancer 2021, 21, 814. [Google Scholar] [CrossRef]
  22. Zhang, S.; Zhang, E.; Long, J.; Hu, Z.; Peng, J.; Liu, L.; Tang, F.; Li, L.; Ouyang, Y.; Zeng, Z. Immune infiltration in renal cell carcinoma. Cancer Sci. 2019, 110, 1564–1572. [Google Scholar] [CrossRef] [Green Version]
  23. Wu, K.; Zheng, X.; Yao, Z.; Zheng, Z.; Huang, W.; Mu, X.; Sun, F.; Liu, Z.; Zheng, J. Accumulation of CD45RO+CD8+ T cells is a diagnostic and prognostic biomarker for clear cell renal cell carcinoma. Aging 2021, 13, 14304–14321. [Google Scholar] [CrossRef] [PubMed]
  24. Nakano, O.; Sato, M.; Naito, Y.; Suzuki, K.; Orikasa, S.; Aizawa, M.; Suzuki, Y.; Shintaku, I.; Nagura, H.; Ohtani, H. Proliferative activity of intratumoral CD8(+) T-lymphocytes as a prognostic factor in human renal cell carcinoma: Clinicopathologic demonstration of antitumor immunity. Cancer Res. 2001, 61, 5132–5136. [Google Scholar] [PubMed]
  25. Lin, J.; Yu, M.; Xu, X.; Wang, Y.; Xing, H.; An, J.; Yang, J.; Tang, C.; Sun, D.; Zhu, Y. Identification of biomarkers related to CD8(+) T cell infiltration with gene co-expression network in clear cell renal cell carcinoma. Aging 2020, 12, 3694–3712. [Google Scholar] [CrossRef] [PubMed]
  26. Shen, H.; Liu, J.; Chen, S.; Ma, X.; Ying, Y.; Li, J.; Wang, W.; Wang, X.; Xie, L. Prognostic Value of Tumor-Associated Macrophages in Clear Cell Renal Cell Carcinoma: A Systematic Review and Meta-Analysis. Front. Oncol. 2021, 11, 657318. [Google Scholar] [CrossRef] [PubMed]
  27. Wang, J.; Yuan, L.; Liu, X.; Wang, G.; Zhu, Y.; Qian, K.; Xiao, Y.; Wang, X. Bioinformatics and functional analyses of key genes and pathways in human clear cell renal cell carcinoma. Oncol. Lett. 2018, 15, 9133–9141. [Google Scholar] [CrossRef] [Green Version]
  28. Huang, H.; Zhu, L.; Huang, C.; Dong, Y.; Fan, L.; Tao, L.; Peng, Z.; Xiang, R. Identification of Hub Genes Associated With Clear Cell Renal Cell Carcinoma by Integrated Bioinformatics Analysis. Front. Oncol. 2021, 11, 726655. [Google Scholar] [CrossRef]
  29. Peng, R.; Wang, Y.; Mao, L.; Fang, F.; Guan, H. Identification of Core Genes Involved in the Metastasis of Clear Cell Renal Cell Carcinoma. Cancer Manag. Res. 2020, 12, 13437–13449. [Google Scholar] [CrossRef]
  30. Garcia-Gallastegi, P.; Ruiz-Garcia, A.; Ibarretxe, G.; Rivero-Hinojosa, S.; Gonzalez-Siccha, A.D.; Laborda, J.; Crende, O.; Unda, F.; Garcia-Ramirez, J.J. Similarities and differences in tissue distribution of DLK1 and DLK2 during E16.5 mouse embryogenesis. Histochem. Cell Biol. 2019, 152, 47–60. [Google Scholar] [CrossRef]
  31. Pittaway, J.F.H.; Lipsos, C.; Mariniello, K.; Guasti, L. The role of delta-like non-canonical Notch ligand 1 (DLK1) in cancer. Endocr. Relat. Cancer 2021, 28, R271–R287. [Google Scholar] [CrossRef]
  32. Garces, C.; Ruiz-Hidalgo, M.J.; Bonvini, E.; Goldstein, J.; Laborda, J. Adipocyte differentiation is modulated by secreted delta-like (dlk) variants and requires the expression of membrane-associated dlk. Differentiation 1999, 64, 103–114. [Google Scholar] [CrossRef]
  33. Baladron, V.; Ruiz-Hidalgo, M.J.; Nueda, M.L.; Diaz-Guerra, M.J.; Garcia-Ramirez, J.J.; Bonvini, E.; Gubina, E.; Laborda, J. dlk acts as a negative regulator of Notch1 activation through interactions with specific EGF-like repeats. Exp. Cell Res. 2005, 303, 343–359. [Google Scholar] [CrossRef]
  34. Nueda, M.L.; Baladron, V.; Sanchez-Solana, B.; Ballesteros, M.A.; Laborda, J. The EGF-like protein dlk1 inhibits notch signaling and potentiates adipogenesis of mesenchymal cells. J. Mol. Biol. 2007, 367, 1281–1293. [Google Scholar] [CrossRef]
  35. Huang, C.C.; Kuo, H.M.; Wu, P.C.; Cheng, S.H.; Chang, T.T.; Chang, Y.C.; Kung, M.L.; Wu, D.C.; Chuang, J.H.; Tai, M.H. Soluble delta-like 1 homolog (DLK1) stimulates angiogenesis through Notch1/Akt/eNOS signaling in endothelial cells. Angiogenesis 2018, 21, 299–312. [Google Scholar] [CrossRef]
  36. Huang, C.C.; Cheng, S.H.; Wu, C.H.; Li, W.Y.; Wang, J.S.; Kung, M.L.; Chu, T.H.; Huang, S.T.; Feng, C.T.; Huang, S.C.; et al. Delta-like 1 homologue promotes tumorigenesis and epithelial-mesenchymal transition of ovarian high-grade serous carcinoma through activation of Notch signaling. Oncogene 2019, 38, 3201–3215. [Google Scholar] [CrossRef]
  37. Li, L.; Tan, J.; Zhang, Y.; Han, N.; Di, X.; Xiao, T.; Cheng, S.; Gao, Y.; Liu, Y. DLK1 promotes lung cancer cell invasion through upregulation of MMP9 expression depending on Notch signaling. PLoS ONE 2014, 9, e91509. [Google Scholar] [CrossRef] [Green Version]
  38. Nueda, M.L.; Naranjo, A.I.; Baladron, V.; Laborda, J. The proteins DLK1 and DLK2 modulate NOTCH1-dependent proliferation and oncogenic potential of human SK-MEL-2 melanoma cells. Biochim. Biophys. Acta 2014, 1843, 2674–2684. [Google Scholar] [CrossRef] [Green Version]
  39. Marquez-Exposito, L.; Rodrigues-Diez, R.R.; Rayego-Mateos, S.; Fierro-Fernandez, M.; Rodrigues-Diez, R.; Orejudo, M.; Santos-Sanchez, L.; Blanco, E.M.; Laborda, J.; Mezzano, S.; et al. Deletion of delta-like 1 homologue accelerates renal inflammation by modulating the Th17 immune response. FASEB J. 2021, 35, e21213. [Google Scholar] [CrossRef]
  40. Fabian, K.P.; Chi-Sabins, N.; Taylor, J.L.; Fecek, R.; Weinstein, A.; Storkus, W.J. Therapeutic efficacy of combined vaccination against tumor pericyte-associated antigens DLK1 and DLK2 in mice. Oncoimmunology 2017, 6, e1290035. [Google Scholar] [CrossRef] [Green Version]
  41. Jia, D.; Li, S.; Li, D.; Xue, H.; Yang, D.; Liu, Y. Mining TCGA database for genes of prognostic value in glioblastoma microenvironment. Aging 2018, 10, 592–605. [Google Scholar] [CrossRef] [Green Version]
  42. Bartha, A.; Gyorffy, B. TNMplot.com: A Web Tool for the Comparison of Gene Expression in Normal, Tumor and Metastatic Tissues. Int. J. Mol.Sci. 2021, 22, 2622. [Google Scholar] [CrossRef]
  43. Lanczky, A.; Gyorffy, B. Web-Based Survival Analysis Tool Tailored for Medical Research (KMplot): Development and Implementation. J. Med. Internet Res. 2021, 23, e27633. [Google Scholar] [CrossRef]
  44. Chandrashekar, D.S.; Bashel, B.; Balasubramanya, S.A.H.; Creighton, C.J.; Ponce-Rodriguez, I.; Chakravarthi, B.; Varambally, S. UALCAN: A Portal for Facilitating Tumor Subgroup Gene Expression and Survival Analyses. Neoplasia 2017, 19, 649–658. [Google Scholar] [CrossRef]
  45. Vasaikar, S.V.; Straub, P.; Wang, J.; Zhang, B. LinkedOmics: Analyzing multi-omics data within and across 32 cancer types. Nucleic Acids Res. 2018, 46, D956–D963. [Google Scholar] [CrossRef] [Green Version]
  46. Li, T.; Fan, J.; Wang, B.; Traugh, N.; Chen, Q.; Liu, J.S.; Li, B.; Liu, X.S. TIMER: A Web Server for Comprehensive Analysis of Tumor-Infiltrating Immune Cells. Cancer Res. 2017, 77, e108–e110. [Google Scholar] [CrossRef] [Green Version]
  47. Li, B.; Severson, E.; Pignon, J.C.; Zhao, H.; Li, T.; Novak, J.; Jiang, P.; Shen, H.; Aster, J.C.; Rodig, S.; et al. Comprehensive analyses of tumor immunity: Implications for cancer immunotherapy. Genome Biol. 2016, 17, 174. [Google Scholar] [CrossRef] [Green Version]
  48. Wang, Y.; Yang, J.; Zhang, Q.; Xia, J.; Wang, Z. Extent and characteristics of immune infiltration in clear cell renal cell carcinoma and the prognostic value. Transl. Androl. Urol. 2019, 8, 609–618. [Google Scholar] [CrossRef]
  49. Jayasingam, S.D.; Citartan, M.; Thang, T.H.; Mat Zin, A.A.; Ang, K.C.; Ch’ng, E.S. Evaluating the Polarization of Tumor-Associated Macrophages Into M1 and M2 Phenotypes in Human Cancer Tissue: Technicalities and Challenges in Routine Clinical Practice. Front. Oncol. 2019, 9, 1512. [Google Scholar] [CrossRef] [Green Version]
  50. Ka, M.B.; Daumas, A.; Textoris, J.; Mege, J.L. Phenotypic diversity and emerging new tools to study macrophage activation in bacterial infectious diseases. Front. Immunol. 2014, 5, 500. [Google Scholar] [CrossRef] [Green Version]
  51. Sjolund, J.; Bostrom, A.K.; Lindgren, D.; Manna, S.; Moustakas, A.; Ljungberg, B.; Johansson, M.; Fredlund, E.; Axelson, H. The notch and TGF-beta signaling pathways contribute to the aggressiveness of clear cell renal cell carcinoma. PLoS ONE 2011, 6, e23057. [Google Scholar] [CrossRef]
  52. Slaninova, V.; Krafcikova, M.; Perez-Gomez, R.; Steffal, P.; Trantirek, L.; Bray, S.J.; Krejci, A. Notch stimulates growth by direct regulation of genes involved in the control of glycolysis and the tricarboxylic acid cycle. Open Biol. 2016, 6, 150155. [Google Scholar] [CrossRef]
  53. Nam, H.; Kundu, A.; Karki, S.; Brinkley, G.J.; Chandrashekar, D.S.; Kirkman, R.L.; Liu, J.; Liberti, M.V.; Locasale, J.W.; Mitchell, T.; et al. The TGF-beta/HDAC7 axis suppresses TCA cycle metabolism in renal cancer. JCI Insight 2021, 6, e148438. [Google Scholar] [CrossRef]
  54. Boyer-Di Ponio, J.; Wright-Crosnier, C.; Groyer-Picard, M.T.; Driancourt, C.; Beau, I.; Hadchouel, M.; Meunier-Rotival, M. Biological function of mutant forms of JAGGED1 proteins in Alagille syndrome: Inhibitory effect on Notch signaling. Hum. Mol. Genet. 2007, 16, 2683–2692. [Google Scholar] [CrossRef]
  55. Roberts, A.B.; McCune, B.K.; Sporn, M.B. TGF-beta: Regulation of extracellular matrix. Kidney Int. 1992, 41, 557–559. [Google Scholar] [CrossRef] [Green Version]
  56. Boguslawska, J.; Kedzierska, H.; Poplawski, P.; Rybicka, B.; Tanski, Z.; Piekielko-Witkowska, A. Expression of Genes Involved in Cellular Adhesion and Extracellular Matrix Remodeling Correlates with Poor Survival of Patients with Renal Cancer. J. Urol. 2016, 195, 1892–1902. [Google Scholar] [CrossRef]
  57. Fan, L.; Li, P.; Yin, Z.; Fu, G.; Liao, D.J.; Liu, Y.; Zhu, J.; Zhang, Y.; Wang, L.; Yan, Q.; et al. Ribosomal s6 protein kinase 4: A prognostic factor for renal cell carcinoma. Br. J. Cancer 2013, 109, 1137–1146. [Google Scholar] [CrossRef] [Green Version]
  58. Liang, J.; Liu, Z.; Zou, Z.; Wang, X.; Tang, Y.; Zhou, C.; Wu, K.; Zhang, F.; Lu, Y. Knockdown of ribosomal protein S15A inhibits human kidney cancer cell growth in vitro and in vivo. Mol. Med. Rep. 2019, 19, 1117–1127. [Google Scholar] [CrossRef] [Green Version]
  59. Martins, T.; Eusebio, N.; Correia, A.; Marinho, J.; Casares, F.; Pereira, P.S. TGFbeta/Activin signalling is required for ribosome biogenesis and cell growth in Drosophila salivary glands. Open Biol. 2017, 7, 160258. [Google Scholar] [CrossRef] [Green Version]
  60. Benelli, D.; Cialfi, S.; Pinzaglia, M.; Talora, C.; Londei, P. The translation factor eIF6 is a Notch-dependent regulator of cell migration and invasion. PLoS ONE 2012, 7, e32047. [Google Scholar] [CrossRef] [Green Version]
  61. Zhang, F.; Wang, H.; Wang, X.; Jiang, G.; Liu, H.; Zhang, G.; Wang, H.; Fang, R.; Bu, X.; Cai, S.; et al. TGF-beta induces M2-like macrophage polarization via SNAIL-mediated suppression of a pro-inflammatory phenotype. Oncotarget 2016, 7, 52294–52306. [Google Scholar] [CrossRef] [Green Version]
  62. Tao, S.; Chen, Q.; Lin, C.; Dong, H. Linc00514 promotes breast cancer metastasis and M2 polarization of tumor-associated macrophages via Jagged1-mediated notch signaling pathway. J. Exp. Clin. Cancer Res. 2020, 39, 191. [Google Scholar] [CrossRef]
  63. Klose, R.; Adam, M.G.; Weis, E.M.; Moll, I.; Wustehube-Lausch, J.; Tetzlaff, F.; Oka, C.; Ehrmann, M.; Fischer, A. Inactivation of the serine protease HTRA1 inhibits tumor growth by deregulating angiogenesis. Oncogene 2018, 37, 4260–4272. [Google Scholar] [CrossRef]
  64. Nakken, S.; Eikrem, O.; Marti, H.P.; Beisland, C.; Bostad, L.; Scherer, A.; Flatberg, A.; Beisvag, V.; Skandalou, E.; Furriol, J.; et al. AGAP2-AS1 as a prognostic biomarker in low-risk clear cell renal cell carcinoma patients with progressing disease. Cancer Cell Int. 2021, 21, 690. [Google Scholar] [CrossRef]
  65. Gao, L.; Zhao, A.; Wang, X. Upregulation of lncRNA AGAP2-AS1 is an independent predictor of poor survival in patients with clear cell renal carcinoma. Oncol. Lett. 2020, 19, 3993–4001. [Google Scholar] [CrossRef] [Green Version]
  66. Bauerschmitt, H.; Funes, S.; Herrmann, J.M. The membrane-bound GTPase Guf1 promotes mitochondrial protein synthesis under suboptimal conditions. J. Biol. Chem. 2008, 283, 17139–17146. [Google Scholar] [CrossRef] [Green Version]
  67. Schiavon, C.R.; Turn, R.E.; Newman, L.E.; Kahn, R.A. ELMOD2 regulates mitochondrial fusion in a mitofusin-dependent manner, downstream of ARL2. Mol. Biol. Cell 2019, 30, 1198–1213. [Google Scholar] [CrossRef]
  68. Matsudaira, T.; Mukai, K.; Noguchi, T.; Hasegawa, J.; Hatta, T.; Iemura, S.I.; Natsume, T.; Miyamura, N.; Nishina, H.; Nakayama, J.; et al. Endosomal phosphatidylserine is critical for the YAP signalling pathway in proliferating cells. Nat. Commun. 2017, 8, 1246. [Google Scholar] [CrossRef] [Green Version]
  69. Zhu, H.; Wu, T.C.; Chen, W.Q.; Zhou, L.J.; Wu, Y.; Zeng, L.; Pei, H.P. Screening for differentially expressed genes between left- and right-sided colon carcinoma by microarray analysis. Oncol. Lett. 2013, 6, 353–358. [Google Scholar] [CrossRef] [Green Version]
  70. Chen, Z.; Wang, Z.; Chen, Z.; Fu, F.; Huang, X.; Huang, Z. Pseudogene HSPB1P1 contributes to renal cell carcinoma proliferation and metastasis by targeting miR-296-5p to regulate HMGA1 expression. Cell Biol. Int. 2021, 45, 2479–2489. [Google Scholar] [CrossRef]
  71. Zhang, X.; Zheng, R.; Jiang, L.; Zhang, C.; Zheng, Q.; Jia, J.; Chen, Y.; Huang, J. miR-331-3p Inhibits Proliferation and Promotes Apoptosis of Nasopharyngeal Carcinoma Cells by Targeting elf4B-PI3K-AKT Pathway. Technol. Cancer Res. Treat. 2020, 19, 1533033819892251. [Google Scholar] [CrossRef] [Green Version]
  72. Wang, C.; Wu, C.; Yang, Q.; Ding, M.; Zhong, J.; Zhang, C.Y.; Ge, J.; Wang, J.; Zhang, C. miR-28-5p acts as a tumor suppressor in renal cell carcinoma for multiple antitumor effects by targeting RAP1B. Oncotarget 2016, 7, 73888–73902. [Google Scholar] [CrossRef] [Green Version]
  73. Wang, H.; Yan, B.; Zhang, P.; Liu, S.; Li, Q.; Yang, J.; Yang, F.; Chen, E. MiR-496 promotes migration and epithelial-mesenchymal transition by targeting RASSF6 in colorectal cancer. J. Cell. Physiol. 2020, 235, 1469–1479. [Google Scholar] [CrossRef]
  74. Li, Y.; Zhang, D.; Wang, J. MicroRNA373 promotes tumorigenesis of renal cell carcinoma in vitro and in vivo. Mol. Med. Rep. 2017, 16, 7048–7055. [Google Scholar] [CrossRef] [Green Version]
  75. Reina, M.; Espel, E. Role of LFA-1 and ICAM-1 in Cancer. Cancers 2017, 9, 153. [Google Scholar] [CrossRef] [Green Version]
  76. Tian, X.; Sun, D.; Zhang, Y.; Zhao, S.; Xiong, H.; Fang, J. Zinc finger protein 278, a potential oncogene in human colorectal cancer. Acta Biochim. Biophys. Sin. 2008, 40, 289–296. [Google Scholar] [CrossRef]
  77. Chen, Y.; Liu, X.; Zhang, F.; Liao, S.; He, X.; Zhuo, D.; Huang, H.; Wu, Y. Vitamin D receptor suppresses proliferation and metastasis in renal cell carcinoma cell lines via regulating the expression of the epithelial Ca2+ channel TRPV5. PLoS ONE 2018, 13, e0195844. [Google Scholar] [CrossRef] [PubMed] [Green Version]
  78. Chen, D.; Fan, Y.; Wan, F. LncRNA IGBP1-AS1/miR-24-1/ZIC3 loop regulates the proliferation and invasion ability in breast cancer. Cancer Cell Int. 2020, 20, 153. [Google Scholar] [CrossRef] [PubMed]
  79. Morais, C.; Gobe, G.; Johnson, D.W.; Healy, H. The emerging role of nuclear factor kappa B in renal cell carcinoma. Int. J. Biochem. Cell Biol. 2011, 43, 1537–1549. [Google Scholar] [CrossRef] [PubMed]
  80. Escudier, B.; Porta, C.; Schmidinger, M.; Rioux-Leclercq, N.; Bex, A.; Khoo, V.; Grunwald, V.; Gillessen, S.; Horwich, A. Renal cell carcinoma: ESMO Clinical Practice Guidelines for diagnosis, treatment and follow-up. Ann. Oncol. 2019, 30, 706–720. [Google Scholar] [CrossRef] [Green Version]
  81. Sharma, R.; Kadife, E.; Myers, M.; Kannourakis, G.; Prithviraj, P.; Ahmed, N. Determinants of resistance to VEGF-TKI and immune checkpoint inhibitors in metastatic renal cell carcinoma. J. Exp. Clin. Cancer Res. 2021, 40, 186. [Google Scholar] [CrossRef]
Figure 1. The study workflow indicates the expression, prognostic, and functional analyses that were used to investigate the role of DLK2 in ccRCC.
Genes 13 00629 g001
Figure 2. DLK2 is upregulated in ccRCC tissues compared with normal kidney tissues. (A) TIMER analysis for DLK2 expression in Pan-cancer. The red arrowhead indicates the ccRCC cohort. (B) TNMplot analysis for the DLK2 level in the paired normal and ccRCC tissues. (C) TNMplot analysis for DLK2 expression in the renal tissues of non-ccRCC donors and tumor tissues of ccRCC patients. * p < 0.05; ** p < 0.01; *** p < 0.0001.
Genes 13 00629 g002
Figure 3. Tumoral DLK2 overexpression is associated with advanced stage and high grade in ccRCC patients. The UALCAN analysis for the tumoral DLK2 level in ccRCC patients with different (A) stages, (B) grades, (C) ages, (D) cancer subtypes, (E) metastasis status, (F) races, and (G) genders. * p < 0.05; ** p < 0.01; *** p < 0.0001.
Genes 13 00629 g003
Figure 4. Tumoral DLK2 overexpression is associated with a poor survival outcome in ccRCC patients. The Kaplan–Meier analysis using KMplotter tool for (A) overall survival and (B) disease-free survival in ccRCC patients with a low or high DLK2 expression.
Genes 13 00629 g004
Figure 5. The genes positively and negatively correlated with the DLK2 level in ccRCC are identified using LinkedOmics database. (A) The Volcano Plot shows the total genes highly associated with the DLK2 level in ccRCC. Heat maps of the top 50 genes (B) positively and (C) negatively correlated with DLK2 in ccRCC.
Genes 13 00629 g005
Figure 6. The top five genes positively correlated with the DLK2 level in ccRCC are identified using the LinkedOmics database. Pearson’s correlation analysis for the relationship between DLK2 level and (A) TGFβ1, (B) TMEM91, (C) HTRA1, (D) LOC100130776, and (E) HTR6.
Genes 13 00629 g006
Figure 7. The top five genes negatively correlated with the DLK2 level in ccRCC are identified using LinkedOmics database. Pearson’s correlation analysis for the relationship between DLK2 level and (A) BCKDHB, (B) PLEKHB2, (C) GUF1, (D) ADAL, and (E) ELMOD2.
Genes 13 00629 g007
Figure 8. The gene sets positively and negatively correlated with the DLK2 level in ccRCC are identified using the LinkedOmics tool. The (A,B) GO, (C) KEGG, and (D) Panther pathways analyses for DLK2 in ccRCC. The blue bars indicate the gene clusters positively correlated with DLK2. The orange bars indicate the gene clusters negatively correlated with DLK2.
Genes 13 00629 g008
Figure 9. The correlation between DLK2 expression and immune cells infiltrations in ccRCC is analyzed using the TIMER database. (A) The correlation between the DLK2 level and tumor purity in ccRCC. (B) The correlation between the DLK2 expression and the recruitments of macrophages, neutrophils, dendritic cells, CD4+ T cells, CD8+ T cells, and B cells in ccRCC tissues.
Genes 13 00629 g009
Figure 10. The copy number variation (CNV) of DLK2 affects the immune cells infiltration in ccRCC based on the TIMER analysis. The effect of DLK2 CNV on the B cells, CD8+ T cells, CD4+ T cells, macrophages, neutrophils, and dendritic cells in ccRCC. ** p < 0.01; *** p < 0.0001.
Genes 13 00629 g010
Figure 11. The DLK2 expression is associated with the M1 to M2 polarization of macrophages in ccRCC based on the TIMER analysis. The correlation between DLK2 level and the expressions of (A) M1 or (B) M2 macrophage markers in ccRCC tissues.
Genes 13 00629 g011
Figure 12. Hypothetical model for the role of DLK2 in ccRCC.
Genes 13 00629 g012
Table 1. The miRNA- and transcription factor-target networks highly associated with DLK2 in ccRCC (LinkedOmics).
Enriched CategoryGene SetNormalized Enrichment ScoreFDRLeading Edge Numberp Value
miRNA TargetGGGGCCC, miR-2961.8654990.002889250
CCAGGGG, miR-3311.6430380.038283290
AGCTCCT, miR-281.5552290.119423270.002294
CATGTAA, miR-496−1.2588610.475076320.032258
TTTTGAG, miR-373−1.1578750.485488310.045455
Transcription Factor TargetV$LFA1_Q61.7238310.003247730
V$MAZR_011.7249240.003788600
V$VDR_Q31.7481400.004132790
V$ZIC3_011.7272360.004546940
GGGNNTTTCC_V$NFKB_Q6_011.7518830.005510500
Table 2. Cox proportional hazard model showing hazard ratios for ccRCC conferred by variables.
VariableCoefficientHR95% CIp Value
Macrophage−2.7740.0620.006–0.647* 0.020
Neutrophil3.21124.8090.389–1582.7550.130
Dendritic cell1.1193.0620.517–18.1310.217
CD4+ T cell−0.5240.5920.039–8.9020.705
CD8+ T cell−1.7410.1750.037–0.837* 0.029
B cell−0.6000.5490.022–13.7570.714
* p < 0.05.
Publisher’s Note: MDPI stays neutral with regard to jurisdictional claims in published maps and institutional affiliations.

