Article

New Insights on Gene by Environmental Effects of Drugs of Abuse in Animal Models Using GeneNetwork

1
Department of Biotechnology, Chaitanya Bharathi Institute of Technology, Hyderabad 500075, India
2
Department of Genetics, Genomics, and Informatics, University of Tennessee Health Science Center, Memphis, TN 38163, USA
*
Author to whom correspondence should be addressed.
Genes 2022, 13(4), 614; https://doi.org/10.3390/genes13040614
Submission received: 2 February 2022 / Revised: 2 March 2022 / Accepted: 7 March 2022 / Published: 29 March 2022
(This article belongs to the Special Issue Genetics and Genomics of Addiction)

Abstract

:
Gene-by-environment interactions are important for all facets of biology, especially behaviour. Families of isogenic strains of mice, such as the BXD strains, are excellently placed to study these interactions, as the same genome can be tested in multiple environments. BXD strains are recombinant inbred mouse strains derived from crossing two inbred strains—C57BL/6J and DBA/2J mice. Many reproducible genometypes can be leveraged, and old data can be reanalysed with new tools to produce novel insights. We obtained drug and behavioural phenotypes from Philip et al. Genes, Brain and Behaviour 2010, and reanalysed their data with new genotypes from sequencing, as well as new models (Genome-wide Efficient Mixed Model Association (GEMMA) and R/qtl2). We discovered QTLs on chromosomes 3, 5, 9, 11, and 14, not found in the original study. We reduced the candidate genes based on their ability to alter gene expression or protein function. Candidate genes included Slitrk6 and Cdk14. Slitrk6, in a Chromosome14 QTL for locomotion, was found to be part of a co-expression network involved in voluntary movement and associated with neuropsychiatric phenotypes. Cdk14, one of only three genes in a Chromosome5 QTL, is associated with handling induced convulsions after ethanol treatment, that is regulated by the anticonvulsant drug valproic acid. By using families of isogenic strains, we can reanalyse data to discover novel candidate genes involved in response to drugs of abuse.

1. Introduction

Two of the biggest problems in analyses of biomedical data are irretrievability and irreplicability. Biomedical data is often lost as soon as it is published, locked within a forgotten hard drive, or siloed in a little-used format on a lab’s website. There are many efforts to make data publicly accessible and retrievable, such as the FAIR Principles (findability, accessibility, interoperability, and reusability) [1], and these allow the combined analysis of many datasets and reanalysis using new tools. There is still the problem of irreproducible datasets: for example, if a sample from a particular outbred cohort is found to be an outlier during data analysis, there is no way to go back to that genometype and remeasure the phenotype. Nor can new phenotypes be measured in the same individuals within the same environments later as new tools emerge. The genometype refers to all genotype states across the organism. Different strains in the BXD family might share the same genotype at a specific location, but the different strains are different genometypes. Families of isogenic strains solve this problem, allowing for reproducible genometypes that can be sampled many times, under many environmental conditions, leading to so-called experimental precision medicine [2]. This means that a genometype sampled 30 years ago in a different country can be replicated now, in any lab, with any environmental variable of interest, using any technique. The GeneNetwork.org (http://www.genenetwork.org/, accessed on 2 February 2022) website allows this combination of FAIR data and reproducible genomes, meaning that research teams can now go back to previous datasets and reanalyse them with new data and new tools. Every new dataset adds exponentially to the number of possible connections. In this paper, we will reanalyse drug and addiction related data from over a decade ago, using new genometypes for the BXD family of murine strains, as well as new statistical tools, showing that we can identify new quantitative trait loci (QTLs), resulting in highly plausible candidate genes.
Quantitative trait locus (QTL) mapping has been carried out in numerous species to associate regions of the genome to phenotypes even before the structure of the genome was well understood (e.g., [3]). Rodents, especially mice, have been the species most prominently used for biomedically relevant traits. Amongst these, the BXD family of recombinant inbred (RI) strains derived from crossing two inbred strains—C57BL/6J and DBA/2J mice—have been extensively used for almost 50 years in fields such as neuropharmacology [4,5,6], immunology [7,8,9,10,11,12,13], behaviour [13,14,15,16,17,18,19,20,21], aging [21,22,23,24,25,26,27,28,29], neurodegeneration [30,31,32,33], and gut microbiome–host interactions [34].
The development of the BXD panel was started by Benjamin A. Taylor by inbreeding the progeny of female C57BL/6J and male DBA/2J strains, for the purpose of mapping Mendelian traits [35]. This led to the original 32 BXD strains, which now carry the suffix ‘TyJ’ (Taylor to Jackson Laboratory). To increase the power and precision of QTL mapping, the number of strains has been expanded [36], including through advanced intercross [37], to a total of 140 extant strains [2], making this resource the largest family of murine isogenic strains. Phenotypes in the BXD have been measured under many conditions, allowing for the identification of gene-by-environment interactions. Understanding these interactions can potentially help in the discovery of complex therapeutic solutions and are a vital part of the development of precision medicine.
GeneNetwork.org is a tool for quantitative genetics that started in 2001 as WebQTL [38]. It evolved from analyses of forward genetics in the BXD mouse family, to phenome-wide association studies and reverse genetics in a variety of species. Although GeneNetwork.org contains data for many species and populations, it most prominently contains data for the BXD family. Over 10,000 “classical” phenotypes, measured under a variety of environmental conditions and over 100 ‘omics datasets, are available on GeneNetwork.org for the BXD family. GeneNetwork.org and the BXD RI population are therefore a powerful tool for systems genetics and experimental precision medicine. The great advantage of inbred lines, with stable genometypes that can be resampled is that data can be reused and reanalysed over time, as tools improve. From the very start of the genome sequencing revolution, when loci were first mapped to causative genes, new tools and a greater understanding of the genome have allowed us to go back to old data and gain new insight.
In this study, we will demonstrate how new biological insight into drugs of abuse can be gained by reanalysing data in the BXD family, using improved genometypes from sequencing, and new mapping methods (linear mixed models). Using this method, we have discovered new QTLs and candidate genes for behavioural phenotypes associated with the predisposition of drug- and behaviour-related traits obtained from Philip et al. 2010 [39].

2. Materials and Methods

2.1. Phenotype Data

The traits used for analysis in this study were acquired by Philip and team and published in 2010 [39]. All datasets from this publication are freely available on GeneNetwork.org, and were obtained from the BXD published phenotypes (http://gn1.genenetwork.org/webqtl/main.py?FormID=sharinginfo&GN_AccessionId=602&InfoPageName=BXDPublish, accessed on 2 February 2022). The original study aimed to determine the influence of genes in response to the environment and the plausibility of similar interactions with drug-related attributes including response to and withdrawal from cocaine, 3,4-methylenedioxymethamphetamine, morphine, and ethanol and the correlation to phenotypic traits including anxiety, locomotion, stress sensitivity, and pain sensitivity. Complex phenotyping batteries consisting of diverse behavioural assays were employed on the RI strains, and multivariate analyses were performed using GeneNetwork.org. An interplay between environmental factors, drug-induced neural changes, and genetic factors underlies the predisposition of an individual to addiction. In this study, a total of 762 traits were analysed (Supplementary Table S1) using new genotypes and linear mixed model (LMM) based mapping software, to identify novel candidate genes and gene-by-treatment interactions. However, we did not include morphine related traits, as these are being actively studied by others. Of the then extant population of 79 strains [7], Philip’s study used approximately 70 strains to measure the traits.

2.2. New Genotypes from Sequencing

A total of 152 BXD strains have now been sequenced using linked-read technologies, and new genotypes for all 152 BXD strains have been produced from this (European Nucleotide Archive project PRJEB45429). Variants were chosen to define the start and end of each haplotype block, and variant positions from the previously published genotypes were kept allowing maximum back compatibility with previous publications.

2.3. Genome-Wide Efficient Mixed Model Association (GEMMA), Kinship within the BXD Strains, and QTL Mapping

The BXD family has been produced in several ‘epochs’ across 40 years, using both standard F2 recombinant inbred methods as well as advanced intercross recombinant inbred methods [2]. This has led to both expected and unexpected kinship between BXD strains. This kinship between strains can lead to bias, as it breaks the expectations of previously used methods, such as the Haley–Knott mapping algorithm that was used in the original study. Updated linear mixed models including R/qtl2 (qtl2 analysis using R software) and Genome-wide Efficient Mixed Model Association (GEMMA), which is accessible in GeneNetwork.org, have been used for this study as they allow correction for kinship, as well as other cofactors if needed.
An analysis of 762 traits taken from Philip et al. study was carried out using the GEMMA mapping tool with the genotypes from sequencing, a minor allele frequency (MAF) of 0.05, and utilizing the Leave One Chromosome Out (LOCO) method. This computation provides a −log(p) value between each marker and the phenotype. We used a −log(p) > 4, as significant. However, since permutations of the GEMMA algorithm are not currently available in GeneNetwork.org, we confirmed the significance of these QTL using the linear mixed model tool within R/qtl2 [40], with 5000 permutations of the data.

2.4. Identification of Novel QTLs

Two methods were used to identify significant QTLs. Firstly, traits with an adjusted p < 0.05 using permutation in R/qtl2 (described above) were investigated at length, as these are significant after empirical correction. The second method used was to take advantage of independent traits which share QTL at the same location with suggestive p-values (p < 0.63). This p < 0.63 equates to one false positive per genome scan. However, the likelihood of any chromosome having a QTL on it is approximately 1 in 20 (i.e., p < 0.05) due to 20 chromosomes in mice. The likelihood of two independent traits sharing the same QTL location by chance is therefore much lower than p < 0.05. Traits were referred to as independent if they were carried out in separate groups of animals (e.g., males and females), or if the traits were measured at independent timepoints (e.g., at 10 min after treatment and 60 min after treatment).

2.5. QTL Confidence Intervals

A 1.5 LOD (logarithm of the odds) or 1.5 −log(p) drop [41] was used to determine the QTL confidence interval for each statistically significant trait (in our case of a two-parent population LOD and −log(p) are approximately equal). Therefore, for each of the QTL above (Supplementary Table S2), we were able to generate a list of genes within this confidence interval. Genes were called within the QTL interval using the GeneNetwork.org QTL mapping tool, which provides protein coding genes, non-coding genes, and predicted gene models.

2.6. Cis-eQTL Mapping

A cis-eQTL indicates that a variant within or very close to a gene influences its expression. Genes with cis-eQTLs are high priority candidates, as it provides a potential causal pathway between the gene variant and the phenotype of interest (i.e., the variant alters gene expression, and the expression of that gene alters the phenotype). Therefore, if a gene within a QTL interval is cis-regulated, we categorize it as a high priority candidate. For each QTL, we identified which, if any, genes within the QTL interval also had a cis-eQTL, and in which tissues an eQTL was seen (using transcriptome data from GeneNetwork.org). Using this same data, we also identified correlations between expression of each of these genes and the phenotype of interest.

2.7. “Gene Friends”, or Co-Expression Analysis

Genes with a cis-eQTL in at least one tissue were further considered for co-expression analysis. The top 10,000 correlations were generated in the tissue with the highest correlation between gene expression and the phenotype of interest. Gene-gene correlations with Sample p(r) < 0.05 were taken into WebGestalt to perform an over-representation analysis [42,43,44,45]. This results in the identification of significantly enriched annotations or pathways in the genes which co-express with our gene of interest. This can often suggest pathways or networks that the gene is involved in, even if the gene itself has not yet been annotated as part of that network.

2.8. Gene Variant Analysis

Deep, linked-read sequencing of the 152 members of the BXD family was carried out using Chromium 10X sequencing (https://www.10xgenomics.com/products/linked-reads, accessed on 2 February 2022), resulting in 5,390,695 SNPs and 733,236 indels, which are high confidence and segregate in the population (i.e., have a minor allele frequency greater than 0.2). These 6 million variants are potential causes of QTLs detected in the BXD family.
To identify potential effects of these variants, we used the Variant Effect Predictor (VEP) website (http://ensembl.org/Tools/VEP, accessed on 2 February 2022 [46]). All variants within our QTL intervals were extracted from the variant VCF file and uploaded to the VEP. Potentially deleterious variants or variants which impact protein function were identified using the “Consequence”, “IMPACT”, “SIFT” [47,48] and “BLOSUM62” [49] annotations.

2.9. PheWAS

Phenome-wide association studies (PheWAS) utilize a genomic region of interest to find associations between that region and phenotypes measured in GWAS datasets. We used human PheWAS data for all the candidate genes in our QTLs to detect genes with relevant human phenotype associations (i.e., behavioural and neurological phenotypes). A relevant association implies confidence in a candidate gene and suggests cross-species translatability of the finding. We used online PheWAS tools, GWASatlas (https://atlas.ctglab.nl/PheWAS, accessed on 2 February 2022, [50]) and PheWeb (http://pheweb.sph.umich.edu/, accessed on 2 February 2022) for this study.

3. Results

3.1. Identification of QTLs

We first sought to identify novel genetic loci linked to the phenotypes from Philip et al., 2010 [39] that were not found in the original study. Comparing QTL mapping using Haley–Knot (H-K; as used previously) [51] and GEMMA, there are 426 traits which had a maximum LRS < 17 with H-K (i.e., non-significant), that now have a maximum −log(p) > 4. These new QTL are therefore of interest (Table 1). To confirm these, we performed linear mixed model (LMM) QTL mapping in R/qtl2, with permutations. This produced 61 traits which are significant compared to the empirical significance threshold generated by permutations (Supplementary Table S3).
Two methods were used to identify QTLs of interest. First, the group of 61 traits that were significant by permutations were analysed. The second method was to take advantage of independent traits which share QTL at the same location with suggestive p-values (p < 0.63). Traits were referred to as independent if they were carried out in separate groups of animals (e.g., males and females) or if the traits were measured at independent timepoints (e.g., at 10 min after treatment and 60 min after treatment). We identified 25 QTL for 267 traits (Supplementary Table S4).

3.2. Novel QTL

For each of the QTL identified above, we determined if they were reported in Philip et al.’s original study [39], or if related phenotypes have been reported in the MGI database [52].
Several locomotion traits related the QTL map to Chr1:37.671–78.94 Mb (Figure 1) that were not detected in the Philip et al. study. Previously detected relevant phenotypes associated with this region include the loss of righting reflex induced by ethanol [53] and vertical clinging [54].
We report a novel QTL on Chromosome3 (51.723–56.473 Mb) for vertical clinging activity, and on Chromosome4 (105.245–114.11 Mb) for locomotion in response to cocaine. Previous studies show a QTL for anxiety in this region of Chromosome4 [55]. We also report novel QTLs on Chromosome5 for handling induced convulsions as an ethanol response (4.468–5.172 Mb) as well as locomotion in response to cocaine (99.801–101.331 Mb). Finally, there was a novel QTL for locomotion in response to cocaine on Chromosome11 (46.361–50.383 Mb) (Supplementary Table S4).

3.3. Candidate Causal Genes within Novel QTL

We concentrated on a subset of six novel QTL that contained less than 100 genes. These QTLs are more amenable to finding plausible candidate genes using bioinformatic methods. After reducing the likelihood of finding false positives, these large QTLs are more likely to be due to two or more variants in different genes both contributing to the phenotype. The advantage of families of isogenic strains of mice, such as the BXD, is that more strains could be phenotyped, reducing the size of these QTL regions and allowing for greater precision. We leave these large QTLs to future studies. The smaller QTL regions investigated here were: Chr3:51.723–56.473 Mb, Chromosome5:4.468–5.172 Mb, Chr5:99.801–101.331 Mb, Chr9:45.671–48.081 Mb, Chr11:62.923–65.082 Mb and Chromosome14:109.994–114.751 Mb (Supplementary Table S4)
We used several tools to narrow down potential candidate genes within these QTLs. Variants can change phenotype in two main ways: they can either change gene expression or can change protein function. To look for variants altering gene expression, we first looked for genes within our QTL regions with local or cis-eQTL. Cis-eQTL demonstrate that there are variants in or close to a gene that cause changes in that gene’s expression. This is useful, since it clearly shows that a variant in the eQTL region has a regulatory effect. Therefore, genes with a cis-eQTL are interesting candidate genes.
The next step is to investigate whether the expression of these genes correlates with the phenotype(s) of interest. This would suggest a chain of causality: a variant within a gene causes a change in its expression, and the expression of that gene correlates with expression of a phenotypic trait of interest. To do this, we created a correlation matrix between all genes within a QTL with a cis-eQTL in any brain tissue as well as the phenotypes that contributed to the QTL (Supplementary Table S6). Any gene with a cis-eQTL and a significantly correlated expression was considered a good candidate. If the gene only had a cis-eQTL and correlation in a single brain region, then it suggested that this brain region might also be of interest for the phenotype (adding another link to this chain).
The QTL region for vertical activity (Chromosome3 51.723–56.473 Mb) has 60 genes among which six genes have cis-eQTLs (Figure 2) (Supplementary Table S6). No relevant functional annotations (Gene Ontology) have been reported. Dclk1 (location of cis-eQTL: Chromosome3 55.52 Mb) variants were previously reported to be associated across Schizophrenia and Attention Deficit Hyperactivity Disorder [56]. The same gene has been described as a candidate gene for inflammatory nociception [57]. Trpc4 (location of cis-eQTL: Chromosome3 54.266176 Mb) may be involved in the regulation of anxiety-related behaviours [58].
The QTL region for handling induced convulsions (ethanol response; Chromosome5 4.468–5.172 Mb) house two genes (Fzd1 and Cdk14) with cis-eQTLs among the three present in this region. Fzd1 (location of cis-eQTL: Chromosome5 4.753 Mb) receptor regulates adult hippocampal neurogenesis [59]. The QTL corresponding with locomotion in response to cocaine (Chromosome5 99.801–101.331 Mb) has ten genes with cis-eQTLs (Figure 3). QTL analysis of Enoph1 (location of cis-eQTL: Chromosome5 100.062 Mb) in mice indicates that it plays a role in stress reactivity [60]. Variants of Coq2 (location of cis-eQTL: Chromosome5 100.654 Mb) contribute to neurodegenerative disorders such as Parkinson’s disease [61].
Relevant annotations for other genes with cis-eQTLs have not been reported yet by other studies. The QTL corresponding with mechanical nociception (Chromosome9 45.671–48.081 Mb) includes five genes with cis-eQTLs. Sik3 (location of cis-eQTL: Chromosome9 46.222 Mb) is involved in regulating NREM sleep behaviour in mice [62]. Cadm1 (location of cis-eQTL: Chromosome9 47.550 Mb) knockout mice show increased anxiety, impaired social and emotional behaviours, and disrupted motor coordination (Figure 4) [63].
An analysis of the locomotion in response to cocaine QTL (Chromosome11 62.923–65.082 Mb) revealed five genes with cis-eQTLs. Arhgap44 (location of cis-eQTL: Chromosome11 65.005456 Mb) has phenotype associations related to abnormal motor learning, abnormal response to novel objects, increased grooming behaviour, and hypoactivity (Figure 5) [64]. The brain regions with highest correlation have been added to the Supplementary Information (Supplementary Table S6). The QTL corresponding to locomotion in the centre (Chromosome14 109.994–114.751 Mb) has a single gene with a cis-eQTL, Slitrk6 (location of cis-eQTL: Chromosome14 109.231826 Mb, in Figure 6). Knockout of this gene has been associated with impaired locomotory behaviour and altered responses to a novel environment, making this gene a strong candidate [65].

3.4. Co-Expression Networks or “Gene-Friends”

Genes that are co-expressed are often part of the same pathways or networks which contribute to similar phenotypes. These so-called ‘gene-friends’ [66,67] can provide insights into the function of an unannotated gene as function can be implied from the known functions of the genes it co-expresses with. As new datasets are being generated for the BXD consistently (now including methylation, proteomic and metabolic datasets), new associations can be found.
For each of the genes within our phenotype QTLs that also has a cis-eQTL in at least one dataset on GeneNetwork.org, we performed a correlation analysis with all other probes or genes within that dataset. We then performed an enrichment analysis using WebGestalt using all the probes or genes that correlated with our gene of interest (i.e., the gene with a cis-eQTL), and investigated if any of the enriched annotations or pathways were relevant to the phenotype.
Highly relevant enriched phenotypes were found in genes co-expressing with 9430012M22Rik (location of cis-eQTL: Chromosome3 55.291 Mb). This gene is present in a QTL for vertical activity (BXD_12023). Genes that correlate with expression of 9430012M22Rik in the neocortex are enriched for involvement in abnormal locomotor behaviour (FDR = 1.2056 × 10⁻⁹) and abnormal voluntary movement (FDR = 7.1848 × 10⁻¹⁰). Other results for this co-expression network that may be relevant include abnormal synaptic transmission and abnormal nervous system physiology (Supplementary Table S7). The genes that correlate with expression of BC033915 (location of cis-eQTL: Chr9 45.671–48.081 Mb) in the hippocampus are enriched for abnormal motor capabilities/coordination/movement (FDR = 2.3483 × 10⁻¹¹). Other relevant results include abnormal brain morphology and abnormal nervous system physiology. Similarly, genes in the Slitrk6 co-expression network (location of cis-eQTL: Chromosome14 109.231 Mb) in the striatum are involved in abnormal locomotor behaviour (FDR = 6.978 × 10⁻¹²) and abnormal voluntary movement (FDR = 2.9352 × 10⁻¹¹). This makes sense, since this Chromosome14 QTL is for locomotion.
Other genes with cis-eQTLs had significant enrichments that include abnormal brain morphology, abnormal body composition and abnormal nervous system physiology (Supplementary Table S7).

3.5. Gene Variant Analysis

The second method by which a variant can alter a phenotype is changing the protein structure or function. To examine this, we took advantage of the deep sequencing available for all BXD strains. We identified over 6 million common SNPs and small INDELs which segregate within the BXD family (i.e., occur in greater than >20% of the population). For each of the 6 QTL identified above, we looked for variants that were predicted to alter protein structure or splicing, or predicted to be deleterious by SIFT or BLOSUM, using the variant effect predictor (VEP).
The QTL located at Chr3:53.667–54.942Mb for vertical activity contains predicted deleterious variants in 10 genes (Table 2): two missense variants in Ccdc169; one missense variant in Ccna1; one in-frame insertion in Dclk1; two frameshift variants, a stop loss, and nine missense variants in Frem2; a frameshift variant and six missense variants in Mab21l1; a frameshift variant, a missense variant, eight frameshift variants, two in-frame deletions, 18 missense variants, and three stop losses in Nbea; four in-frame deletions, an in-frame insertion, six missense variants, and a start loss in Postn; a frameshift variant, eight missense variants, a stop gain, and a stop loss in Spg20; and a missense variant in Trpc4.
The Chr5:4.468–5.172Mb QTL for handling-induced convulsion in response to ethanol contains two missense variants in Fzd1, and four missense variants in Cdk14. The Chr5:100.164–100.895Mb QTL for cocaine related phenotypes, contains predicted deleterious variants in 8 genes (Table 3): three frameshift variants and three missense variants in Cops4; a missense variant and a stop-gain in Enoph1; a frameshift variant and five missense variants in Hnrnpd; three missense variants and a splice donor variant in Hnrnpdl; two frameshift variants, an in-frame insertion, 13 missense variants, and a splice donor variant in Hpse; three missense variants in LIN54; a frameshift variant, one in-frame deletions, and a splice donor variant in Sec31a; and a missense variant and a splice donor variant in Tmem150c.
The QTL located in chromosome 9 at 45.671–48.081Mb for mechanical nociception contains predicted deleterious variants in three genes (Table 4): A frameshift variant, two missense variants and a stop loss in 4931429L15Rik; two frameshift variants and five missense variants in Cadm1; and an in-frame deletion, three missense variants, and a stop loss in Cep164. The Chr11:62.923–65.082Mb QTL for nociception contains four frameshift variants, an in-frame deletion, and thirteen missense variants in Myocd. The Chr14:109.994–114.751 Mb QTL for locomotion contains a stop loss, three frameshift variants, and 9 missense variants in Slitrk6.

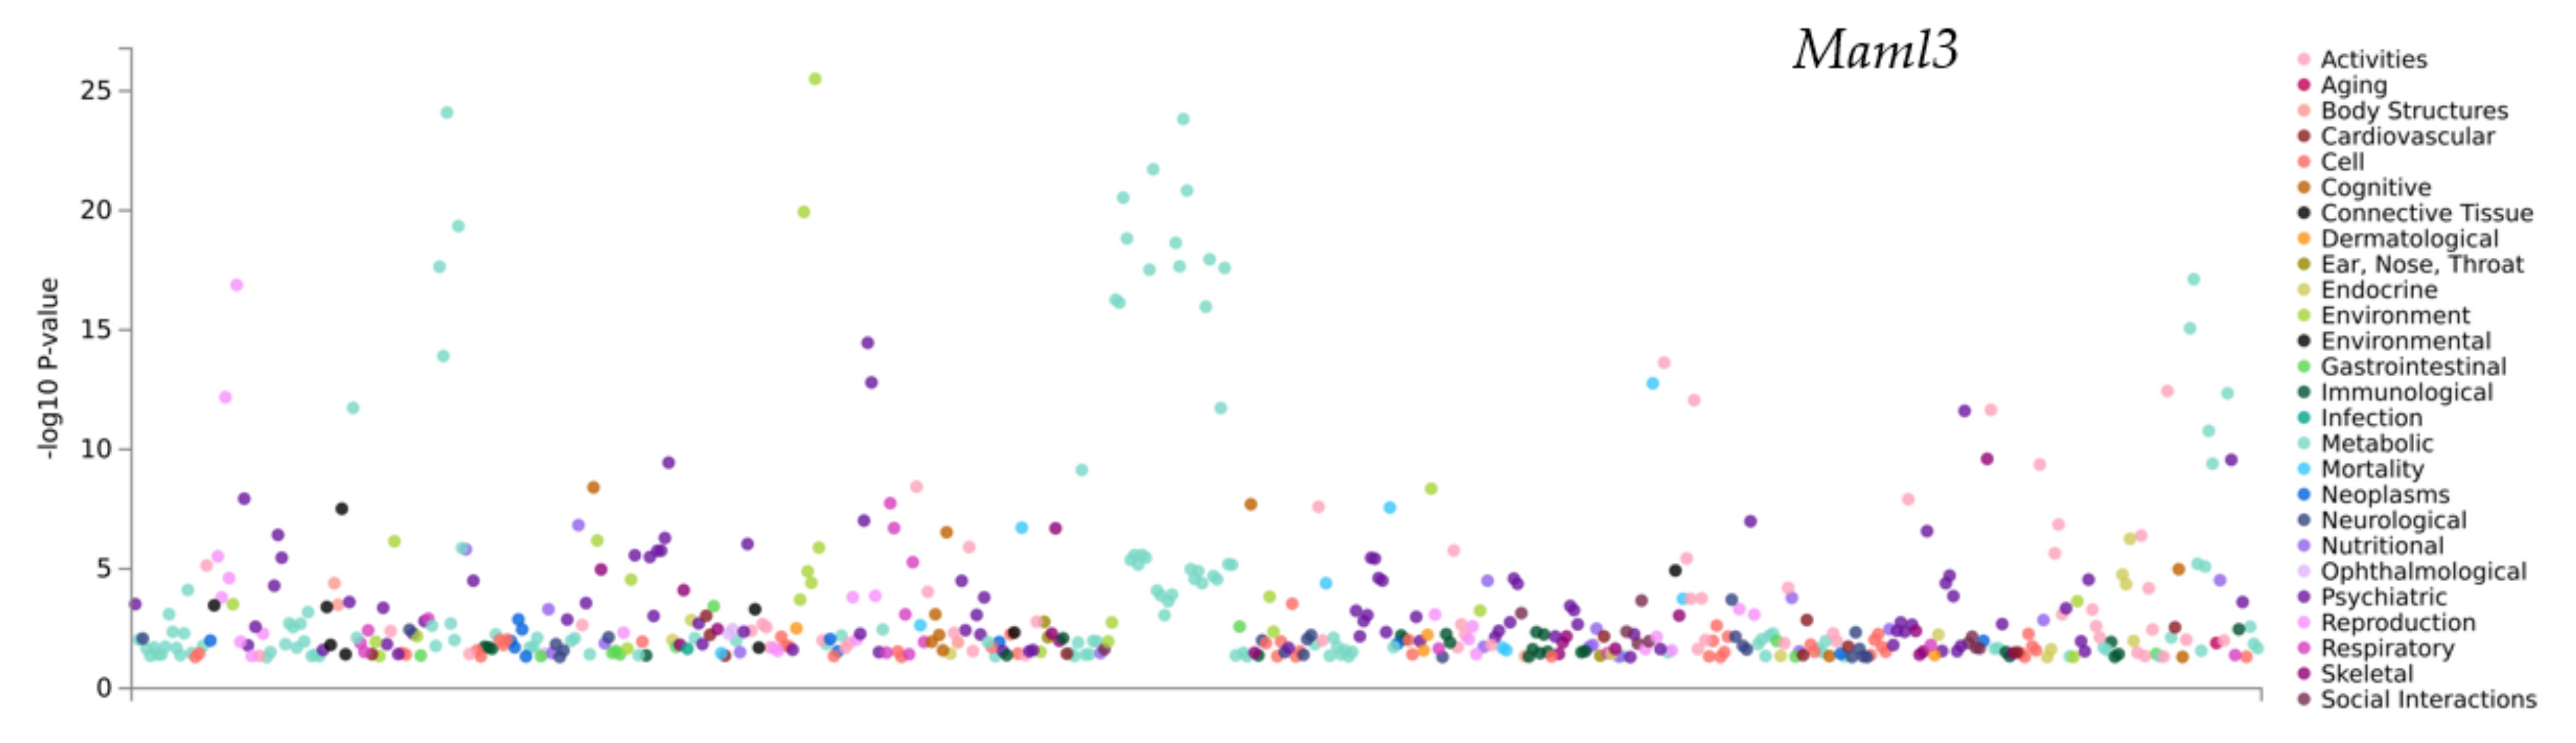
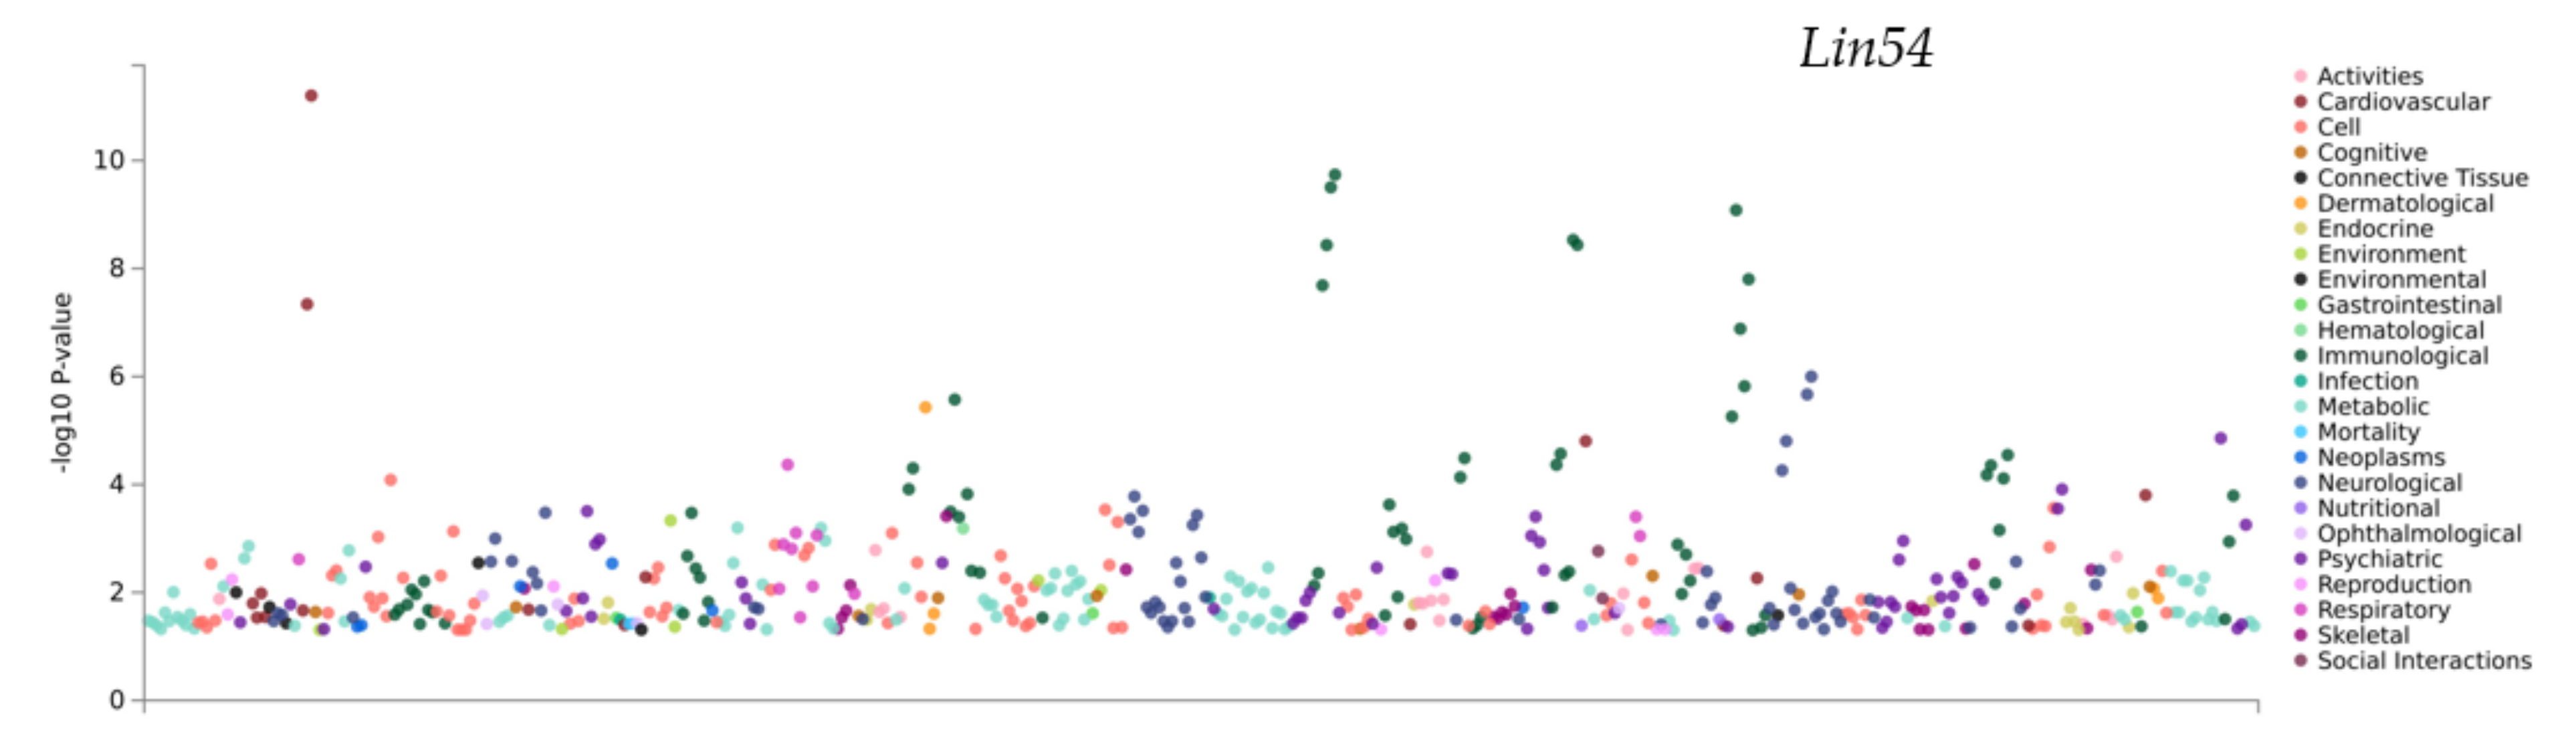
3.6. PheWAS Analysis of the Genes within QTLs

Another method to identify candidate genes is to leverage data generated in another population or species. Phenome-wide association studies (PheWAS) take a gene or variant of interest and find all reported associations in GWAS datasets. A number of these GWAS tools exist, using either different methods, or different human cohorts (https://atlas.ctglab.nl/PheWAS, http://pheweb.sph.umich.edu/, accessed on 2 February 2022).
Mouse QTL mapping has high power but low precision (i.e., we can detect a QTL, but do not know which of tens or hundreds of genes is causal), whereas human GWAS has low power but high precision (tens or hundreds of thousands of individuals are needed, but candidate regions are often smaller). By combining the power of mouse QTL mapping and the precision of human PheWAS, we can do more than both individually. Candidate genes might show up in our analysis here that did not show up in our above analysis for several reasons, the most common being that gene expression was not measured in the relevant cell type or timepoint.
The QTL for vertical activity (Chromosome3 51.723–56.473 Mb) includes several genes with relevant psychiatric, neurological, and cognitive PheWAS hits. Maml3 is associated with alcohol dependence [68] and depression (Figure 7 and Table 5) [69]. Cog6 has significant associations with depressive symptoms [70] and worrier/anxious feelings [50]. Nbea is associated with nervous feelings [50] and alcohol dependence [68].
All the three genes present in the Chr5 4.468–5.172 Mb QTL (handling-induced convulsions, ethanol response) show significant PheWAS hits for psychiatric traits. Fzd1 (location of cis-eQTL: Chromosome5 4.753 Mb) is significantly associated with major depressive disorder [71]. In the QTL residing in Chromosome5, the peak 99.801–101.331 Mb region contains the genes Hnrnpd and Lin54, which show the highest number of relevant pheWAS hits. Lin54 is associated with conditions such as loneliness, anxiety, tension, and sleep related phenotypes (Figure 8 and Table 6) [50,72,73].
Cadm1 (Location of cis-eQTL: Chromosome9 47.550 Mb) gene was found significantly associated with schizophrenia and other psychiatric disorders [71,74]. Among the genes with cis-eQTLs in Chromosome11, Elac2 (location of cis-eQTL: Chr11 64.988 Mb) and Arghap44 have most significant phenotype associations with schizophrenia/bipolar disorder [74,75]. The QTL for locomotion in the centre (Chr14 109.994–114.751 Mb) shows one gene with a PheWAS hit. Slitrk6 is significantly associated with Parkinson’s disease [76] and bipolar disorder [75], as well as has significant associations with various psychiatric traits including anxiety [50], nervous feelings [50] and alcohol dependence [68] (Supplementary Table S8).

4. Discussion

Here, we have demonstrated that old data in populations of isogenic strains can be reanalysed to identify novel genetic associations containing novel candidate genes. Of particular interest is Slitrk6 on Chr14. Slitrk6 (SLIT and NTRK Like Family Member 6) is a protein coding gene. Our analysis strongly shows that abnormality in Slitrk6 is implicated in disrupted locomotor behaviour. The presence of cis-eQTL implies that a variant in this gene is affecting its expression and the gene is under its own regulation. Being part of a network in the striatum, which is significantly involved in abnormal locomotory behaviour and abnormal voluntary movement, increases the plausibility. This gene has evidence of both altered gene expression and protein structure/function, and human PheWAS analysis shows that this gene is involved in various neuropsychiatric and neurological phenotypes. The Slitrk family have been previously mentioned as prominent candidate genes involved in neuropsychiatric disorders [77]. The members of the Slitrk family have been shown to be widely expressed in the central nervous system, with partially overlapping yet differential patterns of expression [78]. It is worth noting that this gene along with the other candidates have not been reported in the original study.
Another prominent finding is Cadm1 (Cell adhesion molecule 1), which is a member of the immunoglobulin superfamily and present on Chromosome9. Our analysis shows the presence of a cis-eQTL for this gene, and variants in the human gene are associated with schizophrenia. Cadm1 knockout mice show anxiety-like behaviour in the open-field and light-dark transition tests, as well as motor coordination and gait impairments in rotarod and footprint tests [63]. The role of CADM1 in relation to prefrontal brain activities, inhibition function, and ADHD, indicating a potential “gene–brain–behaviour” relationship was shown previously by research that evaluated the association of CADM1 genotype with ADHD, executive function, and regional brain functions [79]. Studies show a connection between ADHD and pain tolerance [80], and adults with ADHD are comparatively more sensitive to pain. In such cases, dopamine agonists such as methylphenidate (MP) may exert antinociceptive properties [81] and normalize pain perception. Adults and children with ADHD exhibit motor regulation problems which are in turn associated with pain levels [82].
We discovered a novel QTL that regulates and handles induced convulsions after ethanol treatment (BXD_11635) on Chr5:4.468–5.172. Only three genes are within the confidence interval for this QTL, two of which, Fzd1 and Cdk14, have cis-eQTL and predicted deleterious variants. Interestingly, Cdk14 is regulated by the anticonvulsant drug valproic acid [83,84,85] and is up-regulated in malaria patients who experience febrile convulsions [41,51,86].

5. Conclusions

In this analysis, using GeneNetwork.org (http://www.genenetwork.org/, accessed on 2 February 2022), we have demonstrated the plausibility of using new tools to re-examine older data to investigate candidate genes relevant to addiction research. We used families of isogenic strains of mice to not only go back and discover new drug-related phenotype–genotype associations that were not previously found, but also find highly plausible candidate genes within these novel QTL. Of these genes, many were found to have implications for phenotypes of interest in addiction research, as well as translatability across mouse and human datasets. This sort of investigation is key in the study of addiction-related illnesses, since these diseases are complex and polygenic in nature, and also possess explicit environmental components.

Supplementary Materials

The following supporting information can be downloaded at: https://www.mdpi.com/article/10.3390/genes13040614/s1, Table S1: Phenotype data and reanalysis with new tools and genotypes; Table S2: Significant traits with QTL regions; Table S3: Significant traits (H-K vs. GEMMA and R/qtl2); Table S4: QTLs and respective summaries; Table S5: Comparison of QTLs found in this study with Philip et al. and other studies; Table S6: Genes and cis-eQTLs; Table S7: Co-expression networks or ‘gene-friends’; Table S8: PheWAS.

Author Contributions

Conceptualization, A.C. and D.G.A.; methodology, A.C. and P.M.W.; formal analysis, D.G.A.; investigation, A.C. and P.M.W.; resources, D.G.A.; data curation, A.C. and D.G.A.; writing—original draft preparation, A.C.; writing—review and editing, P.M.W.; visualization, P.M.W.; supervision, D.G.A.; project administration, D.G.A. All authors have read and agreed to the published version of the manuscript.

Funding

This project was carried out using GeneNetwork.org. GeneNetwork.org is supported by the UTHSC Center for Integrative and Translational Genomics, the UT-ORNL Governor’s Chair, NIGMS R01GM123489, NIDA P30DA044223, NIAAA U01AA016662, U01AA013499, U24AA013513, U01AA014425, and NIAAA P20DA21131.

Institutional Review Board Statement

Not applicable.

Informed Consent Statement

Not applicable.

Data Availability Statement

All data supporting this article can be accessed and reanalyzed using GeneNetwork.org.

Acknowledgments

We would like to thank the authors of Philip et al. 2010. Without their work in producing the data, and in making it freely available on GeneNetwork.org, this project would not have been possible. We thank R.W. Williams for helpful discussion on the BXD models. We thank the members of the GeneNetwork.org team for their assistance, excellent data curation, and informatics support.

Conflicts of Interest

The authors declare no conflict of interest.

References

  1. Wilkinson, M.D.; Dumontier, M.; Aalbersberg, I.J.; Appleton, G.; Axton, M.; Baak, A.; Blomberg, N.; Boiten, J.W.; da Silva Santos, L.B.; Bourne, P.E.; et al. The FAIR Guiding Principles for scientific data management and stewardship. Sci. Data 2016, 3, 160018. [Google Scholar] [CrossRef] [Green Version]
  2. Ashbrook, D.G.; Arends, D.; Prins, P.; Mulligan, M.K.; Roy, S.; Williams, E.G.; Lutz, C.M.; Valenzuela, A.; Bohl, C.J.; Ingels, J.F.; et al. A platform for experimental precision medicine: The extended BXD mouse family. Cell Syst. 2021, 12, 235–247.e9. [Google Scholar] [CrossRef]
  3. Castle, W.E. Variation in the hooded pattern of rats, and a new allele of hooded. Genetics 1951, 36, 254–266. [Google Scholar] [CrossRef]
  4. Belknap, J.K.; Crabbe, J.C.; Plomin, R.; McClearn, G.E.; Sampson, K.E.; O’Toole, L.A.; Gora-Maslak, G. Single-locus control of saccharin intake in BXD/Ty recombinant inbred (RI) mice: Some methodological implications for RI strain analysis. Behav. Genet. 1992, 22, 81–100. [Google Scholar] [CrossRef]
  5. Belknap, J.K.; Metten, P.; Helms, M.L.; O’Toole, L.A.; Angeli-Gade, S.; Crabbe, J.C.; Phillips, T.J. Quantitative trait loci (QTL) applications to substances of abuse: Physical dependence studies with nitrous oxide and ethanol in BXD mice. Behav. Genet. 1993, 23, 213–222. [Google Scholar] [CrossRef]
  6. Dickson, P.E.; Miller, M.M.; Calton, M.A.; Bubier, J.A.; Cook, M.N.; Goldowitz, D.; Chesler, E.J.; Mittleman, G. Systems genetics of intravenous cocaine self-administration in the BXD recombinant inbred mouse panel. Psychopharmacology 2016, 233, 701–714. [Google Scholar] [CrossRef] [Green Version]
  7. Grisel, J.E.; Belknap, J.K.; O’Toole, L.A.; Helms, M.L.; Wenger, C.D.; Crabbe, J.C. Quantitative trait loci affecting methamphetamine responses in BXD recombinant inbred mouse strains. J. Neurosci. 1997, 17, 745–754. [Google Scholar] [CrossRef]
  8. Palmer, A.A.; Lessov-Schlaggar, C.N.; Ponder, C.A.; McKinnon, C.S.; Phillips, T.J. Sensitivity to the locomotor-stimulant effects of ethanol and allopregnanolone: A quantitative trait locus study of common genetic influence. Genes Brain Behav. 2006, 5, 506–517. [Google Scholar] [CrossRef]
  9. Phillips, T.J.; Belknap, J.K.; Buck, K.J.; Cunningham, C.L. Genes on mouse chromosomes 2 and 9 determine variation in ethanol consumption. Mamm. Genome 1998, 9, 936–941. [Google Scholar]
  10. Rodriguez, L.A.; Plomin, R.; Blizard, D.A.; Jones, B.C.; McClearn, G.E. Alcohol acceptance, preference, and sensitivity in mice. I. Quantitative genetic analysis using BXD recombinant inbred strains. Alcohol. Clin. Exp. Res. 1994, 18, 1416–1422. [Google Scholar] [CrossRef]
  11. Boon, A.C.M.; Williams, R.W.; Sinasac, D.S.; Webby, R.J. A novel genetic locus linked to pro-inflammatory cytokines after virulent H5N1 virus infection in mice. BMC Genom. 2014, 15, 1017. [Google Scholar] [CrossRef] [Green Version]
  12. Grizzle, W.E.; Mountz, J.D.; Yang, P.-A.; Xu, X.; Sun, S.; Van Zant, G.E.; Williams, R.W.; Hsu, H.C.; Zhang, H.G. BXD recombinant inbred mice represent a novel T cell-mediated immune response tumor model. Int. J. Cancer 2002, 101, 270–279. [Google Scholar] [CrossRef]
  13. Hayes, K.S.; Hager, R.; Grencis, R.K. Sex-dependent genetic effects on immune responses to a parasitic nematode. BMC Genom. 2014, 15, 193. [Google Scholar] [CrossRef] [Green Version]
  14. Miyairi, I.; Ziebarth, J.; Laxton, J.D.; Wang, X.; van Rooijen, N.; Williams, R.W.; Lu, L.; Byrne, G.I.; Cui, Y. Host genetics and Chlamydia disease: Prediction and validation of disease severity mechanisms. PLoS ONE 2012, 7, e33781. [Google Scholar] [CrossRef] [Green Version]
  15. Wang, J.; Yoon, T.W.; Read, R.; Yi, A.-K.; Williams, R.W.; Fitzpatrick, E.A. Genetic variability of T cell responses in Hypersensitivity Pneumonitis identified using the BXD genetic reference panel. Am. J. Physiol. Lung Cell. Mol. Physiol. 2020, 318, L631–L643. [Google Scholar] [CrossRef]
  16. Ashbrook, D.G.; Sharmin, N.; Hager, R. Offspring genes indirectly influence sibling and maternal behavioral strategies over resource share. Proc. R. Soc. B Biol. Sci. 2017, 284, 20171059. [Google Scholar]
  17. Ashbrook, D.G.; Roy, S.; Clifford, B.G.; Riede, T.; Scattoni, M.L.; Heck, D.H.; Lu, L.; Williams, R.W. Born to cry: A genetic dissection of infant vocalization. Front. Behav. Neurosci. 2018, 12, 250. [Google Scholar] [CrossRef]
  18. Dickson, P.E.; Roy, T.A.; McNaughton, K.A.; Wilcox, T.D.; Kumar, P.; Chesler, E.J. Systems genetics of sensation seeking. Genes Brain Behav. 2019, 18, e12519. [Google Scholar] [CrossRef]
  19. Graybeal, C.; Bachu, M.; Mozhui, K.; Saksida, L.M.; Bussey, T.J.; Sagalyn, E.; Williams, R.W.; Holmes, A. Strains and stressors: An analysis of touchscreen learning in genetically diverse mouse strains. PLoS ONE 2014, 9, e87745. [Google Scholar] [CrossRef] [Green Version]
  20. Knoll, A.T.; Jiang, K.; Levitt, P. Quantitative trait locus mapping and analysis of heritable variation in affiliative social behavior and co-occurring traits. Genes Brain Behav. 2017, 17, e12431. [Google Scholar] [CrossRef]
  21. Li, Z.; Mulligan, M.K.; Wang, X.; Miles, M.F.; Lu, L.; Williams, R.W. A transposon in Comt generates mRNA variants and causes widespread expression and behavioral differences among mice. PLoS ONE 2010, 5, e12181. [Google Scholar] [CrossRef] [PubMed] [Green Version]
  22. Mulligan, M.K.; Abreo, T.; Neuner, S.M.; Parks, C.; Watkins, C.E.; Houseal, M.T.; Shapaker, T.M.; Hook, M.; Tan, H.; Wang, X. Identification of a Functional Non-coding Variant in the GABA A Receptor α2 Subunit of the C57BL/6J Mouse Reference Genome: Major Implications for Neuroscience Research. Front. Genet. 2019, 10, 188. [Google Scholar] [CrossRef] [PubMed] [Green Version]
  23. Williams, E.G.; Mouchiroud, L.; Frochaux, M.; Pandey, A.; Andreux, P.A.; Deplancke, B.; Auwerx, J. An evolutionarily conserved role for the aryl hydrocarbon receptor in the regulation of movement. PLoS Genet. 2014, 10, e1004673. [Google Scholar] [CrossRef] [PubMed] [Green Version]
  24. Houtkooper, R.H.; Mouchiroud, L.; Ryu, D.; Moullan, N.; Katsyuba, E.; Knott, G.; Williams, R.W.; Auwerx, J. Mitonuclear protein imbalance as a conserved longevity mechanism. Nature 2013, 497, 451–457. [Google Scholar] [CrossRef] [Green Version]
  25. Neuner, S.M.; Garfinkel, B.P.; Wilmott, L.A.; Ignatowska-Jankowska, B.M.; Citri, A.; Orly, J.; Lu, L.; Overall, R.W.; Mulligan, M.K.; Kempermann, G. Systems genetics identifies Hp1bp3 as a novel modulator of cognitive aging. Neurobiol. Aging 2016, 46, 58–67. [Google Scholar] [CrossRef] [Green Version]
  26. Roy, S.; Sleiman, M.B.; Jha, P.; Williams, E.G.; Ingels, J.F.; Chapman, C.J.; McCarty, M.S.; Ziebarth, J.D.; Hook, M.; Sun, A. Gene-by-environment modulation of lifespan and weight gain in the murine BXD family. Nat. Metab. 2021, 3, 1217–1227. [Google Scholar] [CrossRef]
  27. Sandoval-Sierra, J.V.; Helbing, A.H.B.; Williams, E.G.; Ashbrook, D.G.; Roy, S.; Williams, R.W.; Mozhui, K. Body weight and high-fat diet are associated with epigenetic aging in female members of the BXD murine family. Aging Cell. 2020, 19, e13207. [Google Scholar] [CrossRef]
  28. Williams, E.G.; Pfister, N.; Roy, S.; Statzer, C.; Ingels, J.; Bohl, C.; Hasan, M.; Čuklina, J.; Bühlmann, P.; Zamboni, N.; et al. Multiomic profiling of the liver across diets and age in a diverse mouse population. Cell Syst. 2022, 13, 43–57.e6. [Google Scholar] [CrossRef]
  29. Neuner, S.M.; Heuer, S.E.; Huentelman, M.J.; O’Connell, K.M.S.; Kaczorowski, C.C. Harnessing Genetic Complexity to Enhance Translatability of Alzheimer’s Disease Mouse Models: A Path toward Precision Medicine. Neuron 2019, 101, 399–411.e5. [Google Scholar] [CrossRef] [Green Version]
  30. Neuner, S.M.; Heuer, S.E.; Zhang, J.-G.; Philip, V.M.; Kaczorowski, C.C. Identification of Pre-symptomatic Gene Signatures That Predict Resilience to Cognitive Decline in the Genetically Diverse AD-BXD Model. Front. Genet. 2019, 10, 35. [Google Scholar] [CrossRef] [Green Version]
  31. Neuner, S.M.; Wilmott, L.A.; Hoffmann, B.R.; Mozhui, K.; Kaczorowski, C.C. Hippocampal proteomics defines pathways associated with memory decline and resilience in normal aging and Alzheimer’s disease mouse models. Behav. Brain Res. 2017, 322, 288–298. [Google Scholar] [CrossRef] [PubMed]
  32. O’Connell, K.M.S.; Ouellette, A.R.; Neuner, S.M.; Dunn, A.R.; Kaczorowski, C.C. Genetic background modifies CNS-mediated sensorimotor decline in the AD-BXD mouse model of genetic diversity in Alzheimer’s disease. Genes Brain Behav. 2019, 18, e12603. [Google Scholar] [CrossRef] [PubMed] [Green Version]
  33. Rosen, G.D.; Pung, C.J.; Owens, C.B.; Caplow, J.; Kim, H.; Mozhui, K.; Lu, L.; Williams, R.W. Genetic modulation of striatal volume by loci on Chrs 6 and 17 in BXD recombinant inbred mice. Genes Brain Behav. 2009, 8, 296–308. [Google Scholar] [CrossRef] [PubMed]
  34. McKnite, A.M.; Perez-Munoz, M.E.; Lu, L.; Williams, E.G.; Brewer, S.; Andreux, P.A.; Bastiaansen, J.W.M.; Wang, X.; Kachman, S.D.; Auwerx, J. Murine gut microbiota is defined by host genetics and modulates variation of metabolic traits. PLoS ONE 2012, 7, e3919. [Google Scholar] [CrossRef] [Green Version]
  35. Taylor, B.A.; Heiniger, H.J.; Meier, H. Genetic analysis of resistance to cadmium-induced testicular damage in mice. Proceedings of the Society for Experimental Biology and Medicine. Soc. Exp. Biol. Med. 1973, 143, 629–633. [Google Scholar] [CrossRef] [PubMed]
  36. Taylor, B.A.; Wnek, C.; Kotlus, B.S.; Roemer, N.; MacTaggart, T.; Phillips, S.J. Genotyping new BXD recombinant inbred mouse strains and comparison of BXD and consensus maps. Mamm. Genome 1999, 10, 335–348. [Google Scholar] [CrossRef]
  37. Peirce, J.L.; Lu, L.; Gu, J.; Silver, L.M.; Williams, R.W. A new set of BXD recombinant inbred lines from advanced intercross populations in mice. BMC Genet. 2004, 5, 7. [Google Scholar] [CrossRef] [Green Version]
  38. Wang, J.; Williams, R.W.; Manly, K.F. WebQTL: Web-based complex trait analysis. Neuroinformatics 2003, 1, 299–308. [Google Scholar] [CrossRef]
  39. Philip, V.M.; Duvvuru, S.; Gomero, B.; Ansah, T.A.; Blaha, C.D.; Cook, M.N.; Hamre, K.M.; Lariviere, W.R.; Matthews, D.B.; Mittleman, G. High-throughput behavioral phenotyping in the expanded panel of BXD recombinant inbred strains. Genes Brain Behav. 2010, 9, 129–159. [Google Scholar] [CrossRef] [Green Version]
  40. Broman, K.W.; Gatti, D.M.; Simecek, P.; Furlotte, N.A.; Prins, P.; Sen, Ś.; Yandell, B.S.; Churchill, G.A. R/qtl2: Software for Mapping Quantitative Trait Loci with High-Dimensional Data and Multiparent Populations. Genetics 2019, 211, 495–502. [Google Scholar] [CrossRef] [Green Version]
  41. Manichaikul, A.; Dupuis, J.; Sen, S.; Broman, K.W. Poor Performance of Bootstrap Confidence Intervals for the Location of a Quantitative Trait Locus. Genetics 2006, 174, 481–489. [Google Scholar] [CrossRef] [PubMed] [Green Version]
  42. Liao, Y.; Wang, J.; Jaehnig, E.J.; Shi, Z.; Zhang, B. WebGestalt 2019: Gene set analysis toolkit with revamped UIs and APIs. Nucleic Acids Res. 2019, 47, W199–W205. [Google Scholar] [CrossRef] [PubMed] [Green Version]
  43. Wang, J.; Duncan, D.; Shi, Z.; Zhang, B. WEB-based GEne SeT AnaLysis Toolkit (WebGestalt): Update 2013. Nucleic Acids Res. 2013, 41, W77–W83. [Google Scholar] [CrossRef] [PubMed] [Green Version]
  44. Wang, J.; Vasaikar, S.; Shi, Z.; Greer, M.; Zhang, B. WebGestalt 2017: A more comprehensive, powerful, flexible and interactive gene set enrichment analysis toolkit. Nucleic Acids Res. 2017, 45, W130–W137. [Google Scholar] [CrossRef]
  45. Zhang, B.; Kirov, S.; Snoddy, J. WebGestalt: An integrated system for exploring gene sets in various biological contexts. Nucleic Acids Res. 2005, 33, W741–W748. [Google Scholar] [CrossRef]
  46. McLaren, W.; Gil, L.; Hunt, S.E.; Riat, H.S.; Ritchie, G.R.S.; Thormann, A.; Flicek, P.; Cunningham, F. The Ensembl variant effect predictor. Genome Biol. 2016, 17, 122. [Google Scholar] [CrossRef] [Green Version]
  47. Sim, N.-L.; Kumar, P.; Hu, J.; Henikoff, S.; Schneider, G.; Ng, P.C. SIFT web server: Predicting effects of amino acid substitutions on proteins. Nucleic Acids Res. 2012, 40, W452–W457. [Google Scholar] [CrossRef]
  48. Ng, P.C.; Henikoff, S. SIFT: Predicting amino acid changes that affect protein function. Nucleic Acids Res. 2003, 31, 3812–3814. [Google Scholar] [CrossRef] [Green Version]
  49. Eddy, S.R. Where did the BLOSUM62 alignment score matrix come from? Nat. Biotechnol. 2004, 22, 1035–1036. [Google Scholar] [CrossRef]
  50. Watanabe, K.; Stringer, S.; Frei, O.; Umićević Mirkov, M.; de Leeuw, C.; Polderman, T.J.C.; van der Sluis, S.; Andreassen, O.A.; Neale, B.M.; Posthuma, D. A global overview of pleiotropy and genetic architecture in complex traits. Nat. Genet. 2019, 51, 1339–1348. [Google Scholar] [CrossRef]
  51. Haley, C.; Knott, S. A simple regression method for mapping quantitative trait loci in line crosses using flanking markers. Heredity 1992, 69, 315–324. [Google Scholar] [CrossRef] [PubMed] [Green Version]
  52. Eppig, J.T. Mouse genome informatics (MGI) resource: Genetic, genomic, and biological knowledgebase for the laboratory mouse. ILAR J. 2017, 58, 17–41. [Google Scholar] [CrossRef] [PubMed] [Green Version]
  53. Bennett, B.; Markel, P.D.; Beeson, M.A.; Gordon, L.G.; Johnson, T.E. Mapping quantitative trait loci for ethanol-induced anesthesia in LSxSS recombinant inbred and F2 mice: Methodology and results. Alcohol Alcohol. 1994, 2, 79–86. [Google Scholar]
  54. Le Roy, I.; Perez-Diaz, F.; Cherfouh, A.; Roubertoux, P.L. Preweanling sensorial and motor development in laboratory mice: Quantitative trait loci mapping. Dev. Psychobiol. 1999, 34, 139–158. [Google Scholar] [CrossRef]
  55. Nakamura, K.; Xiu, Y.; Ohtsuji, M.; Sugita, G.; Abe, M.; Ohtsuji, N.; Hamano, Y.; Jiang, Y.; Takahashi, N.; Shirai, T. Genetic dissection of anxiety in autoimmune disease. Hum. Mol. Genet. 2003, 12, 1079–1086. [Google Scholar] [CrossRef] [Green Version]
  56. Håvik, B.; Degenhardt, F.A.; Johansson, S.; Fernandes, C.P.D.; Hinney, A.; Scherag, A.; Lybæk, H.; Djurovic, S.; Christoforou, A.; Ersland, K.M. DCLK1 variants are associated across schizophrenia and attention deficit/hyperactivity disorder. PLoS ONE 2012, 7, e35424. [Google Scholar] [CrossRef] [Green Version]
  57. Nair, H.K.; Hain, H.; Quock, R.M.; Philip, V.M.; Chesler, E.J.; Belknap, J.K.; Lariviere, W.R. Genomic loci and candidate genes underlying inflammatory nociception. Pain 2011, 152, 599–606. [Google Scholar] [CrossRef] [Green Version]
  58. Riccio, A.; Li, Y.; Tsvetkov, E.; Gapon, S.; Yao, G.L.; Smith, K.S.; Engin, E.; Rudolph, U.; Bolshakov, V.Y.; Clapham, D.E. Decreased anxiety-like behavior and Gαq/11-dependent responses in the amygdala of mice lacking TRPC4 channels. J. Neurosci. 2014, 34, 3653–3667. [Google Scholar] [CrossRef] [Green Version]
  59. Mardones, M.D.; Andaur, G.A.; Varas-Godoy, M.; Henriquez, J.F.; Salech, F.; Behrens, M.I.; Couve, A.; Inestrosa, N.C.; Varela-Nallar, L. Frizzled-1 receptor regulates adult hippocampal neurogenesis. Mol. Brain 2016, 9, 29. [Google Scholar] [CrossRef] [Green Version]
  60. Barth, A.; Bilkei-Gorzo, A.; Drews, E.; Otte, D.M.; Diaz-Lacava, A.; Varadarajulu, J.; Turck, C.W.; Wienker, T.F.; Zimmer, A. Analysis of quantitative trait loci in mice suggests a role of Enoph1 in stress reactivity. J. Neurochem. 2014, 128, 807–817. [Google Scholar] [CrossRef]
  61. Mikasa, M.; Kanai, K.; Li, Y.; Yoshino, H.; Mogushi, K.; Hayashida, A.; Ikeda, A.; Kawajiri, S.; Okuma, Y.; Kashihara, K. COQ2 variants in Parkinson’s disease and multiple system atrophy. J. Neural Transm. 2018, 125, 937–944. [Google Scholar] [CrossRef] [PubMed]
  62. Funato, H.; Miyoshi, C.; Fujiyama, T.; Kanda, T.; Sato, M.; Wang, Z.; Ma, J.; Nakane, S.; Tomita, J.; Ikkyu, A. Forward-genetics analysis of sleep in randomly mutagenized mice. Nature 2016, 539, 378–383. [Google Scholar] [CrossRef] [PubMed]
  63. Takayanagi, Y.; Fujita, E.; Yu, Z.; Yamagata, T.; Momoi, M.Y.; Momoi, T.; Onaka, T. Impairment of social and emotional behaviors in Cadm1-knockout mice. Biochem. Biophys. Res. Commun. 2010, 396, 703–708. [Google Scholar] [CrossRef] [PubMed]
  64. Sarowar, T.; Grabrucker, S.; Föhr, K.; Mangus, K.; Eckert, M.; Bockmann, J.; Boeckers, T.M.; Grabrucker, A.M. Enlarged dendritic spines and pronounced neophobia in mice lacking the PSD protein RICH2. Mol. Brain 2016, 9, 28. [Google Scholar] [CrossRef] [PubMed] [Green Version]
  65. Matsumoto, Y.; Katayama, K.; Okamoto, T.; Yamada, K.; Takashima, N.; Nagao, S.; Aruga, J. Impaired auditory-vestibular functions and behavioral abnormalities of Slitrk6-deficient mice. PLoS ONE 2011, 6, e16497. [Google Scholar] [CrossRef] [PubMed] [Green Version]
  66. Van Dam, S.; Cordeiro, R.; Craig, T.; van Dam, J.; Wood, S.H.; de Magalhães, J.P. GeneFriends: An online co-expression analysis tool to identify novel gene targets for aging and complex diseases. BMC Genom. 2012, 13, 535. [Google Scholar] [CrossRef] [Green Version]
  67. Van Dam, S.; Craig, T.; de Magalhães, J.P. GeneFriends: A human RNA-seq-based gene and transcript co-expression database. Nucleic Acids Res. 2015, 43, D1124–D1132. [Google Scholar] [CrossRef] [Green Version]
  68. Wang, J.C.; Foroud, T.; Hinrichs, A.L.; Le, N.X.H.; Bertelsen, S.; Budde, J.P.; Harari, O.; Koller, D.L.; Wetherill, L.; Agrawal, A. A genome-wide association study of alcohol-dependence symptom counts in extended pedigrees identifies C15orf53. Mol. Psychiatry 2013, 18, 1218–1224. [Google Scholar] [CrossRef] [Green Version]
  69. Howard, D.M.; Adams, M.J.; Clarke, T.-K.; Hafferty, J.D.; Gibson, J.; Shirali, M.; Coleman, J.R.I.; Hagenaars, S.P.; Ward, J.; Wigmore, E.M. Genome-wide meta-analysis of depression identifies 102 independent variants and highlights the importance of the prefrontal brain regions. Nat. Neurosci. 2019, 22, 343–352. [Google Scholar] [CrossRef] [Green Version]
  70. Okbay, A.; Baselmans, B.M.L.; De Neve, J.-E.; Turley, P.; Nivard, M.G.; Fontana, M.A.; Meddens, S.F.W.; Linnér, R.K.; Rietveld, C.A.; Derringer, J. Genetic variants associated with subjective well-being, depressive symptoms, and neuroticism identified through genome-wide analyses. Nat. Genet. 2016, 48, 624–633. [Google Scholar] [CrossRef] [Green Version]
  71. Ripke, S.; Wray, N.R.; Lewis, C.M.; Hamilton, S.P.; Weissman, M.M.; Breen, G.; Byrne, E.M.; Blackwood, D.H.; Boomsma, D.I.; Cichon, S. A mega-analysis of genome-wide association studies for major depressive disorder. Mol. Psychiatry 2013, 18, 497–511. [Google Scholar] [PubMed] [Green Version]
  72. Day, F.R.; Ong, K.K.; Perry, J.R.B. Elucidating the genetic basis of social interaction and isolation. Nat. Commun. 2018, 9, 2457. [Google Scholar] [CrossRef] [PubMed] [Green Version]
  73. Jones, S.E.; Tyrrell, J.; Wood, A.R.; Beaumont, R.N.; Ruth, K.S.; Tuke, M.A.; Yaghootkar, H.; Hu, Y.; Teder-Laving, M.; Hayward, C. Genome-Wide Association Analyses in 128,266 Individuals Identifies New Morningness and Sleep Duration Loci. PLoS Genet. 2016, 12, e1006125. [Google Scholar] [CrossRef] [PubMed]
  74. Schizophrenia Working Group of the Psychiatric Genomics Consortium. Biological insights from 108 schizophrenia-associated genetic loci. Nature 2014, 511, 421–427. [Google Scholar] [CrossRef] [PubMed] [Green Version]
  75. Bipolar Disorder and Schizophrenia Working Group of the Psychiatric Genomics Consortium & Bipolar Disorder and Schizophrenia Working Group of the Psychiatric Genomics Consortium. Genomic dissection of bipolar disorder and schizophrenia, including 28 subphenotypes. Cell 2018, 173, 1705–1715.e16. [Google Scholar] [CrossRef] [Green Version]
  76. Fung, H.-C.; Scholz, S.; Matarin, M.; Simón-Sánchez, J.; Hernandez, D.; Britton, A.; Gibbs, J.R.; Langefeld, C.; Stiegert, M.L.; Schymick, J. Genome-wide genotyping in Parkinson’s disease and neurologically normal controls: First stage analysis and public release of data. Lancet Neurol. 2006, 5, 911–916. [Google Scholar] [CrossRef]
  77. Proenca, C.C.; Gao, K.P.; Shmelkov, S.V.; Rafii, S.; Lee, F.S. Slitrks as emerging candidate genes involved in neuropsychiatric disorders. Trends Neurosci. 2011, 34, 143–153. [Google Scholar] [CrossRef] [Green Version]
  78. Beaubien, F.; Cloutier, J.-F. Differential expression of Slitrk family members in the mouse nervous system. Dev. Dyn. 2009, 238, 3285–3296. [Google Scholar] [CrossRef]
  79. Jin, J.; Liu, L.; Chen, W.; Gao, Q.; Li, H.; Wang, Y.; Qian, Q. The Implicated Roles of Cell Adhesion Molecule 1 (CADM1) Gene and Altered Prefrontal Neuronal Activity in Attention-Deficit/Hyperactivity Disorder: A “Gene-Brain-Behavior Relationship”? Front. Genet. 2019, 10, 882. [Google Scholar] [CrossRef]
  80. Bou Khalil, R.; Khoury, E.; Richa, S. The Comorbidity of Fibromyalgia Syndrome and Attention Deficit and Hyperactivity Disorder from a Pathogenic Perspective. Pain Med. 2018, 19, 1705–1709. [Google Scholar] [CrossRef]
  81. Treister, R.; Eisenberg, E.; Demeter, N.; Pud, D. Alterations in pain response are partially reversed by methylphenidate (Ritalin) in adults with attention deficit hyperactivity disorder (ADHD). Pain Pract. 2015, 15, 4–11. [Google Scholar] [CrossRef] [PubMed]
  82. Stray, L.L.; Kristensen, Ø.; Lomeland, M.; Skorstad, M.; Stray, T.; Tønnessen, F.E. Motor regulation problems and pain in adults diagnosed with ADHD. Behav. Brain Funct. 2013, 9, 18. [Google Scholar] [CrossRef] [PubMed] [Green Version]
  83. Van Breda, S.G.J.; Claessen, S.M.H.; van Herwijnen, M.; Theunissen, D.H.J.; Jennen, D.G.J.; de Kok, T.M.C.M.; Kleinjans, J.C.S. Integrative omics data analyses of repeated dose toxicity of valproic acid in vitro reveal new mechanisms of steatosis induction. Toxicology 2018, 393, 160–170. [Google Scholar] [CrossRef]
  84. Schulpen, S.H.W.; Pennings, J.L.A.; Piersma, A.H. Gene expression regulation and pathway analysis after valproic acid and carbamazepine exposure in a human embryonic stem cell based neuro-developmental toxicity assay. Toxicol. Sci. 2015, 146, 311–320. [Google Scholar] [CrossRef] [PubMed] [Green Version]
  85. Rempel, E.; Hoelting, L.; Waldmann, T.; Balmer, N.V.; Schildknecht, S.; Grinberg, M.; Das Gaspar, J.A.; Shinde, V.; Stöber, R.; Marchan, R. A transcriptome-based classifier to identify developmental toxicants by stem cell testing: Design, validation and optimization for histone deacetylase inhibitors. Arch. Toxicol. 2015, 89, 1599–1618. [Google Scholar] [CrossRef] [PubMed] [Green Version]
  86. Reuterswärd, P.; Bergström, S.; Orikiiriza, J.; Lindquist, E.; Bergström, S.; Andersson Svahn, H.; Ayoglu, B.; Uhlén, M.; Wahlgren, M.; Normark, J. Levels of human proteins in plasma associated with acute paediatric malaria. Malar. J. 2018, 17, 426. [Google Scholar] [CrossRef] [Green Version]
Figure 1. Phenotypic traits associated with locomotion map to a QTL region on chromosome 1. The peak in this region occurs between Chr1:37.67–78.94 as indicated by the red bracketed bar above. The multi-coloured lines corresponding to the dots are genes contained in this region. Blue dots correspond to areas with specific −logP scores relating to the phenotype.
Genes 13 00614 g001
Figure 2. (55.52 Mb) shown in the red circle, and Trpc4 shown in the purple circle (54.27 Mb), which both have cis-eQTLs in this region. Although these genes have not been annotated for this specific phenotype, they are implicated in previous studies with associated behaviors.
Genes 13 00614 g002
Figure 3. A QTL corresponding with locomotion in response to cocaine has ten genes with cis-eQTLs for Trait ID BXD_11487. A QTL containing Enoph1 shown in the purple circle (100.062 Mb) has been implicated in previous research for its role in stress reactivity. Coq2 shown in the green circle (100.654 Mb) has been investigated for its contribution to neurodegenerative disorders. Although these two genes are great candidates for genes of interest, these aren’t the only applicable. Other relevant genes in this section have not been reported yet by other studies.
Genes 13 00614 g003
Figure 4. Shown in the red circle (46.22 Mb) is involved in regulating sleep behaviors. Cadm1 shown in the green circle (47.55 Mb) is associated with increased anxiety, impaired social and emotional behaviors, and disrupted motor coordination in knockout mice.
Genes 13 00614 g004
Figure 5. A QTL for motor activity in response to cocaine revealed five genes with cis-eQTLs. Arhgap44 shown in the red circle (65.01 Mb) associates with abnormal motor learning, abnormal response to novel objects, increased grooming behavior, and hypoactivity.
Genes 13 00614 g005
Figure 6. There is a single gene with a cis-eQTL corresponding to the QTL region on chromosome 14. Slitrk6 (109.23 Mb), loss of this gene in mice has been associated with impaired locomotory behavior as well as altered responses to novel environmental cues.
Genes 13 00614 g006
Figure 7. QTLs linked with murine phenotypes gain precision with the use of relevant PheWAS hits in a GWAS atlas. An example for this is for vertical activity (Chr 3 51.723-56.473 Mb) includes a number of genes with relevant psychiatric, neurological and cognitive PheWAS hits. Maml3 is associated with alcohol dependence and depression.
Genes 13 00614 g007
Figure 8. Combining PheWAS hits in GWAS atlases with BXD data allow for more robust screening of variants that affect phenotypes. The QTL at Chr 5 peaks at 99.801–101.331 Mb and contains the genes Hnrnpd and Lin54, which show the highest number of relevant pheWAS hits. Lin54 is listed by trait above and has been previously associated with psychiatric phenotypes.
Genes 13 00614 g008
Table 1. Summary of novel QTL, not found at the significant or suggestive level in the original paper by Philip et al. [39]. The position of the QTL, a summary of the phenotypes within that QTL, and relevant phenotypes found in other studies are shown. Details of all identified QTL are in Supplementary Table S5.
ChromosomeQTL Confidence Interval (Mb)Summary of
Phenotype
Relevant
Behaviour
Phenotype
PMID of Relevant Phenotype
Chr137.671–78.94LocomotionLoss of righting
induced by ethanol
8974320
Chr137.671–78.94LocomotionVertical clinging10086232
Chr168.798–80.329Cocaine and locomotionLoss of righting
induced by ethanol
16803863
Chr191.214–99.884Vertical
activity
Loss of righting
induced by ethanol
16803863
Chr351.723–56.473Vertical
activity
Chr797.466–104.149
Chr1282.859–96.105BXD_11407
Chr14109.994–114.751BXD_12023
Chr1571.035–77.148Motor coordination, anxietyAbnormal
fear/anxiety-related behaviour
10556431
Table 2. QTL located at Chr3:53.667–54.942Mb for vertical activity contains predicted deleterious variants in 10 genes.
Number of VariantsType of Variant Gene
2MissenseCcdc169
1MissenseCcna1
1In-frame insertionDclk1
2FrameshiftFrem2
1Stop lossFrem2
9MissenseFrem2
1FrameshiftMab21l1
6MissenseMab21l1
9FrameshiftNbea
2In-frame deletionsNbea
19MissenseNbea
3Stop lossNbea
4In-frame deletionsPostn
1In-frame insertionsPostn
6MissensePostn
1Start lossPostn
1FrameshiftSpg20
8MissenseSpg20
1Stop gainSpg20
1Stop lossSpg20
1MissenseTrpc4
Table 3. The Chr5:100.164-100.895Mb QTL for cocaine related phenotypes contains predicted deleterious variants in 8 genes.
Number of VariantsType of Variant Gene
3FrameshiftCops4
3MissenseCops4
1MissenseEnoph1
1Stop gainEnoph1
1FrameshiftHnrnpd
5MissenseHnrnpd
3MissenseHnrnpd
1Splice donorHnrnpd
2FrameshiftHpse
1In-frame insertionHpse
13MissenseHpse
1Splice donorHpse
3MissenseLin54
1FrameshiftSec31a
1In-frame deletionSec31a
1Splice donorSec31a
1MissenseTmem150c
1Splice donorTmem150c
Table 4. The QTL located in chromosome 9 at 45.671-48.081Mb for mechanical nociception contains predicted deleterious variants in 3 genes.
Number of VariantsType of VariantGene
1Frameshift4931429L15Ri
2Missense4931429L15Ri
1Stop gain4931429L15Ri
2FrameshiftCadm1
5MissenseCadm1
1In-frame deletionCep164
3MissenseCep164
1Stop lossCep164
Table 5. QTLs linked with murine phenotypes gain precision with the use of relevant PheWAS hits in a GWAS atlas. An example for this is for vertical activity (Chr 3 51.723-56.473 Mb) includes a number of genes with relevant psychiatric, neurological and cognitive PheWAS hits. Maml3 is associated with alcohol dependence and depression.
atlas IDPMIDYearDomainTraitp-ValueN
4314306432512019PsychiatricEver smoked regulary3.47 × 10−15262990
3654314277892019PsychiatricSmoking status: Never2.45 × 10−12384964
4327306432562019PsychiatricWell-being spectrum2.73 × 10−102311184
4322306432562019PsychiatricDepressive symptoms (univariate)3.58 × 10−101067913
4313306432512019PsychiatricAge of initiation of regular smoking1.16 × 10−8632802
3425314277892019PsychiatricEver smoked9.55 × 10−8385013
3236314277892019PsychiatricPast tobacco smoking1.02 × 10−7355594
4274308466982019PsychiatricShort sleep2.64 × 10−7411934
3261314277892019PsychiatricAlcohol intake frequency3.80 × 10−7386082
4326306432562019PsychiatricDepressive symptoms (MA GWAMA)5.12 × 10−71067913
56270891812016PsychiatricDepressive symptoms1.72 × 10−6161460
3796299420852018PsychiatricDepressive symptoms1.75 × 10−6381455
3235314277892019PsychiatricCurrent tobacco smoking2.71 × 10−6386150
4293307189012019PsychiatricDepression3.19 × 10−6500199
3268314277892019PsychiatricAlcohol intake versus 10 years previously3.41 × 10−6357907
4171299708892018PsychiatricLoneliness3.44 × 10−6445024
4170299708892018PsychiatricLoneliness (MTAG)3.72 × 10−6487647
Table 6. Combining PheWAS hits in GWAS atlases with BXD data allow for more robust screening of variants that affect phenotypes. The QTL at Chr 5 peaks at 99.801–101.331 Mb and contains the genes Hnrnpd and Lin54, which show the highest number of relevant pheWAS hits. Lin54 is listed by trait above and has been previously associated with psychiatric phenotypes.
atlas IDPMIDYearDomainTraitp-ValueN
4327306432562019PsychiatricWell-being spectrum1.40 × 10−52311184
3998295003822018PsychiatricTense 1.23 × 10−5263635
3291314277892019PsychiatricTense 2.80 × 10−4374129
4293307189012019PsychiatricDepression3.12 × 10−4500199
4325306432562019PsychiatricNeuroticism (MA GWAMA)3.94 × 10−4523783
3798299420852018PsychiatricWorry subcluster5.57 × 10−4348219
4087292552612018PsychiatricNeuroticism8.90 × 10−4329821
4322306432562019PsychiatricDepressive symptoms (univariate)1.05 × 10−31067913
3301314277892019PsychiatricSeen doctor (GP) for nerves, anxiety, tension or depression1.11 × 10−3383771
4321306432562019PsychiatricNeuroticism (univariate)1.12 × 10−3523783
4326306432562019PsychiatricDepressive symptoms (MA GWAMA)1.27 × 10−31067913
3302314277892019PsychiatricSeen a psychiatrist for nerves, anxiety, tension or depression2.48 × 10−3384700
3745314277892019PsychiatricHappiness and subjective well-being—General happiness2.83 × 10−3126132
4011296620592018PsychiatricBroad depression3.34 × 10−3322580
4013296620592018PsychiatricMajor depressive disorder (ICD-coded)3.46 × 10−3217584
4269308675602019PsychiatricNeuroticism general factor3.84 × 10−3270059
3230314277892019PsychiatricMorning/evening person (chronotype)4.42 × 10−3345148
Publisher’s Note: MDPI stays neutral with regard to jurisdictional claims in published maps and institutional affiliations.

