Abstract
The utilization of crop heterosis can greatly improve crop yield. The sterile line is vital for the heterosis utilization of wheat (Triticum aestivum L.). The chloroplast genomes of two sterile lines and one maintainer were sequenced using second-generation high-throughput technology and assembled. The nonsynonymous mutated genes among the three varieties were identified, the expressed difference was further analyzed by qPCR, and finally, the function of the differentially expressed genes was analyzed by the barley stripe mosaic virus-induced gene silencing (BSMV-VIGS) method. A total of 16 genes containing 31 nonsynonymous mutations between K519A and 519B were identified. There were no base mutations in the protein-encoding genes between K519A and YS3038. The chloroplast genomes of 519B and K519A were closely related to the Triticum genus and Aegilops genus, respectively. The gene expression levels of the six selected genes with nonsynonymous mutation sites for K519A compared to 519B were mostly downregulated at the binucleate and trinucleate stages of pollen development. The seed setting rates of atpB-silenced or ndhH-silenced 519B plants by BSMV-VIGS method were significantly reduced. It can be concluded that atpB and the ndhH are likely to be involved in the reproductive transformation of 519B.
1. Introduction
Wheat (T. aestivum L.) is the world’s most widely grown food crop, feeding nearly half of the world’s population [1,2]. It is also an important raw material for industry. For example, wheat gluten can be used as a natural binder in the manufacture of paper [3]. Additionally, dry gluten extracted from wheat can be used as an additive for bread processing [4]. Improving yield per unit area and stress resistance of wheat are very effective strategies to alleviate the food problem. The utilization of heterosis is an effective way to improve wheat yield and quality, and it plays an essential role in the breeding of crops [5,6].
Wheat is a monoecious, self-pollinated crop. Therefore, male sterile lines are essential for the utilizing of heterosis. Male sterility in plants refers to the development of gynoecium as normal during the growth process, but fertilization and seed setting after receiving pollen are abnormal, which are caused by the abnormal development of stamens. The abnormal development of stamens means that the pollens are abortive or anther tissue structure is abnormal, which eventually leads to the decline or loss of pollen vitality. The causes of male sterility in plants are various. According to the origin of male sterile genes, male sterile lines can be divided into three types: genic male sterility (GMS), cytoplasmic male sterility (CMS), and nucleus-cytoplasmic male sterility. At first, Kihara [7] transferred the nucleus of common wheat into Aegilops caudata and cultivated the first nucleus-cytoplasmic male sterile line in 1951. Wilson and Ross [8] introduced the common wheat nucleus into the Triticum timopheevi. Finally, they successfully selected and obtained T-type CMS wheat. After this experiment, the maintainer and restorer lines were also selected, these studies were important for the utilization of wheat heterosis [9]. After years of unremitting efforts by scientists, there are many different cytoplasmic sterile lines that have been cultivated in China [10]. The K-type wheat sterile line has the Aegilops kotschyi cytoplasm, S-type has Aegilops crassa cytoplasm, Q-type has wild oat cytoplasm, and V-type has Aegilops variabilis cytoplasm, and they all have the nucleus of common wheat. In addition, according to the response environments, male sterile lines were divided into thermo-sensitive male sterile lines, photosensitive male sterile lines, and photothermosensitive male sterile lines.
The K-type 1B/1R CMS line is a heterozygote in the cytoplasm of Ae. kotschyi and 1B/1R nucleus of T. aestivum [11]. On this basis, the K-type non-1B/1R CMS line was cultivated. The sterility of the K-type non-1B/1R CMS line was complete and stable, as well as the recovery sources and agronomic traits, thus it has great application value. There have been some researches about K-CMS in physiology [12], cytology [13], protein expression [14], and gene function analysis [15]. For instance, Yang et al. [15] cloned and analyzed the functions of MADS-box, TaAG-A, and TaAG-B genes from a wheat K-CMS line. They found that the expression levels of TaAG-A and TaAG-B were higher in spikes. In the maintainer line, both genes showed downregulation during the uninucleate to trinucleate stage. Then the TaAG-A and TaAG-B were silenced in fertile wheat lines using the VIGS method, resulting in green and yellow striped leaves, emaciated spikes, and decreased seed set rates. Zhang et al. [14] found a total of 41 protein spots differentially expressed through proteomic analysis of pollen in K-CMS lines and maintainers, of which, seven identified proteins were downregulated in CMS lines.
In general, the genetic systems of higher plants mainly include the nuclear genome and the cytoplasmic genome. The cytoplasmic genome mainly includes the mitochondrial and chloroplast genomes. Both mitochondria and chloroplast inheritance belong to the semiautonomous genetic system, which is capable of autonomous DNA replication, transcription, and translation [16]. Besides, many physiological metabolisms of plant cells depend on the combined action of the nucleus, mitochondria, and chloroplast [17,18]. In higher plants, a phenomenon is that the genes of chloroplast and nucleus can be transferred to the mitochondria. Additionally, the chloroplast genes that are transferred to mitochondria often evolve into nonfunctional pseudogenes [19]. However, the genes in the nucleus and mitochondria typically are not transferred to the chloroplast [20,21]. Besides, this process is bidirectional between the mitochondrial and nuclear genomes [22,23]. We speculate that the combination of different types of cytoplasm and nucleus may destroy the intrinsic balance between chloroplast, nucleus, and mitochondria, which may lead to the formation of cytoplasmic male sterility.
Many studies have revealed that mitochondrial genes are involved in plant male sterility, including atp [24,25], cox [24], rps [24], ORF [26,27], and ORF interacted with genes [28]. The common modes of male sterility were rearrangements of mitochondrial genes and chimeric gene fusion [29,30,31]. In addition, the chimeric CMS genes are mostly transcribed together with the upstream or downstream genes, such as ORF79 is co-transcribed with the upstream atp6 gene in rice [32]. Nad2 is co-transcribed with orfB in stem mustard (Brassica juncea) [33]. Cytoplasmic male sterility consists of three main pathways: Mitochondrial genes can directly cause male sterility by energy deficiency [34]; male sterility can be caused by the interaction of cytoplasmic and nucleus genes, due to the retrograde signaling from the mitochondrion interferes with nuclear gene expression [35] and there are also some mitochondrial genes that cause male sterility through differences in expression [24].
Chloroplasts are important organelles for photosynthesis in higher plants and are important organelles to independent genetic information in cells. The chloroplast genome, also known as chloroplast DNA, refers to the sum of the genetic information contained in the chloroplast [36]. Most chloroplast genomes are 120–250 kb in size and chloroplast genomes typically are depicted as closed double-stranded circular rings [37]. They are typically four-segment structures consisting of two inverted repeats (IRs), a short single copy region (SSC), and a long single copy region (LSC). The sequence of the IRs’ regions is the same but in the opposite direction. The structures of the chloroplast genomes are relatively conservative and have fewer changes during the evolution of species. Therefore, the chloroplast genome can provide reliable and accurate information for biodiversity research and provide a lot of basic information for comparative evolution research [38,39].
Since the chloroplast genes can be transferred to mitochondria as mentioned above, and since many mitochondrial genes are involved in the process of male sterility in plants, chloroplast genes might affect male sterility by changing the gene function of mitochondria. Besides, some special structural compositions in chloroplasts were also considered related to the fertility of plants [40]. Li et al. [41] used SDS-PAGE and two-dimensional electrophoresis to compare the differences of peptides on chloroplast thylakoid membranes between CMS lines and their maintainers in beet, corn, and sorghum. There were significant differences in the size, number, and distribution of peptide plaques between the two lines, proving that the composition of chloroplast thylakoid polypeptides might affect cytoplasmic male sterility. Li et al. [42] studied the chloroplast ultrastructure of the CMS line and its maintainer in rape, the number of stacks of grana in the thylakoid of the sterile line was significantly reduced. Additionally, the lamellar structure between grana became thinner or even fractured so that the lamellar system was disordered. Chen et al. [43] found that after the digestion of chloroplast genome DNA of sorghum male sterile line and maintainer line with HindIII endonuclease, the male sterile line produced a 3.7 kb specific fragment, with a 165 bp lack compared to the maintainer line (3.8 kb). The deletion fragment was from the rpoC2 gene, which encodes the β subunit of the RNA polymerase. The amino acids of the deletion fragment will participate in the formation of an α helix. It was found that the identified 1501 differentially expressed transcripts in leaves and anthers at different developmental stages were most of these DETs being localized in plastid and mitochondrion of male sterile line in Brassica napus L. induced by the chemical hybridization agent compared to the wild Brassica napus L. [44].
K519A is a non-1B/1R K-CMS line, and 519B was the maintainer line of K519A with the same nuclear genotype. Their nuclear genomes are derived from the same paternal species, but their cytoplasm genomes are from different maternal species. Thus, the differences in fertility come from the differences between cytoplasmic genomes. YS3038 is also a non-1B/1R K-CMS line. Additionally, the nucleus of YS3038 is basically the same as that of K519A. However, the sterility of YS3038 is thermo-sensitive. To understand the sterile mechanism of K519A and YS3038, the chloroplast genomes of K519A, YS3038, and 519B were sequenced, assembled, annotated, and compared in this study. Then the nonsynonymous mutant sites of coding genes were verified. Besides, possible SSR, possible long repeat sequences, and phylogeny were analyzed. This study can provide an important reference value for the sterile mechanism studies of K519A and YS3038.
2. Materials and Methods
2.1. Material Planting
The K-type male sterile line K519A (non-1B/1R T. aestivum Ae. kotschyi cytoplasm), YS-type thermo-sensitive male sterile line YS3038 (non-1B/1R T. aestivum with Ae. kotschyi cytoplasm), and the same nuclear genotype maintainer line 519B (T. aestivum) of K519A were used in this study. They are provided by our laboratory (Northwest A&F University, Yangling, Shaanxi, China).
After the pollens matured, the opening angle of the glumes of the male sterile line become larger than 519B, the anthers stretch out from the glume (Figure 1(A1,B1)). Additionally, the anther is wizened, short, and crooked, and the pollen cannot spread out from the anther (Figure 1(A2)). After the pollens have matured, the anthers of 519B are plump and cracked, and the amount of fertile pollen spreads out from the anthers (Figure 1(B2)).
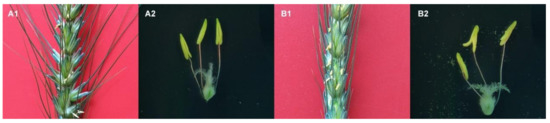
Figure 1.
The structure observation of the ear and anther of male sterile line and 519B. (A1,A2) male-sterile line. (B1,B2) 519B.
The test materials were planted in the experimental field of the Northwest A&F University (108°4′ E, 34°16′ N) on 3 October 2018. The two materials were planted in 4 rows (25 cm between rows), respectively, with 15 seeds in 1 m. Planting was done with general field management measures. Young leaves were stored in a refrigerator at −80 °C in March 2019.
2.2. CTAB Extraction of DNA and Chloroplast Genome Sequencing
Genomic DNA from young leaves of K519A, YS3038, and 519B wheat was extracted by means of the CTAB method. The whole-genome DNA sequences were obtained using second-generation high-throughput technology, with the Illumina HiSeq XTM Ten sequencing platform and paired-end 150 bp sequencing strategy. Firstly, the original sequencing data for each sample was obtained, then low-quality reads and connector sequences were removed. Additionally, the clean data was used for further genome assembly of the chloroplast.
2.3. Genome Assembly and Annotation
The chloroplast assembly was carried out based on the assembly method of Hahn et al. [45]. The assembly steps are as follows: Firstly, the clean data is spliced using SPAdes software [46], setting default parameters except that the cut-off parameter is not selected. The clean data are spliced into scaffolds. Using the published wheat chloroplast DNA sequences (Chinese Spring, CS, T. aestivum) and protein-coding gene sequences as a reference (KJ614396.1). Then the sequences are aligned using Blastn and Exonerate, respectively. The e value threshold of DNA alignment is 1 × 10⁻¹⁰, and the protein similarity threshold is 70%, respectively. Scaffold with gene matching was selected and the coverage was ranked to remove fragments that were clearly not the target fragments, such as most of them were 1000X, but a few were 10X, and then the low-coverage fragments (10X) were removed. PRICE and MITObim was used to splice the collected fragmented sequences to extend the scaffolds. The number of iterations generally was 50. The original sequencing reads were aligned to scaffolds using bowtie2, then the matched paired reads were picked out and spliced by SPAdes. The path was studied to see if a distinct circle diagram could be formed. If so, the circle genome was extracted, otherwise, steps 3–5 above were repeated until a circular genome was formed.
The organelle genome annotation is mainly divided into three parts: protein-coding gene annotation, RNA annotation, and structural annotation. Three methods are commonly used for protein-coding gene prediction. The DNA sequences or protein-coding sequences directly align with NCBI to confirm the genes. Submitting sequences to the online service annotation tools, DOGMA (http://dogma.ccbb.utexas.edu/, accessed on 7 April 2020) and CpGAVAS [47], predicting the ORFs, and then annotating genes in the nr database. In combination with the three methods, the most accurate annotation results are chosen.
Chloroplast tRNA annotations were performed using the tRNAscan-SE online site (http://lowelab.ucsc.edu/tRNAscan-SE/, accessed on 15 May 2020). The rRNA annotations were performed using the RNAmmer 1.2 Server (http://www.cbs.dtu.dk/services/RNAmmer/, accessed on 28 May 2020), in combination with homologous alignments, and boundary correcting. After the sequence annotation was completed, the structure note was edited by Sequin to generate a submission file that could be submitted to the GenBank database. The file was submitted to OGDRAW (https://chlorobox.mpimp-golm.mpg.de/OGDraw.html, accessed on 17 June 2020) to draw the annotated map.
2.4. Codon Preference Analysis of Chloroplast Gene
A codon is a link between genetic information from DNA and protein, and every three adjacent codons encode an amino acid. In all organisms in nature, there are only 20 amino acids in total, however, each amino acid corresponds to at least one or up to six codons. Synonymous codons mean that different codons can encode the same amino acid [48]. The analysis of codon preference was performed using the CHIPS program in the EMBOSS software package [49].
2.5. Simple Sequence Repeat (SSR) and Long Repeat Sequence Analysis
The Microsatellite identification tool (MiSa) [50] was used for finding simple sequence repeats (SSR) in the genome. We used this software to detect SSR with eight times as a minimal repeat number of mononucleotides, five times for dinucleotides, and at least three times for three or more bases.
The polymorphism SSR markers at the same position in the same gene of K519A and 519B were selected. Primer Premier 6.0 software was used to design SSR primers to verify the polymorphism between K519A and 519B.
Using REPuter online software [51] to find long repeat sequences, all options: forward, reverse, complement, and palindromic were selected for “Match Direction”. The parameter “Hamming distance” was set to 3, “maximum computed repeat” to 50, and “minimal repeat size” to 15.
2.6. Gene Alignment Analysis and Phylogenetic Analysis
We used MEGA4.0 software [52] to align the homology of protein-coding genes, then we selected all nonsynonymous mutant sites to verify the accuracy of second-generation sequencing results. According to the company’s sequencing sequence, Primer Premier 6.0 software was used to design primers of nonsynonymous mutant sites, then PCR products were sent to the company for first-generation sequencing (FGS).
The genome-wide alignment of chloroplast genomes K519A, 519B, YS3038, and another 100 chloroplasts of near-source species were performed using HomBlocks (https://github.com/fenghen360/HomBlocks, accessed on 22 July 2021) software with the trimAl trim method. The NJ method was used to build the evolutionary tree with bootstrap value 1000.
2.7. Quantitative Real-Time PCR (qPCR) Analysis
Premier 6.0 software was used for gene-specific primers. RevertAid First Strand cDNA Synthesis Kit (Thermo Scientifc, Wilmington, DE, USA) was used for cDNA synthesis with random primers according to instructions. TB GreenTM Premix Ex TaqTM II (Tli RNaseH Plus) Kit (Takara Biological Engineering, Tokyo, Japan) and Applied Biosystems 7300 Real-Time PCR System (Life Technologies, Carlsbad, CA, USA) were used for the qPCR analysis with three biological replicates and three technical replicates. The wheat Actin gene with AB181991.1 (Gene Bank) was used for normalization. The 2–ΔΔCT method was used to calculate relative expression levels of target genes.
2.8. Functional Verification of Candidate Genes via the BSMV-VIGS Method
2.8.1. Construction of γ-Gene Vector
The approximate 200 bp gene fragment with the PacI (TTAATTAA) and NotI (GCGGCCGC) enzyme locus were used for gene-silenced. Then the vector of γ-gene was obtained.
2.8.2. Linearization and in Vitro Transcription of γ-Gene Vector
MluI was used for the linearization of α and γ plasmids; SpeI was used for the linearization of β plasmid; and BssHII was used for the linearization of γ-PDS and γ-gene plasmids. Then, in vitro transcription was performed using Ribo m7G Cap Analog (Promega), RiboMAX Large Scale RNA Production System-T7 (Promega), and Ribolock RNase Inhibitor (Thermo).
2.8.3. Creation of Transfection Mixture and Virus Infection of Seedlings
The negative control plants used in vitro transcript mixture of α, β, and γ, while the positive control plants used in vitro transcript mixture of α, β, and γ-PDS, and the treatment plants used an in vitro transcript mixture of α, β, and γ-gene. The 247 μL mixture could be used to infect five individuals including 7 μL in vitro transcription product for each vector, 40 μL sterilized 1% DEPC water, and 200 μL GK-Pbufer.
The penultimate leaves and the fully unfolded flag leaves were smeared with above-mentioned mixture. The plants were then placed in a 24–26 °C incubator for dark cultivation for 24 h.
2.8.4. Detection of Silencing Efficiency and Phenotypes
After virus infection, 4–5 spikelets per ear were collected at the binucleate stage for RNA extraction and qPCR analysis. When ears grew to the mature stage, the seed setting rate was calculated as follows: Seed setting rate per ear = number of grains per ear / (effective spikelet number × 2) × 100%.
3. Results
3.1. Genome Sequencing and Chloroplast Assembly
Genomic sequencing was performed on K519A, 519B, and YS3038, and the number of paired-end reads of 150 bp was greater than or equal to 14,716,209 for each sample, and the number of reads was greater than or equal to 14,705,908 (4,406,664,764 clean data) and Q30 was greater than 92.35% for each sample after quality control. The length of the chloroplast genome was about 136 kb, indicating a sequencing coverage of 40×.
3.2. Genome Content and Characteristics
Like the chloroplast genomes of other higher plants, the two chloroplast genomes in this experiment contained two inverted repeats, IRA and IRB, which divided the entire genome into four parts, and the remaining regions were the large single-copy region (LSC) and the small single-copy region (SSC). The total length of the chloroplast genome of K519A was 136,996 bp, and the lengths of the four parts were 81,136 bp (LSC), 12,776 bp (SSC), and 21,542 bp (IRA and IRB) (Figure 2). The total length of the YS3038 was 136,919 and the lengths of the four parts were 81,059 bp (LSC), 12,776 bp (SSC), and 21,542 bp (IRA and IRB) (Figure 3). The total length of 519B was 136,235 bp, and the lengths of the four parts were 80,335 bp (LSC), 12,796 bp (SSC), and 21,552 bp (IRA and IRB) (Figure 4). The GC contents of genomes were 38.27% (K519A), 38.28% (YS3038), and 38.28% (519B), respectively. The structures of the chloroplast genomes of the two male sterile lines and 519B were different, such as the expansion and contraction of the boundaries of the four parts, and the sequence insertion of some regions.
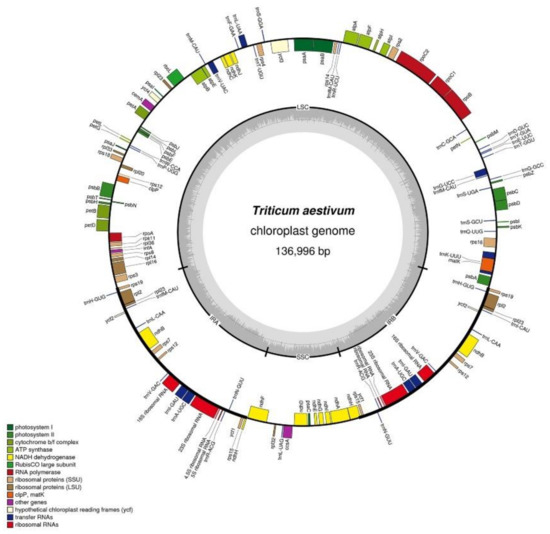
Figure 2.
Annotated map of the chloroplast genome structure in K519A. The transcripts of inside genes are in a clockwise direction, while the transcripts of outside genes are in the opposite direction. Different functional genes are identified with different colors. The gray histogram shows genomic GC content, and the middle gray line is the 50% threshold line.
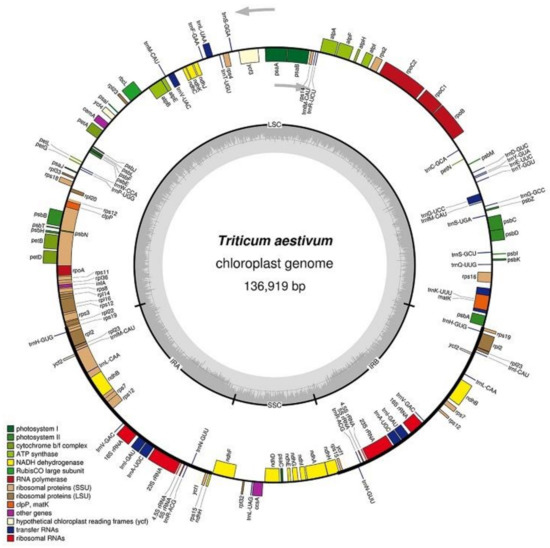
Figure 3.
Annotated map of the chloroplast genome structure of YS3038. The transcripts of inside genes are in a clockwise direction, while the transcripts of outside genes are in the opposite direction. Different functional genes are identified with different colors. The gray histogram shows genomic GC content, and the middle gray line is the 50% threshold line.
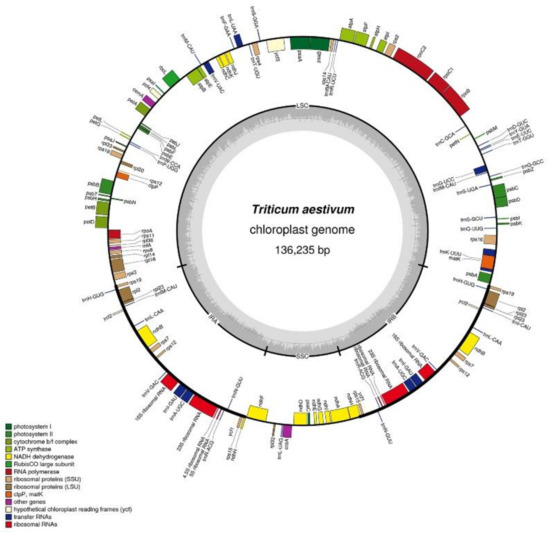
Figure 4.
Annotated map of the chloroplast genome structure in 519B. The transcripts of inside genes are in a clockwise direction, while the transcripts of outside genes are in the opposite direction. Different functional genes are identified with different colors. The gray histogram shows genomic GC content, and the middle gray line is the 50% threshold line.
All chloroplast genomes include 77 protein-coding genes, 4 rRNA genes, and 30 tRNA genes. Based on the functions, chloroplast genes and RNA were mainly divided into three categories: photosynthesis (45), self-replication (58), unknown function (4), and others (4) (Table 1). Of these, there were two copies of the protein-coding genes ndhB, ndhH, rps7, rps15, rps19, ycf1, ycf2, and rpl2. Additionally, there were three copies of rpl23. In the tRNA genes, trnA-UGC, trnH-GUG, trnI-GAU, trnN-GUU, trnR-ACG, and trnV-GAC contained two copies. Additionally, there were three copies of the trnfM-CAU. Besides, the trnL-CAA gene had two copies only in YS3038. The trnA-UGC, trnG-UCC, trnI-GAU, trnK-UUU, trnL-UAA, trnV-UAC, atpF, ndhA, ndhB, petB, petD, rpl2, rpl16, and rps16 contained an intron, and ycf3 contained two introns. Rps12 is a trans-splicing gene.

Table 1.
Gene contents of K519A, YS3038, and 519B chloroplast genomes.
The regions of exons and introns for each gene were predicted, and the codon preferences were analyzed based on the sequence of exons. The codon preferences of K519A and 519B were different. Additionally, the codon preferences of genes in K519 and 519B are shown in Table 2 and Table 3, respectively. Among them, both Met and Trp were encoded by only one codon. Ile and stop codons were encoded by three codons. Ala, Gly, Pro, Thr, and Val were encoded by four codons. Arg, Leu, and Ser were encoded by six codons.
Table 2.
Codon preference analysis of K519A chloroplast genes.
Table 3.
Codon preference analysis of 519B chloroplast genes.
3.3. Discovery of Possible SSRs in K519A and 519B
The SSR markers of chloroplasts have been applied for studies of population genetics, evolution processes, and phylogeny [53,54]. In this study, we found 186 possible SSR repeat motifs in K519A (Table 4) and 188 in 519B (Table 5). In SSRs, the mononucleotide repeats were the most abundant compared to polynucleotide repeats, and the number of A/T repeat motifs was significantly higher than the number of C/G, which was consistent with the results of six legume plastid genomes [55]. In K519A, the proportion of single nucleotide repeat motif was 68.28% and was 67.02% in 519B. The SSR number composed of dinucleotide was 8, of which 6 were AT/TA repeat motifs and 2 were TC in K519A. The SSR number composed of dinucleotide was 9, of which 7 were AT/TA repeat motifs and 2 were TC in 519B. Among the trinucleotides, AAC/TTC most frequently appeared. Additionally, the SSR number of the remaining repeat motif types appeared only once.
Table 4.
Characterization of simple sequence repeats discovered in the K519A chloroplast genome.
Table 5.
Characterization of simple sequence repeats discovered in the 519B chloroplast genome.
3.4. Discovery of Possible Long Repeat Sequences in K519A and 519B
Besides SSR analysis, we also analyzed possible long repeat sequences of the chloroplast genome. Long repeat sequences are special DNA sequences that occur repeatedly in the genome and usually occupy a large proportion in the genome. In general, the proportion of repeat sequences is positively related to the size of the genome. For example, the Arabidopsis thaliana genome is 120 Mb, and the repeat sequences account for 10%. Most repeat sequences accounting for 81% of the wheat genomes (17,000 Mb) exist in the intergenic region, and a small number of repetitive sequences exist in the gene coding region [56]. Repetitive fragments have important molecular significance for plant evolution research [57]. In K519A, a total of 50 possible long repeats were found, and the sizes were 20–286 bp. Of the 50 possible repeats, the positive repeat, palindrome repeats, and inverted replicates were 37, 11, and 2, respectively. The longest repeat was the forward repeat with 286 bp in length. In 519B, a total of 52 possible long repeats were found, the sizes of which were also 20–286 bp, which was consistent with K519A, of which the positive repeat, palindrome repeat, and inverted repeat were 39, 10, and 3, respectively. Most of the long repeats between the two lines are consistent, only a few are inconsistent (Table 6).
Table 6.
Features and positions of long repeat fragments in the K519A and 519B.
3.5. Alignment for Protein-Coding Genes between CS, 519B, K519A, and YS3038
Firstly, the CS was used as a reference sequence to compare the protein-coding genes of 519B, 519A, and YS3038. Compared with CS, 519B has 4 genes with nonsynonymous mutations, 15 genes with synonymous mutations, a total of 28 base mutations, 4 amino acid mutations, 7 deletions, and 2 insertions. There were no base mutations in the protein-encoding genes between K519A and YS3038. Compared with CS, both K519A and 519B have 15 nonsynonymous mutated genes and 27 synonymous mutated genes, including 113 base mutations, 30 amino acid mutations, 8 deletions, and 3 insertions (Table 7). It was concluded that compared with the protein-coding gene of CS, 519B has the least synonymous mutation and nonsynonymous mutation genes, base mutation and amino acid mutation sites, insertions, and deletions, which also indicates that the cytoplasm of 519B belongs to the common wheat cytoplasm.
Table 7.
Alignment analysis of coding genes of CS, K519A, YS3038, and 519B.
A comparative analysis of K519A and 519B revealed that 104 SNPs were identified in the protein-coding sequence in 42 genes (Table 7). Among them, 73 were synonymous mutations, 31 were nonsynonymous mutations from 16 genes (atpB, atpI, ccsA, matK, ndhA, ndhF, ndhH, ndhK, psbB, psbH, rbcL, rpl14, rpl32, rpoB, rpoC2, and rps16), and the proportion of nonsynonymous mutations was 29.8% of the total mutations. Of non-synonymous mutation genes, the NADH dehydrogenase genes are the most, and four genes occur with mutations. The protein-coding gene with the largest difference between K519A and 519B sequences was the rpoC2 gene, and there were 13 SNPs with 5 amino acid differences.
3.6. The Verification of Nonsynonymous Mutant Sites between K519A and 519B by First-Generation Sequencing
To verify the accuracy of second-generation sequencing results, 31 nonsynonymous mutant sites from 16 genes, selected based on the results of the above alignment analysis, were identified via FGS technology. The corresponding primers were listed in Table 8, which were prefixed with FGS. It was concluded that the amino acids of the 16 genes were all consistent under the two methods. Some comparison results were listed in Figure 5.
Table 8.
Primers for first-generation sequencing.
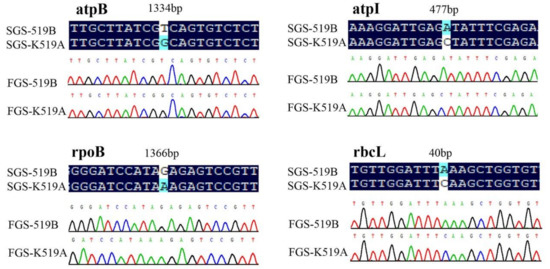
Figure 5.
Verification of gene sequences of nonsynonymous mutated sites. SGS-K519A—second-generation sequencing sequence of K519A. SGS-519B—second-generation sequencing sequence of 519B. FGS-K519A—first-generation sequencing sequence of K519A. FGS-519B—first-generation sequencing sequence of 519B.
3.7. Phylogenetic Analysis of K519A and 519B
The phylogenetic analysis of chloroplast genomes of K519A, 519B, and another 100 species that have near relatives was performed (Figure 6). Bromus vulgaris was used as the outgroup. It was found that the species of the Aegilops genus and the Triticum genus were clustered in the largest number through phylogenetic analysis. Besides, four species of the Amblyopyrum genus were clustered into the Aegilops genus and a Taeniatherum genus cultivar was clustered into the Triticum genus. Then the Secale genus and the Elymus genus were clustered, but a species of the Thinopyrum genus and two species of the Dasypyrum genus were clustered in the Elymus genus. The relationships between the Hordeum genus and Aegilops genus were relatively distant. In the Eremopyrum genus, five other genus species were clustered. It was concluded that the chloroplasts of K519A and 519B were from two independent taxa, the chloroplast of 519B was closely related to the Triticum genus species. However, K519A was closely related to the Ae. kotschyi cultivar and other Aegilops species, which was consistent with the characteristic that K519A’s cytoplasm was derived from Ae. kotschyi.
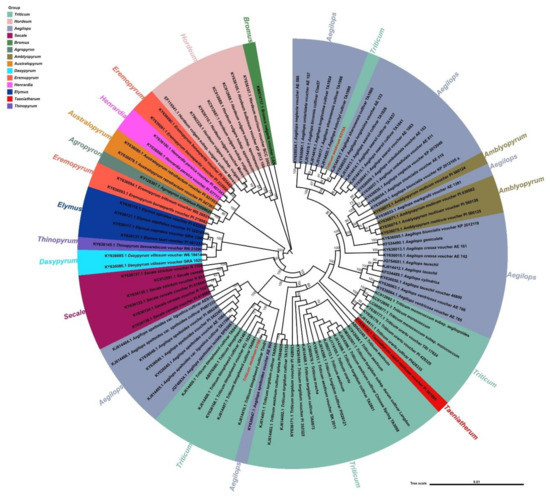
Figure 6.
Phylogeny of chloroplast genomes of proximal species.
3.8. The qPCR of Nonsynonymous Mutation Genes
To further study the effect of nonsynonymous mutant genes in chloroplasts, we performed a qPCR analysis to assess the expression patterns of genes. According to the existing research results, we selected six nonsynonymous mutant genes (atpB, ccsA, matK, rbcL, rpoC2, and ndhH) for analysis of gene expression levels of K519A compared with 519B. The corresponding primers of qPCR are listed in Table 9. The efficiency of the qPCR primers calculated based on standard curve is 95.56–106.72% (Figure 7A).
Table 9.
Primers for the qPCR.
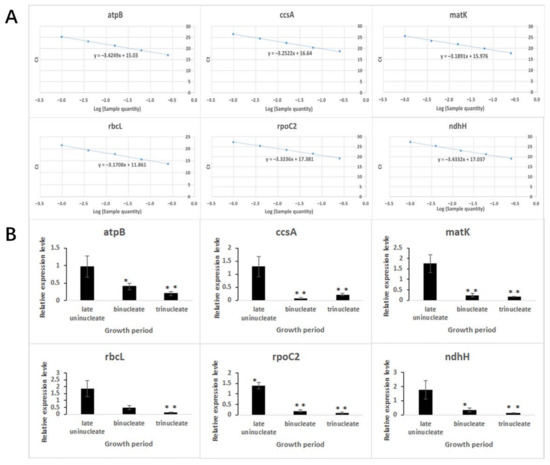
Figure 7.
qPCR analysis for selected non synonymous mutant genes between K519A and 519B. (A) Standard curves of qPCR primers. The abscissa represents the Log (sample quantity). The ordinate represents the Ct values of primers. (B) Relative expression levels of selected non synonymous mutant genes in K519A compared with 519B. The abscissa represents the development period. The ordinate represents the expression level of related genes.
It can be seen from the figures that the expression levels of all genes were downregulated at the binucleate and trinucleate stages, except that the rbcL gene was downregulated only at the trinucleate stage. Additionally, the rpoC2 gene was upregulated at the late uninucleate stage (Figure 7B).
3.9. Function Analysis of Candidate Genes by BSMV-VIGS Method
To further study the relationship between chloroplast genes and fertility, several differentially expressed nonsynonymous mutant genes were selected for barley stripe mosaic virus-induced gene silencing (BSMV-VIGS) in 519B. First, the primers used for gene silenced were designed (Table 10). The recombinant vector was then successfully constructed. Albinism occurred in the leaves after PDS-silencing (positive control) (Figure 8A). It was concluded that the seed setting rate of atpB-silenced plants (20.7%) was significantly reduced compared with the negative control (93.8%). Additionally, the seed setting rate of ndhH-silenced plants (24.5%) was significantly reduced compared with the negative control (93.8%) (Figure 8B) (Table 11). This indicates that atpB and ndhH were likely to participate in the fertility transformation of 519B.
Table 10.
Primers for the BSMV-VIGS of genes and qPCR for silenced individuals.
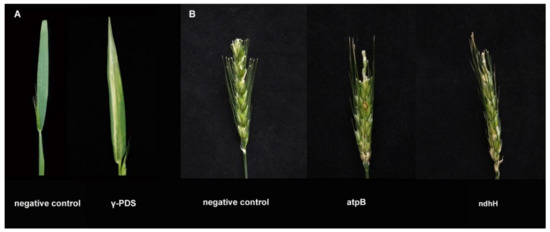
Figure 8.
Phenotypic identification of gene silenced plants. (A) γ-PDS and negative control. (B) γ-gene and negative control.
Table 11.
Seed setting rate of silenced plants.
Several spikelets at the binucleate stage were saved for qPCR. The primers for qPCR were listed in Table 10. Compared with the negative control individuals, the expression of atpB in the gene-silenced individuals was significantly reduced with atpB-qPCR primer, and the expression level was 0.31. After analysis of the reproduction of atpB-silenced fragment with atpB-VIGS primer, it was found that the reproduction efficiency was above 15,914. Compared with the negative control individuals, the expression of ndhH in the gene-silenced individuals was significantly reduced with ndhH-qPCR primer, and the expression level was 0.40. After analysis of the reproduction of ndhH-silenced fragment with ndhH-VIGS primer, it was found that the reproduction efficiency was above 21,283 (Figure 9).
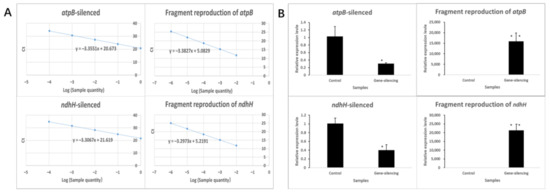
Figure 9.
qPCR analysis of gene-silenced plants. (A) Standard curves of qPCR primers. The abscissa represents the Log (sample quantity). The ordinate represents the Ct values of primers. (B) Relative expression of gene-silenced plants. Values were calculated by the 2−△CT△CT method, with ten biological duplicates and three technical duplicates and the bar represents SE.
4. Discussion
4.1. Plant Chloroplast Genomics Research and Phylogenetic Analysis
The chloroplast genome sequencing technology has developed from the FGS to the current third-generation sequencing [58,59,60]. Currently, most of the chloroplast genome sequences on NCBI are performed by second-generation sequencing technology [61,62]. Due to the fast improvement of sequencing technology, this results in sequencing costs continually decreasing, thus chloroplast genome data is largely supplemented. In the past few decades, chloroplast studies have made a breakthrough. More than 2400 plant chloroplast genomes have been published in the NCBI database. Of which, the chloroplast genome of tobacco is the first genome to be sequenced in higher plants [59]. The chloroplast genome encodes 100–120 genes, including 70–88 protein structural genes, 30–32 tRNA genes, and 4 rRNA genes. According to the functional classification of chloroplast genes, they can be divided into three categories: the first are genes encoding photoreactive structural proteins, such as psaA, psbB, petD, etc. The second are the coding genes of energy metabolism-related enzymes, such as atpA, ndhB, rbcL, and other genes. The third are the encoding genes of the transcriptional translation system, mainly including the ribosome large subunit encoding RPL family, the ribosome small subunit encoding RPS family, the transport RNA encoding TRN family, and transport RNA polymerase encoding RPOA family, and so on. Besides, there are some genes whose functions have not yet been determined, such as the YCF family [63]. Researches have shown that many genes of plant chloroplasts are involved in some important biological processes. For instance, Zhong et al. [64] demonstrated that the chloroplast heat shock protein HSP21 is involved in plastid-encoded RNA polymerase (PEP)-dependent transcription in Arabidopsis. Yu et al. [65] found that the downregulated expression of ribosomal protein S1 (RPS1) in rps1 mutants negatively modulates the expression of heat-responsive gene HsfA2 and its target genes in Arabidopsis.
Our study completed the sequencing of the chloroplast genome of the K-type CMS K519A and maintainer 519B. This is similar to the chloroplast genome structure of most plants, which is a typical four-segment structure. The chloroplast genome of angiosperms belongs to maternal inheritance and is generally not affected by genetic recombination. The chloroplast genome is much smaller than the nuclear genome and there are more copies in normal cells, so the chloroplast genome is easy to obtain. Additionally, the structure and coding genes of the chloroplast genome are relatively conserved [66,67].
4.2. SSR Molecular Marker
Molecular marker technology is to detect the polymorphism of DNA sequences based on PCR, which can directly compare the mutations of DNA sequences. With the continuous improvement of molecular biology technologies, it is becoming increasing mature and is applied in many research directions [68,69]. Among the molecular markers, the SSR marker has high variability, codominant inheritance, easy operation, and easy analysis [70]. It is widely used in genetic mapping construction, gene mapping, genetic diversity analysis, and variety identification of various crops. Stachel et al. [3] successfully analyzed the genetic diversity of 60 wheat cultivated varieties originating from three agro-ecological zones using microsatellite markers. Salameh et al. [71] used a molecular marker to transfer the resistant QTL (Fhb1) on the 5A chromosome into nine European winter wheat lines to develop new scab-resistant lines. Besides, Shim et al. [72] sequenced the whole chloroplast genome of millet and compared it with other reported chloroplast genomes, and obtained 125 SSR loci and 34 indel changes, which can provide effective information for the phylogeny. In our study, there were 186 possible SSR repeat motifs in K519A and 188 possible SSR repeat motifs in 519B. The accuracy of SSR markers and the probability of polymorphism among individuals in a population or among species can only be known when these SSR markers are used for genotyping. Therefore, we will collect some experimental materials for analysis.
4.3. Chloroplast Genes Related to Cytoplasmic Male Sterility
Some nuclear male sterility genes have been identified. For example, Xing et al. [21] cloned the TaAPT2 gene related to thermo-sensitive sterility in wheat, and the gene expression levels of the young anthers, which during the fertility conversion stage, were significantly reduced under the sterile condition by Northern analysis, indicating that the TaAPT2 gene may be related to fertility. Xia et al. [73] confirmed that the male sterile ms2 mutant in wheat was caused by an insertion of terminal-repeat retrotransposons in a miniature (TRIM) element in the promoter region of the Ms2 gene. In addition to this, some studies have shown that the deletion, duplication, or mutation of plant chloroplast DNA may cause the wrong transmission of genetic information between chloroplast, mitochondria and nucleus, leading to male sterility [74,75].
Some studies have found that some chloroplast genes in plants may affect the fertility of plants. For example, the matK gene is located in the intron of the chloroplast trnK gene. Jia et al. [76] extracted DNA of abortive flower buds from the radish male sterile line BT-18 and normal flower buds using DD-PCR technology to study the differential expression of RNA between abortive and normal buds in radish. Additionally, it was found that the matK gene appeared three times in different primers of PCR amplification, and the amplification bands were enhanced in abortive buds, which showed upregulated expression, indicating that the abortion of radish buds had a great relationship with matK gene. Ou et al. [77] studied the intron sequences of ORFs and rps16 genes in chloroplasts of different CMS lines in rice. Additionally, they found that in the gametophyte sterility line, the rps16 gene intron contains a GMTGAG sequence and a unique G at position 595, which can be used as a molecular marker to distinguish sporophytic sterility and gametophyte sterility. In this study, it was found that some genes had nonsynonymous mutant sites between K519A and 519B, and these genes might be related to male sterility.
The RNA polymerase is a key enzyme controlling chloroplast genomic transcription and gene expression. It is encoded by the copy genes rpoA, rpoB, rpoC1, and rpoC2 genes [78]. The α subunit and β subunit of RNA polymerase are encoded by rpoA and rpoB genes, respectively, and the β’ and β” subunit by rpoC1 and rpoC2 genes. Chen et al. [79] found a new chloroplast DNA deletion in the sorghum CMS line, which occurs in the middle of the rpoC2 gene, which may be associated with cytoplasmic male sterility in sorghum. We infer that nonsynonymous mutations of rpoB and rpoC2 genes may affect the production of β and β” subunits of RNA polymerase.
4.4. Phylogenetic Relationship of Important Crops Based on Chloroplast Sequences
In recent years, with the continuous completion of plant chloroplast genome sequencing, phylogenetic researches based on genes or chloroplast genomes have been greatly promoted. Kallersjo et al. [80] utilized the rbcL chloroplast gene to analyze the phylogenetic relationship of 2538 species, covering the prokaryotic cyanobacteria to higher flowering plants, using the parsimony jackknife analysis method. Bruneau et al. [81] analyzed the evolutionary relationship of 223 legume materials by analyzing the introns of the chloroplast trnl gene. Kim [82] sequenced the chloroplast genome of Panax schinseng Nees and analyzed the evolutionary relationship of vascular plants. Liu [83] analyzed and reported the chloroplast genome of Morella rubra and the evolution patterns of Fagales, proving that Myricaceae is a sister to Juglandaceae. By comparing the chloroplast genomes of rice, wheat, and maize, it was found that some hot parts of the genes were susceptible to mutation, and the tandem tRNA region was species-specific. Additionally, gene deletion of the IR region and the boundary characteristics of the IR region indicated that the genetic relationship between rice and wheat is closer than that of maize [84]. Matsuoka et al. [85] studied 106 genes in the chloroplast genome of rice, wheat, and maize, and found that 86.8% of the genes showed the same evolution rate.
In this study, it was found that the chloroplasts of 101 materials from 13 genera were closely related. From the perspective of evolutionary relationship, Hordeum was the first to evolve, followed by Eremopyrum, Henrardia, Australopyrum, Agropyron, Elymus, Thinopyrum, Dasypyrum, Secale, Aegilops speltoides, Triticum, Taeniatherum, Aegilops, and Amblyopyrum. Middleton et al. [69] studied the phylogenetic relationships of the chloroplast genomes of 12 species and found that Hordeum vulgare divided into Secale cereale and wheat approximately 8–9 million years ago. It was consistent with this study. Saarela et al. [86] carried out phylogeny analysis on the chloroplast genomes of Triticinae and found that the differentiation relationship was in the order of Hordeum jubatum, H. vulgare subsp. Vulgare, Connorochloa tenuis, Secale cereal, Taeniatherum caput-medusae, Ae. speltoides var. speltoides, T. timopheevii, T. aestivum, Triticum turgidum, Triticum macha, Triticum monococcum, Triticum urartu, Aegilops tauschii, Aegilops cylindrica, Aegilops geniculate, Aegilops longissima, Aegilops sharonensis, Aegilops bicornis, Ae. kotschyi, and Aegilops searsii. This is almost consistent with the evolutionary relationships we found in the 13 genera. In addition, the Triticum contained hexaploid wheat and four origin species of hexaploid wheat in this study. Additionally, the order of differentiation is T. timopheevii, T. Turgidum, T. urartu and T. monococcum. In comparison with these four genera, the differentiation of T. aestivum is not successively obvious and almost simultaneous. The evolutionary sequence of T. urartu and T. monococcum was just opposite to the results of Saarela et al. [86], which may be due to the close relationship between the two species and the small differences in chloroplast genomes. In addition, previous studies found that the genome donors of hexaploid wheat diverged 2.1–2.9 million years ago [69]. It is not difficult to see from the successful application of next-generation sequencing technology in the acquisition of chloroplast genomic data in recent years that the emergence of this new technology will greatly promote the development of chloroplast phylogenetic analysis, and the phylogenetic research of plants will have a bright prospect [87,88].
5. Conclusions
In this study, we obtained and analyzed the three chloroplast genomes of two male sterile lines and one maintainer line in wheat. Based on a comparative analysis, a total of 104 mutations were found in 42 genes. There were 16 genes with nonsynonymous mutations between K519A and 519B. There were no base mutations in the protein encoding genes between K519A and YS3038. The atpB, ccsA, matK, rbcL, rpoC2, and ndhH genes were mostly downregulated at the binucleate and trinucleate stages. AtpB and ndhH were likely to be involved in the reproductive transformation of 519B. The chloroplast genomes of 519B and K519A were closely related to the Triticum genus and Aegilops genus, respectively.
Author Contributions
L.M. and Q.D. designed and supervised the study and wrote the manuscript; Y.H. and Y.G. planned and performed the experiments, analyzed the data, and wrote the manuscript; Y.L. and X.Z. performed the experiments and analyzed the data; H.Z. analyzed data. All authors have read and agreed to the published version of the manuscript.
Funding
This research was funded by the National Key Research and Development Program of China, grant number 2016YFD0101602. This research was funded by the Scientific Research Foundation of Hebei Normal University of Science and Technology, grant number 2021YB007.
Institutional Review Board Statement
Not applicable.
Informed Consent Statement
Not applicable.
Data Availability Statement
The sequences of mitochondrial genomes have been deposited in the GenBank database at National Center for Biotechnology Information (NCBI) (https://www.ncbi.nlm.nih.gov/genbank/, accessed on 30 November 2021) and can be accessed by the accession numbers MN605257, MN605258, and OL678073 for K519A, 519B, and YS3038, respectively.
Acknowledgments
A preprint has previously been published (https://www.researchsquare.com/article/rs-15231/v1, accessed on 25 November 2021), but the new version is partly newer and contains more content than the preprint version.
Conflicts of Interest
The authors declare no conflict of interest.
Abbreviations
| BSMV-VIGS | Barley stripe mosaic virus-induced gene silencing |
| CMS | Cytoplasmic male sterility |
| GMS | Genic male sterility |
| FGS | First-generation sequencing |
References
- Asseng, S.; Foster, L.; Neil, C.T. The impact of temperature variability on wheat yields. Glob. Change Biol. 2011, 17, 997–1012. [Google Scholar] [CrossRef]
- Hussain, S.S.; Rivandi, A. Molecualr breeding for drought tolerance in plants:wheat perspective. Proc. Pak. Acad. Sci. 2007, 44, 35–62. [Google Scholar]
- Stachel, M.; Lelley, T.; Grausgruber, H.; Vollmann, J. Application of microsatellites in wheat (Triticum aestivum L.) for studying genetic differentiation caused by selection for adaptation and use. Theor. Appl. Genet. 2000, 100, 242–248. [Google Scholar] [CrossRef]
- Day, L.; Augustin, M.A.; Batey, I.L.; Wrigley, C.W. Wheat-gluten uses and industry needs. Trends Food Sci. Technol. 2006, 17, 82–90. [Google Scholar] [CrossRef]
- Li, W.; Liu, S. The relationship among yield structure heterosis of strong heterosis hybrid wheat. J. Triticeae Crops 2002, 22, 1–6. [Google Scholar]
- Wu, L.; Ni, Z.; Wang, Z.; Lin, Z.; Sun, Q. Relationship between differential expression patterns of multigene families and heterosis in a wheat diallel crosses. Acta Genet. Sin. 2001, 28, 256–266. [Google Scholar] [PubMed]
- Kihara, H. Substitution of nucleus and its effects on genome manifestations. Cytologia 1951, 16, 177–193. [Google Scholar] [CrossRef]
- Wilson, J.A.; Ross, W.M. Male sterility interaction of the Triticum aestivum nueleus and Triticum timopheevi cytoplasm. Wheat Inf. Serv. Kyoto Univ. 1962, 14, 14–29. [Google Scholar]
- Wilson, J.A.; Ross, W.M. Crossbreeding in wheat, Triticum aestivum. L. frequensy of the pollen-restoring character in hybrid wheats having Aegilops ovata Cytoplasm1. Crop Sci. 1961, 1, 191–193. [Google Scholar] [CrossRef]
- Zhang, G.; Yang, T. A preliminary on the male sterile lines of wheat with Ae.ventricosa, Ae.kotschyi and Ae.vauiabilis cytoplasms. Crop J. 1989, 15, 1–10. [Google Scholar]
- He, B.; Ning, Y.; Liu, S.; Feng, Y. A preliminary studies on the male sterile system of 1B/1R wheat varieties with Ae.Kotschyi cytoplasm. J. Northwest A F Univ. 1987, 15, 107–109. [Google Scholar]
- Gong, H.; Ma, L.; He, B.; Fan, C.; Wu, H.; Li, W. Changes of RNase and protein content in the fertility sensitive period of wheat male sterile lines. J. Triticeae Crops 2008, 28, 37–40. [Google Scholar]
- Yao, Y.; Zhang, G.; Liu, H.; Wang, J. Correlation between the inner wall of pollen grains of K-type wheat and ATPase activity and male sterility. Acta Bot. Boreali-Occident. Sin. 2002, 22, 333–337. [Google Scholar]
- Zhang, F.; Li, G.; Ding, Q.; Wang, Z.; Ma, X.; Zhang, H.; Zhang, Z.; Jin, F.; Ma, L. Proteome analysis of pollen in the K-type male sterility line 732A and its maintainer 732B in wheat (Triticum aestivum L.) by two-dimensional gel electrophoresis. Acta Physiol. Plant. 2016, 38, 84. [Google Scholar] [CrossRef]
- Yang, W.; Lou, X.; Li, J.; Pu, M.; Mirbahar, A.A.; Liu, D.; Sun, J.; Zhan, K.; He, L.; Zhang, A. Cloning and functional analysis of MADS-box genes, TaAG-A and TaAG-B, from a wheat K-type cytoplasmic male sterile line. Front. Plant Sci. 2017, 8, 1081. [Google Scholar] [CrossRef]
- Downie, S.R.; Jansen, R.K. A comparative analysis of whole plastid genomes from the Apiales: Expansion and contraction of the inverted repeat, mitochondrial to plastid transfer of DNA, and identification of highly divergent noncoding regions. Syst. Bot. 2015, 40, 336–351. [Google Scholar] [CrossRef]
- Sundberg, E.; Slagter, J.G.; Fridborg, I.; Cleary, S.P.; Robinson, C.; Coupland, G. ALBINO3, an Arabidopsis nuclear gene essential for chloroplast differentiation, encodes a chloroplast protein that shows homology to proteins present in bacterial membranes and yeast mitochondria. Plant Cell 1997, 9, 717–730. [Google Scholar]
- Woodson, J.D.; Chory, J. Coordination of gene expression between organellar and nuclear genomes. Nat. Rev. Genet. 2008, 9, 383–395. [Google Scholar] [CrossRef]
- Kenji, O.; Katsuyuki, Y.; Eiji, O.; Yasukazu, N.; Miho, T.; Naoko, N.; Kinya, A.; Kanji, O. Transfer RNA genes in the mitochondrial genome from a liverwort, Marchantia polymorpha: The absence of chloroplast-like tRNAs. Nucleic Acids Res. 1992, 20, 3773–3777. [Google Scholar]
- Tsunewaki, K. Interorganellar DNA transfer in wheat: Dynamics and phylogenetic origin. Proc. Jpn. Acad.B-Phys. 2011, 87, 529–549. [Google Scholar] [CrossRef][Green Version]
- Xing, Q.; Ru, Z.; Li, J.; Zhou, C.; Jin, D.; Sun, Y.; Wang, B. Cloning a second form of adenine phosphoribosyl transferase gene (TaAPT2) from wheat and analysis of its association with thermo-sensitive genic male sterility (TGMS). Plant Sci. 2005, 169, 37–45. [Google Scholar] [CrossRef]
- Timmis, J.N.; Ayliffe, M.A.; Huang, C.Y.; Martin, W. Endosymbiotic gene transfer: Organelle genomes forge eukaryotic chromosomes. Nat. Rev. Genet. 2004, 5, 123–135. [Google Scholar] [CrossRef]
- Lough, A.N.; Roark, L.M.; Kato, A.; Ream, T.S.; Lamb, J.C.; Birchler, J.A.; Newton, K.J. Mitochondrial DNA transfer to the nucleus generates extensive insertion site variation in maize. Genetics 2008, 178, 47–55. [Google Scholar] [CrossRef]
- Shaya, F.; Gaiduk, S.; Keren, I.; Shevtsov, S.; Zemah, H.; Belausov, E.; Evenor, D.; Reuveni, M.; Ostersetzerbiran, O. Expression of mitochondrial gene fragments within the tapetum induce male sterility by limiting the biogenesis of the respiratory machinery in transgenic tobacco. J. Integr. Plant Biol. 2012, 54, 115–130. [Google Scholar] [CrossRef] [PubMed]
- Reddemann, A.; Horn, R. Recombination events involving the atp9 gene are associated with male sterility of CMS PET2 in sunflower. Int. J. Mol. Sci. 2018, 19, 806. [Google Scholar] [CrossRef]
- Naresh, V.; Singh, S.; Watts, A.; Kumar, P.; Kumar, V.; Rao, K.R.S.S.; Bhat, S.R. Mutations in the mitochondrial orf108 render Moricandia arvensis restorer ineffective in restoring male fertility to Brassica oxyrrhina-based cytoplasmic male sterile line of B. juncea. Mol. Breed. 2016, 36, 67. [Google Scholar] [CrossRef]
- Kazama, T.; Itabashi, E.; Fujii, S.; Nakamura, T.; Toriyama, K. Mitochondrial ORF79 levels determine pollen abortion in cytoplasmic male sterile rice. Plant J. 2016, 85, 707–716. [Google Scholar] [CrossRef] [PubMed]
- Ohta, H.; Ogino, A.; Kasai, M.; Sano, Y.; Kanazawa, A. Fertility restoration by Ifr1 in rice with BT-type cytoplasmic male sterility is associated with a reduced level, but not processing, of atp6-orf79 cotranscribed RNA. Plant Cell Rep. 2010, 29, 359–369. [Google Scholar] [CrossRef] [PubMed]
- Chen, L.; Liu, Y. Male sterility and fertility restoration in crops. Annu. Rev. Plant Biol. 2014, 65, 579–606. [Google Scholar] [CrossRef] [PubMed]
- Tang, H.; Zheng, X.; Li, C.; Xie, X.; Chen, Y. Multi-step formation, evolution and functionalization of new cytoplasmic male sterility genes in the plant mitochondrial genomes. Cell Res. 2016, 27, 130–146. [Google Scholar] [CrossRef] [PubMed]
- Charlesworth, D. Origins of rice cytoplasmic male sterility genes. Cell Res. 2017, 27, 3–4. [Google Scholar] [CrossRef][Green Version]
- Kazama, T.; Nakamura, T.; Watanabe, M.; Sugita, M.; Toriyama, K. Suppression mechanism of mitochondrial ORF79 accumulation by Rf1 protein in BT-type cytoplasmic male sterile rice. Plant J. 2008, 55, 619–628. [Google Scholar] [CrossRef]
- Yang, J.H.; Zhang, M.F.; Yu, J.Q. Mitochondrial nad2 gene is co-transcripted with CMS-associated orfB gene in cytoplasmic male-sterile stem mustard (Brassica juncea). Mol. Biol. Rep. 2009, 36, 345–351. [Google Scholar] [CrossRef]
- An, H.; Yang, Z.; Yi, B.; Wen, J.; Shen, J.; Tu, J.; Ma, C.; Fu, T. Comparative transcript profiling of the fertile and sterile flower buds of pol CMS in B. napus. BMC Genom. 2014, 15, 258. [Google Scholar] [CrossRef]
- Dong, X.; Kim, W.K.; Lim, Y.P.; Kim, Y.; Hur, Y. Ogura-CMS in Chinese cabbage (Brassica rapa ssp. pekinensis) causes delayed expression of many nuclear genes. Plant Sci. 2013, 199, 7–17. [Google Scholar]
- Wicke, S.; Schneeweiss, G.M.; de Pamphilis, C.W.; Müller, K.F.; Quandt, D. The evolution of the plastid chromosome in land plants: Gene content, gene order, gene function. Plant Mol. Biol. 2011, 76, 273–297. [Google Scholar] [CrossRef]
- Jansen, R.K.; Raubeson, L.A.; Boore, J.L.; Depamphilis, C.W.; Cui, L. Methods for obtaining and analyzing whole chloroplast genome sequences. Method. Enzymol. 2005, 395, 348–384. [Google Scholar]
- Schaefer, H.; Heibl, C.; Renner, S.S. Gourds afloat: A dated phylogeny reveals an Asian origin of the gourd family (Cucurbitaceae) and numerous oversea dispersal events. Proc. R. Soc. B-Biol. Sci. 2009, 276, 843–851. [Google Scholar] [CrossRef]
- Sajjad, A.; Muhammad, W.; Abdul Latif, K.; Muhammad Aaqil, K.; Sang-Mo, K.; Qari Muhammad, I.; Raheem, S.; Saqib, B.; Byung-Wook, Y.; In-Jung, L. The complete chloroplast genome of wild rice (Oryza minuta) and its comparison to related species. Front. Plant Sci. 2017, 8, 304. [Google Scholar]
- Hu, M.; Chen, Z.; Wang, B. Comparison on leaf ultrastructure in cytoplasmic male sterile line for tuber mustard (Brassica juncea var. tumida). J. Zhejiang Univ. 2001, 27, 535–540. [Google Scholar]
- Li, J.; Li, J. Chloroplast thylakoid membrane peptides and cytoplasmic male sterility. J. Genet. Genom. 1986, 13, 430–436. [Google Scholar]
- Li, J.; Gao, W. Studies on ultrastructure of chloroplast in cytoplasmic male sterile lines and their maintainer lines of rape. J. Genet. Genom. 1983, 10, 280–283. [Google Scholar]
- Chen, Z.; Muthukrishnan, S.; Liang, G.H.; Schertz, K.F.; Hart, G.E. A chloroplast DNA deletion located in RNA polymerase gene rpoC2 in CMS lines of sorghum. Mol. Gen. Genet. MGG 1993, 236, 251–259. [Google Scholar] [CrossRef] [PubMed]
- Li, Z.; Cheng, Y.; Cui, J.; Zhang, P.; Zhao, H.; Hu, S. Comparative transcriptome analysis reveals carbohydrate and lipid metabolism blocks in Brassica napus L. male sterility induced by the chemical hybridization agent monosulfuron ester sodium. BMC Genom. 2015, 16, 206. [Google Scholar] [CrossRef] [PubMed]
- Hahn, C.; Bachmann, L.; Chevreux, B. Reconstructing mitochondrial genomes directly from genomic next-generation sequencing reads—A baiting and iterative mapping approach. Nucleic Acids Res. 2013, 41, e129. [Google Scholar] [CrossRef] [PubMed]
- Anton, B.; Sergey, N.; Dmitry, A.; Gurevich, A.; Mikhail, D.; Kulikov, A.S.; Lesin, V.M.; Nikolenko, S.I.; Pham, S.; Prjibelski, A.D. SPAdes: A new genome assembly algorithm and its applications to single-cell sequencing. J. Comput. Biol. 2012, 19, 455–477. [Google Scholar]
- Liu, C.; Shi, L.; Zhu, Y.; Chen, H.; Zhang, J.; Lin, X.; Guan, X. CpGAVAS, an integrated web server for the annotation, visualization, analysis, and GenBank submission of completely sequenced chloroplast genome sequences. BMC Genom. 2012, 13, 715. [Google Scholar] [CrossRef] [PubMed]
- Rédei, G.P. Encyclopedia of Genetics, Genomics, Proteomics and Informatics; Springer: New York, NY, USA, 2008; Volume 1, p. 1102. [Google Scholar]
- Sakai, H.; Washio, T.; Saito, R.; Shinagawa, A.; Tomita, M. Correlation between sequence conservation of the 5′ untranslated region and codon usage bias in Mus musculus genes. Gene 2001, 276, 101–105. [Google Scholar] [CrossRef]
- Thiel, T.; Michalek, W.; Varshney, R.; Graner, A. Exploiting EST databases for the development and characterization of gene-derived SSR-markers in barley (Hordeum vulgare L.). Theor. Appl. Genet. 2003, 106, 411–422. [Google Scholar] [CrossRef]
- Kurtz, S.; Schleiermacher, C. REPuter: Fast computation of maximal repeats in complete genomes. Bioinformatics 1999, 15, 426–427. [Google Scholar] [CrossRef]
- Tamura, K.; Dudley, J.T.; Nei, M.; Kumar, S. MEGA4: Molecular evolutionary genetics analysis (MEGA) software version 4.0. Mol. Biol. Evol. 2007, 24, 1596–1599. [Google Scholar] [CrossRef]
- Chung, S.M.; Staub, J.E.; Chen, J.F. Molecular phylogeny of Cucumis species as revealed by consensus chloroplast SSR marker length and sequence variation. Genome 2006, 49, 219–229. [Google Scholar] [CrossRef]
- Vieira, L.D.N.; Helisson, F.; Marcelo, R.; de Freitas Fraga, H.P.; Alves, C.R.L.; de Souza, M.E.; Pedrosa, F.d.O.; Onofre, N.R.; Pedro, G.M.; Gertrud, M.U. The complete chloroplast genome sequence of Podocarpus Lambertii: Genome structure, evolutionary aspects, gene content and SSR detection. PLoS ONE 2014, 9, e90618. [Google Scholar] [CrossRef]
- Cai, Z.; Guisinger, M.; Kim, H.; Ruck, E.; Blazier, J.C.; McMurtry, V.; Kuehl, J.V.; Boore, J.; Jansen, R.K. Extensive reorganization of the plastid genome of Trifolium subterraneum (Fabaceae) is associated with numerous repeated sequences and novel DNA insertions. J. Mol. Evol. 2008, 67, 696–704. [Google Scholar] [CrossRef]
- Biscotti, M.A.; Canapa, A.; Forconi, M.; Olmo, E.; Barucca, M. Transcription of tandemly repetitive DNA: Functional roles. Chromosome Res. 2015, 23, 463–477. [Google Scholar] [CrossRef]
- Cavalier-Smith, T. Chloroplast evolution: Secondary symbiogenesis and multiple losses. Curr. Biol. 2002, 12, R62–R64. [Google Scholar] [CrossRef]
- Shimda, H.; Sugiuro, M. Fine structural features of the chloroplast genome: Comparison of the sequenced chloroplast genomes. Nucleic Acids Res. 1991, 19, 983–995. [Google Scholar] [CrossRef]
- Shinozaki, K.; Ohme, M.; Tanaka, M.; Wakasugi, T.; Hayashida, N.; Matsubayashi, T.; Zaita, N.; Chunwongse, J.; Obokata, J.; Yamaguchishinozaki, K. The complete nucleotide sequence of the tobacco chloroplast genome: Its gene organization and expression. Plant Mol. Biol. Report. 1986, 5, 2043–2049. [Google Scholar] [CrossRef]
- Zhao, Y.; Yin, J.; Guo, H.; Zhang, Y.; Xiao, W.; Sun, C.; Wu, J.; Qu, X.; Yu, J.; Wang, X. The complete chloroplast genome provides insight into the evolution and polymorphism of Panax ginseng. Front. Plant Sci. 2015, 5, 696. [Google Scholar] [CrossRef]
- Alkan, C.; Sajjadian, S.; Eichler, E.E. Limitations of next-generation genome sequence assembly. Nat. Methods 2010, 8, 61–65. [Google Scholar] [CrossRef]
- Huang, H.; Shi, C.; Liu, Y.; Mao, S.; Gao, L. Thirteen Camellia chloroplast genome sequences determined by high-throughput sequencing: Genome structure and phylogenetic relationships. BMC Evol. Biol. 2014, 14, 151. [Google Scholar] [CrossRef] [PubMed]
- Margulies, M.; Egholm, M.; Altman, W.E.; Attiya, S.; Bader, J.S.; Bemben, L.A.; Berka, J.; Braverman, M.S.; Chen, Y.; Chen, Z. Genome sequencing in microfabricated high-density picolitre reactors. Nature 2005, 437, 376–380. [Google Scholar] [CrossRef]
- Zhong, L.; Zhou, W.; Wang, H.; Ding, S.; Lu, Q.; Wen, X.; Peng, L.; Zhang, L.; Lu, C. Chloroplast small heat shock protein HSP21 interacts with plastid nucleoid protein pTAC5 and is essential for chloroplast development in Arabidopsis under heat stress. Plant Cell 2013, 25, 2925–2943. [Google Scholar] [CrossRef] [PubMed]
- Yu, H.; Yang, X.; Chen, S.; Wang, Y.; Li, J.; Shen, Q.; Liu, X.; Guo, F.; Qu, L. Downregulation of chloroplast RPS1 negatively modulates nuclear heat-responsive expression of HsfA2 and its target genes in Arabidopsis. PLoS Genet. 2012, 8, e1002669. [Google Scholar] [CrossRef] [PubMed]
- Ueda, M.; Fujimoto, M.; Arimura, S.-I.; Murata, J.; Tsutsumi, N.; Kadowaki, K.I. Loss of the rpl32 gene from the chloroplast genome and subsequent acquisition of a preexisting transit peptide within the nuclear gene in Populus. Gene 2007, 402, 51–56. [Google Scholar] [CrossRef] [PubMed]
- Haberle, R.C.; Fourcade, H.M.; Boore, J.L.; Jansen, R.K. Extensive rearrangements in the chloroplast genome of Trachelium caeruleum are associated with repeats and tRNA genes. J. Mol. Evol. 2008, 66, 350–361. [Google Scholar] [CrossRef]
- Korlach, J.; Bjornson, K.P.; Chaudhuri, B.P.; Cicero, R.L.; Flusberg, B.A.; Gray, J.J.; Holden, D.; Saxena, R.; Wegener, J.L.; Turner, S.W. Chapter 20—Real-Time DNA sequencing from single polymerase molecules. Science 2009, 323, 133–138. [Google Scholar]
- Middleton, C.P.; Senerchia, N.; Stein, N.; Akhunov, E.D.; Keller, B.; Wicker, T.; Kilian, B. Sequencing of chloroplast genomes from wheat, barley, rye and their relatives provides a detailed insight into the evolution of the Triticeae tribe. PLoS ONE 2014, 9, e85761. [Google Scholar] [CrossRef]
- Braslavsky, I.; Hebert, B.; Kartalov, E.P.; Quake, S.R. Sequence information can be obtained from single DNA molecules. Proc. Natl. Acad. Sci. USA 2003, 100, 3960–3964. [Google Scholar] [CrossRef]
- Salameh, A.; Buerstmayr, M.; Steiner, B.; Neumayer, A.; Lemmens, M.; Buerstmayr, H. Effects of introgression of two QTL for fusarium head blight resistance from Asian spring wheat by marker-assisted backcrossing into European winter wheat on fusarium head blight resistance, yield and quality traits. Mol. Breed. 2011, 28, 485–494. [Google Scholar] [CrossRef]
- Shim, D.; Raveendar, S.; Lee, J.; Lee, G.; Ro, N.; Jeon, Y.; Cho, G.; Lee, H.; Ma, K.; Chung, J. The complete chloroplast genome of Capsicum Frutescens (Solanaceae). Appl. Plant Sci. 2016, 4, 1600002. [Google Scholar] [CrossRef]
- Xia, C.; Zhang, L.; Zou, C.; Gu, Y.; Duan, J.; Zhao, G.; Wu, J.; Liu, Y.; Fang, X.; Gao, L. A TRIM insertion in the promoter of Ms2 causes male sterility in wheat. Nat. Commun. 2017, 8, 15407. [Google Scholar] [CrossRef]
- Chen, K.; Meyer, V.G. Mutation in chloroplast DNA coding for the large subunit of fraction 1 protein correlated with male sterility in cotton. J. Hered. 1979, 70, 431–433. [Google Scholar] [CrossRef]
- Von Kohn, C.; Kielkowska, A.; Havey, M.J. Sequencing and annotation of the chloroplast DNAs and identification of polymorphisms distinguishing normal male-fertile and male-sterile cytoplasms of onion. Genome 2013, 56, 737–742. [Google Scholar] [CrossRef]
- Jia, J.; Zhang, L.G. mRNA differential display and EST sequence analysis of aborted bud and normal bud in radish (Raphanus sativus). J. Nucl. Agric. Sci. 2008, 22, 426–431. [Google Scholar]
- Ou, L.J.; Huang, G.W.; Li, W.J.; Kang, G.P.; Chen, J.L.; Luan, S.; Chen, L.B. Chloroplast DNA polymorphism in different types of cytoplasmic male sterile rice. Biol. Plant. 2009, 53, 593–596. [Google Scholar] [CrossRef]
- Little, M.C.; Hallick, R.B. Chloroplast rpoA, rpoB, and rpoC genes specify at least three components of a chloroplast DNA-dependent RNA polymerase active in tRNA and mRNA transcription. J. Biol. Chem. 1988, 263, 14302–14307. [Google Scholar] [CrossRef]
- Chen, Z.; Schertz, K.F.; Mullet, J.E.; Dubell, A.; Hart, G.E. Characterization and expression of rpoC2 in CMS and fertile lines of sorghum. Plant Mol. Biol. 1995, 28, 799–809. [Google Scholar] [CrossRef]
- Källersjö, M.; Farris, J.S.; Chase, M.W.; Bremer, B.; Fay, M.F.; Humphries, C.J.; Petersen, G.; Seberg, O.; Bremer, K. Simultaneous parsimony jackknife analysis of 2538 rbcL DNA sequences reveals support for major clades of green plants, land plants, seed plants and flowering plants. Plant Syst. Evol. 1998, 213, 259–287. [Google Scholar] [CrossRef]
- Bruneau, A.; Forest, F.; Herendeen, P.S.; Klitgaard, B.B.; Lewis, G.P. Phylogenetic relationships in the Caesalpinioideae (Leguminosae) as inferred from chloroplast trnL intron sequences. Syst. Bot. 2001, 26, 487–514. [Google Scholar]
- Kim, K.J.; Lee, H.L. Complete chloroplast genome wequences from Korean Ginseng (Panax schinseng Nees) and comparative analysis of sequence evolution among 17 Vascular plants. DNA Res. 2004, 11, 247–261. [Google Scholar] [CrossRef] [PubMed]
- Liu, L.X.; Li, R.; Worth, J.R.P.; Li, X.; Li, P.; Cameron, K.M.; Fu, C.X. The complete chloroplast genome of chinese bayberry (Morella rubra, Myricaceae): Implications for understanding the evolution of Fagales. Front. Plant Sci. 2017, 8, 968. [Google Scholar] [CrossRef] [PubMed]
- Saski, C.A.; Lee, S.B.; Fjellheim, S.; Guda, C.; Jansen, R.K.; Luo, H.; Tomkins, J.P.; Rognli, O.A.; Daniell, H.; Clarke, J.L. Complete chloroplast genome sequences of Hordeum vulgare, Sorghum bicolor and Agrostis stolonifera, and comparative analyses with other grass genomes. Theor. Appl. Genet. 2007, 115, 571–590. [Google Scholar] [CrossRef] [PubMed]
- Matsuoka, Y.; Yamazaki, Y.; Ogihara, Y.; Tsunewaki, K. Whole chloroplast genome comparison of rice, maize, and wheat: Implications for chloroplast gene diversification and phylogeny of cereals. Mol. Biol. Evol. 2002, 19, 2084–2091. [Google Scholar] [CrossRef][Green Version]
- Saarela, J.M.; Burke, S.V.; Wysocki, W.P.; Barrett, M.D.; Clark, L.G.; Craine, J.M.; Peterson, P.M.; Soreng, R.J.; Vorontsova, M.S.; Duvall, M.R. A 250 plastome phylogeny of the grass family (Poaceae): Topological support under different data partitions. PeerJ 2018, 6, e4299. [Google Scholar] [CrossRef]
- Hollingsworth, P.M.; Graham, S.W.; Little, D.P.; Steinke, D. Choosing and using a plant DNA barcode. PLoS ONE 2011, 6, e19254. [Google Scholar] [CrossRef]
- Lima, M.S.; Woods, L.C.; Cartwright, M.W.; Smith, D.R. The (in)complete organelle genome: Exploring the use and non-use of available technologies for characterizing mitochondrial and plastid chromosomes. Mol. Ecol. Resour. 2016, 16, 1279–1286. [Google Scholar] [CrossRef]


Publisher’s Note: MDPI stays neutral with regard to jurisdictional claims in published maps and institutional affiliations. |
© 2022 by the authors. Licensee MDPI, Basel, Switzerland. This article is an open access article distributed under the terms and conditions of the Creative Commons Attribution (CC BY) license (https://creativecommons.org/licenses/by/4.0/).