Abstract
Background: To date, nearly 300 single-nucleotide polymorphisms (SNPs) associated with BMI, waist-to-hip ratio, and other adiposity traits have been identified by GWAS. With regards to IL10, at least 49 IL10-associated polymorphisms have been reported. However, little is known regarding the relationship between SNPs of the IL10 gene and the risk of obesity in young men. The aim of the present study was to investigate the relationship between SNPs of the IL10 and IL10RB genes and the risk of obesity in young men. Methods: A cohort of 139 male students were enrolled and the following IL10 and IL10RB SNPs were analyzed: IL10 (rs1518110), IL10 (rs3024491), IL10RB (rs2834167). The subjects were divided into groups depending on obesity parameters: body mass index (BMI), fat mass index (FMI) and fat percentage (Fat%). Statistical analysis was conducted for a single locus and haplotypes, an association between SNPs and body composition parameters was tested with four genetic models: dominant, recessive, codominant and overdominant mode of inheritance (MOI). Results: Significant association was found for interaction IL10 (rs1518110) × IL10RB (rs2834167) with Fat% value exceeding 20 in codominant (p-value = 0.03, OR = 0.34, 95% CI 0.08 1.44) and dominant model (p-value = 0.03, OR = 0.34, 95% CI 0.08 1.44) Conclusion: Our study shows for the first time that there is a correlation between the occurrence of specific polymorphisms of IL10 gene (rs1518110, rs3024491 and rs2834167) and the possibility of obesity.
1. Introduction
In recent years, in the majority of fully developed countries of the world, a constant and noticeable increase in the frequency of the occurrence of overweight and obesity has been observed. According to the American Heart Association, obesity is the cause of many adverse changes in the body that are directly proportional to health disorder development [1,2].
Obesity is often associated with chronic low-grade inflammation. Inflammation is a physiological response necessary to restore homeostasis altered by diverse stimuli. However, excessive inflammatory signals might have deleterious effects. Such triggers also occur in obesity. Faloia et al. particularly emphasized that inflammation-associated intracellular signalling pathways linking inflammation and obesity exist. Indeed, studies in mice and humans have shown that nutrients consumption might acutely evoke inflammatory responses. It is believed that the inciting signal of inflammation is overfeeding. This initiates a cascade of signalling pathways [3].
Obesity is a pro-inflammatory condition in which hypertrophied adipocytes and adipose tissue-resident immune cells (primarily lymphocytes and macrophages) both contribute to increased circulating levels of pro-inflammatory cytokines [4].
Adipose tissue in lean conditions releases anti-inflammatory adipokines such as adiponectin, also transforming growth factor β (TGFβ), interleukin (IL) 10, IL4, IL13, IL1 receptor antagonist (IL1RA), and apelin. Compared with lean individuals, obese adipose tissue mainly secretes pro-inflammatory cytokines, i.e., TNFα, IL6, leptin, visfatin, resistin, angiotensin II, and plasminogen activator inhibitor 1 [5]. It has been previously demonstrated that circulating levels of anti-inflammatory cytokine, IL10 are elevated in obese patients [6,7,8] while low IL10 levels are associated with the metabolic syndrome [6]. This is in line with another human study which also indicated the highest level of IL10 in the overweight group of objects, compared to non-obese and overweight individuals [9]. However, contradictory findings regarding the cytokine levels exist [10]. There is also some evidence that low IL10 is not associated with the metabolic syndrome [7].
Our understanding of obesity has been also based on genetic studies. Genes can influence the development of obesity. From this point of view, obesity can be considered in three broad categories. First-monogenic obesity, when a single gene is affected; second- obesity is only one of the symptoms of congenital genetic disorders; and third-polygenic, caused by the presence of genetic polymorphisms in several genes. The pace of gene discovery for obesity accelerated with an approach that screens whole genomes for associations between genetic variants and a phenotype of interest; namely genome-wide association studies (GWAS). To date, GWAS for BMI, waist-to-hip ratio, and other adiposity traits have recognised nearly 300 single-nucleotide polymorphisms (SNPs). Therefore, there is a reason to hope that these discoveries will eventually lead to new preventive measures and therapeutic agents to target obesity [11]. With regards to IL10, at least 49 IL10-associated polymorphisms have been reported. In addition, a larger number of polymorphisms has been recorded in single nucleotide polymorphism (SNP) databases [12]. One hypothesis claims that some populations may be genetically susceptible to increased fat storage, which may be beneficial for the periods of starvation, but in developed societies results rather in obesity and diabetes mellitus type 2 [13]. Many candidate genes and polymorphisms have been considered, including variants of the IL10 genes, involved in inflammatory process and many other mechanisms related to the development of overweight and obesity [14,15].
Until now, the relationship between some polymorphisms in the genes encoding Il1, IL6, IL18RAP and overweight or obesity has been described [16,17,18]. However, little is known regarding the relationship between SNPs of the IL10 gene and the risk of overweight and obesity in young men. The aim of the present study was to investigate the relationship between SNPs of the IL10 gene (rs1518110, rs3024491, rs2834167) and the risk of overweight in young men.
2. Materials and Methods
2.1. Ethics Committee
All participants were recruited from the group of cadets of the Military University in Warsaw. Before the study, volunteers were acquainted with the research methods and protocol. All participants were given an information sheet concerning the study and a consent form, providing all crucial information (purpose, procedures, risks, and benefits of participation in the study). All subjects gave their informed consent to participate. The research was conducted in accordance with the Declaration of Helsinki. The protocol was also approved by the Ethics Committee of the Military Institute of Hygiene and Epidemiology-resolution number 07/2018 issued on 23 February 2018.
2.2. Participants
The study included 139 male volunteers aged 19–29 years old. Participants filled out the questionnaire screening for exclusion criteria including past diseases, related injuries and ailments, and the presence of severe and chronic pain of any organ or system, both in the past and currently. General medical examinations were conducted (including electrocardiography (ECG) testing) to confirm good health. The subjects were homogeneous in terms of sex, age, food intake and physical activity. Military students examined ate their meals at the student cafeteria and their physical fitness is essential for their profession. Military University students must pass a fitness test, which is an obligatory test performed once a year to evaluate the physical condition of Polish Army soldiers.
2.3. Anthropometric Measurements and Body Composition
Anthropometric measurements and body composition were obtained using standard methods. Height was measured using a portable stadiometer with a precision of 0.1 cm (TANITA HR-001, Tanita Corporation, Japan). Body composition and mass analysis measurements were performed using the TANITA MC-780 analyzer (Tanita Corporation, Japan) according to the procedure specified in the instruction manual. The assessment of BMI values was made in accordance with the criteria set out by WHO (WHO 2000).
Three analyses were conducted. In each of them, all participants (n = 139) were divided into two groups: OVER and CONTROL depending on their BMI, FMI and Fat% value (Table 1). The overweight group OVERBMI consisted of people with BMI value ≥ 25.0, while the control group CONBMI consisted of people with BMI lower than 25.0 (CDE 2011). The following formula was used to determine the BMI value: body mass index (BMI) = body weight/height2 (kg/m2). The experimental group OVERFMI consisted of people with a fat mass index higher than 6, while the people in the CONFMI group had FMI values ≤ 6. The FMI classification scale was introduced by Kelly et al. [16]. The following formula was used in order to calculate the FMI values: fat mass index (FMI) = fat mass/height2 (kg/m2).

Table 1.
Anthropometry and body composition of the subjects for BMI, FMI and Fat%.
Subjects with fat percentage over 20% were grouped into OVERFat, while the participants with Fat% ≤ 20% were classified into the CONFat group [19,20].
2.4. Genetic Analyses
COPAN swabs were used to collect the subjects’ buccal cells. A High Pure PCR Template Preparation Kit (Roche Diagnostics, Germany) was used to extract Genomic DNA from buccal cells. The extraction was conducted in accordance to the manufacturer’s instructions. Good quantity and quality DNA samples were stored at −20 °C for further analysis. All samples were genotyped using TaqMan® Pre-Designed SNP Genotyping Assays for IL10 (rs1518110) C___8828802_20, IL10 (rs3024491) C__15983669_10, IL10RB (rs2834167) C__25473700_10 single-nucleotide polymorphisms (SNPs) (Applied Biosystems, USA) on a CFX Connect Real-Time PCR Detection System (BioRad, USA) according to the manufacturer’s instructions and recommendations. The PCR protocol was as follows: 5 min of initial denaturation (95 °C), 40 cycles of denaturation (15 s, 95 °C) and annealing/extension (60 s, 60 °C).
2.5. Statistical Analyses
All statistical analyses were conducted using R program with specific R packages (version 2.0-1, The R Foundation for Statistical Computing; https://cran.r-project.org accessed on 12 July 2021). Genotype and allele frequency distributions, in addition to HWE probabilities were calculated with SNPassoc package. Single locus analysis including SNP × SNP interaction was also calculated with SNPassoc package under four genetic models (codominant, dominant, recessive and overdominant). The influence of single alleles on BMI, Fat% and FMI was conducted with PearsonX2 test using STAT.package. The haplo.score function from haplo.stats package was used to investigate the association between haplotype combinations and BMI, Fat% and FMI under three different models (additive, dominant and recessive). The level of statistical significance was set at the level of p < 0.05.
3. Results
The results of the anthropometric analysis and the body composition of the studied groups are presented in Table 1.
Amongst parameters such as age, height, weight, metabolic age, visceral tissue index, Fat (kg), FFM, FFMI, water%, BMI, FMI, Fat% according to the t-test, highly significant differences were found with p-value between 0.00 and 0.01 for OVERBMI and CONBMI groups, CONFMI and OVERFMI, CONfat and OVERfat simultaneously there were no statistically significant differences found for age and height (p-value = 0.12 and 0.49 for BMI partition, p-value = 0.07 and 0.16 for FMI partition and p-value = 0.27 and 0.42 for Fat mass % partition) for the same groups.
A summary of SNPs for IL10 and IL10RB is provided in Table 2, including genetic variation, chromosomal position and gene location [21,22,23].
Table 2.
The characteristics of single nucleotide polymorphisms for IL10 and IL10RB genes.
All genotype frequencies did not significantly differ from the Hardy-Weinberg equilibrium expectations in the OVERBMI group (p-values range 0.48 to 1.00), CONBMI group (p-values range 0.53 to 0.80), OVERFat group (0.13 to 0.61), CONFat (0.58 to 1.00), OVERFMI (p-values range 0.13 to 1), CONFMI (p-values range 0.38 to 0.83) as well as the case-control group (p-values range 0.31 to 1.0) (Table 3).
Table 3.
The genotype frequencies from Hardy-Weinberg expectations and minor allele frequencies (MAF).
The influence of IL10 polymorphism on body mass and composition was tested in recessive, dominant, codominant and overdominant models. No significant association was found between IL10 (rs1518110), IL10 (rs3024491), IL10RB (rs2834167) and the BMI value exceeding 25 (Table 4, Table 5 andTable 6), Fat% exceeding 20 and FMI value exceeding 6.
Table 4.
Association analysis of the IL10 rs3024491 polymorphism with BMI.
Table 5.
Association analysis of the IL10 rs1518110 polymorphism with BMI.
Table 6.
Association analysis of the IL10RB rs2834167 polymorphism with BMI.
For IL10 (rs1518110) × IL10 (rs3024491) influence on BMI, Fat% and FMI haplotype analysis was made. Only haplotypes with frequency over 5% was considered. Most common haplotype was CC (0.28%, IL10 (rs1518110) A > C, IL10 (rs3024491) C > A). No significantly association was found in haplotype IL10 (rs1518110-rs3024491) with the BMI, Fat%, FMI in additive, dominant, recessive models (Table 7).
Table 7.
Haplotype-based association of IL10 rs3024491 and IL10 rs1518110 with BMI, Fat%, FMI.
Gen-Gen interactions were calculated for the same genetic models as for single gene analysis (except overdominant model). No association was found between the SNP-SNP interaction with BMI and FMI values for cases (IL10 (rs1518110) × IL10RB (rs2834167), IL10 (rs3024491) × IL10RB (rs2834167)). Significant association was found for interaction IL10 (rs1518110) × IL10RB (rs2834167) with Fat% value exceeding 20 in codominant (p value = 0.03, OR = 0.34, 95% CI 0.08 1.44) (Table 8) and dominant model (p-value = 0.03, OR = 0.34, 95% CI 0.08 1.44) (Table 9).
Table 8.
Association analysis of the IL10RB rs2834167 × IL10 rs1518110 interaction with Fat% (codominant model).
Table 9.
Association analysis of the IL10RB rs2834167 × IL10 rs1518110 interaction with Fat% (dominant model).
The prevalence of A/G × A/A is almost three times less than A/A × A/A (IL10RB × IL10) and two times less for the A/G × A/C than for A/A × A/C (IL10RB × IL10) in OVER FAT group in codominant model. In the same group alleles arrangement, A/G × A/A was almost three times less than for A/A × A/A (IL10RB × IL10) and one and a half times less for the A/G × A/C − C/C than for the A/A × A/C − C/C (IL10RB × IL10) in dominant model.
Table 10 and Figure 1 below present frequency of genotypes IL10 (rs1518110) and IL10RB (rs2834167) in Fat% groups.
Table 10.
Percentage of genotype IL10 (rs1518110) and IL10RB (rs2834167) with Fat%.
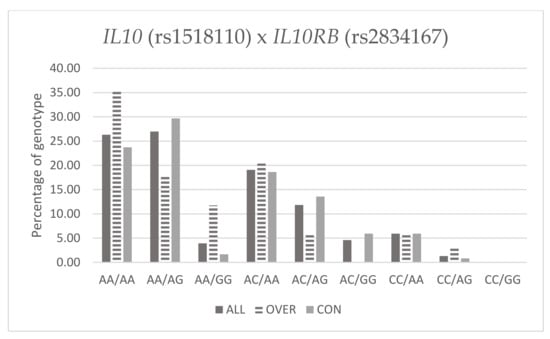
Figure 1.
Percentage of genotype IL10 (rs1518110) and IL10RB (rs2834167) with Fat%.
4. Discussion
Our study shows for the first time that there is a correlation between the occurrence of specific polymorphisms of IL10 and IL10RB genes (rs1518110, rs3024491 and rs2834167, respectively) and the possibility of being overweight.
Recent investigations indicate that obesity increases a state of chronic, low-grade inflammation. There is significant interest in the role of adipose tissue macrophages (ATMs) in the inflammatory changes characteristic of obesity. Macrophages show significant heterogeneity in function, depending on local environmental factors that shape their properties and activation state [24]. M1 or “classically activated” macrophages are induced by pro-inflammatory mediators such as LPS and IFNγ. Their activation leads to enhanced pro-inflammatory cytokine production (TNFα, IL6, and IL12) and reactive oxygen species such as NO [19]. M2 or “alternatively activated” have low pro-inflammatory cytokine expression and instead generate high levels of anti-inflammatory cytokines IL10 and IL1 decoy receptor. One of the markers of M2 is the anti-inflammatory cytokine IL10, which is overexpressed in ATMs from lean compared with obese mice [24,25,26].
Some of the studies indicate polymorphisms in IL10 and IL10RB genes as associated with obesity. In our study, significant association was found for interaction IL10 (rs1518110) × IL10RB (rs2834167) with Fat% value exceeding 20 in codominant (p value = 0.03, OR = 0.34, 95% CI 0.08 1.44) and dominant model (p-value = 0.03, OR = 0.34, 95% CI 0.08 1.44).
We have shown that the chance of being OVERFat for the A/G × A/A was almost three times lower than for A/A × A/A (IL10RB × IL10) and two times lower for the A/G × A/C than for A/A × A/C (IL10RB × IL10).
In addition, it was shown that the chance of being OVERFat for the A/GxA/A system was almost three times lower than for A/A × A/A (IL10RB × IL10) and one and a half times lower for the A/G × A/CC/C than for A/A × A/CC/C (IL10RB × IL10). Our results show a relationship between the frequency of the IL10 and IL10RB genotypes patterns and increased body fat. These results are consistent with hypothesis of inflammation and macrophage recruitment, in which the decrease of inflammatory signals in adipose tissue are caused by retaining M2 macrophages or by converting M1 macrophages to M2. IL10 may be involved in this mechanism as chronic IL10 secretion can suppress classically activated M1 macrophages [24].
In our study we demonstrated correlation between body Fat% and specific IL10 genotype combination. Unfortunately this did not translate into association between those genotypes and BMI. An association of IL10 with obesity is reported mainly in correlation with ATM and inflammatory balance. Lean adipose tissue is rich in type 2 macrophages and anti-inflammatory cytokines such as IL10, obesity changes the balance in favour of a pro-inflammatory milieu, which can lead to the development of insulin resistance and the dysregulation of systemic metabolism. Our result demonstrates unfavourable genotype combination that leads to increase body fat content [27].
Reported results regarding the relationship between IL10 and obesity are conflicting. Esposito et al. [6] demonstrated that circulating IL10 levels were significantly higher in obese (n = 50) than in lean women (median 2.45 vs. 1.2 pg/mL; p = 0.04). Increased IL10 mRNA was found in human subcutaneous adipose tissue from obese patients compared to lean subjects [6]. Opposite results were described by Manigrasso et al., where circulating IL10 concentration was significantly decreased in obese women (median 1.8 vs. 3.5 vs. 4.1 pg/mL, p < 0.0001 in women with android obesity vs. gynoid obesity vs. non-obese women) [10]. No significant change in median IL10 levels has been observed after body weight reduction or after a physical training program [10,28].
Scarpelli et al. demonstrated that polymorphisms in the IL-10 promoter associated with low IL-10 expression are correlated with increased obesity and insulin resistance [29]. Moreover, in obese humans and rodents, adipocytes are significant sources of IL-10 in obesity. Increased levels of pro-inflammatory cytokines are reported in obesity and this observation is consistent with the hypothesis that a balance exists between pro-inflammatory and anti-inflammatory factors in adipocytes regulating their function [30]. IL10 rs1518110 and rs3024491 are non-coding variants localized in introns 1 an2 respectively, with no clinical significance, but as we mention in introduction, they may represent a large part of the loci variation due to linkage disequilibrium with other gene polymorphisms [21] IL10RB gene encodes IL10R2, that is a one of component of IL10 receptor complex, involved in ligand-mediated assembly inducing activation of STAT3 and STAT3-responsive genes. Associations between IL10RB polymorphism and several diseases have been reported [31]. Frodsham et al. identified IL10RB as a major susceptibility locus for hepatitis B virus (HBV) persistence, and demonstrated rs2834167 as associated with a risk of HBV persistence [32]. Data indicates IL10RB rs2834167 is also associated with Inflammatory Bowel Disease [33] and systemic sclerosis [31]. IL10RB rs2834167 codes for a nonsynonymous substitution E47K and is considered to be functional, resulting in premature stop codon and transcript shortening [31].
5. Conclusions
To the best of our knowledge this is the first study to evaluate the IL10 polymorphisms combination in relationship to body fat content. Our data suggest that some genotype combination of IL10 polymorphisms favour increase body fat and thereby may lead to body mass gain. Thus, it could be more genes from IL10 family implicated in body fat content. Therefore, more research on this topic needs to be undertaken. Further genes related to overweight should be investigated, including IL10RA, which is important in inflammatory signaling and many other mechanisms related to overweight or obesity.
Author Contributions
Conceptualization, E.M., M.D.-Z. and P.C.; methodology, E.M., P.C., B.A., M.M. and O.A.; formal analysis, E.M., M.D.-Z. and A.G.; investigation, E.M., A.G., B.A., O.A. and P.C.; resources, B.A, O.A. and E.M.; data curation, E.M., M.D.-Z. and B.A.; writing—original draft preparation, E.M. and M.D.-Z.; writing—review and editing, P.C., A.M., A.B. and Ł.D.; supervision, P.C. and A.M.; project administration, E.M. All authors have read and agreed to the published version of the manuscript.
Funding
Scientific work was financed by the Ministry of Science and Higher Education in 2020/2022 as part of the Scientific School of the Academy of Physical Education in Warsaw—SN No. 5 “Biomedical determinants of physical fitness and sports training in adult population” and by grant “KOSCIUSZKO” II edition (for Ryszard Puchala, PhD) Decision No. 509/2017/DA from the Ministry of National Defense.
Institutional Review Board Statement
Procedures used for this study were conducted in accordance with the Word Medical Association’s Declaration of Helsinki, and the protocol was approved by the Ethics Committee of the Military Institute of Hygiene and Epidemiology-resolution number 07/2018, dated 23.02.2018.
Informed Consent Statement
Informed consent was obtained from all subjects involved in the study.
Data Availability Statement
The data presented in this study are available upon request from the corresponding author. The data are not publicity available due to ethical reasons.
Conflicts of Interest
The authors declare no conflict of interest.
References
- Adamczyk, J.; Brzezek-Żukowska, K.; Boguszewski, D. The influence of various fitness forms on the reduction of the adipose tissue. Balt. J. Health Phys. Act. 2011, 3, 154–160. [Google Scholar] [CrossRef][Green Version]
- Obara-Golebiowska, M.; Michalek-Kwiecien, J. Polish adaptation and validation of the Anti-Fat Attitudes Scale—AFAS. Balt. J. Health Phys. Act. 2018, 10, 121–130. [Google Scholar] [CrossRef]
- Faloia, E.; Grazia, M.; Marco, D.R.; Maria Paola, L.; Giorgio, F.; Marco, B. Inflammation as a link between obesity and metabolic syndrome. J. Nutr. Metab. 2012, 2012, 476380. [Google Scholar] [CrossRef]
- Makki, K.; Froguel, P.; Wolowczuk, I. Adipose tissue in obesity-related inflammation and insulin resistance: Cells, cytokines, and chemokines. ISRN. Inflamm. 2013, 2013, 139239. [Google Scholar] [CrossRef]
- Ouchi, N.; Parker, J.L.; Lugus, J.J.; Walsh, K. Adipokines in inflammation and metabolic disease. Nat. Rev. Immunol. 2011, 11, 85–97. [Google Scholar] [CrossRef]
- Esposito, K.; Pontillo, A.; Giugliano, F.; Giugliano, G.; Marfella, R.; Nicoletti, G.; Giugliano, D. Association of low interleukin-10 levels with the metabolic syndrome in obese women. J. Clin. Endocrinol. Metab. 2003, 88, 1055–1058. [Google Scholar] [CrossRef]
- Calcaterra, V.; De Amici, M.; Klersy, C.; Torre, C.; Brizzi, V.; Scaglia, F.; Albanesi, M.; Albertini, R.; Allais, B.; Larizza, D. Adiponectin, IL-10 and Metabolic Syndrome in Obese Children and Adolescents. Acta Biomed. 2009, 80, 117–123. [Google Scholar]
- Tam, C.S.; Garnett, S.P.; Cowell, C.T.; Heilbronn, L.K.; Lee, J.W.; Wong, M.; Baur, L.A. IL-6, IL-8 and IL-10 levels in healthy weight and overweight children. Horm. Res. Paediatr. 2010, 73, 128–134. [Google Scholar] [CrossRef]
- Azizian, M.; Mahdipour, E.; Mirhafez, S.R.; Shoeibi, S.; Nematy, M.; Esmaily, H.; Ferns, G.A.A.; Ghayour-Mobarhan, M. Cytokine profiles in overweight and obese subjects and normal weight individuals matched for age and gender. Ann. Clin. Biochem. 2016, 53, 663–668. [Google Scholar] [CrossRef]
- Manigrasso, M.R.; Ferroni, P.; Santilli, F.; Taraborelli, T.; Guagnano, M.T.; Michetti, N.; Davì, G. Association between circulating adiponectin and interleukin-10 levels in android obesity: Effects of weight loss. J. Clin. Endocrinol. Metab. 2005, 90, 5876–5879. [Google Scholar] [CrossRef]
- Goodarzi, M.O. Genetics of obesity: What genetic association studies have taught us about the biology of obesity and its complications. Lancet Diabetes Endocrinol. 2018, 6, 223–236. [Google Scholar] [CrossRef]
- Eskdale, J.; Kube, D.; Tesch, H.; Gallagher, G. Mapping of the human IL10 gene and further characterization of the 5’ flanking sequence. Immunogenetics 1997, 46, 120–128. [Google Scholar] [CrossRef] [PubMed]
- Fernández-Sánchez, A.; Madrigal-Santillán, E.; Bautista, M.; Esquivel-Soto, J.; Morales-González, Á.; Esquivel-Chirino, C.; Durante-Montiel, I.; Sánchez-Rivera, G.; Valadez-Vega, C.; Morales-González, J.A. Inflammation, oxidative stress, and obesity. Int. J. Mol. Sci. 2011, 12, 3117–3132. [Google Scholar] [CrossRef] [PubMed]
- Lichtenwalter, K.Z.; Parisien, M.; Diatchenko, L. Genetic studies of human neuropathic pain conditions: A review. Pain 2018, 159, 583–594. [Google Scholar] [CrossRef] [PubMed]
- Joffe, B.; Zimmet, P. The thrifty genotype in type 2 diabetes: An unfinished symphony moving to its finale. Endocrine 1998, 9, 139–141. [Google Scholar] [CrossRef]
- Strandberg, L.; Lorentzon, M.; Hellqvist, Å.; Nilsson, S.; Wallenius, V.; Ohlsson, C.; Jansson, J.O. Interleukin-1 system gene polymorphisms are associated with fat mass in young men. J. Clin. Endocrinol. Metab. 2006, 91, 2749–2754. [Google Scholar] [CrossRef]
- Todendi, P.F.; Klinger, E.I.; Ferreira, M.B.; Reuter, C.P.; Burgos, M.S.; Possuelo, L.G.; Valim, A.R.M. Association of IL-6 and CRP gene polymorphisms with obesity and metabolic disorders in children and adolescents. An. Acad Bras. Cienc. 2015, 87, 915–924. [Google Scholar] [CrossRef][Green Version]
- Martínez-Barquero, V.; Marco, G.D.; Martínez-Hervas, S.; Adam-Felici, V.; Pérez-Soriano, C.; Gonzalez-Albert, V.; Rojo, G.; Ascaso, J.F.; Real, J.T.; Garcia-Garcia, A.B.; et al. Are IL18RAP gene polymorphisms associated with body mass regulation? A cross-sectional study. BMJ Open 2017, 7, e017875. [Google Scholar] [CrossRef]
- Kelly, T.L.; Wilson, K.E.; Heymsfield, S.B. Dual energy X-ray absorptiometry body composition reference values from NHANES. PLoS ONE 2009, 4, e7038. [Google Scholar] [CrossRef]
- WHO. Obesity and Overweight. Available online: https://www.who.int/news-room/fact-sheets/detail/obesity-andoverweight (accessed on 20 July 2021).
- Mocellin, M.; de Azeredo Leitão, L.A.; de Araújo, P.D.; Jones, M.H.; Stein, R.T.; Pitrez, P.M.; de Souza, A.P.D.; Pinto, L.A. Association between interleukin-10 polymorphisms and CD4+ CD25+ FOXP3+ T cells in asthmatic children. J. Pediatr. 2021, 97, 546–551. [Google Scholar] [CrossRef]
- Lin, Z.; Wang, Z.; Hegarty, J.P.; Lin, T.R.; Wang, Y.; Deiling, S.; Wu, R.; Thomas, N.J.; Floros, J. Genetic association and epistatic interaction of the interleukin-10 signaling pathway in pediatric inflammatory bowel disease. World J. Gastroenterol. 2017, 23, 4897–4909. [Google Scholar] [CrossRef] [PubMed]
- Li, M.; Yue, C.; Zuo, X.; Jin, G.; Wang, G.; Guo, H.; Wu, F.; Huang, S.; Zhao, X. The effect of interleukin 10 polymorphisms on breast cancer susceptibility in Han women in Shaanxi Province. PLoS ONE 2020, 15, e0232174. [Google Scholar] [CrossRef] [PubMed]
- Lumeng, C.N.; Bodzin, J.L.; Saltiel, A.R. Obesity induces a phenotypic switch in adipose tissue macrophage polarization. J. Clin. Investig. 2007, 117, 175–184. [Google Scholar] [CrossRef] [PubMed]
- Gordon, S. Alternative activation of macrophages. Nat. Rev. Immunol. 2003, 3, 23–35. [Google Scholar] [CrossRef]
- Bronte, V.; Zanovello, P. Regulation of immune responses by L-arginine metabolism. Nat. Rev. Immunol. 2005, 5, 641–654. [Google Scholar] [CrossRef]
- Man, K.; Kallies, A.; Vasanthakumar, A. Resident and migratory adipose immune cells control systemic metabolism and thermogenesis. Cell. Mol. Immunol. 2021. [Google Scholar] [CrossRef]
- Oberbach, A.; Tönjes, A.; Klöting, N.; Fasshauser, M.; Kratzsch, J.; Busse, M.W.; Paschke, R.; Stumvoll, M.; Blüher, M. Effect of a 4 week physical training program on plasma concentrations of inflammatory markers in patients with abnormal glucose tolerance. Eur. J. Endocrinol. 2006, 154, 577–585. [Google Scholar] [CrossRef]
- Scarpelli, D.; Cardellini, M.; Andreozzi, F.; Laratta, E.; Hribal, M.L.; Marini, M.A.; Tassi, V.; Lauro, R.; Perticone, F.; Sesti, G. Variants of the interleukin-10 promoter gene are associated with obesity and insulin resistance but not type 2 diabetes in Caucasian Italian subjects. Diabetes 2006, 55, 1529–1533. [Google Scholar] [CrossRef]
- Juge-Aubry, C.E.; Somm, E.; Pernin, A.; Alizadeh, N.; Giusti, V.; Dayer, J.M.; Meier, C.A. Adipose tissue is a regulated source of interleukin-10. Cytokine 2005, 29, 270–274. [Google Scholar] [CrossRef]
- Hikami, K.; Ehara, Y.; Hasegawa, M.; Fujimoto, M.; Matsushita, M.; Oka, T.; Takehara, K.; Sato, S.; Tokunaga, K.; Tsuchiya, N. Association of IL-10 receptor 2 (IL10RB) SNP with systemic sclerosis. Biochem. Biophys. Res. Commun. 2008, 373, 403–407. [Google Scholar] [CrossRef]
- Frodsham, A.J.; Zhang, L.; Dumpis, U.; Taib, N.A.M.; Best, S.; Durham, A.; Hennig, B.J.W.; Hellier, S.; Knapp, S.; Wright, M.; et al. Class II cytokine receptor gene cluster is a major locus for hepatitis B persistence. Proc. Natl. Acad. Sci. USA 2006, 103, 9148–9153. [Google Scholar] [CrossRef] [PubMed]
- Younis, N.; Zarif, R.; Mahfouz, R. Inflammatory bowel disease: Between genetics and microbiota. Mol. Biol. Rep. 2020, 47, 3053–3063. [Google Scholar] [CrossRef] [PubMed]

Publisher’s Note: MDPI stays neutral with regard to jurisdictional claims in published maps and institutional affiliations. |
© 2022 by the authors. Licensee MDPI, Basel, Switzerland. This article is an open access article distributed under the terms and conditions of the Creative Commons Attribution (CC BY) license (https://creativecommons.org/licenses/by/4.0/).